Maybe That IPCC 95% Certainty Was Correct After All

October 14th, 2013 by Roy W. Spencer, Ph. D.

I was working up some global comparisons between the CMIP5 models (provided by the KNMI Climate Explorer via John Christy) and the HadCRUT4 surface temperatures, as well as our UAH lower tropospheric temperatures.

And I think I discovered what the IPCC meant regarding 95% certainty and global warming. I’m sure it was an honest mistake on their part.

As seen in the following graphic, over the period of the satellite record (1979-2012), both the surface and satellite observations produce linear temperature trends which are below 87 of the 90 climate models used in the comparison.
CMIP5-90-models-global-Tsfc-vs-obs
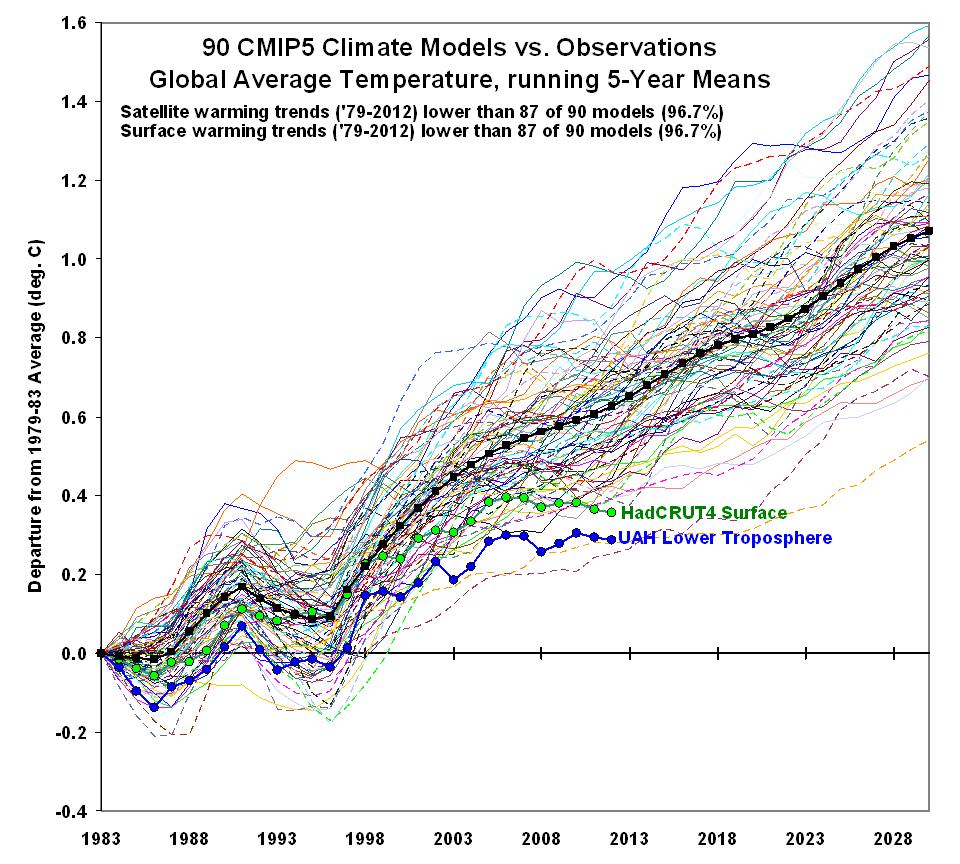
So, about 95% (actually, 96.7%) of the climate models warm faster than the observations. While they said they were 95% certain that most of the warming since the 1950s was due to human greenhouse gas emissions, what they meant to say was that they are 95% sure their climate models are warming too much.

Honest mistake. Don’t you think? Maybe?


91 Responses to “Maybe That IPCC 95% Certainty Was Correct After All”

Toggle Trackbacks

    • Bill Sparling says:

      I wish I could accept it being an “honest mistake”, however their track record for dishonesty, including attempted suppression of contradictory opinions and data, would indicate otherwise…but it could still be an “honest mistake”.

    • wayne says:

      and rotf

      Honest? IPCC? It was their insisting on altering the science to match the politically voted and approved SPM that was the torpedo under the waterline… and they themselves launched it. lol. Red October comes to mind. Watch it sink. R.I.P.

  1. Norman says:

    One thing we can all be certain of is that Dr. Roy Spencer does possess a sense of humor.

  2. Fred says:

    “Honest mistake. Don’t you think? Maybe?”

    Much like your using a fake photoshopped TIME cover in your last post?

  3. Christian says:

    The same producere every time with our skeptic. Roy, why you use a El-Nino-Start-Year? Why not a La-Nina, yes dear, when you make this, you getting much closer to CIMP5-projections with Hadcrut4. Make the same since 1985 and offset this year on 0-scale.

    Another point is, have you ever read CIMP5-Decription? Why you never have said, that solar Forcing in CIMP5-RCP-Scenarios is hold constant with 1995-2005 mean value?

    Whatever, its not my Problem, that you not interest in given neutral information to your readers

    • lemiere jacques says:

      may be but then you can conclude that it is impossible to compare data to simulation because you can translate the curve of one degree..so it is better to look at the slope…

      • lemiere jacques says:

        PR the question is..is the pause relevant or meaningful? it is a never ending story.

        another one is ..what are we looking at?
        it deals with the signification of global temperature…
        some would say in a yar it can change as much as in a century..so…is it a good parameter to look at to detect the differential radiative effect of CO2?
        i think it is not.
        Then, if we come back to a meaningful parameter such as total energy in the climate system ocean/atmosphere , then we are not even sure there is a warming..

        It is always the same story , if you want to say that global surface temperature are relevant, you must assume some sort of equiilibrium ocean/ atmosphere energy transfets , and if at the end of your caluclation you must assume that the ocean /atmosphere is not balanced to make the data fit it, you may not be wrong but no way you can say you are right.

        and we come back to the fundamental question : how come you can study a small perturbation of a system when you don’t even know how he behaves with no such pertubation?

        • alphagruis says:

          Well, idiots “can” do this and… much more.

          And a lot of opportunists among the crowd of computer geeks eagerly give them help.

          And since their “predictions” concern essentially a single mean parameter that is rather constrained to stay in a fairly narrow range their odds to be not quite wrong are not even bad.

          We live in wonderful times.

      • Christian says:

        Hi,

        You have to make compare in sense of, no Model of CIMP5 can fully redproduce a El-Nino like ^98.

        When you make compare on 1998 to now, you set down the warming-signal by starting at outliner, this make your compare sensless. The only way in my opinion is to compare on very long timescales, because than noise get down and signal is more clear.

        greets

      • Christian says:

        At lemiere jacques #2

        I have written a simple 2-Box-EBM(Energy balance Model) depend on GISSTEMP with to different responses in Forcing

        Fast-Response: 2y
        Slow-Response: 23y

        and their forced response:

        Fast-Response: 0,17K/w/m^2
        Slow-Response: 0,44K/w/m^2

        Since 1880 it reproduce the global Temperature (GISSTEMPS) good but it without noise its only the forced Response of the Forcing.

        or look here: https://fbcdn-sphotos-e-a.akamaihd.net/hphotos-ak-ash3/1234309_528445210562987_967252349_n.jpg

        I can get more accurate when i take SOI(as al Proxi for ENSO) with regression on it..

        or look here:https://fbcdn-sphotos-b-a.akamaihd.net/hphotos-ak-prn2/1383324_535325916541583_1988201412_n.jpg

        Never foreget its only a Model and Models are never can give a full correct picture! But depend on radiative Forcing and SOI i can reproduce a “standstill” since 2005 to 2011.

        greets

    • Gene says:

      Really?!?!

      So if we pick some other year, the models will replicate observations better? Personally, I would think that the difference between the models and the observational data would be smaller in this case, but one also has to ask if the model run data available for Dr Spencer to work with are limited in start dates…

      In any case, politeness would be virtuous. Can you please try?

      • ChristianJ says:

        Even when both Hadcrut4 and UAH both going down in temprerature and cooling, we still have those denialists claiming that the GCMs are, were, could be, correct, only two though.

        Even with the Sun going into reduced activity and the overal temps diving as a result. We still have those poor pathetic souls giving their last gasp, trying to justify incompetent and erroneeous models as being “almost” correct.

        Really, what does it actually take for thosee GWHyst. to finally admit and confess defeat. How far will they keep pushing this hopeless wheel barrow when the wheel has fallen off and both handles are bent out of shape and the tray rusted thru.

        Some major health issues could result from such maniacal refusal to acceept the error of their ways.

    • Shenanigans24 says:

      The start temperature was the 1979-1983 average as the graph says.

    • leon0112 says:

      Did you really mean that natural variability has an impact on the precision of the projections? Did you mean that ENSO cycles can affect temperatures? The IPCC Summary says the dominant driver of temperatures is man made CO2. Surely something as insignificant as ENSO cycles could not affect these projections. Next thing you are going to tell me is that the sun might be involved.

    • jorgekafkazar says:

      For a climate model not to suck, it should have no problem handling El Nino years. Even starting in an El Nino year, it should accurately predict the temperature for years that follow. The problem is with the GCM’s, not the selection of the starting year.

    • Jim Clarke says:

      Honestly Christian, I don’t get what you are trying to defend here. Let’s say, just for the sack of argument, your point is completely valid and the graph is started at a different year. What is the result? The models are still fundamentally incorrect. You gain nothing as far as the scientific debate is concerned. Is there really a difference between 90% too warm and 96.7% too warm? No.

      In a few more years, the models will be 100% too warm no matter which year you start to plot the comparison.

      You are like a batter arguing balls and strikes with the umpire when your team is losing 87 to 3. What’s the point?

      • Christian says:

        At Jim Clarke,

        You miss the point as a full drawn picture, you cant say, that Models are wrong, because Models depends on Future-Scenrios.

        You can claim, that Scenarios are incorrect, but for Models only, you have to wait for Hindcast on the real Forcing. The next is, the natural internal variability and this is a big very big lack in Models, they cant produce the full variability, but the variability comes down with time and its possitve, when natural Factors (Like NAO, PDO, ENSO) coming back in to warm Phase, that real warming would be stronger then models predict.

        Only look at the past, there was some timepoint where real warming was greater than models predict..

        greets

        • Jim Clarke says:

          Christian,

          You point out:

          “…when natural Factors (Like NAO, PDO, ENSO) coming back in to warm Phase, that real warming would be stronger then models predict.”

          But that is not the case if the models were calibrated to a warm phase in the natural cycle and the natural cycle was not recognized or quantified, which was precisely what was done. The next time the natural cycles enter a warm phase, the warming RATE of the atmosphere and the models will be fairly close. The actual temperatures will still be well below that of the models because the models do not have the ability to produce 20-30 year periods of no warming or even slight cooling, like the period we are currently in.

          Your statement is only accurate if the natural variability was recognized, quantified and removed from the temperature data in the calibration of the models. That did not happen.

          • Christian says:

            Hi Jim,

            Thats wrong, would Model depend on past Temperature, der past would be better to predict. GCMs do get a Forcing and run a own internal variability.

            Or look at this Commend by me: Christian says:
            October 15, 2013 at 11:31 AM

            I have used a simple form of a Energy-Balance-Model depend on Forcing. I account also SOI as a Proxi for ENSO and my Model can reproduce the “Standstill” sciene 2005 and it can explain 90%(R^2=0,9) of all varianze since 1880 to 2011.

            Its better works than all CIMP5, because why? Jes, its calibrated on messurments.

            I hope you now understand what i meant.

    • bev says:

      Remote Sensing Systems agrees with Dr Spencer:

      “The troposphere has NOT warmed as fast as almost all climate models predict.” [Emphasis in original]

  4. Christian says:

    And very interesting for all!

    “The RCPs are not forecasts or boundaries for potential emissions, land-use, or climate change. They are also not policy prescriptive in that they were chosen for scientific purposes to represent the span of the radiative forcing literature at the time of their selection and thus facilitate the mapping of a broad climate space.”

    http://tntcat.iiasa.ac.at:8787/RcpDb/dsd?Action=htmlpage&page=welcome

    I think its very clearly what this means, when you take RCP as a Forecast.

  5. Gustav Meglicki says:

    What about the 3 models, out of 90, that got it right? What’s special about them? This would be worth finding out.

    In general, I do not believe for a moment that any so called GCMs can reproduce climate variations over a longer period correctly. Their physics is incomplete, the resolution isn’t there to even account for what’s missing. They can’t do clouds, they can’t do convection, they can’t or purposely won’t do countless other factors that affect climate, like the solar UV component and the solar activity impact on cloud formation. Do they account for all known ocean currents? Do they even account for the Earth’s rotation and its interaction with the moon? Do they reproduce the Earth’s albedo correctly?

    It is a hopeless endeavor.

    Stop wasting time and money and turn to detailed observations of the Earth climate system first. Keep at it for decades. Collect data. Then, perhaps, go back to computer modeling.

    • Gene says:

      I concur. This is worthy of additional investigation.

    • gbaikie says:

      “What about the 3 models, out of 90, that got it right? What’s special about them? This would be worth finding out.”

      It appears most were wrong within a short period of time and a few models are going taking a bit longer are before they predicted it being warmer than it is.

      None were accurate. Some appear to have guessed/supposed it was cooler around 1995, of these some of them leaped wildly upwards in temperature, other had more reasonable increase in temperature which is not yet proven to be too warm. One of them [the yellow one] might still be right in next 5 years.
      I would guess this is assuming we get some of next 5 years, which are as warm as 1998 peak temperature.
      Otherwise only one will be the closest to being the most accurate in 5 years into the future.

      • GregK says:

        We’ll have to wait until 2023 – 2025 or so to see if the 3 models that “got it right ” actually did so.

        If the HadCRUT and UAH trends continue then those models will have overestimated warming as well.

  6. Ned Nikolov says:

    Good point, Roy! IPCC can now be excused … 🙂

    The more we laugh at stupidity such as one manifested by IPCC the sooner we would overcome the dismal state in many areas of current science and climate science in particular.

  7. Christian says:

    The compare on such timescales is a grilled chicken.

    CIMP5 runs future under conditions and none forced respones or stoachatical Variability can bring misleadings. Also Forcings are not the same that we really have.

    Is it so hard to understand, that CIMP5 and RCPs are not forecast, in the fact, its a item for research.

    There is only on option to get clear that CIMP5-Models are fail, in the Hindcast, thats the point were models have get the real Forcings.

    Its a crude discuss on climate, because most people have never understand that Model-temperature cant be the same that we really have.

  8. Steven Mosher says:

    Hi Roy,

    whats the Y axis? departure from 1979-83 normal?

    also, off topic, do you have spatial datasets for your measurements in K, like RSS provides, or only Anomaly

  9. Bob Tisdale says:

    Roy writes, “…what they meant to say was that they are 95% sure their climate models are warming too much.”

    Nice. I enjoyed that.

    Regards

  10. steve says:

    Too many unjustified assumptions are being made by ipcc it seems. Old computer science saying of garbage in, garbage out sums up these models.

    though to me intuitively I would think strong positive feedback from warming due to more humidity leading to greenhouse effect of water vapor. Cloud albedo seems to me too weak to counteract. This is what makes this subject so interesting.

  11. Bri says:

    I was spelunking with the Girl Scouts this week end and the guide told us the temperature in the cave was a constant 54 deg. This is part of the speech you get on any cave tour but we were more attentive because we were crawling through 54 degree water up to our elbows.

    It occurred to me that the measurements of surface temperature and the satellite data have to go through several algorithms to get to some kind of average and the cave water was already the average for that location. The heat island and any other factors are all irrelevant for the ground water as long as you don’t go so deep that you get geothermal heating.

    These temperatures are well known and if the was a sufficiently long record you should be able to measure long term trends with little interpretation. The ground water respond very slowly to changes in surface temperature but the changes should be the same ratio as the surface over time.

    ßri

    • wayne says:

      Read http://www.rmets.org/sites/default/files/qjcallender38.pdf carefully, and the comments of the Society members and you just may get an idea why underground water hasn’t measurably changed over long periods, like since the 1930’s, really little has changed at all, even the temperatures, ended right back in 1998 right at the late 30’s level.

      In the 30’s you will hear exactly the same words, story-line and justifications used today, didn’t keep going up then, chances won’t keep going up this time around.

  12. KuhnKat says:

    “While they said they were 95% certain that most of the warming since the 1950s was due to human greenhouse gas emissions, what they meant to say was that they are 95% sure their climate models are warming too much.”

    Let me fix that:

    While they said they were 95% certain that most of the warming since the 1950s was due to human greenhouse gas emissions, what they meant to say was that they are 95% sure their Anthropogenicly emitted climate models are warming too much.

  13. Jack says:

    Roy, you can’t compare the real surface temperature WITH natural variations to a climate model WITHOUT natural variations… that’s ridiculous!

    The IPCC and climate models can’t be expected to predict the el-nino/la-nina cycle or sun cycle, or volcanic eruption in the future.

    Any moron here that says climate models are wrong just because they can’t predict such natural cycles simply doesn’t understand what climate models are predicting. Climate models predict long term climate trends not natural cycles, natural cycles average out over time leaving the climate signal.

    • Surfer Dave says:

      Any moron who thinks computers can do mathematics precisely is just wrong because the imprecise representations of numbers eventually causes large errors after millions of calculations. There are techniques to manage these mathematical errors, but I’ve not seen any of the models handling the errors at all. Additionally, the use of various pseudo random numbers to “simulate” random processes like cloud formation and cloud cover means the same model will produce significantly different results on different combinations of hardware and operating system software.
      No, the whole idea of simulating an inherently complex system such as an entire planet shows an incredible degree of moronic thinking. There are no models of the planet that produce anything useful at all.
      I have looked at the source code of a couple of the models and as an experienced software engineer with over 40 years experience I would be embarrassed to be associated with such amateur attempts at building complex software systems.
      The simulations can not be trusted at all and doing so illustrates a massive naivety as to what computers can and can’t do.

      • bev says:

        “…massive naivety…”

        Forty years ago, there was a universal assumption that computer econometric models knew everything worth knowing about the economy; twenty years ago, there was a universal assumption that a man with a fast computer could beat the stock market; ten years ago there was a universal assumption that the Central Banks of the world were tracking risks with sophisticated computers….

        We, of a certain age, in Finance are not naive…scarred perhaps…

      • alphagruis says:

        Well said and may I add that it illustrates more generally a massive naivety as to what homo sapiens sapiens can and can’t do.

      • Jack says:

        You’re confusing the prediction of deterministic trajectories with ensemble averages. Computer simulations can’t be used to calculate the trajectory of a system for very long, due to the errors you mention and of course due to the fact … oh wait for it … let see could it be the fact that atoms don’t behave deterministicly but there is this theory called quantum mechanics! It was only invented going on a hundred years or ago, why don’t you read up on it.

        On the other hand computers are very good at ensemble averages, molecular dynamics, quantum monte carlo and other model simulations has shown themselves accurate time and time again.

    • Jim Clarke says:

      Well, Jack…there’s the rub. The climate models have been calibrated using historical temperatures, without recognizing the existence of natural climate cycles. The assumption of the IPCC (which ironically doubles as the conclusion of the IPCC) is that all the warming of the late 20th Century was caused by humans, and that natural variability had no significant role in the warming. From that, they calibrate the ‘sensitivity’ the atmosphere has to increasing CO2.

      If you acknowledge the existence of natural variability to make excuses for the model inaccuracy, then you must acknowledge the existence of natural variability when calibrating the atmosphere’s sensitivity to CO2. If you do that, the sensitivity is halved and increasing CO2 is no longer a threat, but likely a blessing to the biosphere.

      It’s a catch-22 for the crisis folks.

  14. Manfred says:

    Billions of dollars and decades later the answer arrived, “42.”
    Most, by this time had forgotten the question.
    This of course required a new committee and even greater expense.

    Acknowledgement: Douglas Adams

  15. Neil Hampshire says:

    Roy,
    The actual wording claims

    95 percent certainty that humans are the “dominant cause” behind global warming since the 1950s

    This changed from the draft reports which defined “dominant force” as “more than half”

    The 2007 report only claimed 90% certainty for “MOST” of the warming being anthropogenic.

    Is “more than half” the same as “most”?

    • wayne says:

      No, “most” > “any other”.

      Given “dominant force” > “HALF” and “MOST” > “any other” then “any other” <= “HALF” by definition unless “dominate force” is singular. Still have you eye on the pea? Good.

      Ok, so the probability that 95% of “dominant force” being >= 90% of “HALF” depends of course on the quanity of “the others”. Now wait, does anyone know where “the others” were defined? Darn, it’s late and now I seemed to have lost the pea.

      Let’s just say it sure seems on the surface that 95% of “greater than half” is greater than 90% of “MOST” if there are an adequate number of “others”. Well, it made sense to the IPCC committee. Trust them.

      `8*) 🙄

  16. There is a model from the Max Planck Institute calling MiKlip which puts out a huge decreasing temperaure in the North Atlantic until 2020.

    It fits with my discovery of 2010 that solar tides are phase coherent to the global temperatures beside the passive impedances of the ocean oscillations and the gaps from the volcano effects

    http://www.volker-doormann.org/images/miklip_solar_tides.jpg

    s.a.: http://notrickszone.com/2013/10/13/explosive-max-planck-institute-initial-forecast-shows-0-5c-cooling-of-north-atlantic-sst-by-2016/

    V.

  17. Chris Schoneveld says:

    Roy,

    3 out of 90 models happen to generate numbers that are more or less in line with observations. Is this pure coincidence or are these models based on more realistic assumptions as to feedbacks and other parameters?

  18. Slipstick says:

    Regarding this analysis, I must point out that the use of the 5-year running average, while in line with the models, buries 2010, the hottest year in the record, rendering the conclusion specious. Of course, the next El Niño will erase that effect; perhaps you could revisit this question using the same methodology after that event.

  19. ren says:

    This week in the north-central United will be heavy. Blackout stratosphere.
    http://www.cpc.ncep.noaa.gov/products/stratosphere/strat_a_f/gif_files/gfs_t30_nh_f00.gif

  20. Rhys Jaggar says:

    Whilst I agree with your conclusion on the generality of models, perhaps in the internet age of ‘selecting out the appropriate population of interest’, you should highlight the subset of models which lie just to each side of the actually recorded data.

    Whether those models have future predictive value is of course another story, but at least it might be worth investigating what it is that the models that do predict data retrospectively are saying.

    If, after all, they used models which mimicked real phenomena, then maybe they could also predict the future??

    I leave it to your greater knowledge, insight and judgement to determine whether it is worth discussing my amateur postulates……..

  21. Peter says:

    The persuasive power of this sort of chart is badly undermined by the possibility that you have purposely selected climate models that look silly. If the selection of climate models is arguably unbiased, that claim must be presented along with the chart; otherwise, it just looks like cherry-picking. Is the viewer supposed to know that CIMP5 somehow means “we didn’t do any cherry-picking?”

  22. Peter says:

    Why is the 17-year warming “hiatus” not visible in either of the two measured-temperature curves?

  23. Noblesse Oblige says:

    LOL.

    One wonders what physics is in the 3 model runs that track the observational record.

    This reminds me of an old baseball story. The short form of the story goes as follows. A major league baseball scout goes to see a rumored fabulous minor league pitcher perform. In the game the ace hurler strikes out all 27 men. In fact only one guy manages even a couple of foul balls. After the game, the manager comes up to the scout and asks him, “Well what do you think of our pitcher?” The scout replies, “He was OK but I want to speak to the guy who got the foul balls.”

  24. Simon Wells says:

    John Christy has plotted the average for the 5 year period 1979-1983 and called it “1983”.

    Not it’s not John. The 5 year running mean centered on 1983 is the mean of 1981-1985, not 1979-1983.

    John Christy’s mistake shifts observations two years into the future and therefore exaggerates the model/observations difference. Here’s the actual 5 year running mean with the years aligned correctly.
    http://i39.tinypic.com/wt9hzo.jpg

    Roy do you think John Christy made an Honest Mistake there?

    • John K says:

      Assuming your graphic correction proves accurate, the models still overstate the warming enormously. The correction makes little difference. Simon do you honestly think the modelers believe their own projections bear any relation to reality?

    • bev says:

      As I referenced above

      Remote Sensing Systems agrees with Dr Spencer:

      “The lower troposphere has NOT warmed as fast as almost all climate models predict.” [Emphasis in original].

      Dr Spencer is not the only apostate you have to slay.

  25. Gunga Din says:

    Awhile ago I was watching The History Channel. The episode was on trains. A segment dealt with designing “cowcatchers” for modern diesels.
    They design it on autocad. Run it through simulations. It seems OK then they build a prototype and actually go crash the thing to see if it works as they thought it would. If it doesn’t then it’s back to drawing on keyboard. They don’t invest more into building what didn’t work.
    The Climate Models haven’t worked. Time to go back to the keyboard and stop investing in what failed.

  26. Stephen Richards says:

    I can’t believe these comments. For crying out loud you fools, this is Roy’s sense of humour, you know, a joke, funny ha ha.

  27. T Montag says:

    Back on December 28, 2009, Real Climate ran a piece titled “Updates to model-data comparisons”. It had a chart that showed HadCRUT3 and an IPCC ensemble moving in concert.

    Can someone explain the discrepancy between their chart and Dr. Spencer’s?

  28. KR says:

    As has been pointed out elsewhere, the five year baseline Dr. Spencer uses (1979-1983) represents the third largest negative offset of the data in the entire satellite record, and the largest in the early part of the data. In other words, it shifts the temperature record down relative to the more usual 20 or 30 year baselines – and does so to the maximum possible in that starting interval. Also, the models do _not_ all start in unison in 1983 – they are initialized to varying starting conditions and run through observed and projected time frames, meaning that the starting point (and hence the envelope) for the models is far broader as shown here.

    I would consider this graph misleading.

    • T Montag says:

      I’m confused. According to Roy’s graph, HadCrut and the 5 year running mean are the same in 1998. Then they continuously diverge to the present. It seems like most of the individual models diverge in a similar fashion. Why?

      • KR says:

        Here’s a more apples-to-apples comparison: HadCRUT4 (blue), UAH baselined 1980-1999 (red), and UAH baselined to the 1979-1983 extrema (green).

        The five-year means _don’t_ meet in Dr. Spencer’s graph in 1998, in fact the large peak in UAH (satellite records having higher variability wrt ENSO) is well _below_ the smaller peak in HadCRUT4 – again, an issue with the baselines.

        • slimething says:

          @ KR
          I would consider your chart games more than “misleading”. I realize it is painful to acknowledge that has been no statistically significant warming for well over 20 years in several temperature products, but you can’t fool everyone with your junk math.

          Hans Von Storch agrees with Roy Spencer and any statistician worth his salt (that doesn’t include Tamino and John Cook) knows it ain’t warming like IPCC predicted.

          http://hockeyschtick.blogspot.com/2013/08/new-paper-finds-climate-models-cannot.html

          ….In recent years, the increase in near-surface global annual mean temperatures has emerged as considerably smaller than many had expected. We investigate whether this can be explained by contemporary climate change scenarios. In contrast to earlier analyses for a ten-year period that indicated consistency between models and observations at the 5% confidence level, we find that the continued warming stagnation over fifteen years, from 1998 -2012, is no longer consistent with model projections even at the 2% confidence level.

          • KR says:

            @ slimething

            Note that Von Storch’s paper was, by his own account, not accepted for publication.

            And if you look at the “15 year trend” discussed by Von Storch against the whole of the UAH data, you see that while that recent (and statistically insignificantly short) trend is low, it has by no means dropped below the 1979-present trend as far as the (cherry-picked) 1998 El Nino drove temperatures above that trend.

            WRT statistical significance, please understand that it isn’t a one-sided tool. For any of the instrumental series, over any time span ending in the present:

            * There is no period where warming is invalidated, against a null hypothesis of no warming. None.
            * Against a null hypothesis of the long term warming trend, there is no period where a “no warming” hypothesis is validated. None.
            * Over any period with enough data to show statistical significance, that data shows a statistically significant warming trend. Always.

  29. ren says:

    Another cyclone up from Japan bring significant snowfall in the northern and central United States.
    http://theweathercentre.blogspot.com/2013/10/2013-2014-winter-update-midwest-and.html

  30. Dr. Strangelove says:

    Roy,
    No honest climate scientist can claim 95% certainty. We all know the climate system is chaotic. Take it from Ed Lorenz, meteorologist and father of chaos theory.

    http://eaps4.mit.edu/research/Lorenz/Chaos_spontaneous_greenhouse_1991.pdf

    “we might not be able to reject the null hypothesis, that is, we might have to say that any change in the climate, including a change brought about by the greenhouse effect, has yet to cross the threshold of detectability.”

    “we can ask whether anything as unusual as the difference between the observed sample means would be likely to have occurred, if the new null hypothesis is correct. Again, there is a good chance that we might lack sufficient evidence for rejecting the new hypothesis.”

    This is similar to my position that the null hypothesis of natural internal variability still holds.

    • bev says:

      It is also misleading the way everybody (on all sides) uses the word “trend” to refer to the 0.15 C per decade between
      1979 and 2013.

      “Trend” is just a RUBBISH BIN, into which goes:

      True secular trend (if any);

      Effect of true cycles longer than period of
      data (either up or down) (if any);

      True step-changes (if any);

      Effect of true trends which have now stopped (if any);

      Cumulative drift effects from short-term noise, i.e.
      drunk’s walk (size unknown).

      Good luck to anybody who thinks he can partition the 0.15 C per decade between all these!

      • ren says:

        This is probably the best summary. The most vital parameters to track changes in the sun and the sun as an energy source. Without this, no model will not work. They already knew about it in antiquity.

        • bev says:

          I started writing that comment just to make a little point. But when extra items for the list kept coming to me, I thought:

          “Wow! Making sense of this slight up-tendency really IS hard!”

          I happened to look today at an old copy of Huntington’s
          “Climate and Civilization”; and this reminded me how “idee
          fixes” come and go. In his time “pulsatile climate” explanations (Man not so important as Nature)were the new thing, and all the rage. Now it’s “one-way hockeysticks” explanations (Nature not so important as Man).

  31. bev says:

    Ren says:

    “They already knew about it in antiquity.”

    “Bart, the key to holding Springfield is Main Street!
    The Romans knew it, The Carthaginians knew it.
    Now, you know it!”

  32. bev says:

    “They already knew about it in antiquity.”

    The following extract was originally posted by someone else.

    It is from (I confirmed this) an article in 1979 by John Eddy, Senior Scientist at the High Altitude Observatory, National Center for Atmospheric Research, Boulder, Colorado.

    “The Maunder Minimum, once it was clearly identified in both
    historical records and the tree-ring carbon-14, was the Rosetta Stone that enabled scientists to read the much longer record of solar history found in the wood of long-lived trees like the bristle-cone pine. In the long tree-ring carbon-14 record, which presently reaches more than 8,000 years into the past, one can see the marks of REPEATED solar excursions like the Maunder Minimum. Each of these prolonged lows in solar activity corresponds to a similar period of anomalous COLD on Earth, as derived from records of mid-latitude glacier advance, as best these are known. The correlation seems to confirm the more-than-chance connection between the Maunder Minimum and the COLD excursion of the Litle Ice Age.”

    [My emphases]

    Brrr!

  33. Rafael Molina Navas, Madrid says:

    http://upload.wikimedia.org/wikipedia/commons/3/3c/Evidence_CO2.jpg

    http://news.bbcimg.co.uk/media/images/70019000/gif/_70019040_1_temp_624.gif

    With such a similarity between these curve ends, showing CO2 maxima in both rate of increase and values over last 400,000 years, and rate of increase and mean temperatures over last 12,000 years, it is utterly absurd to think it could be a coincidence of two independent events.
    And our burning of fossil fuels produces CO2 (or somebody denies even this?).
    For me, not 95% certainty in our responsability, but perhaps 99,5% …

    • Fonzie says:

      Rafael, ice cores are false… Read about it : Jaworowski “co2: the greatest scientific scandal of our time”

      • Rafael Molina Navas, Madrid says:

        Why should I trust Mr Jaworowsky and not the thousands of scientist that, as in AR5, have “very high confidence” in data from ice cores?
        By the way, H. Oeschger (Physics Institute of the University of Bern), stated that: “…Some of (Jaworowski’s) statements are drastically wrong from the physical point of view” …

  34. Rafael Molina Navas, Madrid says:

    Could this post:

    “slimething says:
    October 22, 2013 at 10:59 PM
    Maybe you can explain why 90% of glacier melt around the world occurred before 1960”

    a reply not to mine dated Oct. 20 -perhaps to KR dated Oct. 24?

    It has nothing to do with what I was talking about!

  35. Mark says:

    I would be interested to see the actuals prior to 79.

  36. چاقی says:

    Thank you, Ive recently been searching for information about this subject for ages and yours is the greatest I have discovered so far. But, what about the conclusion? Are you sure about the source?

  37. Fantastic website. Plenty of useful info here. I am sending it to some friends are also sharing in delicious. And naturally, thanks to your effort!

  38. The Petite Malle series, which was re-interpreted on the big show, is also endowed with a retro classic literary temperament. The portraits and architectural elements full of retro temperament show a looming luster under the exquisite visual art of Fornasetti and the exquisite modern design of designer Nicolas Ghesquire. Sense, coupled with the classic Petite Malle small box shape, makes people even want to put it on the shelf for storage. Original Women louis Vuitton Sale|Authentic Women louis Vuitton Sale|Cheap Louis Vuitton Handbags Factory Outlet Online Sales (Cheap authentic Original Women louis Vuitton Sale|Authentic Women louis Vuitton Sale|Cheap Louis Vuitton Handbags Factory Outlet Online Sales sale online store ,LV) Original Women louis Vuitton Sale|Authentic Women louis Vuitton Sale|Cheap Louis Vuitton Handbags Factory Outlet Online Sales this season in the 2021 spring and summer vacation fashion bags, the vacation department is designed with relaxed and casual, rich colors, and active patterns. This season’s classic logo logo, different shapes of bags are very cute, playing cards stitching design is very innovative, the pattern of the flowers is very eye-catching, in addition to the classic Cheap authentic Original Women louis Vuitton Sale|Authentic Women louis Vuitton Sale|Cheap Louis Vuitton Handbags Factory Outlet Online Sales sale online store ,LV exclusive color, there is also a clean white color that must be found in the vacation series. White and black frame, colorful pattern logo, new lock design, large bag appearance is simple and elegant, mainly practical tote bag, with a full leather appearance with Original Women louis Vuitton Sale|Authentic Women louis Vuitton Sale|Cheap Louis Vuitton Handbags Factory Outlet Online Sales’s iconic lock shape, there are also The color-blocking bag type with canvas and crocodile leather pattern is a must-have item for office or daily collocation. Original Women louis Vuitton Sale|Authentic Women louis Vuitton Sale|Cheap Louis Vuitton Handbags Factory Outlet Online Sales has released a new fashion collection in Paris. Its really hard to accept a big-name change like Original Women louis Vuitton Sale|Authentic Women louis Vuitton Sale|Cheap Louis Vuitton Handbags Factory Outlet Online Sales when you see those clothes with complicated flowers.

Leave a Reply