UAH V5.6 Global Temperature Update for September, 2013: +0.37 deg. C

October 3rd, 2013 by Roy W. Spencer, Ph. D.

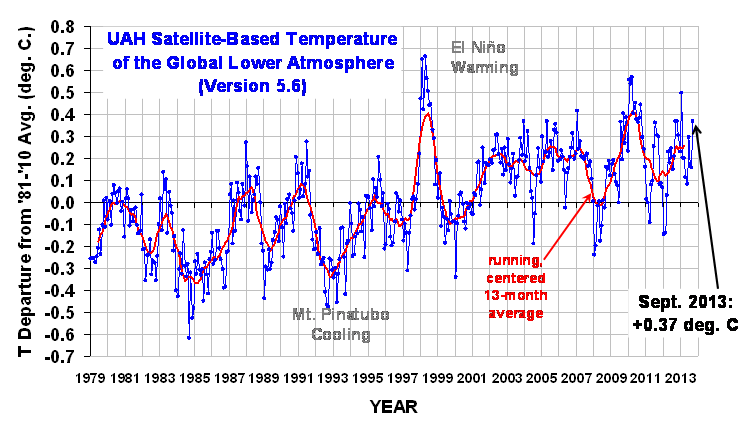
The Version 5.6 global average lower tropospheric temperature (LT) anomaly for September, 2013 is +0.37 deg. C (click for larger version):
UAH_LT_1979_thru_September_2013_v5.6

The global, hemispheric, and tropical LT anomalies from the 30-year (1981-2010) average for the last 21 months are:

YR MON GLOBAL NH SH TROPICS
2012 1 -0.145 -0.088 -0.203 -0.245
2012 2 -0.140 -0.016 -0.263 -0.326
2012 3 +0.033 +0.064 +0.002 -0.238
2012 4 +0.230 +0.346 +0.114 -0.251
2012 5 +0.178 +0.338 +0.018 -0.102
2012 6 +0.244 +0.378 +0.111 -0.016
2012 7 +0.149 +0.263 +0.035 +0.146
2012 8 +0.210 +0.195 +0.225 +0.069
2012 9 +0.369 +0.376 +0.361 +0.174
2012 10 +0.367 +0.326 +0.409 +0.155
2012 11 +0.305 +0.319 +0.292 +0.209
2012 12 +0.229 +0.153 +0.305 +0.199
2013 1 +0.496 +0.512 +0.481 +0.387
2013 2 +0.203 +0.372 +0.033 +0.195
2013 3 +0.200 +0.333 +0.067 +0.243
2013 4 +0.114 +0.128 +0.101 +0.165
2013 5 +0.083 +0.180 -0.015 +0.112
2013 6 +0.295 +0.335 +0.255 +0.220
2013 7 +0.173 +0.134 +0.212 +0.074
2013 8 +0.158 +0.111 +0.206 +0.009
2013 9 +0.367 +0.342 +0.392 +0.192

The Effect of Convective Oscillations On Tropospheric Temperature
I sometimes get asked why the tropospheric temperature variations are so large on a month-to-month basis. As I have mentioned before, these are usually due to natural oscillations in convective heat transfer from the ocean surface to the atmosphere. Just how large are these variations? The global average rate of energy transfer by moist convection (precipitation systems) has been estimated to be around 100 Watts per sq. meter. Since satellite (SSM/I) measurements of global oceanic rainfall have a monthly standard deviation of 3%, this equates to ~3 W/m2 monthly variations in convective heating of the troposphere. A quick calculation using the heat capacity of air will show that 3 W/m2 of more (or less) heating will raise (or lower) the tropospheric temperature by about 0.2 deg. C (assuming no other energy exchanges are affected). This is indeed the approximate size of the month-to-month variations in tropospheric temperature that we observe.

Note: In the previous version (v5.5, still provided to NOAA due to contract with NCDC) the temps are slightly cooler, probably due to the uncorrected diurnal drift of NOAA-18. Recall that in v5.6, we include METOP-A and NOAA-19, and since June 2013 they are the only two satellites in the v5.6 dataset, whereas v5.5 does not include METOP-A and NOAA-19.

Popular monthly data files:

uahncdc_lt_5.6.txt (Lower Troposphere)
uahncdc_mt_5.6.txt (Mid-Troposphere)
uahncdc_ls_5.6.txt (Lower Stratosphere)


21 Responses to “UAH V5.6 Global Temperature Update for September, 2013: +0.37 deg. C”

Toggle Trackbacks

  1. Dr. Doom says:

    Aqua ch. 6 temps has been running immensly high for the last week or two. I’m surprised we did not beat last year’s sept.

  2. Phillip Bratby says:

    Note typo, the units are metres, not meters.

  3. The limbo continues. Time will tell.

    • Stan says:

      Time will tell.

      Time has told. 20th century temperatures can’t be explained without manmade greenhouse gases.

      A couple of recent years doesn’t change that conclusion.

  4. Thanks, Dr. Spencer.
    I have updated your graph in my pages.

  5. Peter Norman says:

    Thanks Roy. I always look forward to your monthly up-date and have a gut feeling there’s more accuracy here than I see elsewhere. As a retired “nuts and bolts” engineer, I still “worry” (as other do, it seems)about the variability of the reading each month. The Earth is a big lump with a fat shell of atmosphere and its average surface temperature (in reality) probably doesn’t vary much month by month. From a metrology point of view: Do you have a feel for (or distribution estimate of)the measurement error statistic of the systems we are relying on here?

    • Stan says:

      Re: more accuracy here than elsewhere

      And the UAH/RSS divergence of recent years?

      • Kristian says:

        I would like to remind Dr. Spencer once again how little it takes to square the two main satellite datasets from 1978/79 till today, to set the record straight between them so to say. You first raise the UAH timeseries by 0.06C between 1992 and late 2005, and then you raise the RSS timeseries by 0.03C from late 2005 on. And voilą, discrepancy basically gone! No longer will UAH be the global dataset outlier in showing a marked warming trend from 2001/02. And the RSS will straighten out a trend that as of late has seemed just a little bit too cool.

          • gordie says:

            And those discrepancies were trivial in the first place.
            Exaggerating them was merely part of the attempt to
            pooh-pooh the whole idea of satellite measurement.
            I say thank God we have them, and thank God there
            are several rival institutions analysing them.
            That is the only way to keep the process clean.

            No genuine trend can go un-noticed now. Explaining
            them – that is a different matter. If you remember,
            there was a computer set-to-work in “The Hitchhiker’s
            Guide to the Galaxy” to find “the answer to everything”.
            Immediately there was a delegation from the Amalgamated
            Union of Philosophers and Religious Nuts who protested
            that this would put them all out of their jobs. The
            computer itself sagely points out that it is going to
            take seven million years to calculate the answer;
            and in the meantime they can continue arguing about
            what the answer WILL BE. Of course we all know the
            answer. It is “42”. And when the descendants of the
            original philosophers stammer “But what question is
            it the answer to?” the computer answers “Tricky!
            I am not powerful enough to work THAT out”

          • Stan says:

            These discrepencies were certainly not trivial.

            They have by now grown to a difference of order 0.12 C/decade for the 15-year trend.

            Is EITHER metric correct? We simply do not know. Satellite measurements of the lower troposphere are no longer a reliable metric of LT temperatures.

        • Stan says:

          And voilą, discrepancy basically gone!

          And what is the scientific justification for such willy nilly adjustments??

          • Cupsui says:

            none…

            basically he is saying if we manipulate data sets in certain ways we can get the results we want. wow! someone give this guy a Nobel prize!

            I love just coming to this website to see what the crazies can come up with each month. What new theory can they make to put off believing that human greenhouse gas emissions actually influence the climate.

            “please give me another excuse not to allow myself to believe year 11&12 chemistry that was discovered literally centuries ago”

            light and energy interact with molecules people! we are witnessing heat waves, melting ice caps, increased flooding and draughts caused by our actions…time to do something about it!

  6. Susie says:

    The Bureau of Meteorology in Australia is claiming that September 2013 was our warmest September on record. I’m just wondering if your satellite data agrees with this.

    • Stan says:

      Are they going by surface temperatures, or the average temperature of the lower troposphere?

      There is a big difference.

      • Susie says:

        They’re going by surface temperatures. That’s why I was wondering if the satellite data would tell the same story or not.

  7. torontoann says:

    “…satellite data agrees…”

    If you are asking whether the satellite data-base
    has data specific to the Australian continent, I have
    no idea.

    If you are asking whether a small area like Australia
    (7.7 million sq km) can show some sort of temperature
    record in a data series while the whole globe (510.1 million sq km) in a similar data series doesn’t – or vice versa – then the answer is, generally, yes.

    If you are asking whether the phrase “warmest September”
    has any definite physical meaning, then the answer is no.

    • Stan says:

      If you are asking whether the satellite data-base
      has data specific to the Australian continent, I have
      no idea.

      In recent months UAH has indeed started to calculate LT temperatures for Australia. See their Web page.

      • torontoann says:

        Thank you. I will look at that.

        The RSS web-site has good pictures of “anomalies”.
        It shows Australia glowing red-hot during August,
        while the whole of the continents of Africa and
        South America are a chilly blue.

        I quote from the RSS web-site, concerning the usefulness
        of satellite data:

        “All microwave sounding instruments were developed
        for day to day operational use in weather forecasting
        and thus are typically not calibrated to the precision
        needed for climate sudies. A climate quality data set
        can be extracted from their measurements only by careful
        intercalibration of the data from the MSU, AMSU and
        ATMS instruments.”

        In such circumstances, to carp about differences between
        different teams might be regarded as disrespectful of sincere people, doing a good job with limited resources.

        Of course, the quote also invites the question:

        “Why HAVEN’T better instruments been sent up?”

        It might have been sensible to spend a few tens of
        millions of dollars taking a really good look at temperatures, BEFORE trying to spook seven billion
        people into changing their behaviour.*

        *Apart from saying, “Stop breeding, you silly rabbits!”
        I have been telling people that for sixty years now, and nobody seems to have paid attention. Indeed, 98% of people presently in the world have come here, after me, without so much as a ‘by your leave’.

  8. Thank you, Ive recently been searching for information about this subject for ages and yours is the greatest I have discovered so far. But, what about the conclusion? Are you sure about the source?

Leave a Reply