UAH v5.6 Global Temperature Update for October, 2013: +0.29 deg. C

November 12th, 2013 by Roy W. Spencer, Ph. D.

We finally received the missing NOAA-19 and Metop2 AMSU data from NESDIS, resulting from the government shutdown, covering the first half of October. For some reason we got all of the NOAA-15 and NOAA-18 data, but the other two satellite feeds were stopped.

So, the numbers below supersede the UAH October temperature press release, which was sent out by accident. (The global anomaly map for October was approximately correct, though, because it was based upon the 2 satellites which had complete data coverage for the month).

The Version 5.6 global average lower tropospheric temperature (LT) anomaly for October, 2013 is +0.29 deg. C (click for larger version):
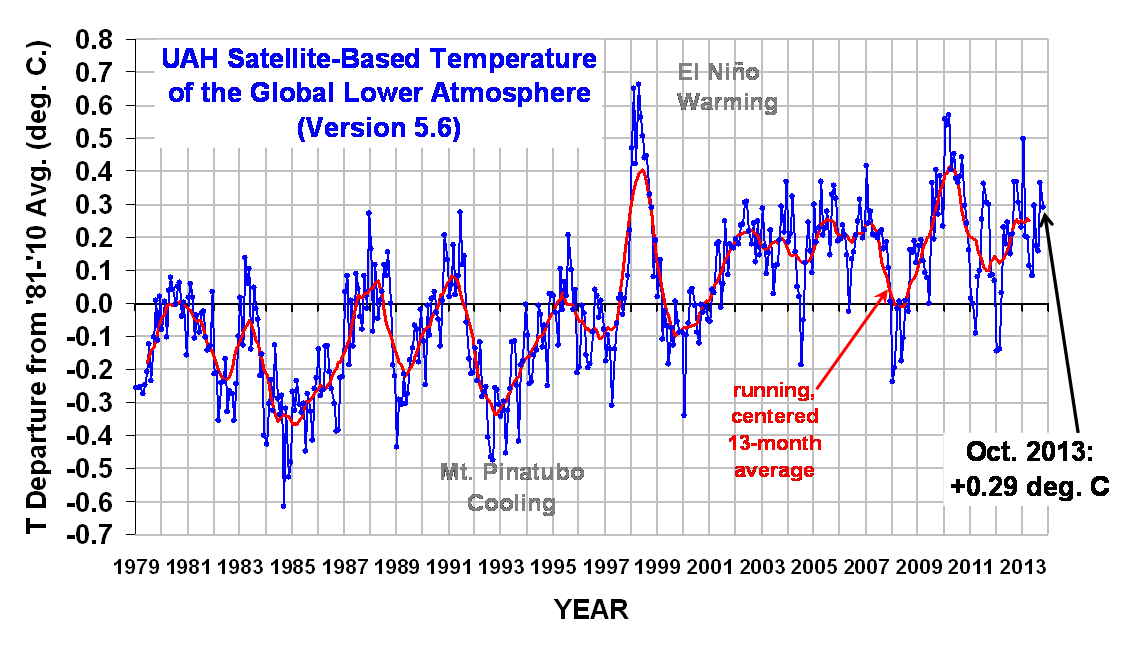
UAH_LT_1979_thru_October_2013_v5.6

The global, hemispheric, and tropical LT anomalies from the 30-year (1981-2010) average for the last 10 months are:

YR MON GLOBAL NH SH TROPICS
2013 01 +0.496 +0.512 +0.481 +0.387
2013 02 +0.203 +0.372 +0.033 +0.195
2013 03 +0.200 +0.333 +0.067 +0.243
2013 04 +0.114 +0.128 +0.101 +0.165
2013 05 +0.082 +0.180 -0.015 +0.112
2013 06 +0.295 +0.335 +0.255 +0.220
2013 07 +0.173 +0.134 +0.211 +0.074
2013 08 +0.158 +0.111 +0.206 +0.009
2013 09 +0.365 +0.339 +0.390 +0.189
2013 10 +0.290 +0.329 +0.250 +0.032

Popular monthly data files:

uahncdc_lt_5.6.txt (Lower Troposphere)
uahncdc_mt_5.6.txt (Mid-Troposphere)
uahncdc_ls_5.6.txt (Lower Stratosphere)


66 Responses to “UAH v5.6 Global Temperature Update for October, 2013: +0.29 deg. C”

Toggle Trackbacks

  1. davey says:

    Another “nothing doing” month – to add to the previous
    few hundred.

    “+0.29 C”. It was “+0.28 C” in December 1987.

    Such a difference, for a quarter of a century!

    • Drew says:

      Seriously? THAT is your argument?

      • davey says:

        “that is your argument?”

        No, it is an observation of a fact.

        The argument is that the UAH global series is statistically indistinguishable from a random walk (with a certain amount of auto-correlation) with reflecting barriers and mean-reversion.

        One second of computer time using the bootstrap spits out that conclusion.

        • buhui says:

          “a random walk”

          It might be that, of course. And a random walk should be the null hypothesis. A time series returning to an earlier number after a long excursion is consistent with such a conservative view. The “return to home” does tend to negate any tentative earlier conclusion that a genuine secular drift was being manifested.

          • Craig Thomas says:

            And yet…virtually every month since 2000 has been above the mean, while the vast majority of months prior to 1997 were below it. How does a random walk give you that?

          • buhui says:

            Craig Thomas asks how random walks produce lengthy excursions in one direction or another. The simple answer is: that’s precisely what random walks tend to do – especially if there is auto-correlation in the process. Any further questions should be answered by doing Monte Carlo testing for oneself, on the data series provided by UAH and also by Remote Sensing Systems and HADCRUT.

          • Marcel Kincaid says:

            “The “return to home” does tend to negate any tentative earlier conclusion that a genuine secular drift was being manifested.”

            It does no such thing, it just means that you’re comparing peaks to troughs. The overall trendline tells the story.

  2. davey says:

    Correction. It was “+0.27 C” in December 1987. The rate of global warming just doubled.

  3. Thanks, Dr. Spencer.
    Excellent graphic, it now up in ARVAL’s climate and weather pages.
    We are still keeping in this pause. Nature will do as it does.

  4. Nigel Harris says:

    Davey:

    That +0.27 in December 1987 was the highest figure for any month in the 1980s. In the 1990s, it was exceeded 11 times, almost all of them in the super El Nino year of 1998. In the 2000s, it was exceeded 18 times. In the 2010s, it has been exceeded in 20 out of a total of 46 months so far. So nowadays, nearly half of all months are warmer than the hottest of all months in the 1980s. Such a difference, and in only a quarter of a century!

    • davey says:

      You sound just like my old stockbroker – explaining that I really made money even though I didn’t.

      • buhui says:

        The data LOOKS like

        “no trend from 1979 to 1997”

        “a step-up of +0.3 C resulting from the +1.0 C El Nino
        excursion of 1998 (hysteresis effect)

        “no trend from 1999 to present”.

        With such natural variability, it is completely impossible to definitely distinguish between trends and step changes.

      • Cupsui says:

        Davey you sound like someone trying to comment on a topic that they have no idea about and have a specific agenda on the outcome…

        to explain it clearer, an partial, uninformed opinion!

        stick a line of best fit through all of this data and see what it looks like. It doesn’t take a genius to see that the trend is increasing.

        But of course accepting that we are affecting the planet we live in is the thing people will not do as that would put blame on themselves and imply a lifestyle change. Nobody wants to do that because they value themselves over others to come…humans are selfish creatures. THE SAD SAD TRUTH

        from a cyclist, vegetarian, environmental chemistry scientific researcher, living in the inner part of a large north American city. Small steps people!!

        • Fonzie says:

          Does that mean we MUST accept the premise that “we are affecting the planet we live in” ?

        • joxi says:

          Dear Cupsui:

          Last year the USA burned forty million tons of coal LESS than the year before. China burned sixty-seven million MORE. So, do go there (walking of course) and preach to THEM. But bear in mind what they traditionally do to enthusiastic missionaries.

          • joxi says:

            “…walking…”

            or cycling.

            If you are a real person and not a sophomoric joke.

          • Cupsui says:

            Ah I get it…so science is only useful when it tells us what we want and gives us gadgets to appease our deficient attention spans.

            It becomes useless when it spells out blatantly that we are affecting the planet we live in. It becomes a study full of agenda pushers and heretics…hmmm this is beginning to sound oh so familiar…

            the earth is round people and its is made up of an atmosphere that contains certain constituents (CO2, H20 (vapour), CH4, SF6 etc.) that absorb low energy low wavelength radiation emitted from the earth.

            These trap heat. Its a natural process and if the earth didn’t have it then it would be -18°C. Thus if we put more of these gases into the atmosphere by perturbing their natural cycles (digging up and burning fossil fuels) we trap more heat…

            Spectrophotometry…one of the greatest discoveries in chemistry. This can demonstrate this phenom no problems. I just demonstrated this last week to the first year chemists at my university.

            I don’t doubt that changes in solar radiation over time effect the heat we get, but I also know adding large amounts of heat trapping gases will alter the Earth’s climate and not for the better of the vast majority its current occupants.

            its easy to believe things that we want to hear, learning and understanding things that are harder to hear are what differentiates a closed minded person from an open minded person

          • Cupsui says:

            so point the finger while we in the west continue to enjoy per capita emissions some 3-4x greater than in China?

            No we ALL need to take action. That same finger pointing is the problem at all climate conferences. Real action and real leadership is needed not just green washing and excuse.

            China needs to do something, Australia, Canada, USA, Europe, Africa, Asia, Sth America…the world needs to do something otherwise we are going to leave a mess for our kids and our kids kids,

            But can you do it? can you sacrifice something in your life to consume less? or will you just say it would make a difference and be like everybody else?

            it really is an inconvenient truth isn’t it!

        • davey says:

          “…you sound like…”

          Immediate ad hominem.

          Will ignore you.

          • davey says:

            I googled him/her/it and so far as I can make out he is some sort of computer virus out of Canada.

            There IS a “cupsui” who offers his room to transients in Canada. I think I will stick to the more established establishments when visiting there.

        • Fonzie says:

          I still want to know… just because human beings won’t accept their guilt, does that mean humans are guilty?

          • davey says:

            Only in the Kafkaesque world of “the criminal justice system”.
            A truly innocent man who cannot lie can never get parole, because he has to grovel and admit his guilt first.

        • Fonzie says:

          LOL !!!

        • Fonzie says:

          L.O.L. !!!

    • mike maguire says:

      “That +0.27 in December 1987 was the highest figure for any month in the 1980s. In the 1990s, it was exceeded 11 times, almost all of them in the super El Nino year of 1998. In the 2000s, it was exceeded 18 times. In the 2010s, it has been exceeded in 20 out of a total of 46 months so far. So nowadays, nearly half of all months are warmer than the hottest of all months in the 1980s. Such a difference, and in only a quarter of a century!”

      Since there is agreement from all sources that the first 2 of those decades featured warming, and the most recent decade featured either less warming or no warming(depending on your view) then of course this would have to be true.

      What if we went back to the prior 30 years(3 decades), when there was modest cooling? An observer in the mid 70’s, looking back 3 decades as you have, could say something similar……..but in the opposite direction.

      Of course we are warmer now. We can all agree on that and maybe CO2 is partially responsible………but what was more powerful than CO2 for the prior 3 decades?

      What natural cycle was stronger than CO2’s warming in the 50’s-70’s, then likely enhanced it for 3 decades after that……. which also coincided with the period of satellite measurements of global temperature in the lower troposphere?

      http://www.google.com/imgres?imgurl=http://ffden-2.phys.uaf.edu/645fall2003_web.dir/Jason_Amundson/pdo_latest.jpg&imgrefurl=http://ffden-2.phys.uaf.edu/645fall2003_web.dir/Jason_Amundson/pdoindex.htm&h=259&w=550&sz=96&tbnid=RTwYgnQQoxmLtM:&tbnh=90&tbnw=191&zoom=1&usg=__b49AGh5bd2MKpyiVEO833K06VwQ=&docid=RaOxFddoxhnkxM&hl=en&sa=X&ei=wcqCUuigBsT6kQeJ94HwDQ&sqi=2&ved=0CEwQ9QEwBQ

      If one believed in this natural cycle, they could have predicted the warming to stall within the last decade and now, headed into the next 2 decades, some modest cooling is possible again.

      I agree with all the relationships of numbers to each other in the last 3 decades that you stated. Do you agree with my assessment/prediction if this ~30 year natural cycle(PDO) repeats?
      Look no farther than the PDO.

      • mike maguire says:

        “Look no farther than the PDO”

        I wish to retract the phrasing of that last sentence. There may be over a dozen other things to consider besides the PDO, some that will probably surprise us.

        • buhui says:

          maquire says:

          “What if we went back three decades [further than 1979]…”

          What if we go back nearly a Century.

          “The Arctic Ocean is warming up, icebergs are growing scarcer and in some places the seals are finding the water too hot. Reports all point to a radical change in climate conditions and hitherto unheard of temperatures in the Arctic Zone.
          Expeditions report that scarcely any ice has been met with as far North as 81 degrees 29 minutes. Great masses of ice have been replaced by moraines of earth and stone, while at many points well known glaciers have entirely disappeared.”

          US Weather Bureau, 1922

          as quoted by Professor R. Lindzen of MIT in testimony before Congress on November 17th 2010.

          • davey says:

            In Switzerland, some dozen periods have been identified, in the Holocene, when the glaciers retreated above the present levels. The phenomenon is known as the recurrent “greening of the Alps”.

        • Ling Tsung says:

          @Mike Maguire,

          Do a little reading about sulfate aerosols.
          They were for a few decades a growing contributor
          to cooling until cleaner cars and factories reduced them
          considerably.

  5. Sun’s current level of activity to high for the following to take place, but I think will happen if minimal solar conditions return as presented in this post.

    SOLAR CLIMATE MECHANISMS AND CLIMATE PREDICTION

    MECHANISM ONE

    .

    One solar climate mechanism/connection theory which has much merit in my opinion, is as follows:

    A BRIEF OVERVIEW. At times of low solar irradiance the amounts of sea ice in the Nordic Sea increase, this ice is then driven south due to the atmospheric circulation (also due to weak solar conditions) creating a more northerly air flow in this area.(-NAO) This sea ice then melts in the Sub Polar Atlantic , releasing fresh water into the sub- polar Atlantic waters, which in turn impedes the formation of NADW, which slows down the thermohaline circulation causing warm air not to be brought up from the lower latitudes as far north as previous while in lessening amounts.

    This perhaps can be one of the contributing solar/climate connection factors which brought about previous abrupt N.H. cool downs during the past.

    This makes much sense to me.

    NAO= NORTH ATLANTIC OSCILLATION
    NADW= NORTH ATLANTIC DEEP WATER

    To elaborate on the above, when the sun enters a prolonged solar minimum condition an overall reduction takes place in solar spectral irradiance, namely in UV light (wavelengths less then 400 nm). The shorter the wavelength , the MUCH greater the reduction.

    UV light reduction likely will cause ocean heat content and ocean surface temperatures to drop, due to the fact that UV light in the range of 280 nm-400nm penetrates the ocean surface to depths of 50-100 meters. A reduction in UV (ultra violet) light then should have a profound effect on the amount of energy entering the ocean surface waters from the sun extending down to 50-100 meters in depth, resulting in cooler ocean temperatures.

    This ties into what was said in the above in that if ocean waters in high latitudes such as the Nordic Sea , were to be subject to cooling the result would be much more sea ice which could impede the strength of the thermohaline circulation promoting substantial N.H. cooling.

    Adding to this theory is fairly strong evidence that a decrease in UV light will result in a more meridional atmospheric circulation (which should cause more clouds, precipitation and snow cover for the N.H.),due to changes in ozone distribution in a vertical/horizontal sense which would cause the temperature contrast between the polar areas of the stratosphere and lower latitude areas of the stratosphere to lesson, during prolonged solar minimum periods. Ultra Violet light being likely the most significant solar factor affecting ozone concentrations ,although not the only solar factor.

    This could then set up a more -NAO ,(high pressure over Greenland) which would promote a more Northerly flow of air over the Nordic Sea, bringing the sea ice there further South.

    MECHANISM TWO

    A reduction of the solar wind during a prolonged solar minimum event would cause more galactic cosmic rays to enter the earth’s atmosphere which would promote more aerosol formation thus more cloud nucleation. The result more clouds higher albedo, cooler temperatures.

    Compounding this would be a weaker geo magnetic field which would allow more galactic cosmic ray penetration into the atmosphere , while perhaps causing excursions of the geo magnetic poles to occur in that they would be in more southern latitudes concentrating incoming galactic cosmic rays in these southern latitudes where more moisture would be available for the cosmic rays to work with, making for greater efficiency in the creation of clouds.

    MECHANISM THREE

    MILANKOVITCH CYCLES overall favor N.H. cooling and an increase in snow cover over N.H high latitudes during the N.H summers due to the fact that perihelion occurs during the N.H. winter(highly favorable for increase summer snow cover), obliquity is 23.44 degrees which is at least neutral for an increase in summer N.H. snow cover, while eccentricity of the earth’s orbit is currently at 0.0167 which is still elliptical enough to favor reduced summertime solar insolation in the N.H. and thus promote more snow cover.

    In addition the present geographical arrangements of the oceans versus continents is very favorable for glaciation.

    MECHANISM FOUR

    High latitude major volcanic eruptions correlate to prolonged solar minimum periods which translates to stratospheric warming due to an increase in SO2 particles while promoting more lower troposphere cooling.

    One theory of many behind the solar/volcanic connection is that MUONS,a by product of galactic cosmic rays can affect the calderas of certain

    volcanoes by changing the chemical composition of the matter within the silica rich magma creating aerosols which increase pressure in the

    magma chamber and hence lead to an explosive eruption.

    Muon densities increase more in higher latitudes at times of weak solar magnetic activity, which is why volcanic activity in the higher latitudes will be affected more by this process.

    These four mechanisms make a strong case for a solar /climate connection in my opinion, and if the prolonged solar minimum meets the criteria I have mentioned going forward and the duration is long enough I expect global cooling to be quite substantial going forward.

    THE CRITERIA

    Solar Flux avg. sub 90

    Solar Wind avg. sub 350 km/sec

    AP index avg. sub 5.0

    Cosmic ray counts north of 6500 counts per minute

    Total Solar Irradiance off .015% or more

    EUV light average 0-105 nm sub 100 units(or off 100% or more) and longer UV light emissions around 300 nm off by several percent.

    IMF around 4.0 nt or lower.

    The above solar parameter averages following several years of sub solar activity in general which commenced in year 2005..

    IF , these average solar parameters are the rule going forward for the remainder of this decade expect global average temperatures to fall by -.5C, with the largest global temperature declines occurring over the high latitudes of N.H. land areas.

    The decline in temperatures should begin to take place within six months after the ending of the maximum of solar cycle 24.

    NOTE 1- What mainstream science is missing in my opinion is two fold, in that solar variability is greater than thought , and that the

    climate system of the earth is more sensitive to that solar variability.

    NOTE 2- LATEST RESEARCH SUGGEST THE FOLLOWING:

    A. Ozone concentrations in the lower and middle stratosphere are in phase with the solar cycle, while in anti phase with the solar cycle in

    the upper stratosphere.

    B. Certain bands of UV light are more important to ozone production then others.

    C. UV light bands are in phase with the solar cycle with much more variability, in contrast to visible light and near infrared (NIR)

    bands which are in anti phase with the solar cycle with much LESS variability.

  6. If the prolonged minimum solar conditions come back as expected, we will know how much or little solar has on the climate.

  7. buhui says:

    When one runs a statistical computer program with the facility of fitting adaptable, time-varying, regression coefficients, on the entire global data series since 1979; one finds that the PRESENT trend is indeed estimated to be positive – amounting to four ten-thousandths of a Degree C per month. Of course, the natural variability is three hundred times greater than this “trend” component!

  8. davey says:

    buhui says:

    “…the natural variability is three hundred times greater than this “trend” component!”

    It is a good thing that my college major was Shang dynasty burnt-bone divination (with a minor in liver-sheen prophecy). I am open to offers from anybody who wants to know the will of the Gods.

  9. gordon says:

    “…the will of the Gods.”

    I thought that had already been announced by some folks in East Anglia. We are supposed to have some sort of a curved wooden implement inserted up our…

  10. dave says:

    October….well, lets see “whatts happening” in four months. This should be an interesting winter with predictions of a coming ice age.

  11. kay says:

    Re this “hot atmosphere”: I am trying to get it into perspective. If all inputs of heat to the atmosphere were abruptly stopped, how long would take for this temperature
    excess of +0.29 C to go away?

  12. buhui says:

    “How long for excess temperature to go away?”

    With your specific thought-experiment assumptions, and with back-of-the-envelope figuring – 26 minutes.

    Because:

    the atmosphere has a mass of about 5.3 x 10^21 grammes and
    a specific heat of 1 Joule per Degree C per gram. Hence
    a drop of 0.29 C involves a loss of heat of

    1.55 x 10^20 Joules.

    The atmosphere radiates heat to outer space at a rate of

    10^17 watts (i.e. 10^17 Joules per second)

    The first number divided by the second gives 1,550 seconds
    i.e. 26 minutes (EOE).

    Of course the atmosphere is not in thermal equilibrium so this does not mean that each tiny volume would cool down this amount in exactly this time – but the general picture holds, I think.

    • buhui says:

      Whoops! 260 minutes! Dropped a power of ten there!

      • nigel says:

        Of course, the lower atmosphere is exchanging radiation with
        the surface, with a net input to the air from this process of 26 PetaWatts – but I see you have taken the query to really mean “how long for the Earth as a whole to shed the extra heat represented by +0.29 C in the air”.

        The surface of the Earth sends 52 PetaWatts* of heat (5.2 x 10^16 J/sec)to the atmosphere by conduction and latent heat of evaporation and condensation processes. Small random fluctuations in this large flow and in the Albedo are entirely sufficient to cause the spatial and temporal changes which the satellites have shown since 1979. However my suspicion is, also, that there WAS a step-change of +0.3 C in the late 1990’s, related to the El Nino hiccup. Such step-changes themselves are probably random in direction. Time (another twenty years) will tell.

        *twice as much as by net radiation.

        • bev says:

          “Time will tell (another twenty years)”

          I haven’t got that long.

          I will distract myself by looking at something more exciting than this painfully dull data series.

    • Craig Thomas says:

      Now *that*’s inconvenient.

    • Fonzie says:

      I wonder how hard these guys would be looking for corrections to a data set that shows too much warming…

      • nigel says:

        “…how hard these guys would be looking for corrections to a data set that shows too much warming…”

        “Any fule kno the answer to that”, as my namesake used to say sixty years ago.

        • nigel says:

          If this bit of complicated work* is correct, eventually there will be a (small)uptick in the satellite figures**, as the little bit of hidden*** heat spreads itself a bit more, to where it can be noticed. Just another reason for “wait and see” before coming to any conclusions.

          *novel applications of complicated methods usually disappoint.

          **probably undetectable as a separate item, though.

          ***it only does it to annoy.

          • Hops says:

            I believe Kriging interpolation, which is what was applied, is used in the Wide Area Augmentation System the FAA put in place to improve GPS navigation. It’s not all that new.

          • nigel says:

            I did not say it was new, I said it was a novel application.
            As a private pilot, I am well aware of the Wide Area Augmentation System in North America. But that is deliberate engineering; which is a little different from investigating messy data. “Kriging” is totally dependent on certain assumptions about the data. If you are PRODUCING the data, you can ensure that the assumptions are met.

            I fly mainly in Europe where we are developing Galileo, which leapfrogs in accuracy the American systems (we hope, anyway!) The free public system is supposed to be accurate to one
            meter, and the encrypted commercial system to one centimeter.

          • Hops says:

            Nigel,

            Actually, much the data WAAS is concerned with are natural phenomena, including the effects of signal propagation delays in the ionosphere and troposphere, which vary with solar radiation and air pressure respectively.

            Kriging has historically been applied to geostatistical models to predict distribution of ore etc.

            You can already get to the centimeter level with GPS if you subscribe to correction services like OmniSTAR. And the next generation of GPS will be similar to Galileo and even compatible in many ways (by design).

            Cheers

      • Cupsui says:

        don’t worry people that want to make a name for themselves such as our Dr Spencer here will certainly find them and get even more coverage for doing so

  13. JohnKl says:

    Roy,

    In a previous post HOPS linked to a real climate post which states:

    “Now Kevin Cowtan (University of York) and Robert Way (University of Ottawa) have developed a new method to fill the data gaps using satellite data.
    It sounds obvious and simple, but it’s not. Firstly, the satellites cannot measure the near-surface temperatures but only those overhead at a certain altitude range in the troposphere. And secondly, there are a few question marks about the long-term stability of these measurements (temporal drift.”

    What lower troposphere altitude range does the MSU satellite data you provide cover? Thanks for any help/assistance with this matter.

    Have a great day!

  14. labrat says:

    “…fill the data gaps…”

    Such a basis for policy!

  15. davey says:

    You interpolate so that your estimation procedure is not distorted by missing data. There is never any possibility of finding information beyond the data you actually have.

    The visual system of the brain uses interpolation all the time. But this only proves the point. Actually, you are not seeing the detail you think you are seeing!

  16. labrat says:

    “…you are not seeing the detail you think you are seeing…”

    Which is the reason the evidence of eye-witnesses to fleeting events is often wildly wrong. Lawyers know that, judges know that, juries – unfortuantely – do not know that. It is, of course, an example of confirmation bias.

  17. labrat says:

    “unfortuantely”, “unfortunately”

    When I read my draft, I did not notice the mistake. That is exactly a case of seeing what you expect to see!

  18. torontoann says:

    When looking at the detailed figures on the UAH site, I notice that for the region S20 to S65 a “land anomalies” of +0.94 and a “sea anomalies” of +0.24 has been combined into an anomaly for the whole region of +0.39. This seems to be an areal weight of 0.8 for the sea and 0.2 for the land. This would be appropriate for the WHOLE of the Southern hemisphere but is quite wrong for this actual region – which is mostly water. The land here amounts to 14.67 million sq. km. and the Ocean to 129.37 million sq. km. If the idea is to allow properly for area, then Australia is skewing your figures.

    Proper weights (the accurately known figures for land and sea) applied to your detailed figures for all three areas of the Globe (Northern Extension, Tropic, Southern Extension) give a Global* figure for October of +0.25 C, not +0.29 C.

    Personally, I do not care at all about the difference – but it seems a good idea to point out unnecessary sources of error. I wait to be shown wrong.

    *the 90% of the Globe’s surface that lies between 65N and 65S

  19. torontoann says:

    And:

    September is reduced from +0.37 C to +0.31 C.

    August is reduced from +0.16 C to +0.12 C.

  20. torontoann says:

    Actual areas in millions of sq km:

    Northern Extension Land 69.03
    Ocean 75.03

    Tropics Land 41.13
    Ocean 132.60

    Southern Extension Land 14.67
    Sea 129.37

  21. torontoann says:

    “Sea” … “Ocean”

  22. nigel says:

    I think torontoann has made a cogent point about the construction of these Global numbers.

    Applying her weights to the data on the UAH website:

    Oct 2013 is reduced from +0.29 to +0.21

    Sep 2013 is reduced from +0.37 to +0.31

    Aug 2013 is reduced from +0.16 to +0.12

    Jul 2013 is nochange from +0.17 to +0.17

    Jun 2013 is reduced from +0.30 to +0.29

    May 2013 is reduced from +0.08 to +0.07

    Apr 2013 is reduced from +0.11 to +0.08

    Mar 2013 is reduced from +0.20 to +0.19

    Feb 2013 is reduced from +0.21 to +0.20

    Jan 2013 is reduced from +0.50 to +0.47

    Dec 2012 is reduced from +0.24 to +0.21

    Nov 2012 is reduced from +0.31 to +0.26

    Oct 2012 is reduced from +0.37 to +0.36

    Sep 2012 is reduced from +0.37 to +0.35

    Aug 2012 is reduced from +0.21 to +0.19

    Jul 2012 is increased from +0.15 to +0.17

    Jun 2012 is reduced from +0.25 to +0.23

    May 2012 is reduced from +0.18 to +0.14.

    These are not earth-shattering changes, but, to my eye at least, they do change the look of the chart in the last 18 months, by taking away some of the recent drift above the average.

  23. nigel says:

    October 2013

    reduced to +0.25 C

  24. I truly enjoy looking through on this internet site, it holds superb posts.

  25. I truly enjoy looking through on this internet site, it holds superb posts.

  26. Excellent article. Very interesting to read. I really love to read such a nice article. Thanks! keep rocking.

Leave a Reply