UAH v5.6 Global Temperature Update for Nov. 2013: +0.19 deg. C

December 3rd, 2013 by Roy W. Spencer, Ph. D.

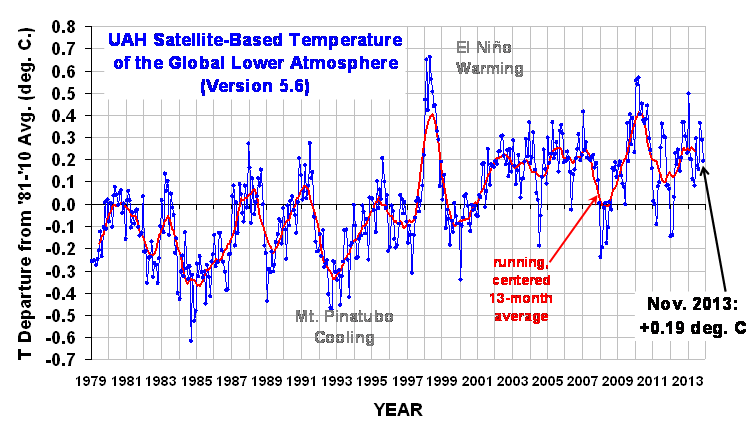
The Version 5.6 global average lower tropospheric temperature (LT) anomaly for November, 2013 is +0.19 deg. C, down from +0.29 deg. C in October (click for full size version):
UAH_LT_1979_thru_November_2013_v5.6

The global, hemispheric, and tropical LT anomalies from the 30-year (1981-2010) average for the last 11 months are:

YR MON GLOBAL NH SH TROPICS
2013 01 +0.496 +0.512 +0.481 +0.387
2013 02 +0.203 +0.372 +0.033 +0.195
2013 03 +0.200 +0.333 +0.067 +0.243
2013 04 +0.114 +0.128 +0.101 +0.165
2013 05 +0.082 +0.180 -0.015 +0.112
2013 06 +0.295 +0.335 +0.255 +0.220
2013 07 +0.173 +0.134 +0.211 +0.074
2013 08 +0.158 +0.111 +0.206 +0.009
2013 09 +0.365 +0.339 +0.390 +0.189
2013 10 +0.290 +0.331 +0.250 +0.031
2013 11 +0.193 +0.159 +0.227 +0.018

Popular monthly data files (these might take a few extra days to update):

uahncdc_lt_5.6.txt (Lower Troposphere)
uahncdc_mt_5.6.txt (Mid-Troposphere)
uahncdc_ls_5.6.txt (Lower Stratosphere)


66 Responses to “UAH v5.6 Global Temperature Update for Nov. 2013: +0.19 deg. C”

Toggle Trackbacks

  1. Phillip Bratby says:

    Looks like more heat has gone walk-about.

  2. Thanks, Dr. Spencer. I have updated your graphic in my pages.

  3. Yes, Phillip. This northern winter and southern summer is starting after two months of a cooling anomaly.
    The UAH anomaly for November, 2012 was +0.28 deg. C.

  4. Peter says:

    Nothing to do with UAH temperatures. Just expressing my surprise at seeing adds for books on Climate Change Denial on this website – i.e. how to debunk the myths of climate change deniers. While I know you are not a “denier” the people who promote these books tend to lump all those who diverge from the IPCC line as deniers.

  5. torontoann says:

    “…adds [sic] for books…”

    I have not noticed any, but then I do not look at everything on this site. Are you sure it isn’t a case of your own browser directing the ads to you, on the basis of its “big-brother” surveillance of your interests?

  6. David Richardson says:

    torontoann is probably right. My browser Dolphin on my phone is showing me an advert for sales video ” is this the end of Britain?” Given the current state of what passes for an energy policy in the UK, it maybe but is obviously not Dr. Spencer who is aiming that at me.

    Thanks Dr. Spencer for all your efforts.

  7. Lewis says:

    Dr. Spencer and all,

    It would be interesting to see what would happen if you used the most recent 30 average which would include 2013. Just looking at the graph, it seems the 30 year average would move up a bit and the anomalies would be smaller. It also seems that if you used the most recent 10 years, the more recent anomalies might be negative.

    Don’t misunderstand me. I think to be accurate the time scale needs to be a bit longer to draw conclusions – something along the lines of 1000 years, something commensurate with the actual entity we’re supposedly measuring instead of something whose relevance has to do with the lifespan of a single homosapiens and his ability to measure.

    But that might put me in the class of D’s (don’t say that word)

    Anyway – Merry Christmas or whatever other winter solstice celebratory parties and words suit you best.

  8. RW says:

    Thanks for the update.

  9. Salvatore Del Prete says:

    November 29, 2013 at 12:33 PM

    SOLAR CLIMATE MECHANISMS AND CLIMATE PREDICTION

    MECHANISM ONE

    One solar climate mechanism/connection theory which has much merit in my opinion, is as follows:

    A BRIEF OVERVIEW. At times of low solar irradiance the amounts of sea ice in the Nordic Sea increase, this ice is then driven south due to the atmospheric circulation (also due to weak solar conditions) creating a more northerly air flow in this area.(-NAO) This sea ice then melts in the Sub Polar Atlantic,releasing fresh water into the sub- polar Atlantic waters, which in turn impedes the formation of NADW, which slows down the thermohaline circulation causing warm air not to be brought up from the lower latitudes as far north as previous while in lessening amounts.

    This perhaps can be one of the contributing solar/climate connection factors which brought about previous abrupt N.H. cool downs during the past.

    This makes much sense to me.

    NAO= NORTH ATLANTIC OSCILLATION
    NADW= NORTH ATLANTIC DEEP WATER

    To elaborate on the above, when the sun enters a prolonged solar minimum condition an overall reduction takes place in solar spectral irradiance, namely in UV light (wavelengths less then 400 nm). The shorter the wavelength,the MUCH greater the reduction.

    UV light reduction likely will cause ocean heat content and ocean surface temperatures to drop, due to the fact that UV light in the range of 280 nm-400nm penetrates the ocean surface to depths of 50-100 meters. A reduction in UV (ultra violet) light then should have a profound effect on the amount of energy entering the ocean surface waters from the sun extending down to 50-100 meters in depth, resulting in cooler ocean temperatures.

    This ties into what was said in the above in that if ocean waters in high latitudes such as the Nordic Sea, were to be subject to cooling the result would be much more sea ice which could impede the strength of the thermohaline circulation promoting substantial N.H. cooling.

    Adding to this theory is fairly strong evidence that a decrease in UV light will result in a more meridional atmospheric circulation (which should cause more clouds, precipitation and snow cover for the N.H.), due to changes in ozone distribution in a vertical/horizontal sense which would cause the temperature contrast between the polar areas of the stratosphere and lower latitude areas of the stratosphere to lesson, during prolonged solar minimum periods. Ultra Violet light being likely the most significant solar factor affecting ozone concentrations ,although not the only solar factor.

    This could then set up a more -NAO, (high pressure over Greenland) which would promote a more Northerly flow of air over the Nordic Sea, bringing the sea ice there further South.

    MECHANISM TWO

    A reduction of the solar wind during a prolonged solar minimum event would cause more galactic cosmic rays to enter the earth’s atmosphere which would promote more aerosol formation thus more cloud nucleation. The result more clouds higher albedo, cooler temperatures.

    Compounding this would be a weaker geo magnetic field which would allow more galactic cosmic ray penetration into the atmosphere , while perhaps causing excursions of the geo magnetic poles to occur in that they would be in more southern latitudes concentrating incoming galactic cosmic rays in these southern latitudes where more moisture would be available for the cosmic rays to work with, making for greater efficiency in the creation of clouds.

    MECHANISM THREE

    MILANKOVITCH CYCLES overall favor N.H. cooling and an increase in snow cover over N.H high latitudes during the N.H summers due to the fact that perihelion occurs during the N.H. winter (highly favorable for increase summer snow cover), obliquity is 23.44 degrees which is at least neutral for an increase summer N.H. snow cover, while eccentricity of the earth’s orbit is currently at 0.0167 which is still elliptical enough to favor reduced summertime solar insolation in the N.H. and thus promote more snow cover.

    In addition the present geographical arrangements of the oceans versus continents is very favorable for glaciation.

    MECHANISM FOUR

    High latitude major volcanic eruptions correlate to prolonged solar minimum periods which translates to stratospheric warming due to an increase in SO2 particles while promoting more lower troposphere cooling.

    One theory of many behind the solar/volcanic connection is that MUONS, a by product of galactic cosmic rays can affect the calderas of certain volcanoes by changing the chemical composition of the matter within the silica rich magma creating aerosols which increase pressure in the magma chamber and hence lead to an explosive eruption.

    Muon densities increase more in higher latitudes at times of weak solar magnetic activity, which is why volcanic activity in the higher latitudes will be affected more by this process.

    These four mechanisms make a strong case for a solar /climate connection in my opinion, and if the prolonged solar minimum meets the criteria I have mentioned going forward and the duration is long enough I expect global cooling to be quite substantial going forward.

    THE CRITERIA

    Solar Flux avg. sub 90

    Solar Wind avg. sub 350 km/sec

    AP index avg. sub 5.0

    Cosmic ray counts north of 6500 counts per minute

    Total Solar Irradiance off .015% or more

    EUV light average 0-105 nm sub 100 units (or off 100% or more) and longer UV light emissions around 300 nm off by several percent.

    IMF around 4.0 nt or lower.

    The above solar parameter averages following several years of sub solar activity in general which commenced in year 2005..

    IF, these average solar parameters are the rule going forward for the remainder of this decade expect global average temperatures to fall by -.5C, with the largest global temperature declines occurring over the high latitudes of N.H. land areas.

    The decline in temperatures should begin to take place within six months after the ending of the maximum of solar cycle 24.

    NOTE 1- What mainstream science is missing in my opinion is two fold, in that solar variability is greater than thought, and that the climate system of the earth is more sensitive to that solar variability.

    NOTE 2- LATEST RESEARCH SUGGEST THE FOLLOWING:

    A. Ozone concentrations in the lower and middle stratosphere are in phase with the solar cycle, while in anti phase with the solar cycle in the upper stratosphere.

    B. Certain bands of UV light are more important to ozone production then others.

    C. UV light bands are in phase with the solar cycle with much more variability, in contrast to visible light and near infrared (NIR) bands which are in anti phase with the solar cycle with much LESS variability.

    RECENT SOLAR AVERAGES DURING THIS WEAK MAXIMUM FO SOLAR CYCLE 24

    SOLAR FLUX NORTH OF 130 LAST TWO MONTHS

    EUV LIGHT 105NM WAVELENGTH FOR NOV -149.5

    AP INDEX- 5.7

    COSMIC RAY COUNT PER MINUTE THROUGH NOV 07- 6268.4

    SOLAR WIND NORTH OF 350 KM/SEC

    Despite the rather HIGH solar readings in contrast to what I am looking for, global temperatures are still stalled at best. Once the solar parameter readings start to trend toward the readings I call for in the above article I submitted, the temperature trend for the globe should start to trend down.

    I expect all of this to start to take place within 6 months of the end of solar maximum 24. The maximum of solar cycle 24 should be ending within a year.

    • Aaron s. says:

      Question, if CME are concentrated during solar maximum and reduced during minimum, then do you think they play a significant role in earths climate to sun relationship? I’m curious if they may increase the insulating cloud types

    • sky says:

      Your theory rests on the supposition that the formation of NAWD has an effect upon the advection of tropical air poleward. But the former is purely a gravity-driven matter of seawater density, while the latter is almost entirely wind-driven. It’s only in “climate science” that the mistake of conflating the two very distinct mechanisms is made under the rubric of “thermohaline circulation.”

  10. Gordon Robertson says:

    Roy…I have always wondered what will happen if the rest of the NOAA satellites pack it in. Do you think they will just quietly forget about them?

    It seems NOAA ia bending over backwards to accommodate the IPCC world view on global warming while ignoring their own satellites. That world view involves the IPCC admitting no warming trend the past 15 years while claiming their confidence level has risen 5% that humans are causing the (lack of) warming.

    • Roy Spencer says:

      It would be difficult to ignore the satellite microwave sounders…there are currently at least 5 of them operational. If there was only 1, you might argue it can’t be trusted.

  11. AGW THEORY FALLING APART.

    I am encouraged by the climate response of late which is going against what AGW theory is calling for.

    From global sea ice now well above normal,to global temperatures not increasing,to a limited hurricane season, as verified by the ACE INDEX, to ocean heat content increases leveling off.

    All this despite moderate solar activity for the past two years,despite limited volcanic activity,despite CO2 still increasing,despite the absence of a strong La Nina,despite a positive AO of late (probably due to the increase in UV light of late, which will drop off once the maximum of solar cycle 24 passes by,despite AMO in the midst of it’s warm phase.

    This tells me global warming will soon meet the same fate as did the global cooling craze of the 1970’s.

    However, this time unlike the 1970’s there is reason to believe global cooling will indeed take place.

    • Roy Spencer says:

      That’s a bold prediction, Salvatore. And I would love for it to be correct. I’m still siding with weak warming in the coming years. But nature is full of surprises.

      • Stuart L says:

        Dr Roy. can I ask you about something you said about clouds, that is uprising air causes clouds meaning somewhere else there will downward air without clouds.
        But my experience at sea with thunderclouds does not confirm that, usually we get wind that is flowing towards the thunderhead (uprising) often by this time it is already overcast, as you get nearer you can often see a roll cloud where the uprising and down-dwelling winds meet, in the center we have the very strong winds and rain (down dwelling)so though what you say is generally correct, with thunderstorms it is not. as both uprising and down-dwelling winds both exist underneath the anvil shaped cloud head.

        Thank you
        Regards Stuart

      • Hops says:

        So, when will anyone “know” who is correct regarding climate response? I’m sure I’ll be gone and you’ll be gone.

        Surely, to get enough data to be statistically significant will take hundreds of years, no?

        The only answer regarding climate sensitivity is to look at proxies in the geological record. And from what I understand, the analysis of that data yields an estimate of climate response to a doubling of CO2 of about 2 degrees C.

        Given all the noise in the system, looking at contemporaneous monthly or yearly averages seems pretty futile.

    • Hops says:

      I recall reading some articles in the 70’s about how the climate was due for an ice age based on the usual time periods and the orbit of Earth. But I don’t recall any “craze.” The time period was purported to be on the order of 10,000 years.

      I sense that you just want to toss anyone the least concerned about climate change into the crazy bin.

      But being concerned about climate change in the long run is just as sane as wanting to leave your grandchildren a trust fund. A stable climate is an asset, while a changing climate is a liability, because we are adapted to the current climate.

      • JohnKl says:

        Hops,

        You asserted:

        “But being concerned about climate change in the long run is just as sane as wanting to leave your grandchildren a trust fund.”

        With effort you can hopefully provide financial support to your grandchildren and leave them a parting gift. However, atmospheric CO2 levels appear to have increased since the 19th century and/or late 1880’s around the time my eldest (now deceased) grandparent was born. You should ask yourself: “Hops do I have any clue as to how I can induce 7+ billion people on this orb called Earth to deny themselves the benefits of hydrocarbon consumption that I “Hops” have enjoyed all these years so that future generations can enjoy the kind of atmospheric gas composition I think they should have but haven’t done a lick to provide for them?” Please don’t misunderstand my intentions. The very use of this blog site involves significant hydro-carbon consumption. All of us contribute to increasing CO2 levels. Nevertheless, if in the few years and/or decades spent roaming the surface of this orb you haven’t yet found any solution to this problem in your own life, what chance do you believe to have in the few remaining years and/or decades to find the ANSWER and communicate it convincingly to everyone else on the planet. If the answer hasn’t been obvious to you, why do you think it will be for everyone else? Where their is no solution, their is no problem.

        Consider, prior to the automobile people rode horses for hundreds and thousands of years. The horse population no doubt increased exponentially over time.

        -I must rush off I’ll finish later.

        • John K says:

          Hi Hops,

          To finish my rant, allow me to repeat part of my previous post and finish.

          Consider, prior to the automobile people rode horses for hundreds and thousands of years. The horse population no doubt increased exponentially over time. Eventually they became a problem. City streets became polluted with animal (horse and human) waste greatly increasing the potential for disease. Plagues a scourge of past and present conditions seemed inevitable. The invention of the automobile combined with better sanitation greatly improved conditions. Curiously a nineteenth century version of the IPCC and/or international planning boards never became necessary to solve this problem. Since international agreements such as the Kyoto Protocol and institutions like the IPCC have proven themselves incapable of solving many problems including this one it seems rational to rely on what has worked in the past. The ability of man to use his God given brain to find the highest value uses for the resources available to him in cooperation with others through free exchange. The belief that some UN autocracy will resolve such problems would prove delusional and a vast waste of time and resources we simply cannot afford.

          BTW, all the above only becomes an issue when and if CO2 LEVELS EVER PROVE TO BE A PROBLEM. You have yet to prove current levels to be excessive or our planetary climate temperature to fall out of historical norms. No doubt CO2 levels cannot be allowed to rise indefinitely. The planets oxygen-nitrogen ratio should ideally be maintained. However, a mind is only so good as the precision of it’s concepts. It will require a clear understanding of the costs and benefits associated with continued hydrocarbon use to better utilize them to meet the demands we place on them. We’d all love to hear any ideas you may present. In the meantime, I suggest you focus greater attention to problems you can resolve like the grandchild’s trust fund. Given all the problems in this world much more pressing than hydrocarbon excess they’ll need it.

          Have a great day!

          • Hops says:

            John, I understand what you are saying. I realize there are a lot of problems in the world, and that solving any problem requires an input of energy.

            But a modest fee on carbon, rebated per capita, such as California already has in place, would induce the present generation to leave the next generation (1) more reserves of fossil fuels, (2) less CO2 in the air, and (3) more innovative means of generating renewable energy. It would also reduce air pollution in the present.

            Cheers,
            Hops

          • crakar24 says:

            Hops,

            We tried that rubbish here in Australia, in the first year the tax raised AUD 6 Billion and our CO2 emission reduced by 300,000 tonnes.

            Soooooooooooooo the carbon tax was around $21 a tonne but in the end we tax payers forked out $20,000 a tonne, but thats ok we are saving the planet for the (bankers) children and the (bankers) childrens children and the (Bankers) childrens, childrens children ad infinitum

  12. Marco says:

    8 Novembers were warmer than 2013:

    2006, 1990, 2003, 2010, 2002, 2012, 2005, 2009

    3 Years were warmer than 2013 (Jan-Nov):

    2005, 2010, 1998

  13. torontoann says:

    Salvatore says:

    “…global warming will soon meet the same fate as did the global cooling craze of the 1970’s…”

    There has been more emotional capital invested in the warming craze. Do not expect any apologies from anyone, if you are right. Expect hate.

  14. Dan M says:

    Looking at this graph, we sea that global temperatures in the 2000 and later are on average about 0.2 degrees C higher than the average from 1979 to the present, but no warming has taken place in the last 10 years or so.

    Measuring today’s temperatures against the average since 1979 to say that global warming has taken place over that time period is in my view very suspect. There were a number of cooling events in the 1980’s and early 1990’s that skew the average temperature downward:
    1. 1982-83 the eruptions of El Chincon and Galuggung volcanos which together put 10M tons of S02 into the Stratosphere and upper Troposphere. The effects of these could have lasted for 4 years. They were partially offset by the strong El Nino of 1983. These events all correlate with the temperature graph.
    2. A strong La Nina in 1989 may have been responsible for the cooling that year shown on the graph.
    3. MT. Pinatubo cooling (20M tons of SO2 emitted) in 1991 effecting the following 4 years.

    The cumulative effect of these events on the interpretation of the data is to give the 1980’s through the mid 1990’s lower average temperatures than the late 1990’s and 2000’s, giving an appearance of a warming trend. It could be that the temperatures over the last 10 years are the true “average” and that the 1980’s and early 1990’s were an aberration downward.

    I’m not saying that these events were the only influencers of temperatures, but that it is possible that they were significant enough to skew the data.

  15. Dan M that is so true.
    Right now the only items one can say that have been promoting cooling post 2005 are sub- solar activity in general and the PDO (more La Ninas) recently switching to it’s cold phase.

    These two items not all that strong in degree of magnitude or duration of time through now, nevertheless have seemingly brought the temperature rise 1980-2000 to a halt..

    I say as the solar condition continues to weaken and the duration of time of this weakness continues, along with the PDO staying in it’s cold phase with the AMO to follow along with all the secondary effects I feel (some of which I posted earlier )will be associated with a very weak solar condition that the temperature trend will have to be down.

  16. 4TimesAYear says:

    Please quit using the term “global temperature” – it’s not a “temperature”

    • dave says:

      4timesayear says:

      ” ‘global temperature’- it’s not a ‘temperature’ ”

      Good luck with pointing out that. Simple truth, naturally*. But not one person in a thousand will understand you. Perhaps someone who was lucky enough to have been carefully taught Heat in Secondary School, by a real scientist**, and hasn’t forgotten the definitions. Heck, make that one in ten thousand.

      *If a system is neither in thermal equilibrium nor involved in a steady sweep it has no temperature. The globe as a whole does not meet either of these criteria. Therefore it has no temperature, strictly speaking. And in Science one should always speak strictly.

      More generally:

      You can’t average concentrations.
      Temperatures are measures of concentration (of Heat)
      Ergo, you can’t average temperatures.

      **My chemistry teacher was a Doctor of Science from London University. (He was forced to teach schoolboys because he had some health problem). After we had been doing Heat for a couple of weeks he started a lesson by writing “300 K” and “400 K” on the blackboard and asking mildly, “What is the average of these?”. We chorused “350!” After a suitable pause for effect he said finally,
      “I see before me twenty-eight MONSTROUS CRETINS!”

  17. crakar24 says:

    4TAY

    What is the alternative? “global heat or energy” temp is a man made construct used to describe heat or if you like energy.

    For example if the heat content of the planet dropped by X number of joules then the temp will drop accordingly.

    The two terms are interchangeable, it makes no difference what it is called we just want to know if it has gone up or down.

    The problem is we get bombarded by rubbish like this

    http://blogs.unicef.org.uk/2013/12/04/climate-change-mongolia-children-extreme-cold/

    Here we have UNICEF trying tell us that the freezing cold and snow in Mongolia is caused by AGW. Your concerns for scientific correctness should be focussed more on this type of missleading propaganda rather than “global temp”

    regards

    Crakar

  18. Westy says:

    Thanks Roy. I’m taken by how stable it is, hardly diverging by more than 1 Deg. C. in all that time. We deal with swings much larger every day / night let alone summer / winter. Much fuss about nothing I think.

  19. dave says:

    crakar says:

    “It makes no difference what it is called we just want to know if it has gone up or down.”

    By leaving the definition of “it” to others you are placing yourself at the mercy of other peoples’ definitions of “it”.
    He who controls the language controls the argument.

    Personally I attribute litle fundamental meaning to these satellite anomalies. But the recording of them stops other people from defining “it” as merely the changes in (their) surface measurements.

  20. dave says:

    “…litle…”

    little

  21. torontoann says:

    “…stops other people…”

    An external auditor is good at keeping people on their toes.
    I would always dig until I found some footling mistake, when I was one. Made the book-keepers think I was checking everything they did. I wasn’t! Much too lazy for that.

  22. Hot Potato says:

    I’ve been feeling nostalgic the past several days so I’ve taken a hike down memory lane and traveled old, nearly forgotten trails. One such trail was reviewing the work and writings of Robert Stevenson, Ph.D. who passed away in 2001 from cancer. He was the preeminent critic of AGW for many years and he was quite prescient. Just like Roy, he was interested in maintaining the integrity of the scientific method and furthering the spirit of science. For this, he was labeled a Denier.

    http://american_almanac.tripod.com/globwarm.htm

    The science of climate has been buried alive by an avalanche of ideology-based computer models.

    Not so long ago, in the early 1970s, climate scientists thought in 100,000-year cycles, or at least 10,000-year cycles, and were talking about global cooling. Scientifically speaking, the evidence indicated that the Earth was coming out of a 10,000-year interglacial period, on the way to a new Ice Age. Some scientists thought that this might happen in perhaps hundreds or thousands of years, while others thought it might take only 100 years. A lecture at Scripps Institution of Oceanography in La Jolla, Calif., by Prof. John Isaacs in 1972, for example, startled the entire staff by promoting the latter fast track.

    The National Science Foundation and the National Academy of Sciences both began looking at the Ice Age concept, and beating the bushes to look for scientists who would research climate. The emphasis seemed to be not so much one of science, but of devising scenarios to explain how climate change might be very rapid–and might adversely and drastically affect human behavior, for example, forcing entire populations to move south.

    To give you the flavor of this: At the time (1974), the disaster-is-coming atmosphere was so thick, that I submitted, tongue-in-cheek, a proposal to the National Science Foundation (NSF) asking for funds to study the Polynesians. My alleged rationale was that it would be useful to look at a population, which, for some reason, possibly environmental, had packed up all its members and possessions, and travelled via canoe thousands of miles to set up a new civilization on a faraway island. I requested funds for a three-year project that would outfit a large sailing ship, fully equipped, including medical specialists, in order to sail to the less-populated islands, and try to find out from the present residents, what events prompted their ancestors to move. (The idea of the doctors and dentists, was to offer islanders some services in exchange for their history.)

    To my great surprise, the NSF was ready to fund this proposal; the funders were crushed to find out it was a joke! The science funding agencies in this period, also gave birth to computer climate modeling. That action buried the actual science of climate, based on study of the solar-astronomical cycles and their correlation with long-term climate changes.

    It was then, in the early 1970s, that ideology, and not science, began to drive so-called climate science. If a disaster scenario for global cooling might promote the use of more fossil fuels, and hence more industrialization and more population, another scenario would have to be found–equally scary but more directly blamable on human activity. The driving force was to get people to blame science for environmental disasters, to use fewer resources, and to shrink the world’s population, particularly its brown, black, and yellow parts.

    And so the climate science funding proliferated, climate modelling proliferated, global warming and “greenhouse effect” propaganda proliferated–and climate science, based on study of solar astronomical cycles, oceanography, geology, and so on, was buried alive.

    See link for the rest of the article.

  23. Threepwood says:

    tropics v poles…

    Correct me if I’m wrong, a signature of warming from an enhanced GH effect would be disproportionate warming at the poles

    i.e. shouldn’t it be possible to identify an existing AGW signature even if global temps were falling?

    from the data here 8 out of 11 months did see disproportionate warmth at higher latitudes-

    but is there somewhere to view this data going back to ’79/
    any charts of trends etc? Seems like the relative divergence of trends at different latitudes would be far more relevant than overall global temps?

    • Roy Spencer says:

      well, we do get the maximum warming trend in the Arctic…but no warming trend in the Antarctic.

      Besides, there is no “signature” of anthropogenic warming. Warming due to any cause should be a maximum where most of the land is, which is the middle to high northern latitudes.

      • Threepwood says:

        Thanks for the response; how then do we reconcile ‘warming in the arctic but not antarctic’..
        With ‘should be warming where the land is’.. we are seeing the opposite re.the polar regions yes?

  24. torontoann says:

    “disproportionate warming at the poles……possible to identify [a] signature…?”

    The data is very noisy. For example the Land between 65 S and 85 S is shown in the text file as having an anomaly of -0.99 C in July 2013 and + 1.46 C in August 2013.

    • Roy Spencer says:

      yes, the natural variability toward the poles is very large, which makes it more difficult to discern any underlying trend.

  25. pochas says:

    Sudden drop in north extratropical ocean and north polar ocean temperatures in november (-.46 / -1.61) without comparable land temperature changes from uahncdc_lt_5-1.6 file.

  26. wayne says:

    “well, we do get the maximum warming trend in the Arctic…but no warming trend in the Antarctic.”

    But that warming trend “signature” is no different than the Coming-Little-Ice-Age climatology signature found in the 1970’s. To me there is no “trend” at all, but instead the tops and bottoms of a apx 62 year sinusoidal pattern that you can easily see imbedded here w/o the upward adjustments applied (http://i44.tinypic.com/29axhua.png).

    • fonzie says:

      wayne, good to see you back. keep posting this link early and often. THANX…

      • wayne says:

        Thanks fonzie, I’ll keep sending it out there, as of yet no one has been able to give me a good explanation of the nearly linear upward adjustments that have been systematically applied since the 40s. Still looking.

  27. bernie says:

    “…w/o the upward adjustments…”

    Yes, their “upward adjustments” card! How many more times will that be dealt, from the bottom? Even a rube will walk away from the game eventually.

  28. torontoann says:

    If one takes the individual numbers of Messrs Christy and Spencer for anomalies in particular regions, and weights them STRICTLY according to the geographical areas of land and sea
    involved, one gets slightly different Global estimates.

    For November 2013 +0.14 C instead of + 0.19 C
    For October 2013 +0.25 C instead of + 0.29 C.

    I have pointed this out before.

  29. bernie says:

    Yes, I notice that Land in the Southern Hemisphere is overweighted. And Australia happens to have been pretty warm
    in recent months!

  30. torontoann says:

    Based on the Atlas, I think the proper weights* are

    No Pole Land 0.025
    Ocean 0.020

    No Extn Land 0.136
    Ocean 0.147

    Tropics Land 0.080
    Ocean 0.262

    So Extn Land 0.030
    Ocean 0.254 Pacific lot bigger than Australia!

    So Pole Land 0.026
    Ocean 0.020

    *By the rules of this peculiar game.

  31. torontoann says:

    The maximum positive anomalies figure in the late 1990’s reduces itself from + 0.65 to + 0.54 C. Other extremes do not seem to change much.

  32. ren says:

    Lock persists and arctic air will still flow into the United States.
    http://www.cpc.ncep.noaa.gov/products/stratosphere/strat_a_f/gif_files/gfs_t70_nh_f00.gif

  33. Vilnius says:

    Sorry for being so late and off topic now, but Arno Arrak promote a deeply problematic theory in this blog, and everywhere; Dr Spencer himself referred to it sometimes. So my comment is to Arno Arrak on his September 18, 2013 at 6:37 PM, in the ‘A Turning Point for the IPCC…and Humanity?’ post.

    Arno Arrak said on September 18, 2013 at 6:37 PM:

    „In Miskolci theory there exists an optimum absorption window that the gases present jointly maintain. For earth atmosphere the major absorbers that count are carbon dioxide and water vapor. The IR optical thickness of their joint absorption window is 1.87 … He published this in 2007 and by 2010 he had found a way to prove it experimentally using existing data. NOAA has a database of weather balloon observations going back to 1948 and he used it to study the absorption of infrared radiation by the atmosphere over time. He found that absorption had been constant for 61 years while carbon dioxide at the same time went up by 21.6 percent. This means that addition of this substantial amount of carbon dioxide to air had no effect whatsoever on the absorption of IR by the atmosphere.“
    (End of quote)

    The papers of 2007 and 2010 Arno refers are performing clear-sky radiative transfer calculations on average cloudy atmospheres (this means tracking the paths of longwave photons up and down in the atmosphere as if there were no clouds at all). But it is widely known that clouds block the way of the longwave photons, so this computation results an entirely unrealistic radiation structure. The cloud-free atmosphere might have an average of ~1.7 infrared optical thickness, but as clouds are almost opaque in the infrared, the cloud IR optical depth is practically infinite. So a cloudless + cloudy global mean IR optical thickness of 1.87 is completely unphysical. NOAA weather balloon observations do not indicate cloudiness, so to sort out the cloudless subset from the whole is almost impossible – that’s why the atmospheric radiative transfer calculations are based on satellite observations rather then on radiosonde data.

    What is worse, the 2007 and 2010 papers do not declare this method. They might have said: “We will make clear-sky computations on cloudy atmospheres, what is meaningless, but we are going to do this on purpose and let’s see what we’ll get”. But no, they try to cheat the reader that this method is fine. This is the real problem.

  34. dave says:

    “…they try to cheat…”

    This is ad hominem.

    You will be ignored.

    • Vilnius says:

      Okay, try this:

      What is worse, the 2007 and 2010 papers do not declare this method. They might have said: “We will make clear-sky computations on cloudy atmospheres, what is meaningless, but we are going to do this on purpose and let’s see what we’ll get”. But no, they leave the reader believing this method is fine. This is the real problem.

  35. Tom Anderson says:

    So NBC news tonight (Tuesday December 17th) just throws this out there with no reference or source. “Make of this what you will, but November 2013 was the warmest month on record globally in recorded history”. That was it, no other reference or documentation. How can they do that?

  36. Martin says:

    I assume they were referring to the NOAA Global Analysis for November:
    http://www.ncdc.noaa.gov/sotc/global/
    What I don’t get is that these figures apear to be at odds with the UAH results. Can anyone provide an explanation for the divergence ?
    Which results are most reliable ?
    Martin

    • dave says:

      “…the warmest month on record globally in recorded history…”

      Cherry-picking:

      They could have said, from the same set of data;

      “November 1997 was warmer than November 2013 for the 70% of the globe which is covered by water. Therefore warming has been in reverse, over the greatest part of the globe, for sixteen years now.”

      “Can anyone provide an explanation for the divergence?”

      One method has GONE WRONG for dry land. Land stations or satellites? You pay your money and you take your choice.Time will tell.

  37. bernie says:

    “…one method has GONE WRONG…”

    The whole “news item” is based on NOAA claims. However, the NOAA admits that it systematically “adjusts” data, with the net result of showing an extra warming of 0.5 Degrees F. for the last fifty years. The satellite TV Umpires are throwing a flag on this play.

  38. Steven says:

    I am new to this site, but why do you numbers differ from those issued by NCDC/NOAA? They are claiming November 2013 temperatures were 0.78 C above average..

  39. bernie says:

    Steven

    Look at the comments, immediately before yours, dated Dec 18th.

  40. vincenzofiorentini says:

    hello, these data look different from others I just happened to see:
    http://freddofili.it/wp-content/uploads/2013/12/cfsr_t2m_20052.png
    why are they so different ?
    apparently they are cited in the spiegel in an article mentioning a confidence crisis in the agw field. 😉
    any comment ?

  41. torontoann says:

    I think these are temperature anomalies for the air very close to the ground and ocean (bottom 2 meters of the atmosphere). As such they are simply a different measurement from the UAH ones here, which involve a deeper depth of atmosphere. There is no reason for them to be EXACTLY the same. The NCEB uses more sources of data, as well.The main point is that they both show an essentially sideways pattern for the last decade or so.

    The reanalysis program of this government agency involves a laudable effort to “eliminate fictitious trends in data”. Seems they are succeeding with this latest chart!

Leave a Reply