
 Home/Blog
It’s been 8 years since Al Gore told us in January 2006 that we had only 10 years left to solve the global warming problem.
In the grand tradition of prophets of doom, his prognostication is not shaping up too well…still no statistically significant warming:
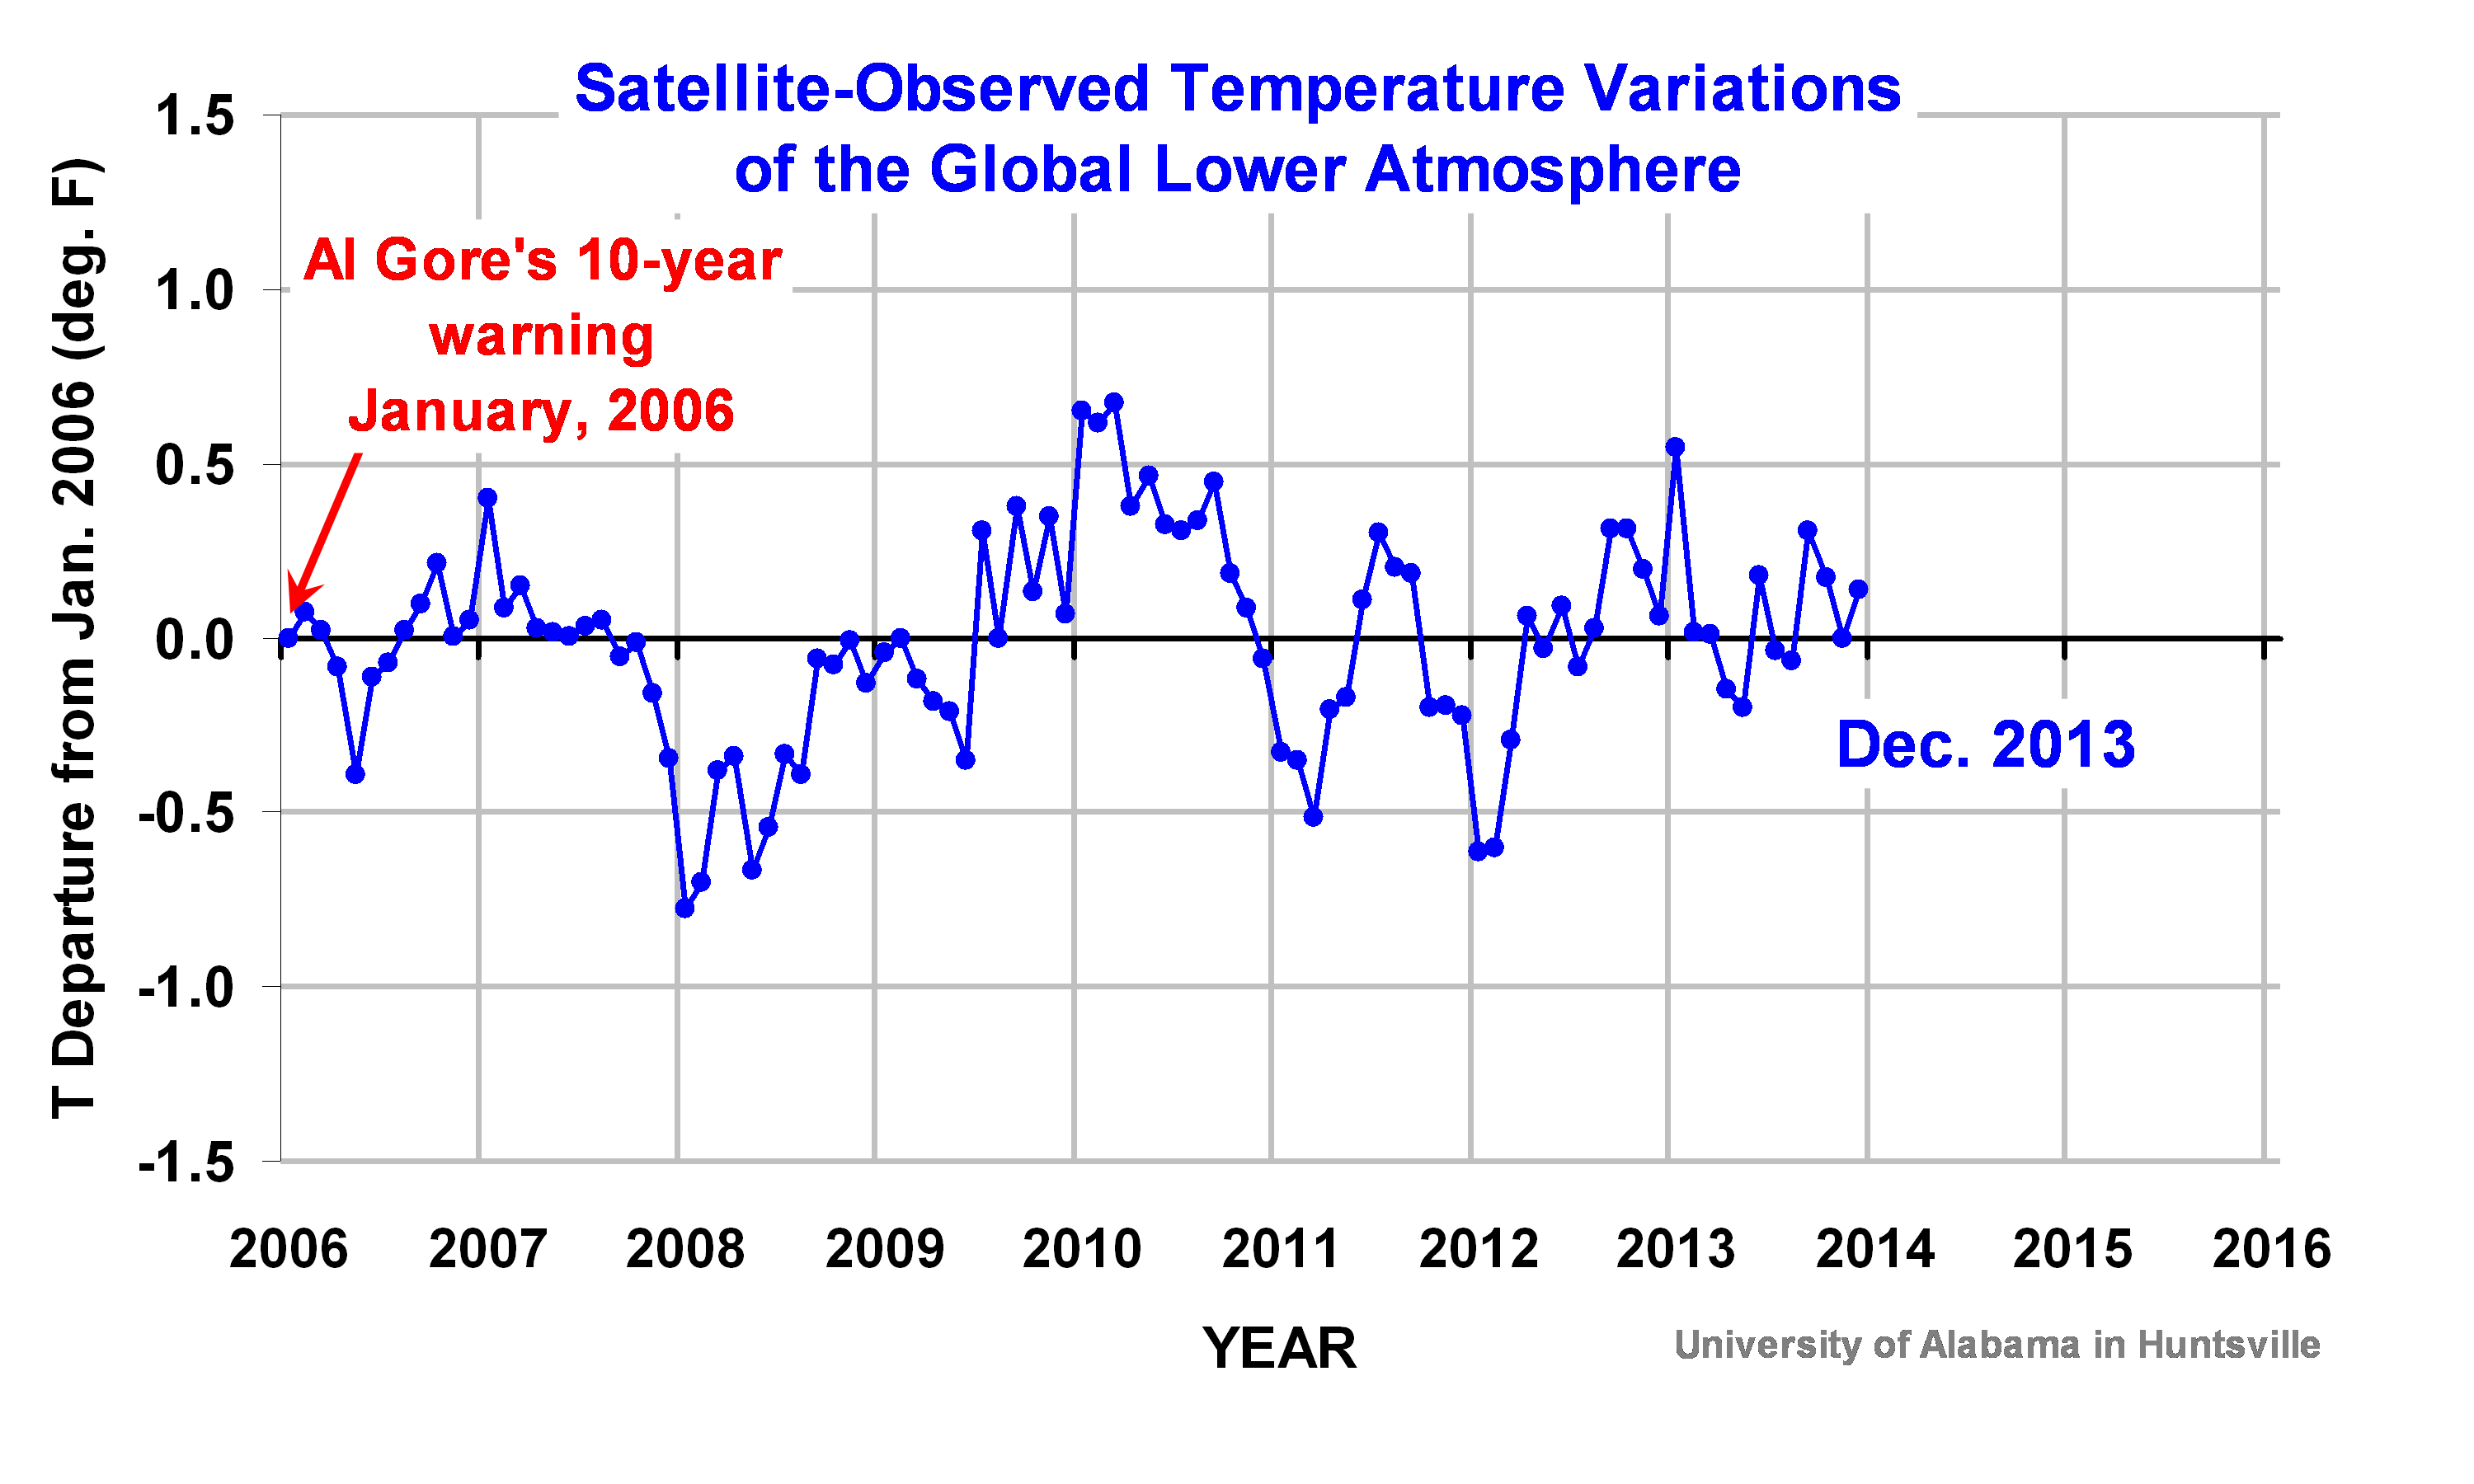
And if you use RSS version of the satellite data, it will look even worse for Mr. Gore.
Oh, I know. All that extra energy, hundredths of a degree of it, could be hiding in the deep ocean. Good luck getting Mr. and Mrs. Taxpayer worked up over that one.


