UAH v5.6 Global Temperature Update for Dec. 2013: +0.27 Deg. C

January 3rd, 2014 by Roy W. Spencer, Ph. D.

The Version 5.6 global average lower tropospheric temperature (LT) anomaly for December, 2013 is +0.27 deg. C, up from +0.19 deg. C in November (click for full size version):
UAH_LT_1979_thru_December_2013_v5.6

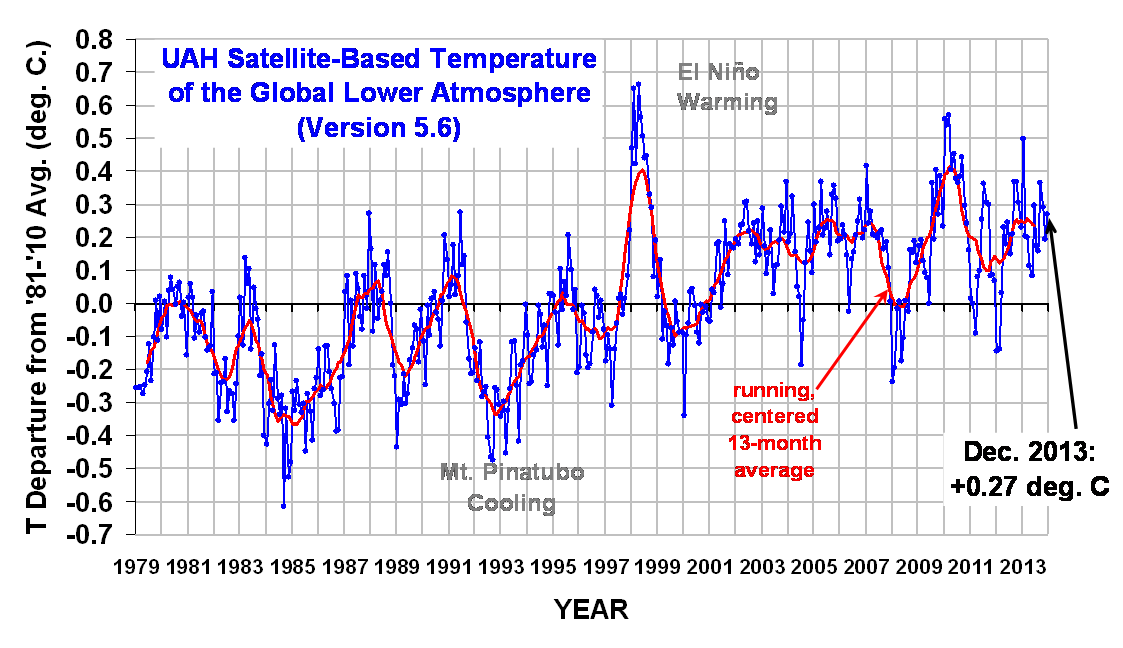
The global, hemispheric, and tropical LT anomalies from the 30-year (1981-2010) average for the last 12 months are:

YR MON GLOBAL NH SH TROPICS
2013 01 +0.496 +0.512 +0.481 +0.387
2013 02 +0.203 +0.372 +0.033 +0.195
2013 03 +0.200 +0.333 +0.067 +0.243
2013 04 +0.114 +0.128 +0.101 +0.165
2013 05 +0.082 +0.180 -0.015 +0.112
2013 06 +0.295 +0.335 +0.255 +0.220
2013 07 +0.173 +0.134 +0.211 +0.074
2013 08 +0.158 +0.111 +0.206 +0.009
2013 09 +0.365 +0.339 +0.390 +0.189
2013 10 +0.290 +0.331 +0.250 +0.031
2013 11 +0.193 +0.160 +0.226 +0.020
2013 12 +0.265 +0.273 +0.257 +0.057

Here’s the global lower tropospheric temperature anomaly map for 2013:
2013_LT_map

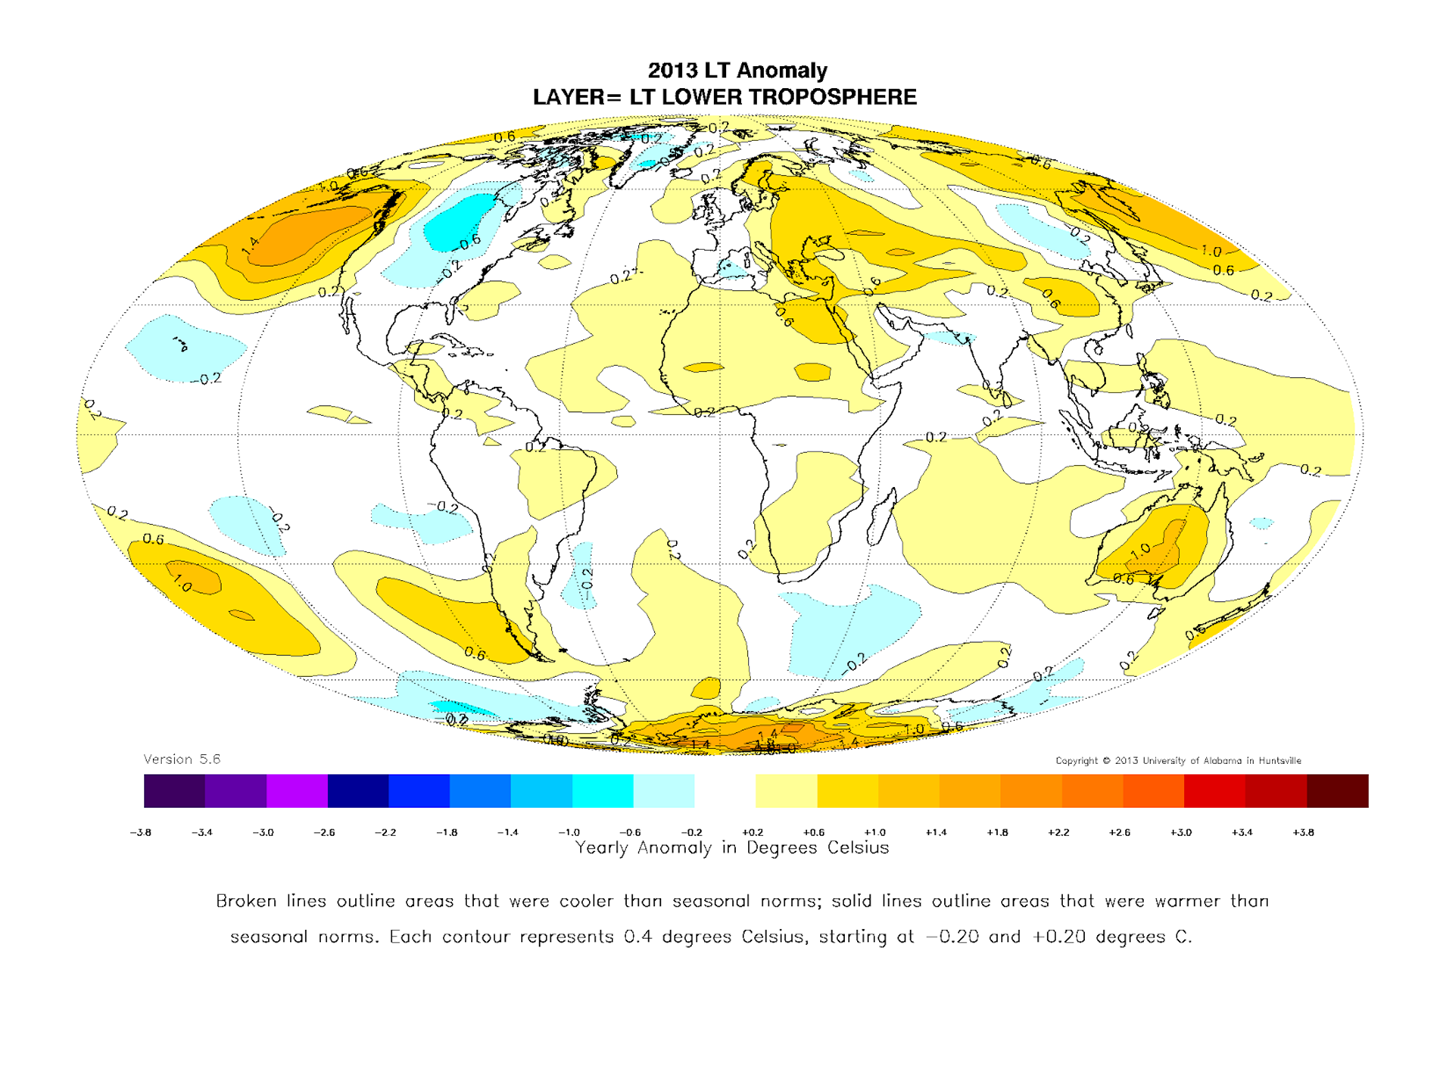
Other global images are archived here.

The global average anomalies by year (2013 was the 4th warmest since satellite monitoring started in 1979):

1979 -0.170
1980 -0.008
1981 -0.045
1982 -0.250
1983 -0.061
1984 -0.353
1985 -0.309
1986 -0.244
1987 +0.013
1988 +0.012
1989 -0.207
1990 -0.022
1991 +0.020
1992 -0.289
1993 -0.245
1994 -0.108
1995 +0.013
1996 -0.076
1997 -0.049
1998 +0.419
1999 -0.056
2000 -0.061
2001 +0.107
2002 +0.218
2003 +0.187
2004 +0.108
2005 +0.260
2006 +0.186
2007 +0.204
2008 -0.009
2009 +0.209
2010 +0.398
2011 +0.130
2012 +0.170
2013 +0.236

Popular monthly data files (these might take a few extra days to update):

uahncdc_lt_5.6.txt (Lower Troposphere)
uahncdc_mt_5.6.txt (Mid-Troposphere)
uahncdc_ls_5.6.txt (Lower Stratosphere)


59 Responses to “UAH v5.6 Global Temperature Update for Dec. 2013: +0.27 Deg. C”

Toggle Trackbacks

  1. fonzie says:

    dr s., i really love your “fundanomics” postings. i think you should do one every quarter…

  2. Sun Spot says:

    I must admit I’m having trouble seeing the modeled accelerated warming in this real data.
    /sarc

    • Buzz B says:

      4th warmest year on record, doesn’t that mean anything to you?

      • Fight On says:

        It would mean more if you could answer the question, “So what?” Please be specific, measurable, accountable as to your certainty and predictions of catastrophe that will occur over the next 50 years directly related to the 0.27C of warming. Also, please provide the science as to how political action right now will control, regulate, avoid the catastrophes you predict over the next 50 years.

        Then I can be concerned. And possibly persuaded that US govt climate policy is capable, competent, and cost-effective to regulate global climate change.

        • Cupsui says:

          So that is 0.27 degrees warming above the 30 yr average from 1979-2010. So in that short a period it is concerning. However, what is more concerning is that since the start of the industrial revolution warming, which is closer to 1 degree (data is not as certain but definitely usable).

          Further climate patterns continue to change crazily. But again the easy choice is to dig up coal and oil, burn it and make money, make money, make money, money, money.

          Again its 100+ year old science that shows the greenhouse effect is real (spectroscopy). Thus if we put more heat trapping gases into the atmosphere we trap more heat. Simple result of that is effects on the weather as heat means more evaporation (more rain in place) more temperature discrepancies (greater winds…heat and pressure move from high to low)…

          To say we are having no effect is just short sighted. Put an introduced species into a new ecosystem and they effect that ecosystem. Proven fact. Thus being the most manipulative creatures on this rock clearly we have an impact.

          All we ask as people concerned with the anthropogenic greenhouse effect is adopting renewable sources of energy such a wind, concentrating solar thermal power, geothermal power, wave and tidal power, and moving away from a system of unsustainable economic growth to a sustainable economy based on reuse of products. One where exploitation of people and the environment isn’t the focus of the money makers. it can happen easily but we all need to make it happen

          • Chris S. says:

            “…what is more concerning is that since the start of the industrial revolution warming, which is closer to 1 degree (data is not as certain but definitely usable).” What is more concerning is what exactly? That the warming is closer to 1 degree?
            “But again the easy choice is to dig up coal and oil, burn it and make money, make money, make money, money, money” So if they dug up coal and oil and didn’t make money, would you be okay with that? It sounds like you dislike the profit more than the effect.
            “Again its 100+ year old science that shows the greenhouse effect is real (spectroscopy).” Does the age of the “science” matter? For thousands of years the “science” was that the earth was flat. (Go ahead, namecall me a flatearther!)
            “Put an introduced species into a new ecosystem and they effect that ecosystem. Proven fact. Thus being the most manipulative creatures on this rock clearly we have an impact.” Really? Put an introduced? Put a species or introduce a species would have been better grammar. But I digress. Clearly we have an impact? To you it may be “clear”, but just using the word “clearly” does not make it true. If we are the most manipulative introduced species and have the power to have an impact on climate, do we also have an impact on plate tectonics? If not, why not? What about orbital mechanics? Or perhaps, mankind is so insignificant to systems such as those (climate, tectonics, astrophysics) that whatever “global warming” that has occurred has another reason.
            Until someone explains to me the reason for the Medieval Warm Period, and then explains why the current “Warm Period” cannot be as a result of the same forces, I will remain skeptical. This is especially due to reading what some “warming alarmists” (my term to describe, please do not take offense, I am willing to use whichever term you choose) have said the answer to warming is. That is the transfer of money from “rich” to “poor”. (Taxes, CO2 credits, payments to “emerging societies, etc.)

      • Ray says:

        The UKMO forecast it would be the warmest year on record,
        according to the WMO average.
        It looks like being joint 7/8th by that measure.

      • DWM says:

        No net increase in 15 years, doesn’t that mean anything to you?

        • David A says:

          No true — it’s warmed 0.22 C in the last 15 years, according to this data.

        • Cupsui says:

          you base everything on one thing temperature over the last 15years when before that temperatures went up significantly and since the weather has been going bananas. And like David A says…this data set does say warming in that period…

          its hard to make people hear what they don’t want to. Can’t teach an old dog new tricks

  3. AndyG55 says:

    Hi Roy,
    Down here in Australia, we are being bombarded with “hottest ever” statements from BOM.

    What does UHA have to say about this?

    Thanks.

  4. Tom H says:

    Dr Spencer,

    Is it possible to find data separating global daytime temps from night time to see the two trends?

    • I’m afraid not. We need to average the day and night data to help cancel out the diurnal drift of the satellite. Besides, I wouldn’t expect a significant difference for deep-layer temperatures, they way you might for near-surface temperatures.

  5. Thanks Dr. Spencer. I’ll be updating UAH’s graphics.

  6. Aaron S says:

    One location of significant warming in the LT anomaly warming map is in the Pacific Ocean west of the US. I read an article (below) that the the 2011 Fukushima radioactive ocean plume will reach the US waters in 2014, which provides a ‘back of the envelop’ estimate for the time for a current to cross the pacific. I’m curious if anyone knows is this warm spot a result of conditions from 2 or 3 years ago (ie there is a lag due to the time required for the water to cross the pacific as it warms)? I’m trying to understand this in the context of the PDO (cool phase in 2013) becuase it surprised me to see this warming trend in this location.

    http://www.nbcnews.com/science/fukushimas-radioactive-ocean-plume-due-reach-us-waters-2014-8C11050755

  7. sky says:

    The remarkable feature of the LT global anomalies is how closely they’ve kept to ~0.25K for the last dozen years. This is quite reminiscent of what the world-wide average of vetted non-urban station records showed around mid-20th century, before that average went strongly negative into the 1970s. The fairly narrow-band ~60yr oscillation that is evident in the power spectra of GISP2 isotope data for the last 8 thousand years seemingly persists.

    • David A says:

      Huh? An ordinary least squares fit to the last 15 years of UAH LT data shows a trend of 0.15 +/- 0.05 C/decade (2-sigma).

      • sky says:

        Huh? What does a 15-yr LS trend have to do with how closely the anomalies have kept to a certain level for the last 12 yrs or to the persistence of multi-decadal cycles?

  8. old engineer says:

    Dr. Spencer:

    Could you clear up a point of confusion for me. When the global monthly LT anomaly is given, I understand that it the departure from a 30 year average temperature. For UAH that 30 years is from 1981 to 2010. Is the anomaly, say for December, the departure from the average of the 30 Decembers from 1981 to 2010, or from the average of all 360 months from 1981 to 2010?

    It seems to me that it should be the average of the Decembers, otherwise there might be a seasonal pattern to the data, even considering the opposite seasons in the NH and SH.

    If this is correct, would it mean that the actual temperature change from one month to another could be in the opposite direction from the change in the anomaly?

  9. It is the first time in (a 35 years long) history, that numerical value of annual UAH anomaly is higher than that of RSS (by 0.018 K). Considering the fact, that (arbitrary) offset of RSS is 0.087 K higher itself, it means UAH is running high by an unprecedented 0.105 K compared to RSS this year. That’s a more than 2 sigma discrepancy, with sigma=0.046 K.

    Therefore either this year’s RSS or UAH value is an outlier (or both). That is, the 4th warmest year can be the 14th warmest just as easily.

    The two datasets are based on the same raw measurements, so their difference gives us some information on their inherent uncertainty, which is on the order of 0.1 K, provided there is no common bias in their methods. Measurement noise is not included.

    I wonder why error bars are not published.

    • Ray says:

      “The two datasets are based on the same raw measurements”

      Strictly speaking that is not the case.
      UAH covers the globe from +85.0 to -85.0 degrees whereas RSS covers +82.5 to -70.0 degrees.
      These differences, particularly in the SH, may account for at least part of the discrepancy.
      The average RSS S. Polar anomaly for 2013 is -0.075c, whereas the average UAH S. Polar anomaly (11 months) is +0.256c.

    • why do you say the error bars are not published? They have been published numerous times. But you are correct, there is inherent uncertainty, mostly related to differences in how RSS and we do the adjustments for diurnal drift. Based upon our better match to radiosonde data we believe our method is closer to the “truth”.

      • David A says:

        Perhaps he means not published with the monthly numbers, the way the Hadley Centre does.

        Some consistency about significiant figures would be nice too — does your methodology justify 2, or 3? The numbers shouldn’t depend on your mood.

  10. DocMartyn says:

    I had a look at all the 12 month averages between Jan 1979 and Dec 2013 and 2013 isn’t all that warm at all. 98/99 and 2010/2011 stand out.

  11. Tim says:

    We have had a very mild winter so far in the UK, but I suspect that the 2nd half will be a lot colder and we will see a big drop in the UAH.

  12. Chris says:

    Considering the ENSO state was negative all year.

    The 48, 60, 72 month averages of UAH are running at record highs.

    Considering this is the 4th warmest year on record.

    Warming may have slowed during the 2000s but there is zero sign of any cooling or some “global oscillation”.

    Folks might believe the AGW effect won’t be catastrophic. But it’s happening it’s proven science and the Earth will continue to warm whether there is hiatus periods or not.

  13. Temperatures for the globe continue to remain constant despite CO2 increasing.

    Then when one takes into consideration the maximum of solar cycle 24 which has been going on now for two years, very low to no major volcanic activity for the past several years, a neutral ENSO, a warm AMO, a cool PDO not cold, all of this suggest strongly that global warming due to CO2 increases should be happening, but this is not so as the temperature pause continues.

    With all these natural items which control the climate neutral to slightly positive for global warmth along with CO2 increasing one would think the temperature pause would have ended and a rise in global temperatures would be taking place once again, if CO2 increases were the main item which governs the temperature.

  14. For example as far as recent solar activity goes I have been saying in order to have global cooling effects due to direct changes in solar output and indirect changes you need these values.

    solar flux sub 90

    ap index sub 5.0

    cosmic ray count north of 6500

    Euv light index sub 100

    solar wind sub 350 km/sec

    solar irradiance off.015% or more

    None of this solar criteria has been achieved since the unset of solar cycle 24 maximum now some two years ago , therefore global cooling effects due to solar activity are on hold, until prolonged persistent solar minimum conditions establish themselves once again in a consistent manner.

    I still expect this will happen for the balance of this decade but right now the maximum of solar cycle 24 has put everything on hold despite sub- solar activity in general for the past several years. 2005-2013.

    • Cupsui says:

      the record is still very broken Salvatore.

      We all acknowledge that changes in solar radiation do effect temperature. But we also acknowledge that changes in the amount of greenhouse gases (long ago proven to trap radiation at the wavelengths emitted by the Earth) trap heat by interacting with longer wavelength out-going radiation from the Earth itself.

      There is no one easy answer to any problem. Multiple (near infinite) factors attribute to everything that occurs…so look for information from more than one source…

      I dare you to

  15. The 0.27C warming in 34 years figures to a decadal average of 0.08C, which is approximately 1/4 of the warming predicted by the IPCC for the period. I.e., the models multiply climate sensitivity x 4. With IPCC having long said its best estimate of climate sensitivity is 3.0C, divide that by 4 and you get 0.75C, which is quite compatible with the estimates of global warming skeptics like Richard Lindzen, Roy Spencer, John Christy, Fred Singer, Pat Michaels, Nic Lewis, and others. It’s also a level that doesn’t support fears of catastrophe–rather, supports expectations of widespread and net benefit from AGW.

    • Arne says:

      “The 0.27C warming in 34 years figures to a decadal average of 0.08C, which is approximately 1/4 of the warming predicted by the IPCC for the period.”
      I wasn’t aware the IPCC had made predictions for the decade before it was founded :p

      Question to Dr. Spencer: has your team updated the trend already? I calculated +0,13şC/decade, but I’m absolutely not qualified for this. I’m probably in the ballpark but I’ll only take your word for it.
      Thank you.

    • David A says:

      You are off by a factor of nearly two. The linear trend for the entire UAH LT dataset is given with their data: for the globe it’s 0.14 C/decade, or 0.48 C of warming over the last 35 years.

    • Cupsui says:

      it is a 35 year average from 1981 to 2010…so 0.27 in 34year is completely wrong.

      Data mining is what you are doing there. Getting numbers you want by manipulating data

  16. 4TimesAYear says:

    “Global average anomalies”? Has anyone defined what’s “normal” yet?

    • BjornT says:

      Anomaly in this context means only the difference compared to a baseline which in this case is the average temperature between 1981 and 2010.

      It has nothing to do with “normal”. It is standard procedure for detecting trends.

  17. BjornT says:

    I made a gliding (is that the correct term?) 5-year anomaly average for the last 26 years and got this

    http://www.bilddump.se/bilder/20140105092035-83.233.174.89.JPG

    (In swedish but you will understand)

    Does it looks like we have a “hiatus” in the global warming?

  18. bernie says:

    “…gliding…” “…moving…”

    It isn’t centred properly.

    • BjornT says:

      It is not intended to be. Every point is simply the average anomaly of the last 5 years.

      • bernie says:

        “…simply the average anomaly of the last 5 years….”

        Yes, I know what it is. By definition, it makes an indicator which lags by 2 1/2 years.

        • BjornT says:

          As does a centered 5-year average.

          • bernie says:

            “As does a centred moving average.”

            Exactly! The centred average is at least candid about itself. It STOPS 2 1/2 years before the present. Moving averages aren’t that great for present-time monitoring, although they can be OK for historic data.

            The lag of the ordinary MA can be as much as the period.

            Assuming these are figures for something over a year,
            Averaged for five years…

            8 8 8 8 9 10 11 12 13 13 13 13 13 13

            * 8 8 8 8.2 8.6 9.2 10 10.6 11.8 12.4 12.8 13 13

            The actual series stops going up at the beginning of the first “13” and the MA stops going up at the end of the year of the fifth “13”: A five year lag.

          • bernie says:

            Those series are supposed to line up one above another. Dratted formatting in this forum!

  19. bernie says:

    ” It has nothing to do with ‘normal’ ”

    Which is why it is a poor word to use, as the literal meaning of anomalous is inded “not normal”. In early Greek it meant something more like “uneven” which is closer to the general idea.

    AN = not
    +HOMUS = one and the same, cf ‘homogeneous’

    Quibbling is not a sensible form of argument, but pointing out that words are freighted with innuendo is OK, I think.

  20. Toneb says:

    Ray says:
    January 4, 2014 at 10:17 AM
    The UKMO forecast it would be the warmest year on record,
    according to the WMO average.
    It looks like being joint 7/8th by that measure.

    I’m afraid not Ray….
    http://www.metoffice.gov.uk/news/releases/archive/2012/2013-global-forecast

    “Taking into account the range of uncertainty in the forecast and observations, it is very likely that 2013 will be one of the WARMEST TEN YEARS in the record which goes back to 1850, and it is LIKELY TO BE WARMER THAN 2012.”

    • Ray says:

      Weasel words!

      “with a BEST ESTIMATE of around 0.57 °C, according to the Met Office annual global temperature forecast. ”

      The highest so far, have been 2005 and 2010 at 0.54c.

      If the “best estimate” isn’t the forecasted temp., what is?

      What the MO say, implies that the “best estimate” isn’t the “best estimate”.

      The overall forecast was 0.43c to 0.71c, and even if the actual temp, is 0.5c it will still be in the lower 30% of the forecast range.

  21. Toneb says:

    Ray:
    Strange interpretation of language that..

    Since when does: “… it is very likely that 2013 will be one of the WARMEST TEN YEARS in the record which goes back to 1850, and it is LIKELY TO BE WARMER THAN 2012.” mean anything other than a forecast that 2013 will be within the top warmest 10 years?
    And further that it will be warmer than 2012?

    This post confirms that both measures are the case.

    And what it certainly doesn’t say is that “.. it would be the warmest year on record….”

    Which is what you said the UKMO said.

    I do wonder sometimes.

    • Ray says:

      The forecast NUMBER is 0.57c irrespective of what they said, which would make it the warmest.

      The words are vague and open to interpretation, the number isn’t.

      Given what they said, I would have expected the “best estimate” to be somewhere between 0.47c and 0.53c.

      I don’t think that 0.71c was ever a possibility.

      • BojanD says:

        Actually the numbers in isolation are more open to interpretation than words in this case, since 0.57c just means it is in the middle of the probability distribution. But I’m confused with the wording, too, since ‘top 10’ and ‘warmer than 2012’ should be about equal chance (very likely) because only 0.02c separates these two events. So why only ‘likely’ for the latter prediction?!

        MET actually did say that 2013 is likely to be the warmest year on record, but in this case ‘likely’ was deemed too confident by some climatologists:
        http://www.realclimate.org/index.php/archives/2013/02/2012-updates-to-model-observation-comparions/

        So we’ll probably have to wait for El Nino for a record breaker and the chances for this event are increasing.

  22. This web page is mostly a stroll-by for all of the information you needed about this and didn’t know who to ask. Glimpse here, and also you’ll positively discover it.

Leave a Reply