
 Home/Blog
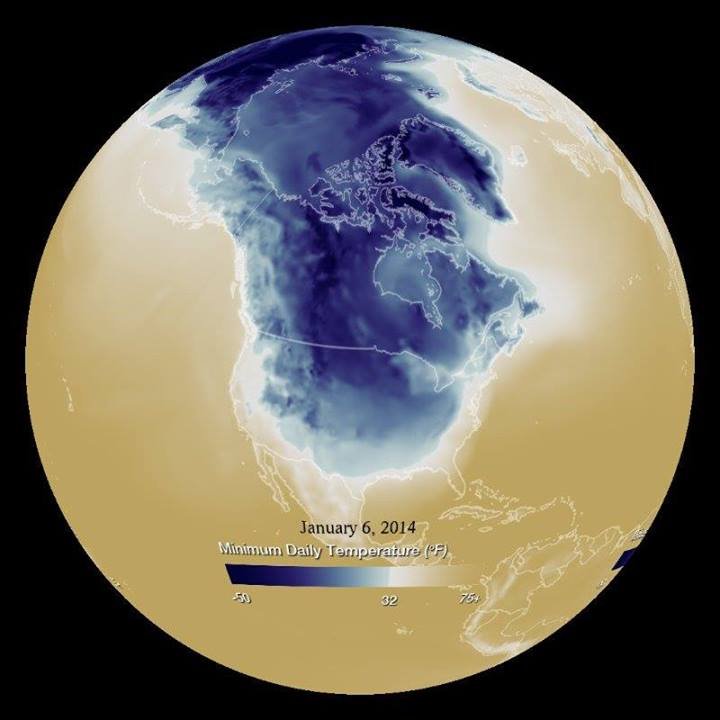
NOAA image of minimum temps on Jan. 6, 2014.
The winter months of December 2013 and January 2014 averaged over the contiguous 48 United States were the 3rd coldest Dec/Jan in the last 30 years.
The analysis is based upon ~350 NOAA/NWS stations that measure temperatures every 6 hours (or more frequently), many located at airports. This is different from the official NOAA temperature product (update not yet available), which is based upon daily max/min temperatures measured at 1,000+ co-op stations. Those stations have had large adjustments made due to (among other things) changing time of observation (TOBS) over the years.
Here’s a plot of the Dec/Jan averages for the last 41 years (click for large version):
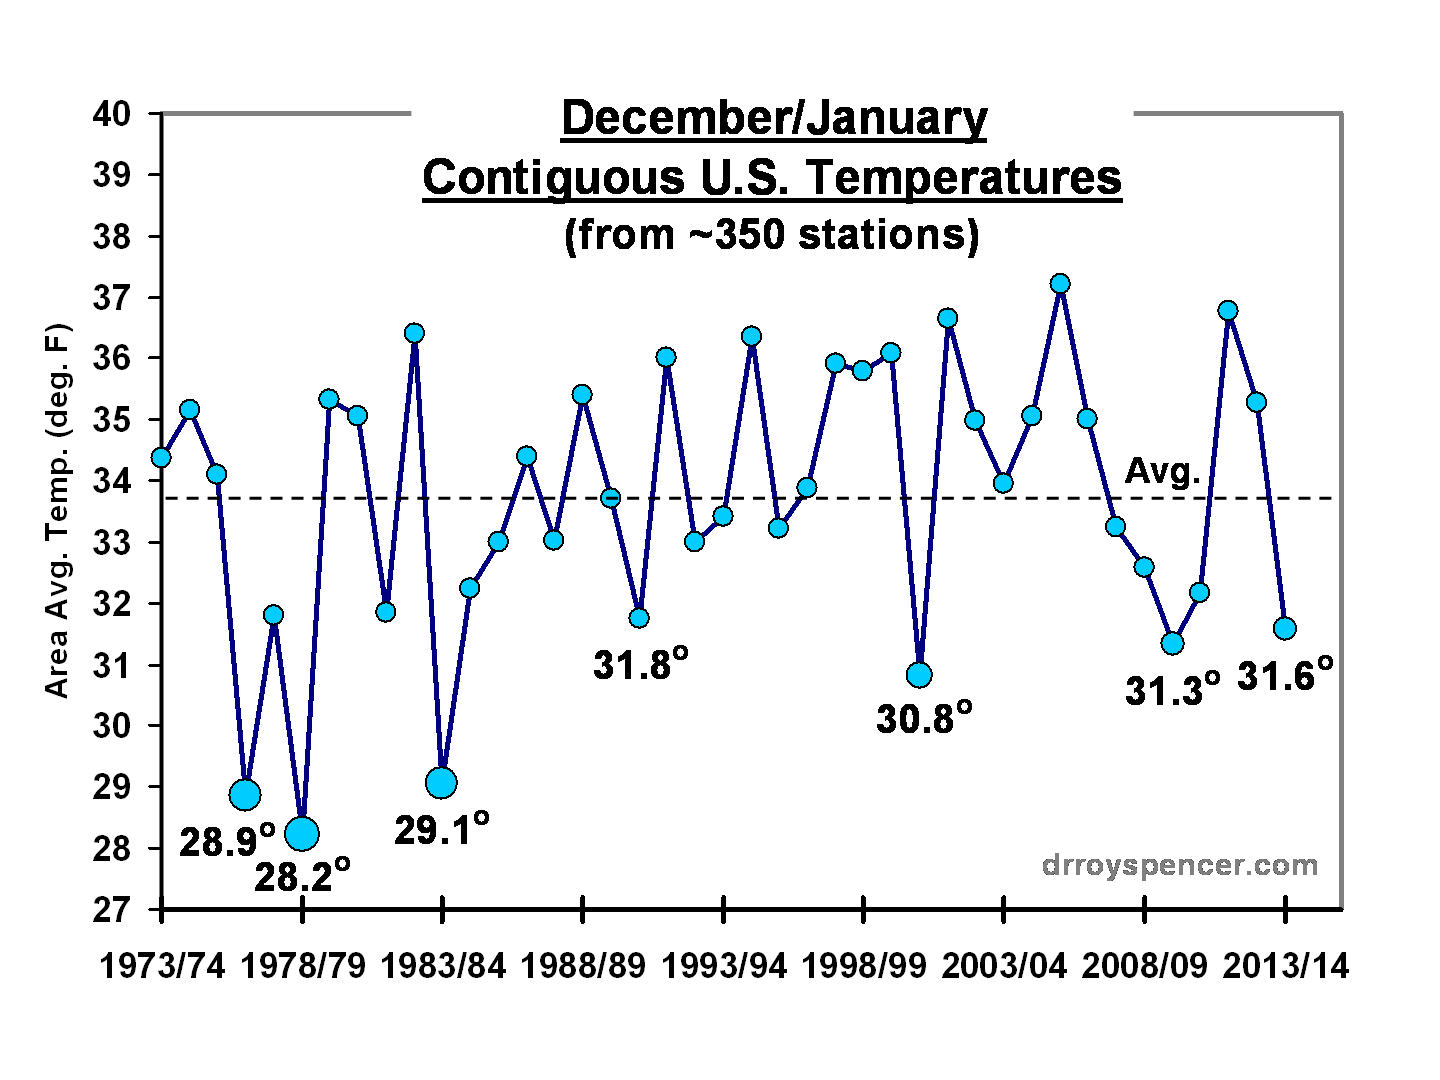
An interesting feature is that 5 of the last 7 years have been below the 41-year average, which has happened only one other time in the 41-year period.
The data I use are adjusted for average spurious urban heat island (UHI) warming that increases with population density around the thermometer site. That relationship is shown at the end of this article. The analysis starts in only 1973 since that is the first year with a large amount of quality-controlled 6-hourly temperature data archived at NOAA.
So, does the cold winter disprove global warming theory? No more than an unusually warm winter proves the theory. It’s just what we used to call “weather”.
UPDATE: John Christy has been running NOAA’s USHCN station data, and with a couple days still missing from the end of January, it looks like the official data will have Dec/Jan (’13/’14) as the 4th (rather than 3rd) coldest in the last 30 years.


