Home/Blog
The Version 5.6 global average lower tropospheric temperature (LT) anomaly for March, 2014 is +0.17 deg. C, unchanged from February (click for full size version):
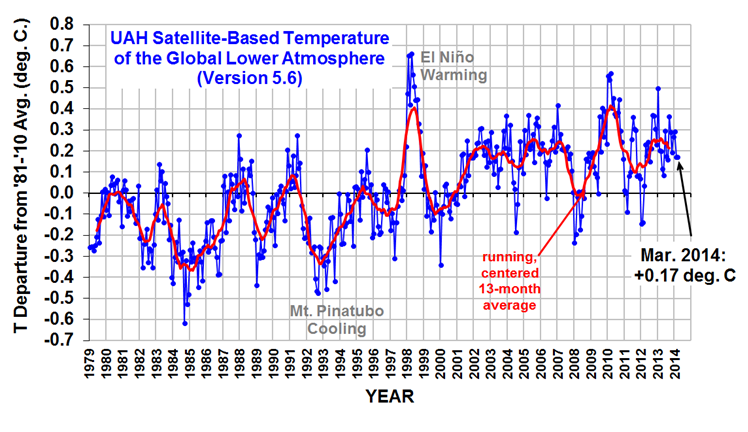
The global, hemispheric, and tropical LT anomalies from the 30-year (1981-2010) average for the last 15 months are:
YR MON GLOBAL NH SH TROPICS
2013 1 +0.497 +0.517 +0.478 +0.386
2013 2 +0.203 +0.372 +0.033 +0.195
2013 3 +0.200 +0.333 +0.067 +0.243
2013 4 +0.114 +0.128 +0.101 +0.165
2013 5 +0.082 +0.180 -0.015 +0.112
2013 6 +0.295 +0.335 +0.255 +0.220
2013 7 +0.173 +0.134 +0.211 +0.074
2013 8 +0.158 +0.111 +0.206 +0.009
2013 9 +0.365 +0.339 +0.390 +0.190
2013 10 +0.290 +0.331 +0.249 +0.031
2013 11 +0.193 +0.160 +0.226 +0.020
2013 12 +0.266 +0.272 +0.260 +0.057
2014 1 +0.291 +0.387 +0.194 -0.029
2014 2 +0.170 +0.320 +0.020 -0.103
2014 3 +0.170 +0.337 +0.002 -0.002
Potential 2014-15 El Nino Discussion
With the possibility of an El Nino developing later this year (still considered a 50% probability in the latest Climate Prediction Center discussion), there is the possibility of a new record high global temperature if the El Nino is sufficiently strong enough. I personally don’t think this is going to happen, because we are in the negative phase of the PDO (which favors stronger La Nina and weaker El Nino).
If El Nino does develop, peak tropospheric warmth as measured by the satellites tends to lag the surface warming. John Christy sent me this summary of past El Ninos during the satellite record:
82-83 peaked in Mar
86-87 peaked in Feb (86-88 was a weird one)
87-88 peaked in Dec
91-92 fouled up by Pinatubo
94-95 peaked in Apr
97-98 peaked in Apr (just above Feb)
02-03 peaked in Jan
04-05 peaked in Apr
06-07 peaked in Jan
09-10 peaked in Mar
Of course, an El Nino at the end of the record will increase the global temperature trend…at least temporarily…but El Nino is often followed by a cool La Nina, which would basically cancel out that effect.
The global image for March should be available in the next day or so here.
Popular monthly data files (these might take a few days to update):
uahncdc_lt_5.6.txt (Lower Troposphere)
uahncdc_mt_5.6.txt (Mid-Troposphere)
uahncdc_ls_5.6.txt (Lower Stratosphere)