UAH Global Temperature Update for April, 2014: +0.19 deg. C

May 6th, 2014 by Roy W. Spencer, Ph. D.

The Version 5.6 global average lower tropospheric temperature (LT) anomaly for April, 2014 is +0.19 deg. C, up slightly from March (click for full size version):
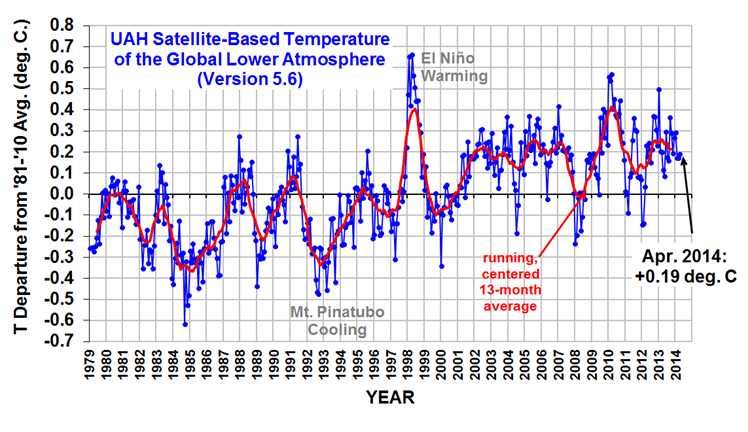
UAH_LT_1979_thru_April_2014_v5

The global, hemispheric, and tropical LT anomalies from the 30-year (1981-2010) average for the last 16 months are:

YR MON GLOBAL NH SH TROPICS
2013 1 +0.497 +0.517 +0.478 +0.386
2013 2 +0.203 +0.372 +0.033 +0.195
2013 3 +0.200 +0.333 +0.067 +0.243
2013 4 +0.114 +0.128 +0.101 +0.165
2013 5 +0.082 +0.180 -0.015 +0.112
2013 6 +0.295 +0.335 +0.255 +0.220
2013 7 +0.173 +0.134 +0.211 +0.074
2013 8 +0.158 +0.111 +0.206 +0.009
2013 9 +0.365 +0.339 +0.390 +0.190
2013 10 +0.290 +0.331 +0.249 +0.031
2013 11 +0.193 +0.160 +0.226 +0.020
2013 12 +0.266 +0.272 +0.260 +0.057
2014 1 +0.291 +0.387 +0.194 -0.029
2014 2 +0.170 +0.320 +0.020 -0.103
2014 3 +0.170 +0.337 +0.002 -0.001
2014 4 +0.190 +0.359 +0.020 +0.092

The global image for April should be available in the next day or so here.

Popular monthly data files (these might take a few days to update):

uahncdc_lt_5.6.txt (Lower Troposphere)
uahncdc_mt_5.6.txt (Mid-Troposphere)
uahncdc_ls_5.6.txt (Lower Stratosphere)


42 Responses to “UAH Global Temperature Update for April, 2014: +0.19 deg. C”

Toggle Trackbacks

  1. These four factors either combined or in some combination are responsible for all the climate changes on earth. If one agrees with this then one will also have to agree that global climate change is synchronous.

    MY FOUR FACTORS

    1. The initial state of the global climate.

    a. how close or far away is the global climate to glacial conditions if in inter- glacial, or how close is the earth to inter- glacial conditions if in a glacial condition.

    .

    2. Solar variability and the associated primary and secondary effects. Lag times, degree of magnitude change and duration of those changes must be taken into account. I have come up with criteria . I will pass it along, why not in my next email.

    a. solar irradiance changes

    b. cosmic ray changes

    c. volcanic activity

    d. UV light changes hence ozone /atmospheric circulation changes.

    e. ocean current changes due to atmospheric changes.

    f. ocean heat content changes.

    g. albedo changes due to snow cover, cloud cover ,precipitation changes.

    h. thermohaline circulation changes.

    3. Strength of the magnetic field of the earth. This can enhance or moderate changes associated with solar variability.

    a. weaker magnetic field can enhance cosmic rays and also cause them to be concentrated in lower latitudes where there is more moisture to work with to be more effective in cloud formation if magnetic poles wander south due to magnetic excursions in a weakening magnetic field overall.

    4. Milankovitch Cycles. Where the earth is at in relation to these cycles as far as how elliptic or not the orbit is, the tilt of the axis and precession.

    a. less elliptic, less tilt, earth furthest from sun during N.H. summer — favor cooling.

    • Don says:

      SDP: re your point 3.
      Earth’s magnetic field deflects lower energy solar wind around the Earth, concentrates higher energy coronal mass ejection and flare particles toward Earth’s magnetic poles, but it has little to no effect on high energy (GeV-level) cosmic ray particles. Those are deflected over the much larger breath of the solar system by the electromagnetic fields associated with the Sun and with charged particle outflow.

    • Aaron S says:

      So you don’t think CO2 has any impact? Seems extreme because it is a greenhouse gas and is dynamic. I think we are in agreement that the sensitivity is not what is claimed by IPCC, but I’m not sure how you eliminate CO2 as a factor.

      Just because CO2 does not initiate warming, does not mean that it is not a feedback- that logic is flawed.

  2. I am standing by this time will tell.

  3. One of the more significant aspects of the above discussion, which was demonstrated theoretically back in the mid-1960s by Manabe and Strickler, is that the cooling effects of weather short-circuit at least 50% of the greenhouse effect’s warming of the surface. In other words, without surface evaporation and convective heat loss, the Earth’s surface would be about 70 deg. C warmer, rather than 33 deg. C warmer, than simple solar absorption by the surface would suggest.

    Above from Dr. Spencer, and I think this is the basic reason why AGW theory is not going to work.

    In addition I am still waiting for data which shows CO2 rises first then the temperature follows.

    I think my thoughts are superior to AGW theory. Time will tell.

  4. Werner Brozek says:

    UAH for April for version 5.6 went up from 0.170 in March to 0.190 in April. If I assume version 5.5 will also go up by 0.02, then the 4 month average becomes 0.165. If it were to stay at 0.165, 2014 would rank 10th. The time for a slope of 0 would be at least 9 years and 8 months for version 5.5, but it could go back further.

    RSS for April came out at 0.251. That makes the 4 month average 0.222 and tied for 9th place. The length of time for a slope of 0 increases to 17 years and 9 months.

    (Hadcrut3 for March is still not out!)

    • David says:

      Why would you cite UAH v5.5 or HadCRUT version 3? They have been supersceded by better data models….

      • Objectivist says:

        If you’re going to claim there’s a better “model’ out there (in fact these are not models but measurements), at least provide a link or reference. These pesky measurements have surely been problematic for the beautiful models…

        BTW, it’s “superseded” /pedant

      • David says:

        Nope, they’re models. These models take in measurements, do a lot of analysis on them, and spit out a number that you have mistaken for a measurement, but which is really a model result.

        These algorithm notes from RSS v3.3 show the large amount of modeling involved in extracting temperatures from measurements of microwaves:

        http://images.remss.com/papers/msu/MSU_AMSU_C-ATBD.pdf

      • Werner Brozek says:

        Unfortunately, WFT does not use 5.6, so I have to use what they use as my computer skills are not the best. As for Hadcrut3, I am wondering if February was the last update there.

        • David says:

          Werner: Then you need to learn to do your own calculations.

          Otherwise you are just spouting numbers without understanding them, which is, frankly, the impression I get every time you give one of your lists of trends — lots of numbers, but no comprehension of what they imply.

          • Werner Brozek says:

            I could use WFT to find the slope for RSS is 0 for 17 years and 9 months. Or I could quote Lord Monckton and say the slope for RSS is 0 for 17 years and 9 months. Or I could learn excel or whatever the program is and also determine the slope for RSS is 0 for 17 years and 9 months. I do not see what difference it makes. It does not change the significance of the fact that the slope for RSS is 0 for 17 years and 9 months.
            One does not need to be a mechanic to be an excellent bus driver.

          • Tim Neilson says:

            David, if you don’t like facts you’re at liberty to frequent other sites which suit your desire for ignorance better.
            Werner, thanks for the effort you put into these calculations. Some of us are intelligent enough to appreciate the information for what it is and to do our own thinking about the implications.

  5. OF COURSE FALSE GLOBAL WARMING MAY COME FROM EL NINO A 100% NATURAL CLIMATE VARIABLE.

    • David says:

      Does that mean the cooling La Ninas are “natural” too?

      If so, what is the underlying temperature trend when ENSOs are corrected for? (See Foster & Rahmstorf, Env Reser Letters 2011.)

  6. RobR says:

    Roy,

    Is there something not too technical (I’m a BSME)I could read that explains how the UAH Global Temperatures are calculated and what they mean. Questions like: Is it the average of the air column from surface to 8 Km or from surface up 8 Km? How does the satellite sensor know the altitude of the reading? Does the data correlate with surface temperature readings? etc.

    Thanks

    Rob

  7. David says:

    This number means the UAH LT 5-year moving average is again at a record high….

    • Joe Freeman says:

      Wow…claiming a “record high” for a five-year moving average in a monthly dataset that only goes back 35 years? Seriously? You need a hobby.

  8. RW says:

    Thanks for the update.

  9. Michael Hauber says:

    Two AGW predictions on current and near future UAH temperature.

    1) ENSO Conditions are currently neutral. The fastest trend prior to the current ‘pause’ can be found with a finish date of Aug 2007 and is 0.149 deg/decade. Continuing this trend and assuming no ENSO impacts on temperature, or any other impacts would ‘predict’ a temperature of 0.28 for April 2014.

    2) Global warming is occuring at 0.2 deg/decade. The temperature can be predicted by finding analog ENSO years, adding 0.2 deg/decade to each year to convert to 2014 equivelant and averageing all the analog year results. The analog years are 1982, 1986, 1997, 2002, 2006, 2009. These are chosen as years that started off with an cool/neutral ENSO state and developed into a significant El Nino during the year. The result is a prediction of 0.298 in April. The temperature is expected to hover around 0.3-0.35 up to October, before climbing to 0.425 in December and 0.64 in January and then slowly dropping through 2015. The average for 2014 would be 0.35, and for 2015 0.53, compared to the 12 months of 1998 averaged to 0.42.

    • PeterB in Indianapolis says:

      Using the slope of the UAH dataset since 1979, the rate is 0.14 degC/Decade, not the 0.2 DegC/decade that you state.

      • Michael Hauber says:

        Sorry I should have stated that the 0.2 deg/decade is a rate roughly consistent with what is predicted by the models/IPCC projections, and the purpose of the prediction is as a test – if we assume that 0.2 is the true rate of warming, and the 0.14 is the result of noise/variation/whatever, then what would we predict the temperature to be later this year.

  10. Thanks for the update, Dr. Spencer.
    I am showing it in my climate and weather pages (English and Spanish).

  11. John K says:

    Hi Michael Hauber,

    You claim: “Global warming is occuring at 0.2 deg/decade.” You seem to arrive at this claim by averaging years with large temperature increases like 1997-8. Do you believe this relevant for all data sets? Please clarify.

    Thanks and have a great day!

  12. John K says:

    Hi Roy,

    Please accept my apology for any immoderate comments.

    Have a great day!

  13. Eli Rabett says:

    Your statement on #3 contradicts itself.

    3. Human-induced climate change is projected to continue, and it will accelerate significantly if global emissions of heat-trapping gases continue to increase. Heat-trapping gases already in the atmosphere have committed us to a hotter future with more climate-related impacts over the next few decades. ………

    This is a predictive statement based upon climate models which have not even been able to hindcast past global temperatures, let alone forecast changes with any level of accuracy.

    The relationship of higher greenhouse gas concentrations to an increased greenhouse effect and thus hotter surface temperatures is beyond rational doubt. Anyone (including Dr. Roy) claiming that this will not happen has to invoke a:) majic or b:( a model of future responses.

    If you don’t like models you have no basis for believing that it will not warm. Much of the rest of your wishful thinking fails on the same basis

    • Eli Rabett says:

      Sorry, put this in the wrong place. Ooops.

    • PeterB in Indianapolis says:

      Eli,

      Sorry, this is not “beyond rational doubt”. Most feedbacks have been shown to be negative rather than positive, so it looks like the climate sensitivity to increases in CO2 is MUCH smaller than the value used in the models. In fact, it may well turn out that if the feedbacks are sufficiently negative the climate sensitivity value for CO2 may be as close to zero as makes no statistical difference.

      I don’t debate the fact that CO2 absorbs and re-emits photons. Everyone who has had at least basic physics and chemistry knows this. I also don’t debate that IN THE ABSENCE OF OTHER FACTORS this can cause a reduced rate of heat loss. However, the atmosphere and the global climate system are so vast and so complex, and about 95% of the variables involved are probably not even KNOWN yet, much less well understood, so the effect of increasing CO2 in the system is still virtually unknown (in reality). Unfortunately, all of the GCMs have little to nothing to do with actual reality, which was precisely Dr. Spencer’s point.

  14. David my solar parameters have not been reached for the past few years, once they are reached and sustained then you can say I am wrong if temperatures should continue to go up.

    Until then it is just wishful thinking on your part.

    David says
    Does that mean the cooling La Ninas are “natural” too?

    Yes David, and this is why when all other climatic items are NEUTRAL , ENSO rules.

    I said other climatic items , because CO2 is increasing at a very fast rate and is not neutral but is having NO effect on global temperatures. Then again is CO2 a climatic item? It is not looking that way at least for some 17 years.

    David says,

    False. Time will tell if time will tell, and you have no evidence otherwise

    David you on the other hand have NO evidence to refute my thoughts, as to what controls the climate of earth.

  15. Av Monthly EUV .1-50 nm Flux Emissions – International Actuarial …

  16. The above is the latest research on solar/climate connections.

    Something David should look at.

  17. May 7, 2014 at 10:16 AM

    A rare case of good correlation between CO2 levels and temperature is provided by ice-core records of the cycles of glacial and interglacial periods of the last million years of so. But these records show that changes in temperature preceded changes in CO2 levels, so that the levels were an effect of temperature changes. This was probably due to outgassing of CO2 from the warming oceans and the reverse effect when they cooled.

    The most recent continental ice sheets began to melt some twenty thousand years ago. During the “Younger Dryas” some 12,000 years ago, the earth very dramatically cooled and warmed by as much as 10 degrees Celsius in fifty years.

    The above a small piece of an article on climatedepot.com web-site.

    Note all records show temp. changes proceed CO2 changes.

    Past data shows climate change in the past far exceeding anything we currently have now. It is not even in the same ball park.

  18. Max Dupilka says:

    I am just curious as to how the temperatures are calculated. Could anyone offer some information or point me to a reference. Nothing sinister here, just curiosity as to what I am actually looking at. Thanks.

  19. D J says:

    I saw someone post that chart on a blog. Seems as if someone had posted an earlier version of that chart, and a guy alleges that the chart shows 3.6 degrees Celsius warming over its entirety.

    Quote him:

    I finally had enough and input the data from “http://www.drroyspencer.com/wp-content/uploads/UAH_LT_1979_thru_January_2014_v5.61.png” and did a least squares on it. The slope of the data is +0.102 deg C/year. Overall the graph shows a warming of 3.6 degrees C over the 36 years of this graph.

    ++++++++++++++++++++++++++++

    Thanks for any help.

  20. Peter Chapman says:

    I have been looking at these graphs every month for several years but never got around to asking this question. What does the sinusoidal pattern with a period of about 5 years represent? I can’t remember anyone ever discussing it.

  21. ray says:

    “… 3.6 C …”

    a typo obviously for “0.36 C”.

Leave a Reply