Boatside Report on Lake Superior Ice

June 6th, 2014 by Roy W. Spencer, Ph. D.

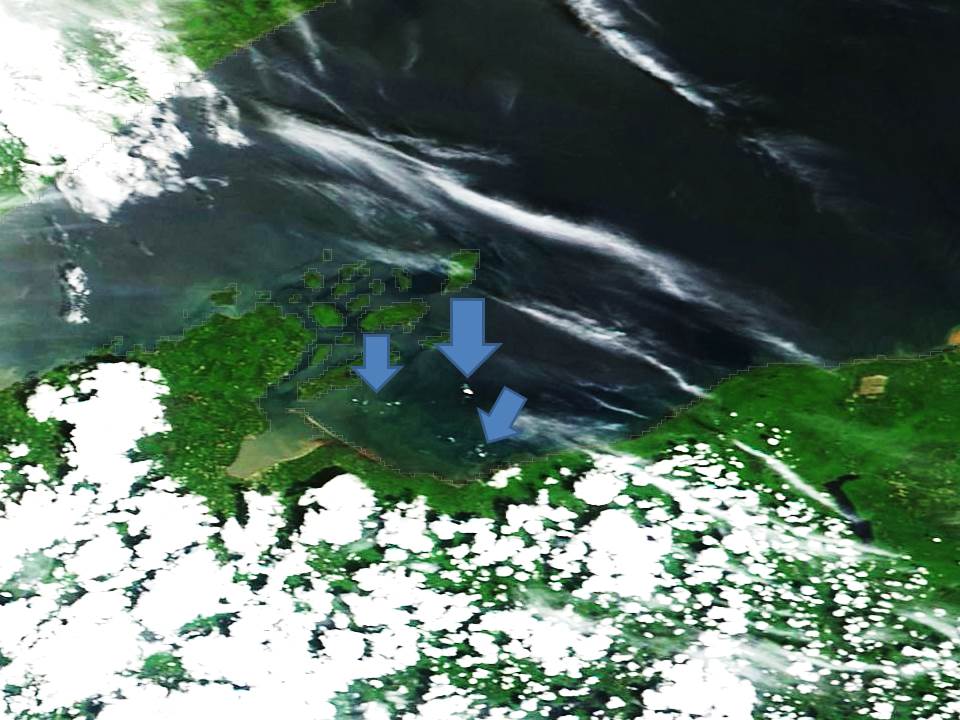
As of June 5, 2014, the only ice on Lake Superior that remains clearly visible in the 250 meter resolution MODIS satellite data are several bergs northeast of Ashland, Wisconsin:

ice-rafts near-Ashland-June-5-2014

I contacted Mark Vinson at the USGS Great Lakes Biological Station, in Ashland, Wisconsin, to see if anyone has gone out to take photos of the remaining ice rafts on “the big lake they call Gitche Gumee“.

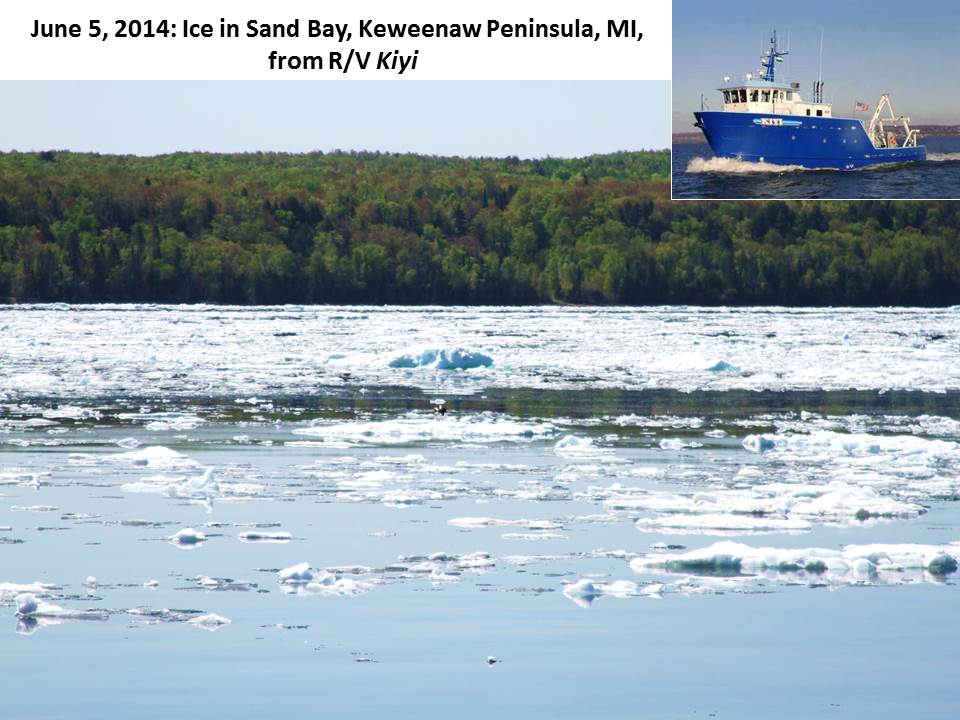
It turns out Mark is out on the lake for their month-long nearshore fish community survey, done every year on R/V Kiyi, now heading east towards Marquette. They are also taking some photos of the remaining ice, much of which is hugging the shore and apparently is not visible in the MODIS satellite imagery.

For example, here’s a photo of icebergs in Sand Bay, in the Michigan’s Keweenaw Peninsula, taken from the Kiyi yesterday:
Lake-Superior-ice-Sand-Bay-MI-June-5-2014

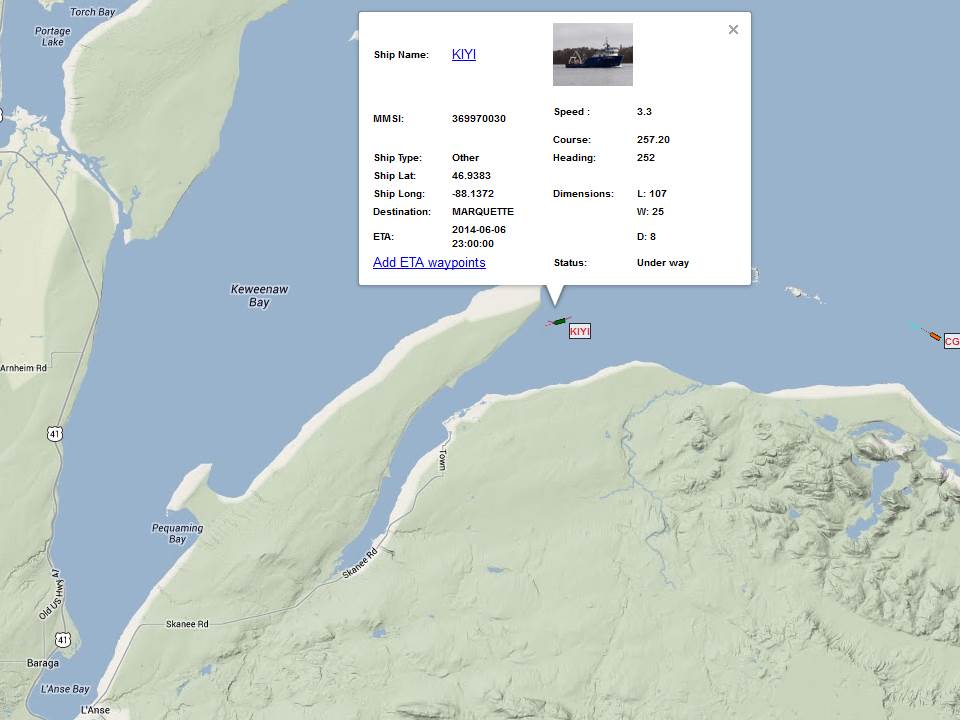
You can monitor the location of R/V Kiyi in real time with this great Google Maps tool Great Lakes & Seaway Shipping Online Vessel Passage Maps. Here’s its current location:
RV-Kiyi-location-June-6-2014


19 Responses to “Boatside Report on Lake Superior Ice”

Toggle Trackbacks

  1. Dr. Dotsen says:

    Must be where all the Arctic ice went. Cryosphere Today shows all time low levels for this date (again).

  2. ossqss says:

    Web cams are available in that link for online vessel passage. I can’t seem to find any with a PTZ capability 🙁

    Then again, the only ice I want to see in the summer is in a glass.

  3. Scott says:

    Nop,

    Cryosphere today has year 2010 as 9.79 million square Km.
    2014 is 9.80 millin square Km today.

  4. georgewilliams says:

    Dr Spencer,

    I am in Huntsville and have sent email to you to invite you to speak in Madison Saturday 28 June. It appears that you are collecting data on Lake Superior. If you will be back home by the 28th, please consider us. Mr Obama is making your presentation on Climate Change very appropriate and timely. Good luck.

    George Williams

  5. ossqss says:

    Well since it seems kinda slow here.

    Does anyone buy into this release from NASA?
    http://youtu.be/7d3t1_l4bcw

    • Gordon Robertson says:

      @ossqss “Does anyone buy into this release from NASA?”

      NASA should stick to what they do best, launching rockets.

      Teleconnections between clouds in the Arctic and the Antarctic??? NASA seems to be dabbling in quantum nonsense.

      They don’t explain the physical connection, they imply an unexplained ‘teleconnection’ that is based purely on statistical analysis.

      Tsonis et al have already used statistical analysis to prove that ocean oscillations are affecting global warming and climate. NASA ignores that study of real, physical, matter and follows a sci-fi connection that cannot be explained by any science.

      • ray says:

        “…the physical connection…”

        It takes about ONE YEAR for air in one hemisphere to mix with the other’s air. Let alone, get involved in subtle cause and effect relations!

        We seem to be waiting a long time for the update on the May temperatures from UAH.

        • Gordon Robertson says:

          @ray “It takes about ONE YEAR for air in one hemisphere to mix with the others air”.

          I was not talking about air mixing, Ray, I was talking about their inference that it happened by teleconnection.

          In case you’re not up on current quantum theory jargon, a teleportation is the science fiction for an action at one place affecting the reality of another place. I’m sure that if they examined the problem more closely they would find perfectly good explanations in current physics outside of quantum theory.

          As I interpret the article, they are claiming a statistical correlation between temperatures in the Arctic and those in the Antarctic. Reading deeper, they seem to be inferring that it is done by some sort of teleportation, not by air mixing naturally.

  6. I am sure this piece of writing has touched all the internet
    viewers, its really really fastidious post on building up new
    blog.

    My homepage – combat arms nx generator 2014

  7. Aaron S says:

    I feel like a drug addict, I keep checking the page multiple times a day anticipating the May data, and I need my fix!!! These are exciting times because of the possibility of an El Nino creating a natural spike in temperature.

  8. ray says:

    “…a natural spike in temperature…”

    Of course, such spikes, noticed in space, actually indicate a minor, local, COOLING of the sea. It is like opening an oven door; you suddenly feel the heat and say “wooh!”

    I just “Googled” “El Nino update” and came up with the following:

    “A newly released report from the Climate Prediction Centre indicates an El Nino may be developing…” (10 Hours ago).

    “El Nino may be ending, says Australian Met Bureau…” (21 Hours ago.)

    You gotta larff.

  9. bernie says:

    To add to the party, NASA is predicting something they call
    “El Wimpo”. That is an El Nino which is hardly there at all.

  10. ray says:

    The 7-inch-high slosh of warm water is there (off South America), but the winds haven’t kicked in like they are supposed to do. A Huang transform of Dr Roy’s data shows a clear El Nino/La Nina oscillatory effect; but the effect has been strong just twice, in the 35 years of satellite data.

    The howls of triumph and one-finger salutes from the AGW trolls will have to wait a little longer.

    As for “waiting for one’s monthly fix”, one does. But it is not really logical since the “Noise”-to-“Secular Signal” ratio in the Monthly data is about 200 to 1!

  11. bernie says:

    “…Secular Signal…”

    A variable-parameters regression on time, for the Data, shows a present upward drift, or trend, or random walk artifact (take your choice) of one two-thousandth of a degree per month.

  12. Aaron S says:

    I agree that watching each month is meaningless, but the AGW crew is calling for a massive el nino to “catch up” with the models. My thoughts are that the climate system just shifted when the sun’s activity declined and el ninos will be less frequent and of less strength. Btw i did some calculations and a 97/ 98 like el nino is not strong enough to catch up at this point. So this one would be very obvious if the agw is correct (BIG IF).

  13. ray says:

    “…not strong enough to catch up…”

    I presume you are thinking of some average for the whole year.

    I notice that RSS have a highest (anomaly) – in 1998 –

    = + 0.86 K

    and their May figure is

    + 0.28 K.

    So there is some way to go, to exceed the 1998 peak, on their reckoning.

    Even so, of course, + 1 K is not going to rapidly melt much of the accumulated 36 million cubic miles of ice in Antarctica*. I am old enough to remember the original sales pitch, thirty years ago: Global Warming matters BECAUSE it will melt this or that. There was NEVER any suggestion, at the time, that a degree or two of extra warmth was IN ITSELF. After all, it would be STOOPID to think that, right?

    * “latest computer models” predict an immediate effect of global warming to be 50 years of intensified snowing down there!

  14. ray says:

    “IN ITSELF…” should be “IN ITSELF HARMFUL…”

  15. bernie says:

    “…melt…Antarctica…”

    Kind of hard to do, when the sun disappears and temperatures drop to – 90 C, every winter!!!!

    Incidentally, RSS shows a COOLING trend for what they call the Southern Polar region (up to 70 S) over the last 40 years, of 0.013K per decade.

Leave a Reply