
 Home/Blog
(This post supercedes yesterday’s post, in which I used the unadjusted USHCN temperature data. The conclusion remains the same with the adjusted USHCN data…the official Las Vegas temperature record contains a large urban heat island warming effect which is spurious to the climate signal.)
As many of you are aware, Heartland’s 9th International Conference on Climate Change (aka the “skeptics conference”) will be held in Las Vegas, Nevada during July 7-9, 2014.
Anthony Watts has already posted some July temperature statistics for Las Vegas…basically, it’s really hot there in July.
What is notable about the “official” surface temperature record there is the strong urban heat island (UHI) effect which still remains in the USHCN data.
This can been seen from the raw temperature data, which shows that daytime warming has been modest and nighttime warming has been strong (over 3 deg. F since 1973), whereas the official, adjusted USHCN Tmax and Tmin trends are even warmer than the raw temperature trends, even at night, and are equal to each other:
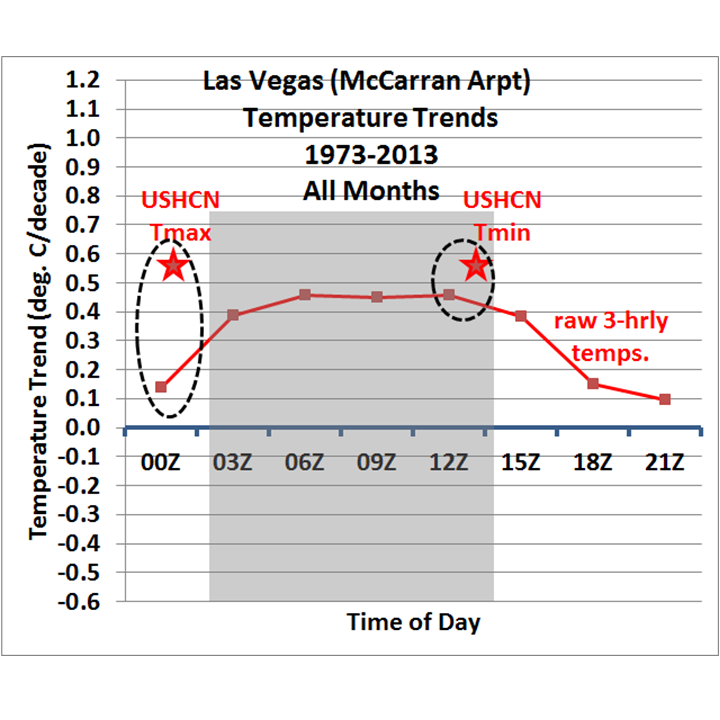
Fig. 1. Las Vegas temperature trends during 1973-2013 (all months) from raw 3-hrly temperatures versus USHCN adjusted temperatures. Shading represent nighttime hours.
No matter what instrumentation changes occurred in the raw temperature record, there is no way they cause a nighttime bias that large compared to the daytime (speaking as a former certified aviation weather observer). The USHCN plot provided by Anthony shows 10 deg. F (!) of nighttime warming since the late 1930s, which is simply not a credible representation of the non-urban environment.
The most logical explanation for the raw 3-hourly temperature differences between day and night is related to the dramatic growth Las Vegas has experienced in the last 40 years. The number of visitors has skyrocketed from 8 million in 1973 to about 40 million today, a factor of 5 increase. The population has increased by a factor of about 6 or 7.
All of this translates into more waste heat from air conditioning, plus more artificial surfaces which warm faster than natural surfaces. If you doubt this for even the natural desert surrounding Las Vegas, look at the Landsat IR thermal imager data in this report.
During the day, the extra heat can mix convectively through a pretty deep layer of the atmosphere, which limits the daytime warming. But at night, the nocturnal inversion traps heat, magnifying the UHI effect.
If we just focus on the month of July, the results are roughly similar to the full-year results:
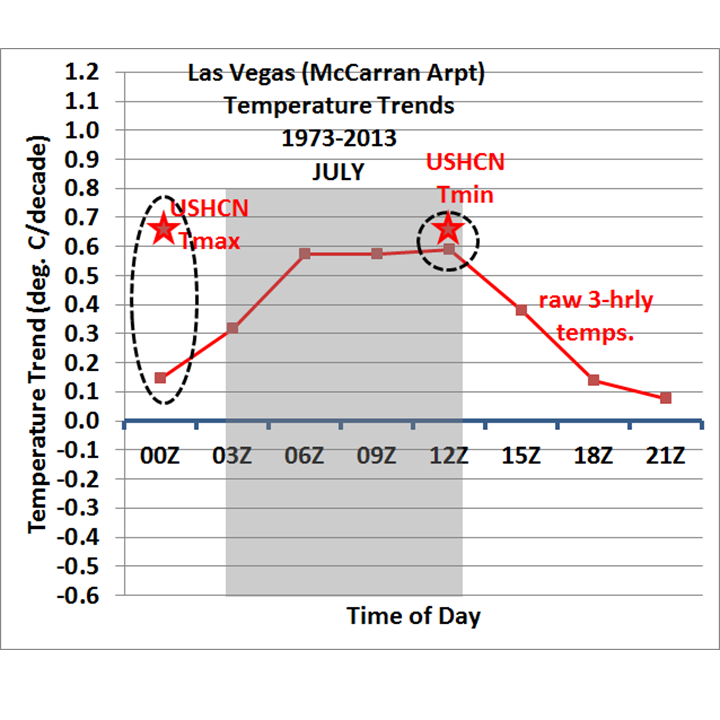
Fig. 2. As in Fig. 1, but just for July.
It appears that the “homogenization” adjustment performed on the USHCN data has inadvertently used the spurious nighttime warming as truth, and made the daytime warming match it. Given what we know about how urban environments retain heat at night, the exact opposite should have happened. In fact, given that there should also be an urban warming signal during the day, it might well be there has been no real climate-related warming in Las Vegas in the last 40 years.
The net result is that the official (adjusted USHCN) Las Vegas warming trends appear to be dominated by local urban heat island effects.


