The SSM/I and SSMIS series of microwave imagers, operating since July 1987, provide global oceanic measurements of total vertically integrated water vapor, cloud water, rain rate, and surface wind speed. These are useful for studying how the maritime atmosphere varies due to El Nino and La Nina, as well as provides ~27 year trends for climate change studies.
The best place to start is with what the SSM/I instruments can’t measure, which is sea surface temperature. Here are the monthly global (60N-60S) average SST variations since 1987:
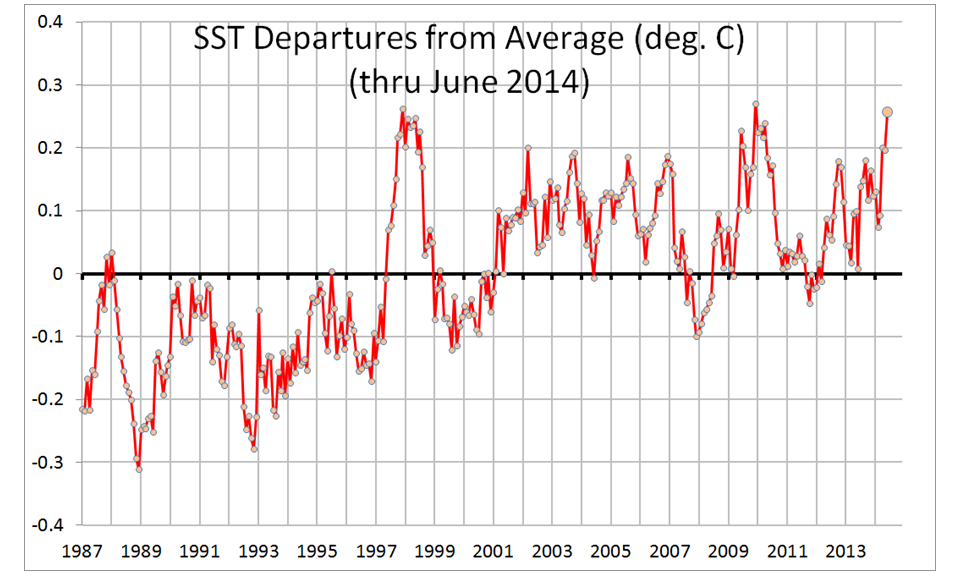
As can be seen, there has been net warming of the ocean surface since 1987, a relative “pause” in the warming trend since the 1997-98 El Nino, and the global SST value for June 2014 was near a “record” high.
The SSM/I integrated water vapor measurements provide a powerful check on the SST measurements, since water vapor is tightly coupled to SST:
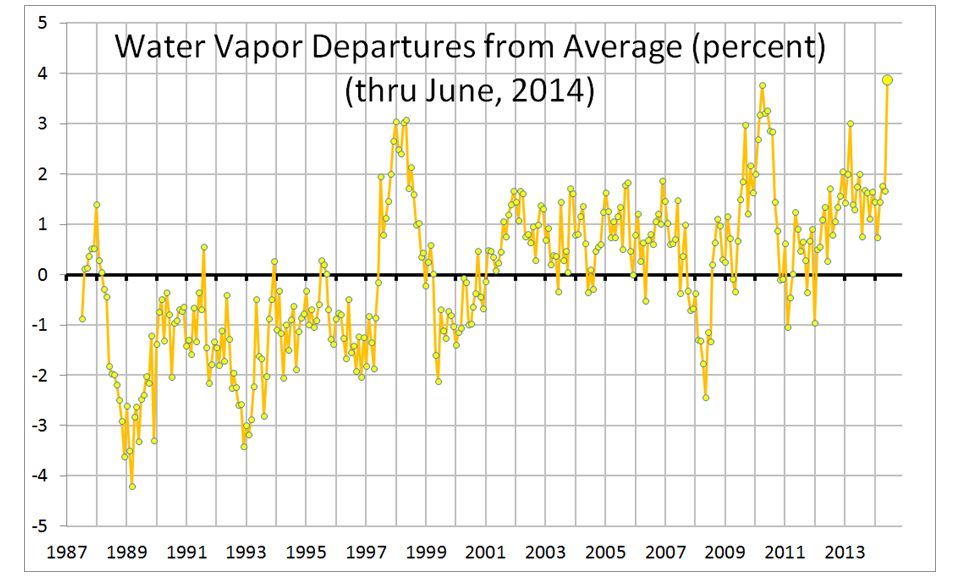
Note that the SSM/I integrated water vapor was at a record high in June, 2014, probably the result of the developing El Nino.
If we compare the SST and water vapor variations, the quantitative relationship between them is about ~11% water vapor increase per deg. of SST increase:

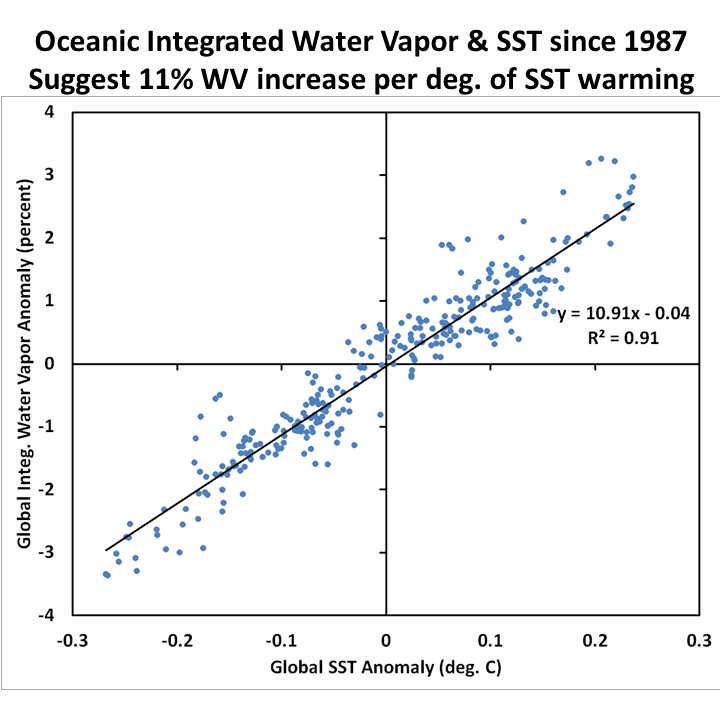
Fig. 3. Scatter plot of the SST and water vapor in Figs. 1 and 2, with a 1 month time lag (vapor after SST).
I have included a 1 month time lag in the plot (vapor after SST), which maximizes the correlation. The 11% per deg. relationship is considerably greater than the 7% per deg. expected from the assumption of constant relative humidity. Why? I’m not sure, but I suspect it might be due to a change in the vertical distribution of vapor with height during warming. If the falloff of specific humidity with height becomes steeper with warming, the water vapor retrieval Frank Wentz uses will overestimate the amount of water vapor. This explanation would also be consistent with radiosonde evidence of a multidecadal decrease in mid- and upper-tropospheric water vapor, and potentially neutral (or even negative) water vapor feedback.
The SSM/I cloud water remains high, as it has in recent years…several percent above most of the period record:
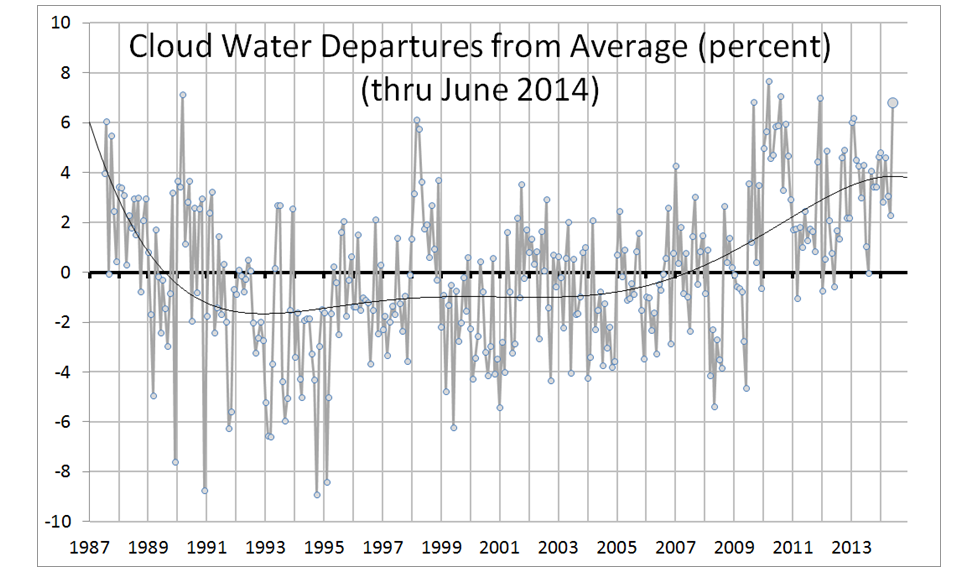
As I have blogged about before, there is a correlation between the SSM/I cloud water and the CERES net radiative flux variations, so the recent elevated cloud water amounts lead to less sunlight entering the oceans, which is consistent with the recent hiatus in warming.
The SSM/I oceanic rainfall has increased in recent years, but I’m not sure how much of this is real or is due to residual algorithm cross-talk from the cloud water signal, since cloud water has also increased:
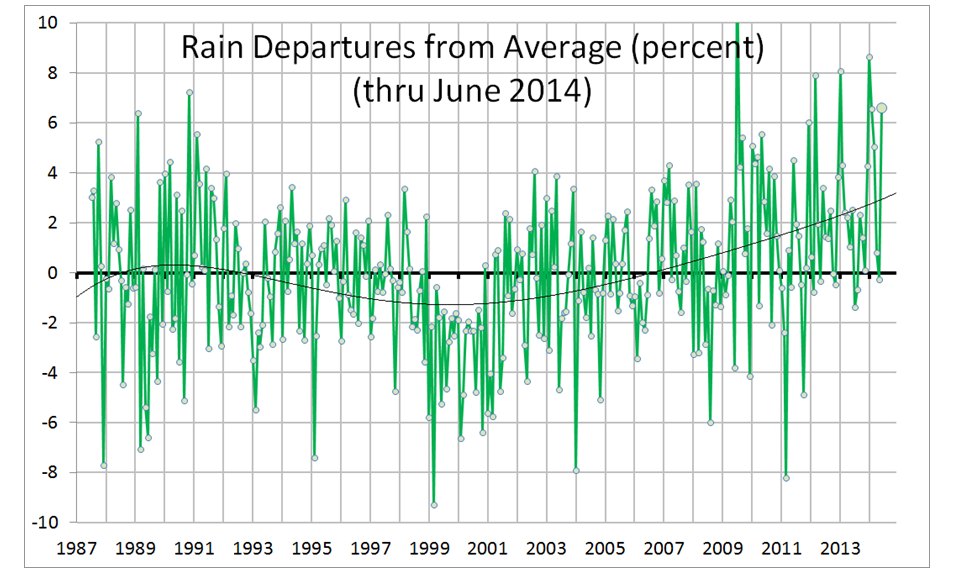
Finally, the SSM/I ocean surface wind speed anomalies suggest that the ~2% increase in winds after the 1997-98 El Nino seems to have ended…although going into El Nino conditions will also produce reduced wind speeds:
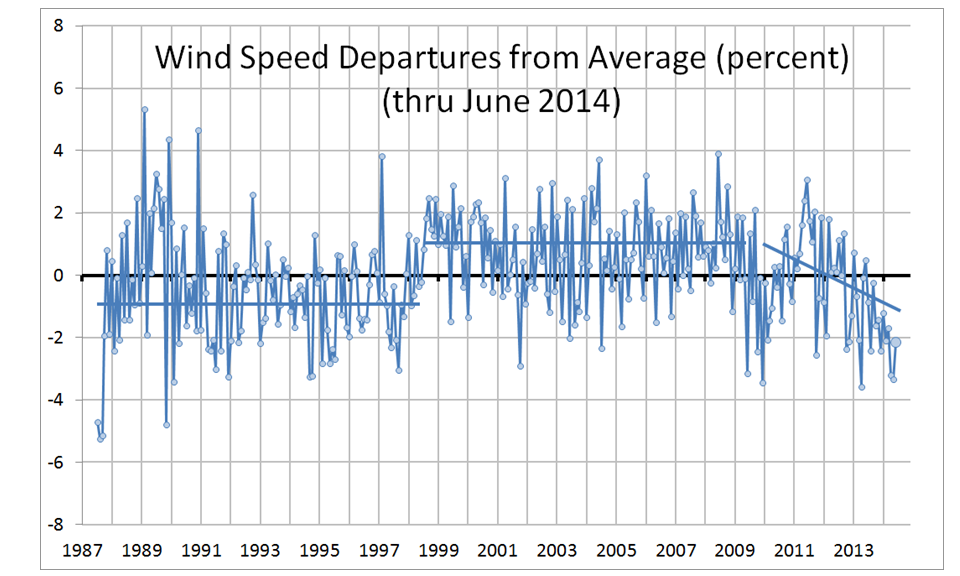
As I have mentioned before, I believe this wind speed record is the most accurate one in existence. I find it hard to believe that a 2% increase in winds caused (as Trenberth claims) the warming pause and increased heat storage in the deeper ocean. If it did, it looks like that effect should have gone away in the last few years.
I personally think that the increase in UV radiation is the big bad creature in the game.
Farmers tell me that in the past they could stay in the sun much longer than these days.
Higher UV radiation also means deeper penetration. Is it the sun or does the atmosphere gives us less protection I don’t know. Everybody talks about CO2 but maybe it is the large consume of O2 which plays a major roll in the warming.
http://www.aemet.es/es/eltiempo/observacion/radiacion/ultravioleta?l=barcelona&f=anual
Barcelona, the place where I live is in summer mode since may.
Hi Roy,
You stated regarding SST’s:
“As can be seen, there has been net warming of the ocean surface since 1987, a relative “pause” in the warming trend since the 1997-98 El Nino, and the global SST value for June 2014 was near a “record” high.”
In addition, if one considers SST’s by focusing on the temperature wave troughs the general increase seems clear enough from 1989 to ~2002. From ~2002 to ~2007 SST’s seem to slide back down only to increase again from ~2007 on. Assuming the data gives an accurate portrait of SST’s over the period the overall general warming pattern appears solid enough.
Have a great day!
RobertV, It can’t be said enough on here, the surface warming observed over the last 60 years has GHG warming fingerprints all over it. The variation in solar input vs the GHG forcing is small. And current solar input has been average to below average at best. Then consider the overall dimming from aerosols. Please just let the “it’s the sun” meme rest in peace.
Here is a link to the most up to date forcing values showing solar variation in context to other forcings, both positive and negative.
Look at Figure 2.
http://theconversation.com/ipcc-climate-trends-blueprints-for-tipping-points-in-earths-climate-18706
There is no GHG fingerprint…except maybe cooling in the stratosphere ( if you include natural GHG changes, too).
You also forget natural, low frequency changes in cloud cover modulating the solar input into the ocean. It is pure faith to assume the Earth’s cloud cover strictly limits the amount of sunlight absorbed year after year to the same value, decade after decade, at the 0.1% level.
If it’s clouds, isn’t there some feed back warming from clouds back to the ocean? Mainstream climate science seems to say that clouds are a big unknown, but best we can tell, it’s a wash.
“It’s the sun stupid” http://sciencespeak.com/climate-nd-solar.html
CC Squid,
In fact, even if one gives great credit to CO2 forcing we humans apparently shoveling so much CO2 into the atmosphere do so with energy provided in significant part by the sun.
Have a great day!
If it is not the sun, why does it get colder in the evening? Why does it get cooler when clouds develope during the day? http://www.drroyspencer.com
Do you know any Spanish? What does El Niño mean to you?
And finally the following post:
DEEP OCEANS ARE COOLING AMIDST A SEA OF MODELING UNCERTAINTY: http://www.thegwpf.org/deep-oceans-are-cooling-amidst-a-sea-of-modeling-uncertainty/
CC Squid, how about citing a legitimate source. Variation in solar energy is different from stating that obvious fact that the sun is adding essentially all of the energy to the planet. It’s a question of the rate at which energy is escaping that matters, considering how constant incoming solar energy is. You could state it as the following: If the earth were gaining energy from GHGs trapping heat, what kind of changes would we observe? Current research in deep ocean heat content, sea level rise, surface warming, snow cover decline and glacial melt all unanimously confirm a warming due to GHG. Again, taking into account aerosols and reduced solar variation, the plant should be cooling based on solar variation.
Why does it get colder in the evening? Why don’t you ask “why do animals eat food” or “why did 2 months of no rain kill my garden plants”. The questions are just as simple minded and dishonest in this kind of format.
For anyone interested in a summary of respected, published peer review science, look at figure 2 in the link below from the 2013 IPCC report showing all major climate forcings.
http://theconversation.com/ipcc-climate-trends-blueprints-for-tipping-points-in-earths-climate-18706
bassman… I agree with you, cite a legitimate source ALWAYS…. so, could you please do so too? (tip: anything with IPCC behind it, is not)
Bassman, Dr Spencer oft says ghg warming has no “fingerprint”. I’ve always been unclear on this point. Any idea as to what he’s getting at? For that matter, what EXACTLY are you getting at?
you cannot tell the difference between warming due to GHGs versus due to, say, a small decrease in clouds letting more sunlight in. The IPCC’s use of “fingerprint”, as far as I can tell, is only related to stratospheric cooling. But stratospheric cooling (even if it is due to CO2) does not prove tropospheric warming is due to CO2. The stratosphere is much simpler place physics-wise than the troposphere.
Here are the monthly global (60N-60S) average SST variations since 1987 ….June 2014 was near a “record” high
Note that the SSM/I integrated water vapor was at a record high in June, 2014, probably the result of the developing El Nino.
I believe it is not necessary to talk about the El Nino in this regard. The Hadsst3 actually did produce a very clear record when going beyond the 60 degrees. The June 2014 anomaly was 0.562 which is quite a bit higher than the previous record of 0.526 in July of 1998.
Robertv says:
July 23, 2014 at 11:57 AM
I personally think that the increase in UV radiation is the big bad creature in the game.
The last couple of years down under in Aus in winter, I have noticed the same thing – the sun actually stings the skin, a totally different feeling than hot sun. Are we missing something here? Have the UV ratios changed or is something else getting through the atmosphere.
60 n to 60 s is incomplete data.
Which is the trouble in this field, incomplete and not accurate data and different sets of data for the same data.
A wonderful example is the temp. anomaly for the globe according to Weatherbell Inc. versus Dr. Spencer’s satellite data.
I have asked why and no one has responded.
Weatherbell showing deviations around .07 c versus .30c or so for satellite data recently.
What the co2 driven global warming advocates don’t discuss is that if the ocean has started eating global warming since the trade winds changed during the negative phase of the ocean’s ~60 year multi-decadal cycles, they also emitted excess energy during their positive phase from 1975-2005. The implication is that the oceans are capable of storing energy on long timescales, and releasing it on long timescales too. And they store a lot of energy. The top two metres alone contain as much energy as the entire atmosphere above.
We know that the oceans keep the air temperature up over night as the release some of the energy the Sun poured into them during the day. We also know that there is a lag of a couple of months between the longest day of the year and the peak in surface air temperatures near coasts. This is thermal inertia and heat capacity at work. On longer timescales, we have recently confirmed that runs of El Nino events which release a lot of energy from the oceans are initiated on the falling side of the solar cycle, never on the upswing.
So we can go a stretch further and combine what we know. When solar activity falls, energy comes out of the ocean, not just over the period of the decline of a single 11 year solar cycle, but if the Sun stays low in activity terms, for many years. An integration of the sunspot number shows us that the ocean heat content rose all the way from 1934 to 2003. This is the real cause of ‘global warming’. A lot of excess energy is still retained in the upper ocean. We can expect the effect of a couple of low solar cycles to be softened by a proportion of that excess heat returning to space via the atmosphere warming it on the way.
In developing my understanding of the Earth’s systems, I developed a couple of very simple models to help me fathom the way the surface temperature stays fairly constant as the solar cycles wax and wane. Back in 2009, by analysing the data, I found that the global average sea surface temperature, the SST, stays fairly constant when the Sun is averaging around 40 sunspots per month. By calculating the running total departing from this figure in a simple integration I found that combined with the ~60 oceanic cycles (also solar influenced), I could reproduce the temperature history of the last 150 years quite accurately. By adding in a nominal forcing for co2 (or an allowance for the infamous ‘adjustments’ to the data), I was able to get a match to monthly data which has a Pearson R^2 value of 0.9.
The above is part of an article ROG TALKBLOKE wrote from his web-site talkblokes talkshop.
I think this article presents a strong case for solar/ocean connections.
It is very clear that IR radiation has no effect on OHC or surface water temperatures and that Visible Light and UV light have major effects on OHC and Surface Water temperatures.
Therefore AGW has nothing to do with ocean heat content and ocean surface temperatures while the sun has everything to do with it.
OHC has just been responding to the extreme strong solar conditions 1934-2003 which have leveled off post 2005. OHC will follow.
IR penetration of surface ocean .1mm visible light /long UV light tens of meters. End of story.
http://wattsupwiththat.com/2014/07/21/deep-oceans-are-cooling-amidst-a-sea-of-modeling-uncertainty-new-research-on-ocean-heat-content/
Bassman it is reality check time.
We are dealing with data that is so uncertain that using models to predict outcomes is absurdity.
I much rather rely on past history which is what I am doing in projecting future climatic trends.
bassman reality check TWO. Solar conditions since the Dalton have not met cooling criteria which I have listed below until post 2005 . Once this criteria becomes established as this decade moves forward then we will see how much of an influence the sun has on the climate system of the earth.
In my book anything that drives a system controls a system. Sun drives the climate AND it controls the climate when it varies though primary and secondary effects.
THE CRITERIA
Solar Flux avg. sub 90
Solar Wind avg. sub 350 km/sec
AP index avg. sub 5.0
Cosmic ray counts north of 6500 counts per minute
Total Solar Irradiance off .15% or more
EUV light average 0-105 nm sub 100 units (or off 100% or more) and longer UV light emissions around 300 nm off by several percent.
IMF around 4.0 nt or lower.
The above solar parameter averages following several years of sub solar activity in general which commenced in year 2005..
IF , these average solar parameters are the rule going forward for the remainder of this decade expect global average temperatures to fall by -.5C, with the largest global temperature declines occurring over the high latitudes of N.H. land areas.
The decline in temperatures should begin to take place within six months after the ending of the maximum of solar cycle 24.
NOTE 1- What mainstream science is missing in my opinion is two fold, in that solar variability is greater than thought, and that the climate system of the earth is more sensitive to that solar variability.
NOTE 2- LATEST RESEARCH SUGGEST THE FOLLOWING:
A. Ozone concentrations in the lower and middle stratosphere are in phase with the solar cycle, while in anti phase with the solar cycle in the upper stratosphere.
B. Certain bands of UV light are more important to ozone production then others.
C. UV light bands are in phase with the solar cycle with much more variability, in contrast to visible light and near infrared (NIR) bands which are in anti phase with the solar cycle with much LESS variability.
© 2014 Southwest Weather, Inc.
How can back radiation from C02 heat the ocean if it can’t penetrate the ocean beyond the surface skin
http://www.klimaatfraude.info/images/sverdrup.gif
So if the ocean controls climate it can’t be CO2 (mann made or not mann made).
you could say the same thing about evaporation, which also only occurs at the skin…but is responsible for an average net loss of energy by the oceans of close to 100 W/m2.
Doesn’t Evaporation stop the moment the space above the surface gets saturated. So the mechanism to remove the water vapor is an essential part of the evaporation process. Without it there would be no average net loss of energy by the oceans of close to 100 W/m2. The ‘skin’ part is only a small part of the evaporation process. But maybe I’m wrong.
First: sea level rise alone confirms the increase in ocean heat content (thermal expansion), not all of it coming from melting land ice.
Second: I could have used NASA’s forcing values instead of IPCC but they aren’t as up to date.
Third: instead of “sunlight nowadays stings more anecdotal evidence” maybe post evidence from a trusted source that shows increasing UV.
Fourth: the fingerprints are faster warming in winter and at night suggesting less escape of heat vs an increase lets say in incoming solar energy. Paleoclimate studies also show that GHGs are the only explanations for many past warming events even if there much less abrupt as the last 60 years.
Fonzarelli,
Another fingerprint is a reduction in the Wavelength of IR escaping the atmosphere at exactly the WV that co2 absorbs.
Also the stratosphere is cooling, more solar energy would warm the stratosphere along with everything else.
Simply put, there are many independent lines of evidence strongly showing the influence of CO2 and methane as a GHG.
Yes, there is a lot evidence that increasing CO2 has reduced the net rate of IR cooling to space. The question is how much of recent warming has been due to that versus other, natural climate forcings.
RobertV, don’t overthink the ocean/air heat transfer. Warmer air reduces the transfer of heat from the oceans to the air causing the oceans to gain energy. This is exactly whats happening at increasing rates with OHC and sea level rise.
Roy, Thanks for the comments. I would argue that looking at all lines of evidence that data supports warming due to GHG vs Solar variation. I would hope that changes in cloud cover aren’t a major factor in current warming. That would suggest we can’t depend on changes in cloud cover as a negative feedback as much as we hoped.
Since increased evaporation (which is clearly occurring) cools the oceans, and the fact they are still warming rapidly, suggests a very real change in our energy balance on Earth in the positive direction.
To anyone interested, Here is a great study to asses how/why forcing values are assigned the way they are for the earths energy imbalance.
Look closely at figure 18.
http://www.columbia.edu/~mhs119/EnergyImbalance/
Bassman,
This statement is wrong.
The variation in solar input vs the GHG forcing is small. And current solar input has been average to below average at best.
A. Solar activity was stuck at the maximum level (until this solar cycle) in over 350yrs of sun spot data. We dont know the impact bc little research has focused on it.
B. In your own link look at how simple columbia considers the sun. No UV (order of magnitude greater than irradiance), no magnetics that impact cosmic rays that impact cloud cover, and no feedbacks tied to solar flux.
Why make CO2 so powerful and coupled to to powerful feedbacks (water vapor) but not the sun? CO2 has warmed the earth but the IPCC models rely on these feedbacks to have catastrophic warming.
It’s a pluraese to find someone who can think so clearly
Aaron S, just show me data on UV light that disputes NASA. You are stating that you agree that sunspots and solar input has been declining except an increase in UV light that is a significant forcing. As Roy stated, the stratosphere would be warming much more considering the ozone layer, yet it is cooling instead. It makes no sense. Again, all of the respected peer reviewed research indicates GHG as the main driver of recent warming.
If the sun was at max level for 350 years then why wasn’t there abrupt warming hundreds of years ago vs just 1960. Again the forcing values represented in the IPCC report and other sources match the pattern very well in addition to all the other lines of evidence.
If I’m not mistaken, UV light is already incorporated into “total solar irradiance “. See the link below:
http://www.pmodwrc.ch/pmod.php?topic=tsi/composite/SolarConstant
Bassman,
I think you misunderstood me, sorry I was probably not clear. The sun’s activity has jumped greatly since about 1950. The sunspot number is a good proxy for solar activity that includes very strong corelations between total irradiance (including UV spectrum), Magnetics, and CME. Take a look at the graph from Wiki below (I can get you the same data from NASA if that makes it more credible in your mind), and I am confident that you agree there was a major jump in solar activity right when you claim the warming occured, and then we have been stuck in this active phase for over 50 years until the most recent solar cycle (which is when the IPCC models stopped working also). Yes the sun’s activity varied a little in this phase but the interval from 1950 to 2005 remains the most powerful version of the sun the solar system has had since the records were recorded.
http://en.wikipedia.org/wiki/Solar_cycle
Yes solar irradiance includes UV light in the total spectrum. But if UV light has more of a climate impact than say the human color specturm or radio spectrum, then it needs special consideration. Your statement is about like saying if you look at the atmospheric composition of Oxygen over time then you understand C”O”2 because it is included in that data. Again I am fine with an apples to apples comparison.
As far as the stratoshpere goes- noone is saying CO2 is not a factor and there are no records going back to see the inactive solar phase- you have to zoom out your perspective. In climate terms the 36 years of satellite data do not tell the entire story- so you can not make that statement.
As far as peer reviewed literature goes- I have personally published papers involving the sun’s impact on climate, and there is a bunch out there- it just doesn’t get the funding or attention that CO2 does. As far as NASA- it is a multi-headed monster and all the heads do not agree. So please continue to pick and choose what you chose to take literally and avoid the alternative perspectives.
http://science.nasa.gov/science-news/science-at-nasa/2013/08jan_sunclimate/
Finally, you never answered my question? Where are the feedbacks to water vapor and cloud cover associated with the sun in the Models?
Aaron
I was anticipating an answer, but just to clarify. There are not any feedbacks for the sun because no one knows how to deal with the sun itself or its feedbacks. IMHO same with CO2 feedbacks (I do think we understand that it is a greenhouse gas) and this screams that the IPCC models should include more uncertainty and have more scenarios. Ie we need models that assume the Sun is a major driver and the Earth is highly sensitive to solar forcing, to compliment the ones with CO2 as the dominant driver of the warming since 1880. With this other scenario we could compare to the empirical HadCrut4 and where available Satellite data. This would be particularly powerful over the next decade because the sun and CO2 are now heading different directions as global warming drivers.
Just a layman trying to follow this discussion. You said “we need models that assume the Sun is a major driver and the Earth is highly sensitive to solar forcing, to compliment the ones with CO2 as the dominant driver of the warming since 1880.”
I don’t know where to find them right now but I am sure many models have been run doing just that. They concluded they could not explain the recent rapid warming.
Aaron S, I understand what you are saying. I can see the recent 60 year increase. Your arguing that it has much more influence than what the forcing values are suggesting. I’ll just leave it at that.
There are uncertainties with cloud feedback I agree. I was discussing initial forcings rather than feedbacks. With both solar and co2 going in opposite directions we will find out soon what’s happening.
http://hockeyschtick.blogspot.com/2013/03/man-made-global-warming-theory-is.html
The above article refutes Dr. Spencer’s claim that OLR radiation has been reduced due to CO2 increases according to the latest evidence.
As is always the case data is in the eyes of the beholder when it comes to climate science.
Roy Spencer says:
July 24, 2014 at 3:13 PM
you could say the same thing about evaporation, which also only occurs at the skin…but is responsible for an average net loss of energy by the oceans of close to 100 W/m2.
Dr. Spencer says and yet if that is the case for IR what effect do you think visible light /UV light changes would have on the ocean temperatures/heat content ,which penetrate the oceans to much greater depths?
With both solar and co2 going in opposite directions we will find out soon what’s happening.
Reply
Bassman says and I say exactly correct. We will find out who is correct and who is wrong in the very near future.
As Dr. Spence knows from the recent climate summit I am not alone when it comes to solar effects on the climate.
Many distinguished scientist /meteorologist gave speeches which echo my thoughts.
http://icecap.us/images/uploads/ncep_cfsr_t2m_anom_062014.png
Why is the data different between Weatherbell and Satellite global temperature deviations? I am curious . Thanks to anyone that can answer the question.
Avery,
I would like to see the models and study the parameters they used to make that statement. The existing models i know of use a very weak sun to climate connection based on the irradiance flux over the schwabe solar cycle but as the nasa link above points out the sun seems to be felt regionally making it very hard to quantify. We just do not know how it works, but i can tell you there is abundant empirical data for the impact of the magnetic cycles at different frequencies impacting climate greatly. The most robust one in duration and temporal resolution i have seen is being written up now in the lab i work at. The record is in a cretacious shale (about 100 mya) and spans several million years of nearly continous deposition. It is supported by over 20 radiogenic age dates from volcanic ashes creating a incredible chronology. These cycles are not understood and not included in the models but they are present in so many records. It is difficult to justify the models ability to predict climate if they are incomplete. Like salvatore says… we will know more in a decade. Any paper that suggests the trend in solar activity has been negative since 1980 is just cherry picking data bc the big jump was in 1950 and subsequent changes have been minor trends in an overall active solar phase. That is until the weak solar cycle 24 but we remain in the peak of that cycle so it is still to early.
Aaron, when you make a reply to some one, use the reply button below the comment, eh? (It gets hard to follow you sometimes when you’re all the way down at the bottom of the page!) As far as I’m concerned, and I’m sure others here would agree, you’re the brightest bulb on the spencer blog tree and we don’t want to miss what you have to say…
The current solar cycle peak, although it is a weak one, still represents a higher than average degree of solar radiance. (say as opposed to a trough) Since it is a weaker cycle, it is also a longer cycle which means we still have that higher than average radiance for a longer period of time… Perhaps that is a factor as to why global temps have stayed stubbornly high.