The SSM/I and SSMIS series of microwave imagers, operating since July 1987, provide global oceanic measurements of total vertically integrated water vapor, cloud water, rain rate, and surface wind speed. These are useful for studying how the maritime atmosphere varies due to El Nino and La Nina, as well as provides ~27 year trends for climate change studies.
The best place to start is with what the SSM/I instruments can’t measure, which is sea surface temperature. Here are the monthly global (60N-60S) average SST variations since 1987:
As can be seen, there has been net warming of the ocean surface since 1987, a relative “pause” in the warming trend since the 1997-98 El Nino, and the global SST value for June 2014 was near a “record” high.
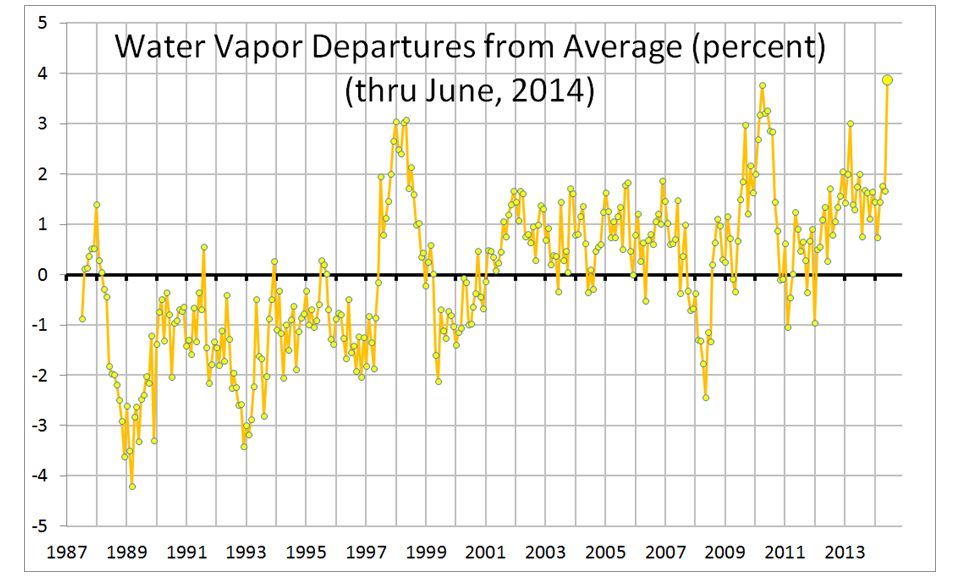
The SSM/I integrated water vapor measurements provide a powerful check on the SST measurements, since water vapor is tightly coupled to SST:
Note that the SSM/I integrated water vapor was at a record high in June, 2014, probably the result of the developing El Nino.
If we compare the SST and water vapor variations, the quantitative relationship between them is about ~11% water vapor increase per deg. of SST increase:

Fig. 3. Scatter plot of the SST and water vapor in Figs. 1 and 2, with a 1 month time lag (vapor after SST).
I have included a 1 month time lag in the plot (vapor after SST), which maximizes the correlation. The 11% per deg. relationship is considerably greater than the 7% per deg. expected from the assumption of constant relative humidity. Why? I’m not sure, but I suspect it might be due to a change in the vertical distribution of vapor with height during warming. If the falloff of specific humidity with height becomes steeper with warming, the water vapor retrieval Frank Wentz uses will overestimate the amount of water vapor. This explanation would also be consistent with radiosonde evidence of a multidecadal decrease in mid- and upper-tropospheric water vapor, and potentially neutral (or even negative) water vapor feedback.
The SSM/I cloud water remains high, as it has in recent years…several percent above most of the period record:
As I have blogged about before, there is a correlation between the SSM/I cloud water and the CERES net radiative flux variations, so the recent elevated cloud water amounts lead to less sunlight entering the oceans, which is consistent with the recent hiatus in warming.
The SSM/I oceanic rainfall has increased in recent years, but I’m not sure how much of this is real or is due to residual algorithm cross-talk from the cloud water signal, since cloud water has also increased:
Finally, the SSM/I ocean surface wind speed anomalies suggest that the ~2% increase in winds after the 1997-98 El Nino seems to have ended…although going into El Nino conditions will also produce reduced wind speeds:
As I have mentioned before, I believe this wind speed record is the most accurate one in existence. I find it hard to believe that a 2% increase in winds caused (as Trenberth claims) the warming pause and increased heat storage in the deeper ocean. If it did, it looks like that effect should have gone away in the last few years.

 Home/Blog


