
 Home/Blog
The fortuitous revelation of record warm sea surface temperatures in August, only days before Climate Summit 2014, begs the question — why?
Why were SSTs so warm? (Not “Why announce it just before Leonardo DiCaprio’s coronation?”)
As readers here know, I follow the “ocean products” produced by RSS from the SSM/I and SSMIS satellite sensors, and a curious thing has been shaping up in the last few years.
Global average ocean surface wind speeds have been decreasing. In fact, August 2014 had the lowest surface wind speed in about 25 years.
Even after I correct for the typically lower wind speeds that occur with El Nino approaching (-0.5 m/s wind decrease per unit Multivariate ENSO Index value), it’s still at near a record-low since the satellite record began:
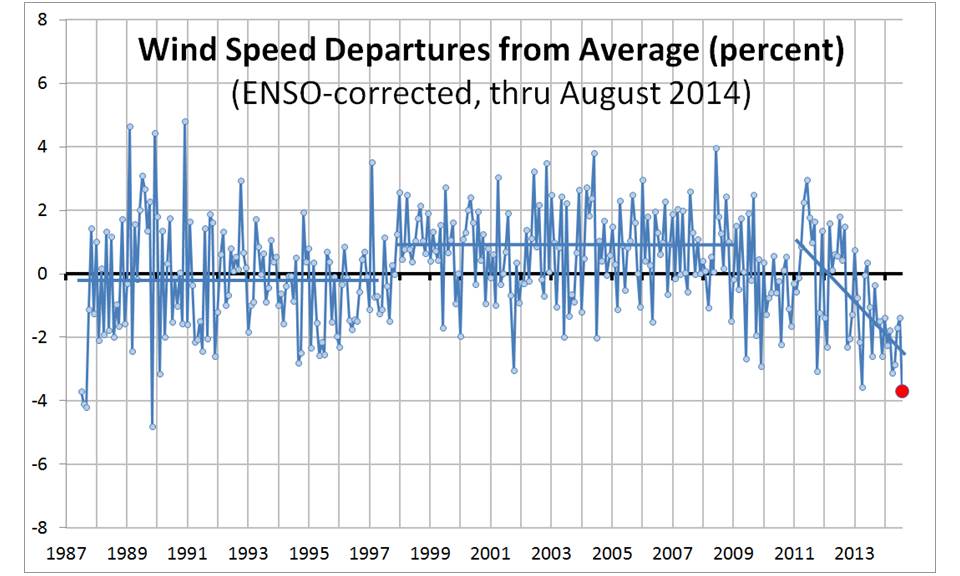
SSM/I and SSMIS monthly global ocean average surface wind speed anomalies.
For those wondering what these wind fields look like, here are the average gridpoint wind speeds for August (1 m/sec is about 2 knots), both as absolute values and as anomalies (departures from the mean):
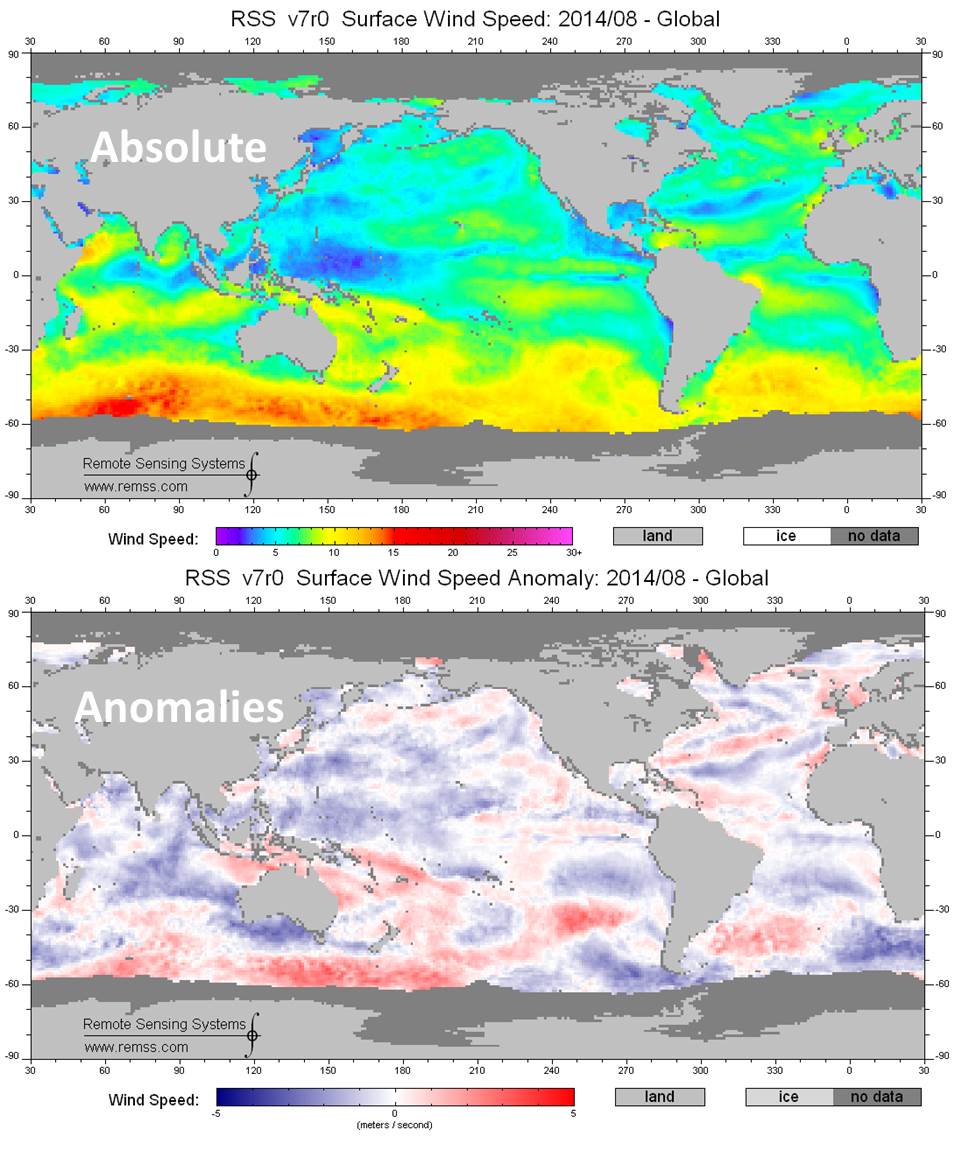
Gridpoint ocean surface wind speeds from SSMIS in August 2014, shown as absolute values and anomalies.
Why is Wind Speed Important to SST?
Wind-driven evaporation is the largest source of heat loss from water bodies, including the global oceans. Assuming a global average rate of ocean surface heat loss of 90 W/m2 (which is mostly evaporative), the August value of about 4-5% below the long-term average would mean about 4 W/m2 less cooling of the ocean surface.
Importantly, this 4 W/m2 reduction in heat loss is LARGER than the supposed anthropogenic radiative forcing of about 2.3 W/m2, the IPCC’s RCP6 current radiative forcing value. (The true radiative imbalance is actually less than that because warming has offset some of it with increase IR emission to space). The net result that the wind speed effect is probably at least 4 times the anthropogenic effect.
So, what’s my point? Natural variations in all kinds of things are going on, including a reduction in wind-driven evaporation, which likely contributed to “record warm” SSTs in August.
I have no strong opinions of why the reduction in wind speeds is occurring. Usually the best guess in climate is that it’s part of some cycle that will reverse itself at some point. Only time will tell.


