
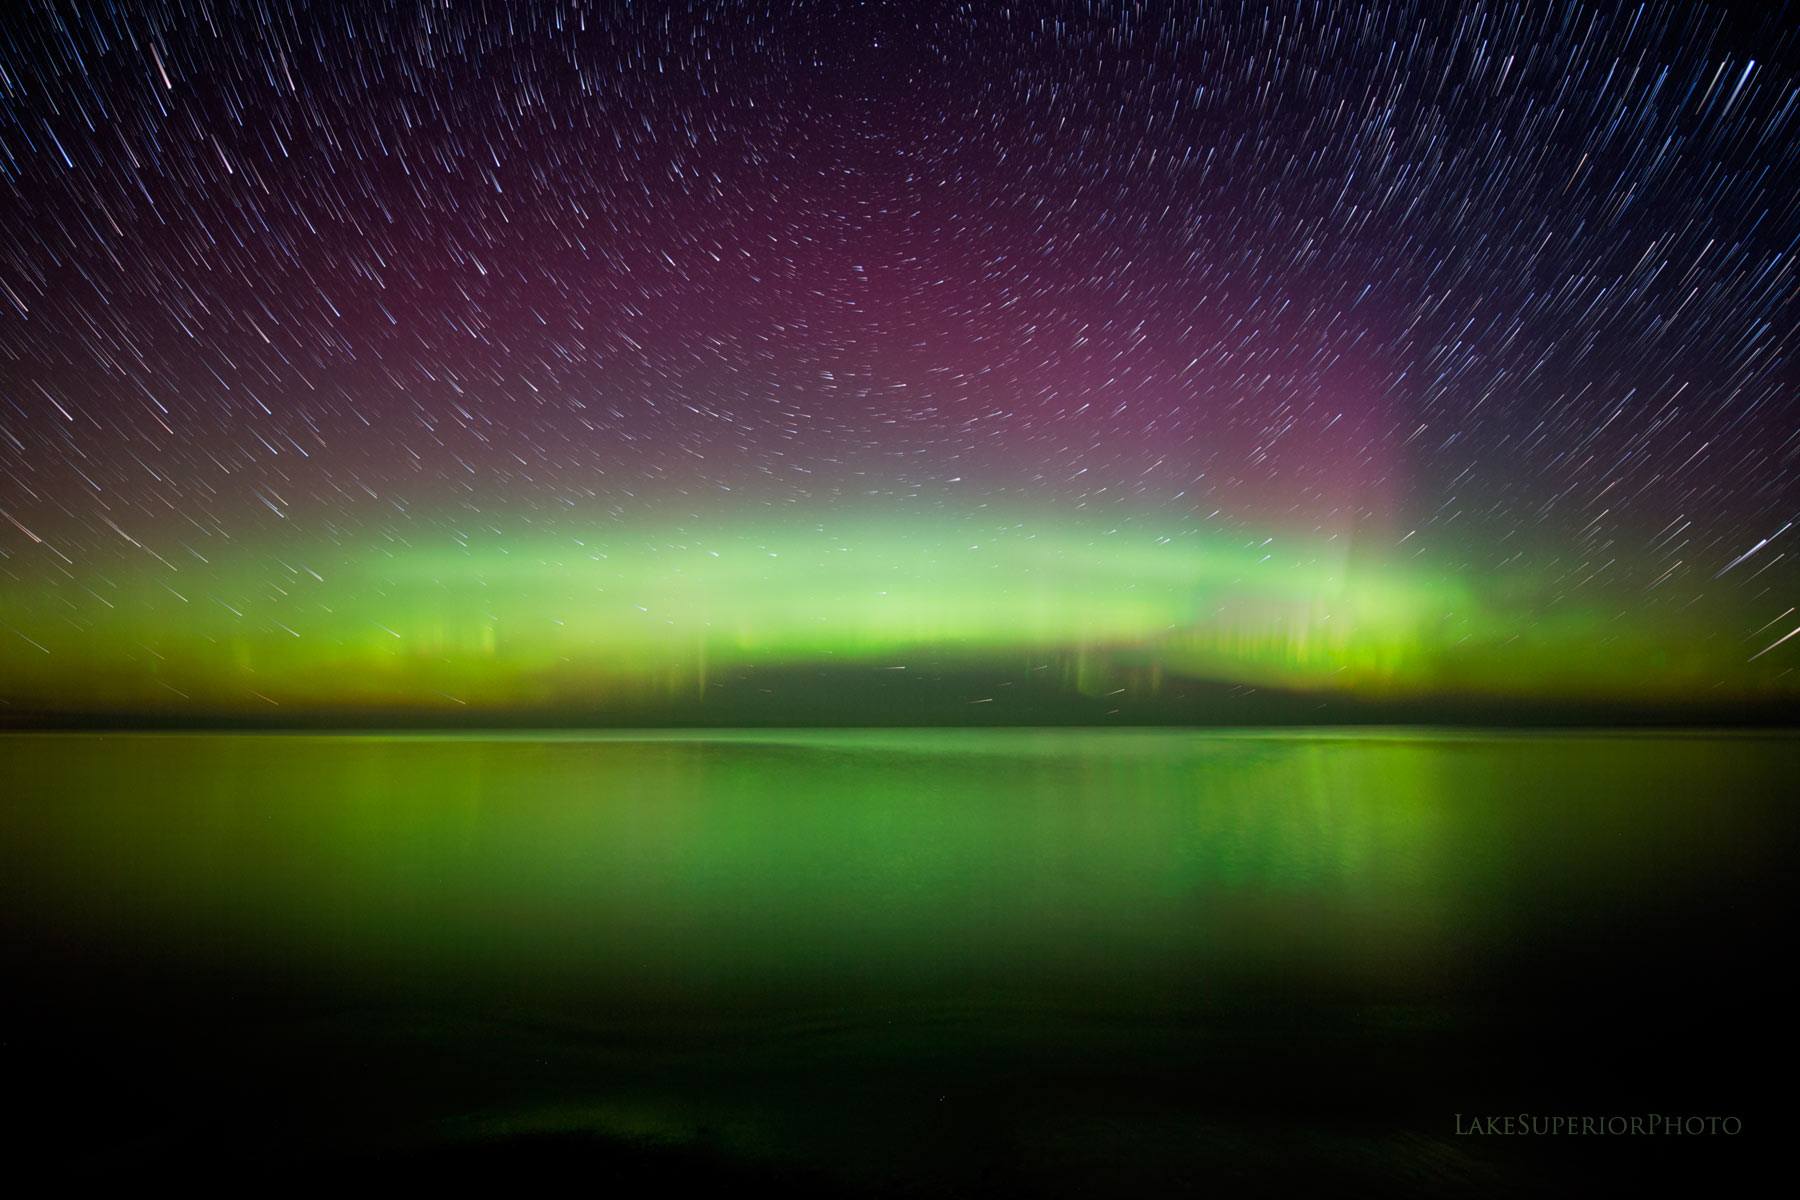
Aurora on 28 Aug. 2014 as seen over Lake Superior, from Marquette, MI (courtesy Lake Superior Photography).
The first of a pair of solar coronal mass ejections (CMEs) from sunspot AR2158 is supposed to reach Earth tonight, providing auroral displays (northern lights) unusually far south.
According to the most recent advisory from NOAA’s Space Weather Prediction Center,
“…conditions such as these could lead to auroras observed from the middle or southern states.”
Of course, any auroral displays visible in the southern U.S. are exceedingly rare. The last event that far south was October 24, 2011, with aurora visible as far south as Oklahoma and Alabama.
The second of the CMEs is traveling faster than the first, and is supposed to reach Earth about a day later. The probability of more events remains relatively high. According to SpaceWeather.com,
“More radio bursts may be in the offing. Sunspots AR2157 and AR2158 have unstable magnetic fields that harbor energy for strong explosions. NOAA forecasters estimate a 40% chance of X-class flares and a whopping 85% chance of M-flares on Sept. 11th.”
Here’s the latest solar wind model forecast for midnight tonight, showing the passage of the first plasma event from the first CME, and then second one following it:

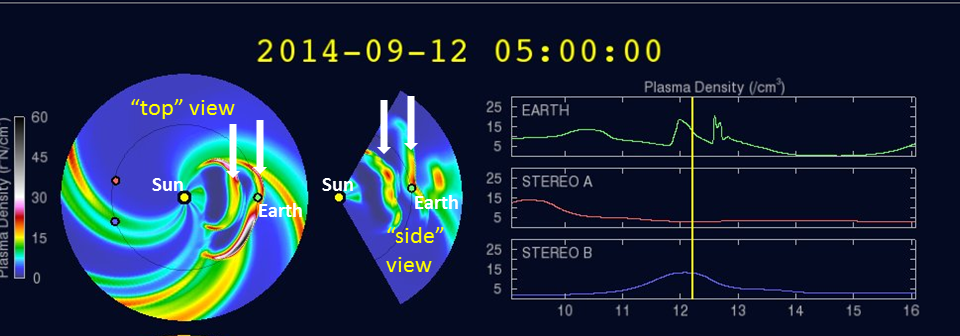
Solar wind plasma density forecast for midnight tonight, showing two solar eruption events arriving at Earth.
The model animation is pretty cool, and provides a good conceptual view of how these plasma events exit the Sun and travel toward the Earth.
For those interested in viewing tonight, try NOAA’s Ovation aurora monitoring tool, which is based upon the latest polar orbiting satellite measurements. If that page is not up to date with the latest satellite data, this one usually is.
I think the kp index will not exceed 6 for this event.
What is interesting is the weakening earth magnetic field is enhancing given solar events which mainstream is in total denial when it comes to climatic effects. Instead they focus on AURORA events which are great but have little or no consequence.
The biggest threats are a kp event of 9 ,from a solar flair (cme) much larger then this one which could impair the electrical grid but given we are in a prolonged solar minimum the more likely threat will be lack of activity and a colder climate going forward.
If one looks at the solar disc today it is still lacking much in the way of sunspots and this condition is only going to accelerate going forward and is going to have climatic impacts going forward.
See how jumps cosmic rays.
http://www.bartol.udel.edu/~pyle/thespnplot.gif
I wonder if the magnetic storm will affect the Icelandic volcano.
These things actually spiral out? Eight minutes for light, and I always imagined them to traveling a significant percent of that. Or maybe the sun just spins that fast.
Or the events stretch over many days.
the “light” does travel that fast…for instance, the UV pulse disrupted Ham radio right after the events.
But the charged particles take a day or more to arrive.
The spiral pattern is due to the sun’s rotation as it ejects material.
Sorry, I was already off the Wikipedia. It is spinning fast (faster than a lunar period). Impressive agility for something that big.
Wikipedia says sidereal period is 24.5 days. So, it looks like it takes 1/5 th of a rotation (5 days) to reach here and lasts for much longer than that.
http://www.solarham.net/proton.htm
Proton event weak according to data in previous chart.
ren says:
September 11, 2014 at 9:35 AM
I wonder if the magnetic storm will affect the Icelandic volcano.
Very good point. Sudden disturbances in earth’s magnetic filed tend to influence geological activity but I think this only happens when the ap index is running less then 5 for many months then out of the blue a severe geomagnetic storm takes place ap index north of 200.
We don’t have that right now.
This will be a double blow.
If earth’s magnetic field decreased by 250 nanotesla, how will that cause volcanic eruptions? Assuming magma contains ions. Stronger magnetic field will draw them up to the surface. Weaker magnetic field will keep them underground.
Flare X was straight Earth. When was the last so it was?
Ren, I do not think this will be more then k value 6 maybe 7 for a very short time period. Not strong enough.
Volcano becomes active.
http://en.vedur.is/photos/jarvatj_rit/140911_2120.png
Moon’s only just past full, so that’ll outshine fainter auroral activity.
Kiruna aurora webcam
http://www.irf.se/allsky/rtasc.php
Thanks, Hans! Didn’t know this existed. My wife and I were in N. Finland a few years ago.
Jim,
The travel speed of charged particles ejected from the Sun depends on their kinetic energy (just as it does for molecules in a gas). Solar wind protons have energies of 1-2 kev (kev= thousand electron volts, an equivalent temperature of over one million degrees) and travel at a few hundred km/sec. Solar flare protons have energies of millions to tens of millions of electron volts, and travel proportionally faster.
Of course, travel time also depends on travel path, which is partly controlled by magnetic field lines.
Interesting. If I look at the spiral picture, it looks as though the angle from point of solar exit to earth arrival is maybe 1/6 th or 1/5 th of a solar rotation (24.5 days) or about 4 or 5 days. If I assume your ball park numbers are linear kinetic energy and convert them to sun-to-earth transit times, I get
Wind, proton, 1 kev, 4 dy
Wind, proton, 2 kev, 2.8 dy
Flare, proton, 1 mev, 0.125 dy
Flare, proton, 10 mev (almost relativistic), 0.04 dy
What am I doing wrong? Nothing fits the 1 to 2 days for a typical flare (per Wikipedia). Maybe the picture is not literal, and maybe I’m screwing up the calculation – although it’s not that complicated.
I also get a gravitational potential energy of a proton at the surface of the sun (relative to one at infinity) of -2 kev — which means some wind protons never really escape the sun’s gravity. This is embarrassing, I may have to go take physics 101 again.
The kinetic energy is from tangential velocity, not radial velocity.
speed of solar wind = 750 km/sec.
ave. distance sun to earth = 150 million km
time to arrive = 2.3 days
round off to 2 days
Salvatore,
I am confused. What do you mean by Prolonged solar minimum? Solar cycle 24 is the first weak peak and it is not all that weak compared to other minimums (Dalton or Maunder). I agree if we go into a prolonged minimum like those that there will likely be cooling but if the sun simply has left the prolonged phase of very high activity and returned to normal neutral activity like the late 1800’s and early 1900s, then i would anticipate neutral climate warming. I guess I am curious how you are forecasting the sun’s activity as a minimum?
This is a great article with an interesting subject and very well written indeed.
The storm has already begun, within a few hours reaches the Earth’s plasma from the second explosion.
http://www.swpc.noaa.gov/rt_plots/SatEnv.gif
Aaron here is your answer. Read below. This cycle is the WEAKEST since solar cycle 5.
Bob Weber says:
September 10, 2014 at 3:00 am
JM – The cause of the pause was the cause before the pause.
The higher solar activity during SC17-23 (overcoming lower SC20) caused the global warming phase that ended at least a decade ago. The Earth’s temperatures have on average leveled off as the ocean heat content accumulation from all those years of the Modern Maximum in solar activity, from 1936-2003 from my calculations, using both Svalgaard’s new GSN and the SIDC numbers (they give the exact same result!), has been mitigated by the cooling effect of lower solar activity periods during all the solar minimums since 1936, and the SC23 declining phase through SC24.
The Sun warms and cools the Earth by emitting more or less photon flux. Earth cools off with insufficient incoming photon flux. A good proxy for the solar spectrum (total photon flux) is F10.7cm radio flux, a small slice of TSI on the sun’s frequency spectrum. The solar flux and sunspot number track very closely.
When the Sun is hot, we’re hot, when it’s not, we’re not. Over the course of a single rotation, or over the course of a whole cycle or series of cycles. The warming/cooling effect works in short time frames and long time frames.
For example, when we were in the “solar all-quiet” earlier this summer, the sunspot number dropped to zero for a day for the first time since the last solar minimum, with a corresponding drop in solar flux down to 89 sfu. That week was the coldest week all summer. The farside at that time had a lot of spots. In early July, SSN was 256, solar flux was 201, and it was hot. I have US temperature map data to back this up.
Solar cycle #24 had a daily average solar flux of 100 sfu/day as of July 10 (when I last did the calculation), and will be slightly higher now after a more active summer of mostly over 120 sfu/day,
Comparing cycles, in order of cycle, in sfu/day (F10.7cm measurements started in 1947):
#[email protected]
#[email protected]
#[email protected]
#[email protected]
#[email protected]
#[email protected].
For cycles before #19, we rely on SSNs.
This analysis, extended to both the Maunder Minimum and Dalton Minimum (among any others), explains the temperature drops experienced here on Earth result from deep, sustained solar slowdowns, especially during the Maunder, when the SSN was nonexistent quite a while, decades.
During the Dalton Minimum, SSN was zero for the whole year of 1810, when the depth of cold measured in at an almost 2C drop over the previous 9 years. The average SSN didn’t rise high enough to raise temperatures back again to where they previously were for almost two decades after 1810.
As long as solar flux is above 120, it’ll stay warm and very slightly build more heat into the system. When SC24 winds down, and daily SSNs are down and solar flux drops below 120 every day for the duration of the minimum and into the next cycle #25 (expected to be a low cycle), we will experience a noticable temperature drop (on average), as has happened during every solar minimum, whether it be between cycles as in 2008-10, as in 1810, or during a sequence of low cycles, as during the Maunder.
To make a long story short, a hotter Sun from 1936-2003, when solar activity as measured by sunspot number was 31% higher for 68 years than the annual average SSN for the previous 183 years, caused global warming.
A less hot Sun since then caused the “pause” – a misnomer – and in due time, an even cooler Sun, however small a variation in total magnitude, will cause global cooling.
Works every time. Further analysis indicates the Sun causes extreme weather effects – but that’s for another day…
The Sun causes warming, cooling, and extreme weather effects. The Sun did it – it always has, it always will – and it will do it again and again until the end of time.
Reply
ed says:
http://www.swpc.noaa.gov/SolarCycle/
Aaron here is the second part to your question. Notice the AP index after late 2005 as opposed to earlier times.
So far only k5 has been reached and only for 6 hours. I still maintain only k6 will be reached.
Nevertheless the prolonged solar minimum remains intact over the long haul.
http://www.landscheidt.info/images/sc5_sc24_1.png
one last post to show how weak this cycle is
Solar cycle 5 part of the Dalton solar minimum as one can see solar cycle 24 is similar to this cycle. Both very weak.
The popularity of the UPVC doors and windows is on the rse globally.
They also provide your home with cozy little reading noois and banquette
style seating to make tthe most of the extra space.
Ducts are used to distribute conditioned air throughout a home.
Salvatore,
My point is predicting solar activity has proven very difficult (remember NASA predicted a strong peak for 24). Originally, I thought 24 was exceptionally low but the second half of the bimodal crest during this peak has really added some energy. This has been the peak that keeps going. Visually I think this cycle looks to me more like cycle 16 than during the dalton so im not sold we are in a minimum. Next week when i get back to a computer i will take the integral of a 3 year running average of SSN data to compare cycles to see where this ranks. Statistically, i can then say if this cycle is a dalton-like minimum or just an exit from the abnormally strong sun back to normal sun like the early 1900s
One more thing… im just not familiar with this page you cite.
http://www.landscheidt.info/images/newc141.jpg
Nor am i sold that the giant planets cause solar cycles. I want to take a simple look myself at the data but thanks for the answer bc this could be a great opportunity to learn something new.
Bárðarbunga – updated information.
Gas cloud from the eruption drifts to the east. High level of SO2, sulphur dioxide, was measured at Reyðarfjörður last night around 10:00 o’clock. The highest value measured were just under 4000 micrograms per cubic meter. These are the highest values measured in Iceland. High level, 685 micrograms per cubic meter, was also measured in Egilsstaðir.
http://en.vedur.is/earthquakes-and-volcanism/articles/nr/2947
SSN number is not a good measurement to determine the strength of a sunspot cycle the much better measurements are the solar flux and the ap index.
Sunspot number counting is highly subjective in my opinion.
The fact that the peak of solar cycle 24 keeps going is a sign that this cycle will be very long and thus very weak. The longer the peak last the longer and weaker the cycle should be.
In order to evaluate if solar cycle 24 is Dalton like for sure or not we are going to need more data going further out. The cycle has a long way to go.likely.
I am also not sold on the giant planets causing solar cycles.
http://www.solen.info/solar/images/comparison_similar_cycles.png
Comparison of solar cycle 24 versus 16.
My guess is the peak of solar cycle 24 last longer but the down trend to minimum and the minimum itself for solar cycle will be very long in duration before solar cycle 25 begins. I think solar cycle 24 will last until Dec. 2022.
If so it would be a 14 year cycle.
Also the E10.7 (EXTREME UV LIGHT INDEX) is running very low for solar cycle 24 right now at only 140.7 units during the maximum period for this cycle. Normally this reading exceeds 200 during solar maximums.
I agree with you about the uncertainty in data and that 24 is a very different cycle for the satellite era, but the issue with solar activity in deeper time is that you have limited data. The two main paleo data sets are the isotopes and SSN, both are valuable but potentially flawed (isotopes probably dont have the resolution to answer this question). I took a look this morning at SSN using this data http://www.sidc.be/silso/datafiles
Interestingly, as you say different sources vary depending on if and how they corrected the raw SSN data, but this is considered a good source and it is shows that cycle 24 SSN peaked at over 64 in 2013, whereas the peaks in 1804 and 1816 during the Dalton both peaked under 50. This is why I am not sold that this cycle is a minimum rather than a 1905 or 1883- like sun. Either way it could and should help with understanding the sun and I agree, we will likely be in this phase for a half century (the rest of my life) and should see climate change with the new sun. I guess I am hoping that this is not a true minimum like the Dalton because I believe that would be catastrophic to human population as climate deteriorated. If Earth could only grow 80 to 90% of the food as before as crop belts receded to the poles people would start to starve, then there would be a feedback and wars would kill many. I’d rather not live throught that. So I am optimistic this is just a very weak part of ‘normal’ sun conditions.
Aaron right or wrong this is my conclusion as to why the climate changes. Look below my commentary on the sun.
As far as solar activity it is different now then it was before 2005 and just how much different will remain to be seen. Post 2005 being much quieter in contrast to years before 2005.
rgbatduke my reply.
Many of us are of the opinion that the chances of cooling going forward are near 100%.
CO2 is a non player in the global climate picture as past historical data has shown.
CO2 and the GHG effects are a result of the climate not the cause in my opinion.
I maintain these 4 factors cause the climate to change and they are:
Initial State Of The Climate – How close climate is to threshold inter-glacial/glacial conditions
Milankovitch Cycles – Consisting of tilt , precession , and eccentricity of orbit. Low tilt, aphelion occurring in N.H. summer favorable for cooling.
Earth Magnetic Field Strength – which will moderate or enhance solar variability effects through the modulation of cosmic rays.
Solar Variability – which will effect the climate through primary changes and secondary effects. My logic here is if something that drives something (the sun drives the climate) changes it has to effect the item it drives.
Some secondary/primary solar effects are ozone distribution and concentration changes which effects the atmospheric circulation and perhaps translates to more cloud/snow cover- higher albebo.
Galactic Cosmic Ray concentration changes translates to cloud cover variance thus albedo changes.
Volcanic Activity – which would put more SO2 in the stratosphere causing a warming of the stratosphere but cooling of the earth surface due to increase scattering and reflection of incoming sunlight.
Solar Irradiance Changes-Visible /Long wave UV light changes which will effect ocean warming/cooling.
Ocean/Land Arrangements which over time are always different. Today favorable for cooling in my opinion.
How long (duration) and degree of magnitude change of these items combined with the GIVEN state of the climate and how they all phase (come together) will result in what kind of climate outcome, comes about from the given changes in these items. Never quite the same and non linear with possible thresholds.. Hence the best that can be forecasted for climatic change is only in a broad general sense.
In that regard in broad terms my climatic forecast going forward is for global temperatures to trend down in a jig-saw pattern while the atmospheric circulation remains very meridional giving rise to more persistence in weather patterns and perhaps more extremes .