UAH Global Temperature Update for August 2014: +0.20 deg. C

September 2nd, 2014 by Roy W. Spencer, Ph. D.

The Version 5.6 global average lower tropospheric temperature (LT) anomaly for August, 2014 is +0.20 deg. C, down from July’s value of +0.31 deg. C (click for full size version):
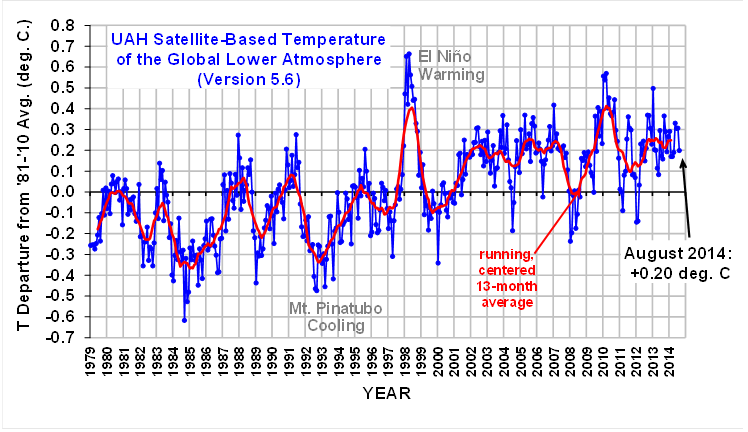
UAH_LT_1979_thru_August_2014_v5

The global, hemispheric, and tropical LT anomalies from the 30-year (1981-2010) average for the last 20 months are:

YR MON GLOBAL NH SH TROPICS
2013 1 +0.497 +0.517 +0.478 +0.386
2013 2 +0.203 +0.372 +0.033 +0.195
2013 3 +0.200 +0.333 +0.067 +0.243
2013 4 +0.114 +0.128 +0.101 +0.165
2013 5 +0.082 +0.180 -0.015 +0.112
2013 6 +0.295 +0.335 +0.255 +0.220
2013 7 +0.173 +0.134 +0.211 +0.074
2013 8 +0.158 +0.111 +0.206 +0.009
2013 9 +0.365 +0.339 +0.390 +0.190
2013 10 +0.290 +0.331 +0.249 +0.031
2013 11 +0.193 +0.160 +0.226 +0.020
2013 12 +0.266 +0.272 +0.260 +0.057
2014 1 +0.291 +0.387 +0.194 -0.029
2014 2 +0.170 +0.320 +0.020 -0.103
2014 3 +0.170 +0.338 +0.002 -0.001
2014 4 +0.190 +0.358 +0.022 +0.092
2014 5 +0.326 +0.325 +0.328 +0.175
2014 6 +0.305 +0.315 +0.295 +0.510
2014 7 +0.304 +0.289 +0.319 +0.451
2014 8 +0.199 +0.244 +0.154 +0.060

It should be remembered that during ENSO, there is a 1-2 month lag between SST change and tropospheric temperature changes, so what the SST anomaly is doing lately gives you a rough idea of how the tropospheric temperature anomaly will be changing in a couple of months.

The global image for August should be available in the next day or so here.

Popular monthly data files (these might take a few days to update):

uahncdc_lt_5.6.txt (Lower Troposphere)
uahncdc_mt_5.6.txt (Mid-Troposphere)
uahncdc_ls_5.6.txt (Lower Stratosphere)


44 Responses to “UAH Global Temperature Update for August 2014: +0.20 deg. C”

Toggle Trackbacks

  1. Tim Wells says:

    You can watch the Icelandic Volcano live here https://www.youtube.com/watch?v=zKtGqoxV_qo I wonder what effect this could have on global cooling in the world. I think the Thames froze over the last time it went off.

  2. Neutral all is as was with this latest data.

    In the meantime solar activity although weak is still in it’s maximum and until this ceases and the criteria returns to the levels I think may have climatic impacts it is wait and see as far as I am concern.

    The difference now is if/when solar conditions do revert back to very quiet conditions the accumulation factor this time will be much greater which means given solar changes should have a greater impact.

    The unknowns are to what degree of magnitude will solar variability to quiet conditions be, and what will be the duration of time.

    I say if solar conditions approach my criteria this time around and the climate response does not continue to show an overall meridional atmospheric circulation pattern and a global temperature trend down (jig saw pattern) I will admit to being wrong.

    It is that simple.

  3. Werner Brozek says:

    The latest stats for 5 data sets
    Maximum time for a negative slope

    For GISS, the slope is flat since September 2004 or 9 years, 11 months. (goes to July)
    For Hadcrut4, the slope is flat since February 2001 or 13 years, 6 months. (goes to July)
    For Hadsst3, the slope is flat since March 2009 or 5 years, 5 months. (goes to July)
    For UAH version 5.5, the slope is flat since June 2008 or 6 years, 2 months. (goes to July)
    For RSS, the slope is flat since November 1996 or 17 years, 9 months (goes to July).

    Time for no statistically significant warming
    For GISS: Since October 1997: CI from -0.002 to 1.249
    For Hadcrut4: Since December 1996: CI from -0.026 to 1.139
    For Hadsst3: Since August 1994: CI from -0.014 to 1.666
    For UAH (5.6): Since March 1996: CI from -0.001 to 2.341
    For RSS: Since December 1992: CI from -0.015 to 1.821

    Rank for 2014 if present anomaly average does not change
    GISS: third
    Hadcrut4: third
    Hadsst3: first
    UAH (5.5): sixth (with July); (5.6) fourth (with August)
    RSS: sixth

    • DavidA says:

      What are the error bars on all these numbers, Werner?

      • Werner Brozek says:

        I give the error bars in the “time for no statistically significant warming” using Nick Stokes’ site. However Dr. Ross McKitrick has other numbers: 19 years for Hadcrut4, 16 years for UAH, and 26 years for RSS. Which of these two do you agree with?

  4. Kristian says:

    Roy,

    The global ocean has experienced a pronounced spike in surface temps over the last few months, the second one over the last year or so. Peculiarly, neither the global landmasses nor the lower tropospheric temps have followed suit at all. They seem very much decoupled.

    I have a feeling the reason is that the rise in SSTa isn’t derived from the tropics this time.

    The thing is, the spike in ‘global’ SSTa isn’t really global at all, but rather confined to the North Pacific. Lower troposphere temps above this region don’t seem to respond at all adequately to this abnormal surface warming.

    Is this strange (?) lack of response simply the result of a weaker general convective/evaporative coupling between surface and air once you move away from the tropics? Is it from reduced mean wind shear in the area? Or is it something else?

    I’d be interested to hear your thoughts on this.

    • Werner Brozek says:

      Here are my thoughts:
      As can be seen, the Hadsst3 record this year is not at all reflected in the RSS data set. The latest RSS value was beaten many times in the past. And specifically, July of 2014, with an anomaly of 0.350, was only the fifth warmest July and way behind 0.605 from July of 1998.
      Why is there this huge difference between 1998 and 2014? Before I give my answer, I would like to refer you to a post by Bob Tisdale here:
      http://wattsupwiththat.com/2014/08/16/on-the-recent-record-high-global-sea-surface-temperatures-the-wheres-and-whys/
      In this post, Bob Tisdale talks about how warm the north east of the Pacific ocean is at this point in time. And during the 1998 El Nino, it was the tropics that were very warm. Would it make a difference to RSS if warm tropics water rose by 3 C rather than if an equal volume of a much cooler north Pacific rose by 3 C? Due to the law of conservation of energy, if more water evaporates, then more water vapor condenses in the lower troposphere. And it becomes warmer. However if a colder part of the ocean warms up, there should be less evaporation and condensation.
      I believe this explains why the satellite anomalies are not as high this time.

  5. rick says:

    “…isn’t really global at all…”

    Nothing is global, IMO.

    It is meaningless noise…the hiss of a carrier sugnal with no message.

  6. rick says:

    ‘sugnal’ should be ‘signal.’

    • Tim Wells says:

      The last time a Volcano went off in Iceland in 2010, we ended up with the coldest winter I can remember and I was born in 1964. The latest Volcanic eruption could be far bigger and go on for years.

      • Steve Ta says:

        “born in 1964” – so you missed the coldest by only a few months.

        That one was really cold, and the snow lasted forever.

      • Stephen Richards says:

        Tim, lucky you. I was an apprentice during the ’62-63 winter. I can assure you that the 2010 winter was nothing in comparison. If we go back to winters of that intensity the whole of europe and eurasia will be in very serious difficulty.

        • Tim Wells says:

          Stephen Richards it all depends where you was living in 1963 and 2010. North Anston Sheffield where I was in 2010, was completely isolated by the snow storm in 2010. I had to claim for a new garage roof and the insurance people didn’t batter an eye lid at paying out as we were one of the severest hit area’s.

  7. Thanks, Dr. Spencer.
    I will be updating my pages ASAP.
    What a summer drop!

    BTW, According to my Firefox version 32.0 the top add in this page is a:

    Reported Web Forgery!

    This web page at freepcfixer.info has been reported as a web forgery and has been blocked based on your security preferences.

    Web forgeries are designed to trick you into revealing personal or financial information by imitating sources you may trust.

    Entering any information on this web page may result in identity theft or other fraud.

    http://freepcfixer.info/playerUpdate/?transaction_id=wGNLQQAPA4IILF9EGSIDQ7C6

  8. Werner Brozek says:

    There is no possibility that any satellite data set, whether UAH versions 5.5 or 5.6 or RSS can beat the present record that was set in 1998. Even second place is out of reach in all cases. For UAH version 5.6 for example, the anomaly would have to jump from 0.199 to 0.768 and stay there for the next four months. The highest ever anomaly on version 5.6 was set in April of 1998 when it reached 0.663.

  9. Doug says:

    Yawn …. as I predicted in an archived statement three years ago ….

    From 2003 the effect of El Nińo had passed and a slightly declining trend has been observed. This is the net effect of the 60-year cycle starting to decline whilst the 934 year cycle is still rising. By 2014 the decline should be steeper and continue until at least 2027. (This statement was archived 22 August 2011 here)

  10. Stephen Richards says:

    Werner Brozek says:

    September 2, 2014 at 10:05 PM

    Without adjustments ?

    • Werner Brozek says:

      UAH may come out with new versions, but once they are out, old records are not adjusted as with GISS.

      • DavidA says:

        Of course, for GISS and the surface measurements, stations come and go regularly, so adjustments need to be done regularly.

        That’s not the case for UAH or RSS, it is?

        This makes a case for why GISS could be more reliable…. They do pairwise comparisions every month to check for outlier numbers. Does UAH or RSS do anything of the sort? I would be surprised if they did no checks for internal consistency….

        “Homogenization of Temperature Series via Pairwise Comparisons,” Menne and Williams Jr, J Climate v22 (2008)
        ftp://ftp.ncdc.noaa.gov/pub/data/ushcn/v2/monthly/menne-williams2009.pdf

        • Werner Brozek says:

          So are you suggesting Hadcrut4 is inferior because it does not change its 1998 value every few months in 2014?

  11. JohnKl says:

    Hi Roy,

    Hmmh! The data was given a .1 deg cent warming adjustment in 1998 and likely others. Last I checked the data-set has been adjusted at least 10 times. In addition, the margin of error on these measurements should be around .1 deg centigrade if I remember correctly. Please correct any of this if I misstate anything. We don’t want to be inaccurate. This suggests to me the entire supposed .2 deg cent warming deviation from the mean may just be pure CONJECTURE! Thanks for the data and…

    Have a great day!

  12. rick says:

    Spurious accuracy is a disease that breaks out all the time in science.

    I have just been reading Charles Darwin’s last publication, which was a book on worms. As part of an experiment with earthworms he cut some triangles of paper to see which end would be preferentially grasped and pulled down into the burrows. He gives us the angle at the sharp end – to the nearest minute of arc!

  13. Call me the climate rebel.

    That is the name we came up with for me a few years back. I think it is appropriate because my way of thinking about the climate is new, innovative and different then the conventional way which was climate changes gradually over long periods of time(they are still really saying this now despite their ridiculous global warming scenario). The news boys is the climate changes very rapidly and abruptly when it does change to a different climate regime and only changes gradually when in the same climate regime which we have been in post Dalton.

    Then they say the sun is a non factor in contrast to CO2 . The sun is more or less constant in solar output , no secondary changes can possibly occur from solar variability if it does occur. The news boys is if something that drives a system changes it only stands to reason it is not going to drive that system in the same manner.

    To address the variability issue don’t they remember the Maunder Minimum? I would say that showed quite a lot of solar variability.

    Then they don’t address or comprehend climate thresholds which when reached can have a major impact on the climate but if conditions fall short of the threshold hardly any change may occur. Even the global warming models forecasting all this ridiculous global warming do it in a gradual manner.

    The historical climate record seems to be thrown out the window for if it were not they would not be going on and on about how unusual this so called period of global warming is or( I SHOULD SAY WAS ) when the reality is this pails to historical climatic changes.

    Just a few of the things in this area that bother.

    • Salvatore Del Prete, you say on September 4, 2014 at 8:51 AM

      “Call me the climate rebel.”

      Yeah Salvatore, You do seem to me to be an intelligent fellow who knows a lot of stuff, – – – but I think you may do – sometimes – just like I do (some times) need a “Proof Reader”. (Just to be of help to those among us, me for example, who may, occationately, be suffering from “Word – Blindness”

  14. Aaron S says:

    I did an interesting and very simple calculation as an informal experiment. I took the pdo data and el nino data both in deg C from mean. Then i scaled the sunspot number to match with the other two (i believe i divided it by 125 to approximate the suns climate forcing but this has no empirical basis for the suns strength on global climate. Also, i am aware that both pdo and el nino measurements are regional not global… this was just a game). I took a 5 year running average to smooth the data, then i took all 3 data sets in time and added them up and compared them to the hadcrut 4 global temp data. The outcome was they were in phase and warming during much of the time the earth was warming this century. There did seem to be a lag between the forcing and temperature change and if this proxy has any merit then we should see some cooling soon bc it has left the warming phase to moderate cooling. Of course i dont pretend this is meaningful, or that it can predict change but it did reveal that a large part of the warming could be natural.

    • Fonzarelli says:

      Aaron, I left a link that you were looking for with a very short comment that you made about the “kitten video” (August 25). Let me know that you got it, eh? fonzie

  15. We stumbled over here from a different website and thought I might
    check things out. I like what I see so now i’m following you.
    Look forward to looking over your web page yet again.

  16. ßri says:

    The temperature since 2002 is much more stable than before 2002. The fluctuations aside from 2008 and 2010 are nothing like the data before 2002. This strikes me as an important change or possibly an error but it shows up in other people’s charts.
    I don’t know what could cause this but it is a significant change from the past.
    ßri

  17. Noblesse Oblige says:

    Check out Ross McKitrick’s analysis of the statistical length of The Pause. http://www.scirp.org/journal/PaperInformation.aspx?paperID=49307#.VAjs7BbLL_k
    per his criterion for rejecting the hypothesis of zero slope of the underlying trend in global temp data, going back in time from 2014. No real surprises; the two satellite data sets and the Hadley surface data set give The Pause from as low as 16 and as high as 26 years at the 95% confidence level. It is interesting that the two satellite data sets give a fairly large 10-year difference in the year for the onset of The Pause, with RSS the longer of the two Evidently small differences in noise and perhaps serial correlations give a wider RSS confidence band. That speaks well for Christy-Spencer objectivity in the data processing.

  18. I think how dramatic a climate effect may or may not be depends on how the candidates for climate change phase together. Also the circumstances at the time they phase together.

    Those candidates for my two cents worth being

    solar variability and primary and associated secondary effects

    strength of the earth’s magnetic field which will moderate solar effects

    initial state of the climate -how close to threshold climate is from glacial versus inter-glacial conditions
    which will greatly moderate GIVEN solar effects and earth magnetic field effects

    milankovitch cycles where is earth in reference to these cycles.

    Another factor which is sort of way out is what is the concentration of galactic cosmic rays in the vicinity of the earth (within 6 light years) when solar effects/ geomagnetic effects may be taking place. This might have a moderating effect on their effectiveness.

    Geographical positions of land versus oceans and the ice dynamic at the time.

    This is where I am at. Yesterday’s post was partly out of frustration.

  19. California says:

    Will someone make it rain in California already. They’re suffering the droughtiest drought of droughts.

    Thanks

  20. rick says:

    Remote Sensing Systems have also issued their report for August on the anomalies.

    For Lower Tropopause + 0.19 C
    For Middle Tropopause + 0.13 C
    For Lower Straosphere – 0.45 C

    Essentially, the same as UAH.

  21. rick says:

    Straosphere … Stratosphere

  22. David Johnson says:

    Hasn’t the Earth been cooling since creation with some period warming and cooling but the general trend is cooling from a high of 8 billion years past?
    hasn’t other disruptions of the oceans, tech plates, continents, volcanos and below surface activity been the most determinate of the deviations above the general cooling?
    Hasn’t the Sun’s various energy burst and other celestial forces had the greatest effects on Earths solid and fluid surface temp deviations ?

  23. Kurt Mohlman says:

    I recall a press story attributed to NASA last month saying something along the lines that July was the 2nd hottest month on record and June the hottest. This doesn’t seem to comport with the UAH data, so what data could they be referencing? I couldn’t find the release on any of their websites, only the admission that warming has “stalled”.

  24. rick says:

    “a press story…NASA…June the hottest…”

    I do not know what you have read; but:

    NASA has reported “warmer” months; in February, 1998, at +0.86 C, and January, 2007, at +0.93 C. It also states January, 1944, at + 0.31 C. and February,1889 at +0.17 C.

    The more recent NASA numbers, which perhaps reflect an ‘aborting’ El Nino, are +0.78 C for May, 2014, +0.62 C for June, 2014, and +0.52 C for July, 2014.

    The numerical reduction, from “warmest” in record to most recently recorded, is about the same for NASA, UAH, and RSS.

    If you believe NASA, the world in July, 2014 was 0.20 C warmer than in January, 1944, and 0.34 C warmer than in February, 1889.

    Source

    data.giss.nasa.gov/gistemp/tabledata_V3b/GLB.Ts+dSST.txt

  25. rick says:

    “GISS”

    Of course, this series is from measurements on the surface.

    UAH and RSS are (independent) analyses of satellite remote- sensing measurements.

  26. Finally we came out of the other end having a cohesive product array of CCTV cameras, recorders and accessories which we had been happy with.
    The other item that I found while reviewing the item, that the program didn’t offer is a per
    user charge of blocked web-site categories.
    Samsung cctv dvr software The first installing CCTVs possess a history past
    behind the 1940s that was initially launched for your purpose of overseeing the rocket activities in Germany.

    A study commissioned by UK’s Home office revealed
    that the places that CCTV security systems are installed, crime
    rates have come down owing for the surveillance. At CCTV42 they will often have a great
    deal of security systems available however, you do not need to
    rely for the information given about the website.

    It has sophisticated characteristics and can be monetized effortlessly.
    This is really a very common phenomenon when even essentially the most
    seasoned and celebrated writers run from ideas and
    spend searching for the one which will make an excellent plot to get a novel.

    Cctv dvr philippines throughout (big5.hxb.com.cn) Let us enable you to achieve your academic dreams without stress or difficulties throughout your coursework.

    Arithmetic or math is taught in the lowest
    grade to aid children learn numbers.

  27. baofeng help says:

    It’s the teaser; it is going to be the question or statement that can engage
    the listeners to create sure they tune in. Consequently, I’m sharing this piece
    using the hope and inside spirit of encouraging website visitors to follow their hearts in “going for” after which getting really what they need out of life.
    Baofeng yaesu The former High School Musical star continues to be captured leaving the BBC One
    Radio in London, England on Wednesday, November 30, 2011 using a short
    spikey hair.

    Rather, trunking permits the discrete channels to get dynamically assigned inside a manner
    that is more efficient than non-trunked systems. Baofeng on murs Tenzin: And for myself,
    it’s really down to being tougher, speaking up countless jumping
    to the game more. I can see being kind to people, but I do not think giving
    them money solves the problem.

    This way you’ll soon internalise the skill of writing good articles
    and possess them published all around the net
    in article directory sites. Whether working separately or together, these two are comedy writing legends.
    Jual baofeng kaskus baofeng help Bread Loaf in Vermont – August 13-23, 2014Bread Loaf just
    isn’t a retreat’not only a place to operate in solitude.

    Scenario establishing is very important, take the time
    for you to get it right.

Leave a Reply