Over the next seven days you can expect many news stories coming out of Europe concerning an unusually cold and snowy weather pattern setting up that will hit southern and eastern Europe the hardest.
Up to two feet of snow will occur in some areas with balmy Portugal being the only European country to escape snowfall.
As the following total snowfall forecast map through January 1 shows, even southern Italy, Greece, and far northern Africa can expect snow (graphic courtesy of Weatherbell.com, click to enlarge):
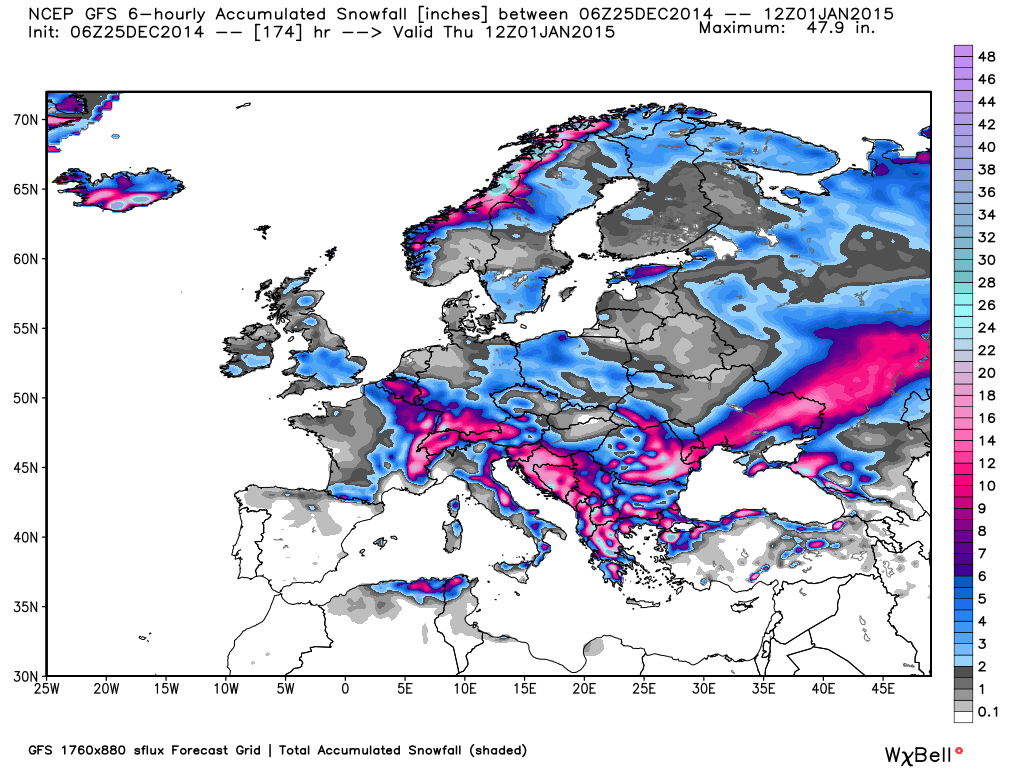
As is usually the case, the cold air is flowing from northwestern Russia westward and southward into Europe, north of persistent broad low pressure that will form over the Mediterranean Sea. The seven-day average temperature departures from normal for Dec. 28 to Jan. 4 will run 10 to 20 deg. F below normal over much of Europe:

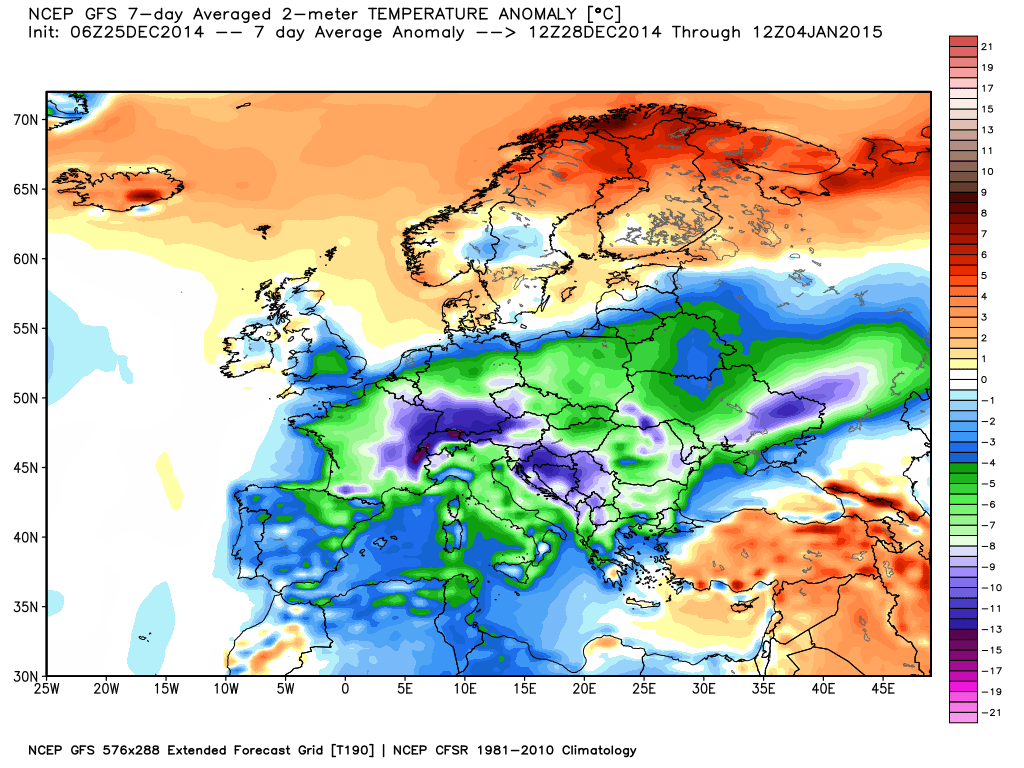
Seven day average temperature departures from normal (deg. C) for the period 28 Dec. to Jan. 4 (GFS model graphic courtesy of Weatherbell.com).
This cold weather will not be welcome by most, as energy prices haven risen significantly across much of Europe, partly due to reliance on expensive renewable energy sources.
Hey! It’s winter shnee kommen and the lifts are running! Who could ask for more? So grab those skies and poles and go find some powder! My how I miss it sometimes.
Yes, it just happened as predicted. Change from 10 degrees plus to -11°C at night within one week. Snow cover 20 cm.
Actuallly, during the verrrry cold times in the past with ice and snow in abundance, we had some green christmas and Ne’erday as well.
The very first Cryosphere Satellite Picture from first January 1979 shows an uber green northern hemisphere with sea ice cover close to today. So where is the change?
http://klimawandler.blogspot.de/2014/12/ein-selfie-unser-erde-vom-nordpol-aus.html
First of all, the ueber-green land is due to the fact that no snow coverage is shown for historical images on UIUC’s Cryosphere Today site, as stated plainly on the historical image page. The author of the Klimanwandler post you cite either did not read or did not understand the notice on the source page or is being purposefully disingenuous.
Where is the change? As a start, you might try comparing the following in the two images:
Sea of Okhotsk
Barents Sea
Greenland Sea
Arctic Ocean between East Siberian Sea and Beaufort Sea
Multi-year ice extent everywhere…etc…etc…etc
Not surprising for those who understand that human emissions of CO2 cannot drive climate change.
Consider:
Annual emissions of CO2 by
Humans = 3.5%
Nature = 96.5%
Annual uptake of CO2 by nature = 98.5%, so annual increase is no more than 1.5% of total annual emissions.
Therefore, long-term human emissions of CO2 cannot exceed 3.5% x 1.5% = 0.0525% of total annual CO2 emissions.
Again, total annual emissions are 850 Gigatonnes of CO2. Only 1.5% carry forward to the next year, or 12.75 Gigatonnes, so mankind does not contribute more than 450 Megatonnes of CO2 to the annual increases in atmospheric CO2.
The atmosphere’s mass is 5.15E15 tonnes, of which CO2 makes up 0.06% by weight, or 3100 Gigatonnes.
Now, the Greenhouse Warming on Earth is attributable to mostly water vapor and carbon dioxide as follows:
H2O = 95%
CO2 = 5%
Let’s say Greenhouse Warming really is as high as +33C. Then, the warming attributable to ALL atmospheric CO2 is
+33 x 0.05 = +1.65C
The long-term annual (maximum) possible effect of human CO2 emissions must be limited to
0.450 Gigatonnes / 3100 Gigatonnes x +1.65C = +0.00024C.
Therefore, if there is no positive feedback, or if net feedback is negative, then 165 years of fossil fuel consumption by mankind cannot have added more than +0.04C.
It is very hard to imagine this tiny bit of (unmeasurable) anthropogenic warming could possibly produce an effect equal to +5C over the next 150 years. One needs to imagine a long term feedback/amplification of at least 50X. I agree with the evaluation of the good Dr. Spencer that this type of enormous feedback due to a tiny bit of added CO2 warming is not in evidence. The long term (165-year) warming has been less than +1.5C, and more than half of this is already known to be due to nature. Just a little bit of effort and investigation is required to show how nearly ALL of the warming has been natural.
Whether money needs to be provided to prove this is questionable. Mother nature herself will be producing the cooling, and will prove the absurdity of science of CAGW proponents.
John Olson,
Are these generally accepted percentages and temperatures you’re using?
I printed off your post to show a family member and got the standard-with-them reply that it was some bozo poster making up stuff on the fly.
I finally got some of them to understand that it takes ~95 cubic miles of melted sea water to raise the ocean sea level by 1mm by showing water and ice conversion rates. I was hope to make another hit with your post.
Is there anything you can point me to? Thanks.
MRW, one flaw in john’s logic may (or may not) be that he’s ignoring the carbon cycle… The thinking is that while natural throughput is large nature takes out as much as it puts in. Then along comes human emissions which get added to the atmosphere. The human emissions’ mass stays in the atmosphere because it’s not part of the cycle. This would be easily verifiable if the observed rise were equal to the human emissions, but since the rise is only half of human emissions this opens up the possibility that what john is saying could be true. If nature is taking out half of the emissions then there is no reason why nature couldn’t be taking out a whole lot more than 50%. If the equilibrium sink rate for the anthropogenic source is the same as nature’s sink rate (98%) then what john is saying may well be true…
Heck they still haven’t figured out where about 3% of the carbon that leaves the atmosphere goes even without the human component last I read! There is a sink of some kind they have yet to identify apparently. Where does that 3% go? Has someone figured it out? If they haven’t yet been able to identify all the basic components of the carbon cycle then how are they going to be able to accurately quantify mans impact on it?
And if the both the ocean and the atmosphere are heating up as some are claiming then were is the corresponding jump in the amount of CO2 in the atmosphere that should be seen? A warm ocean cannot hold as much CO2 as a cold one. Should there not be a measurable spike in CO2 in the atmosphere? Where is that CO2 the generally warmer oceans are not absorbing going?
And I wonder how CO2 in the atmosphere could have ever been claimed to be the “temperature control” for the earth. Declared the key node that would cause a “tipping point” that would throw the climate out of kilter with run away feed backs driving us to a “death spiral” of warming? Is there evidence that indicates that CO2 has ever had such a role before in the climate of this planet?
You could search on WUWT for the exact numbers but the idea is somehow like that:
From the yearly input of human-made CO2 about 50% (IPCC) up to over 80% (some paper on WUWT)is captured by the biomass and stored in the living plants and the soil. Ab big amount is as well carbonized in the oceans and added to the limestone on the ground. So we have
– more plants (and more than 1% of increase of agricultural products per year)
– more Limstone
– and an annual increase of CO2 in the air
which seems to have not much influence.
Yes I understand the known sinks. But Have they gotten the equation:
Atmospheric CO2 Increase = Human Emissions + Land Use – Ocean Uptake
To balance? Last I knew it still did not. And until the missing carbon can be accounted for our knowledge of the Carbon Cycle is incomplete.
Fonz et al,
Isnt the simplest explanation that we are currently out of equilibrium due to the rate and amount of CO2 from people burning FF, even using your own logic? Yes CO2 lags temperature under normal conditions (major volcanoes or intelligent life’s addiction to energy being the exception). As i see it the temp is not higher than equivalent phases in the past like 120kyr aago when sea level was 6m higher than today (this is easy to see by looking at all the carbonate islands near thailand that reached equilibrium and grew to the photic zone and are now exposed for us to enjoy) or in the Medieval warm period (when iceland was green), but by all methods ive seen indicate CO2 was significantly lower then compared to now. We are approaching Miocene Pliocene levels. Also we are pumping measurable amounts of CO2 annually. I guess a lesson i learned is it takes an overwhelming data set to turn over a theory backed by so much data, and to be honest I dont see any such data presented. Diatoms cocoliths (phytoplankton) trees soils (coals or histosols) carbonate are big sinks but the intake rates are not on the same order as human output. A cm or sediment or a reef can take 100s to 1000s of years to deposit for example.
Aaron, i think the “simplest” explanation would be the one john laid out… From all outward appearances the rise looks to be from natural sources. (the anthropenic addition is very small and carbon growth tracks temps not emissions) But as we all know, the simplest explanation is not always the correct one. You’ve laid out two consensus counter arguments here. First that historical proxy data shows lower levels in the recent past and secondly that sinks don’t have the capacity to take out all our carbon. I think that your first argument is the tougher one to counter, the second one seems relatively easy. The point is that i don’t think the we’re giving a “bad name to sincere skepticism” (as you stated in your comment below) by challenging these arguments. And who knows, maybe by questioning them perhaps one might realize that the consensus was right after all. (that happens to me all the time) I have yet a lot of questions that don’t seem to have easy answers regarding both proxies and carbon sinks. And i’ll keep pressing on until i find those answers. Should be a fun new year…
Unfortunately, a simplistic, linear, “assume the cow is sphere” approach does not apply to Earth’s climate, which is a chaotic system with a multitude of feedback and forcing mechanisms, many of which have non-linear components. For example, consider the Earth’s albedo, which is influenced by ice coverage. Ice and snow, which have reflective coefficients 5 – 10 times that of water, turn to water at 0 deg C. You might also want to take a moment to consider that the human component was insignificant until about 150 years ago, has been increasing ever since, and will continue to increase unless mitigation of some kind is undertaken. In less than two centuries, atmospheric CO2 has grown to 140% of its maximum of the previous half-million years.
Slipstick, it was YOU who tipped me off a while back that sea levels also began to rise about 150 years ago after holding steady for 2,000 years. (and i DO thank you for that) So henry’s law could be at play here, especially when we realize that carbon growth tracks with temperature and NOT human emissions. (see my comment and link to “bassman” further on down the page) Also consider that ice cores are an unverified wild card in all this. We simply DO NOT KNOW what happens to co2 after hundreds and thousands of years in ice…
A little critical thinking experiment for the New Year:
If you have an ice core with entrapped atmospheric gases from hundred of thousands of years and there was some mechanism that would cause a degradation of the CO2 signal in those gases, don’t you think that the degradation would be apparent in the signal itself?
To your preceding point, the carbon growth tracks with temperature AS WELL AS (your emphasis rule) human emissions. More carbon (human), temperature rises, carbon rises (human and temperature), carbon rises faster, temperature rises faster, ad calamitatum.
I should have said “carbon in seas rises”…
Slip, do a little thinking yourself… In order to maintain the signal, obviously degradation would have to shut down at some point (presumably because of pressure). That way you could have smoothing going on in the short term (several thousand years) while maintaining peaks every hundred thousand years…
AND, to your second point, please, slip pledge to do a whole lot more thinking in the new year. This rubbish is not even worth responding to…*
*by this comment i don’t want to give the impression that i don’t like your comments (i really do..). Keep up the good work, but try just a little bit harder… HNY (happy new year)
Fonzarelli, this reply is to an earlier post since we have exceeded the stack limit.
I can’t think of a single physical or chemical mechanism that would have the signal degrading effect you propose and not be plainly visible in the signal, particularly in relation to the other atmospheric gases also entrapped.
In any case, a very Happy New Year to you and yours, as well.
Intense cold grips Himachal Pradesh, hundreds of roads blocked
http://timesofindia.indiatimes.com/india/Intense-cold-grips-Himachal-Pradesh-hundreds-of-roads-blocked/articleshow/45516868.cms?intenttarget=no&utm_source=TOI_AShow_OBWidget&utm_medium=Int_Ref&utm_campaign=TOI_AShow
Reply
Delhi colder than London, Shimla
http://timesofindia.indiatimes.com/india/Delhi-colder-than-London-Shimla/articleshow/45610151.cms
This is a bit silly.Europe has been extremely warm this fall and winter!
And Canada has almost no snow coast to coast. Warm records on the East. But hey, lets not cherry pick.
Just drove up and back to Bolton, ON north of Toronto on Hwy 50. Little snow on the ground at that time but some pretty good piles still sitting around from when they plowed previously. Little ski area S. of the 401 in the Cambridge area still in operation with it’s lights on for night skiing.
There was no snow on the ground in Calgary during the Calgary Winter Olympics in 1988. I was there.
What is silly is that Dr. David Viner still has a job having anything to do with forecasting weather or climate. http://www.independent.co.uk/environment/snowfalls-are-now-just-a-thing-of-the-past-724017.html
March, 2000:
“Dr David Viner, a senior research scientist at the climatic research unit (CRU) of the University of East Anglia,within a few years winter snowfall will become “a very rare and exciting event”.
“Children just aren’t going to know what snow is,” he said.”
———————————————————
http://www.bbc.com/news/uk-30610567
“Wintry showers hit Northern Ireland, Wales and eastern England on Saturday, with the town of Leek in Staffordshire recording the day’s heaviest snowfall of 12cm (4.7in).”
Santa,
I think you have been in Florida delivering gifts. As you head north, note that is snowing in parts of Canada and getting colder by the minute.
In a week your cherry red cheeks will be buried in that white stuff some call “global warming.”
Check back with us on January 2nd.
Happy New Year
John olson,
Where do you get your stats at? Those are far away from conventional numbers. Where is all of this natural CO2 that you speak of sourced from?
“Riding the global cycles
Diatoms fix as much carbon dioxide as all the rainforests of the world combined, and they may very well have been the main architects of our current, moderately cool climate situation. The rise of the diatoms began in a much warmer climate than ours, with no ice caps on the poles. The atmospheric carbon dioxide concentration was much higher than today. In the Cretaceous, around 100 million years ago, when diatoms began to become widespread and developed great diversity, the carbon dioxide level was fivefold higher than today, and oxygen was lower. Remarkably, diatoms managed to thrive and expand during a period of extreme climate change, and they also seem to have come through the mass extinction that saw off the dinosaurs without too many problems. The opening of the Drake Passage around 40 million years ago, which created the continent of Antarctica, was particularly beneficial for the diatoms because they began to proliferate dramatically in the cold turbulent waters of the Southern Ocean.
As diatoms evolved thicker and denser cell walls and spread across the oceans, it became more likely that dead diatoms might sink to the ocean floor and thus sequester their carbon.”
http://www.sciencedirect.com/science/article/pii/S0960982212008664
“Shells – Carbon Transport Down to the Deep
Shell-building organisms such as coral, oysters, lobsters, pteropods, sea urchins, and some species of phytoplankton use calcium carbonate ions to build their shells, plates and inner skeletons. The carbon that is incorporated into the shells of these organisms can end up in deep ocean sediments as these organisms die and sink. Although some of the shells dissolve before reaching the seafloor sediments, shells slowly build up on the sea floor storing the carbon for millions of years.
Coccolithophores
Coccolithophores[reuse info] Phytoplankton bloom Key of Biscaye france
[reuse info] Coccolithophores perhaps have had the biggest impact on the carbon cycle over time. These microscopic phytoplankton remove carbonate ions and calcium ions from seawater to build their calcium carbonate (CaCO3) plates – called coccoliths. When there is plenty of sunlight and nutrients, these tiny phytoplankton will explosively reproduce, producing a “bloom” of trillions of coccolithophores floating in the surface of the ocean. Satellites can see these blooms from space, such as the very large bloom above that appeared off the coast of Norway in the Barents Sea. In just a few days, coccolithophores gobble up the available nutrients and start to die. The trillions of coccolith plates slowly sink down to the bottom of the ocean taking the calcium carbonate in their plates with them.
The calcium carbonate in these sediments are actually chalk – the same type of chalk used to write on blackboards. Sometimes slow tectonic movements will force these chalky sediments above sea level. The White Cliffs of Dover are in England are perhaps the best known example of this. To find out more, read about Coccolithophores and White Cliffs of Dover and then play the video “Chalk Dust.”
http://serc.carleton.edu/eslabs/carbon/6a.html
“The ratio between the concentrations of nitrogen, phosphorus and silicate in particular areas of the ocean dictates competitive dominance within phytoplankton communities. Each ratio essentially tips the odds in favor of either diatoms or more other groups of phytoplankton, such as coccolithophores. A low silicate to nitrogen and phosphorus ratio allows coccolithophores to outcompete other phytoplankton species; however, when silicate to phosphorus to nitrogen ratios are high coccolithophores are outcompeted by diatoms. The increase in agricultural processes lead to eutrophication of waters and thus, coccolithophore blooms in these high nitrogen and phosphorus, low silicate environments.”
http://en.wikipedia.org/wiki/Coccolithophore
Still confused because claiming 95% of CO2 flux is from natural sources is either irrelevant bc what is important is the atmospheric concentration not the sequestered component (C-cycle) or wrong. There is truth that diatoms can sequester large amounts of co2 (the accumulations are where some oil comes from) and they may provide a negative feedback to CO2 accumulation in the atm, but the rates for the processes are different and the CO2 increase we see in the atmosphere at human time scales is from the addition of CO2 from burning fossil fuels. This is not to say there is not a biological feedback bc i think there is, but we will continue to raise CO2 as long as the system is out of equilibrium due to burning fossil fuels. The issue is how sensitive is climate to CO2. Finally bc diatoms have silica shells it requires rapid burial into an anoxic depocenter to sequester CO2. If we spike iron to increase diatom growth there is some data that the diatoms change shell structure and sink slower. Thus it the feedback is very complicated. Cocoliths have carbonate test so they sequester CO2 if they can just make it below the CCD. Different processes and very complex interactions.
Is there a problem?
https://wattsupwiththat.files.wordpress.com/2014/12/noaa-world-ph-map.png
Aaron says: “…but we will continue to raise CO2 as long as the system is out of equilibrium due to burning fossil fuels.”
Aaron, whenever you make a statement like that, it shows that your “belief system” trumps your science.
The “evidence” that “the system is out of equilibrium” is sorely lacking. But, it gets worse for Warmists. There is lessening evidence that increasing atmospheric CO2 can increase warming–CO2 levels increasing, but global temps flattening. Evidence is not proof, but when the scant evidence falls apart, it’s time to get a new “belief system”.
You posted a figure from NOAA showing what appears to be pH of the world ocean from whats up w that, and a bunch of exerpts about phytoplankton that you clearly dont understand… I am really confused. I am going to assume i am addressing youth or newbies to the field here. So lets get some clarity… Lol… what exactly are you saying: a. You dont believe you can measure atmospheric CO2 or b. That the pattern of increase in observed atm CO2 measurements is not from human activity? If a., then it is like you are ignorant and regurgitating statistics that you dont understand and in the process giving a bad name to sincere skeptisism about the IPCC models and climate system based on data driven science bc you dont understand measurement and repeatability. If b., then read up on historical CO2 from ice core data to see how the system naturally behaves through multiple eccentricity cycles. Yes there is a natural carbon cycle and it is huge and complex but there is clearly abnormal CO2 in the system now due to the rate humans consume and oxidize hydrocarbons. The Earth will eventually equilibrate but in human time, the process is to slow to significantly matter. That said the IPCC models were off in predicting the rate of CO2 increase likely due to a biological negative feedback. This discovery is significant but not at the same scale as the potential error in climate sensitivity to CO2 as per the models.
Either way, please take a break have a merry Christmas, and use your passion in a positive way and learn. The last link is a fantastic list of great literature i enjoy reading.
http://cdiac.ornl.gov/trends/co2/graphics/SIOMLOINSITUTHRU2008.JPG
http://cdiac.ornl.gov/trends/co2/ice_core_co2.html
http://www.populartechnology.net/2009/10/peer-reviewed-papers-supporting.html?m=1
Thank you @ren for a balanced and factual post. I learned from it. Regrettably not all skeptics learned good manners at home and I must apologize for the gratuitously abusive comments you received.
Aaron, you’re really opening a “can of worms” with this one here! I myself was hoping to wait til the new year to get into this very topic. (so i guess the new year is coming a bit early for me…) I suppose the big QUE is the validity of ice cores. There really is no verification of ice cores. While shallow cores do corroborate each other well, they could ALL have the same problem regarding smoothing and perhaps co2 getting lost in the ice. We simply do not know what the current atmospheric rise in co2 will look like in ice cores hundreds and thousands of years from now. Apparently co2 migrates through capillaries in ice as well as through the ice itself. This could be impacting co2 levels even in the shallow cores. This is a BIG topic with many aspects to it so it should be an interesting new year for yours truly (fonzie…). I’d appreciate any and all feedback from you here. As you know, I highly value your input and I see this as a great opportunity to learn from you (especially since you’ve mentioned that you may be taking a brake from commenting soon). I want to leave you here with a reproduction of a comment (at watts) by Tom van Hoof, the author of a paper comparing stomata with shallow ice cores. The last sentence i have highlighted with capital letters:
Tom van Hoof 12/28/10 6:48a (wuwt) “The lone fact that stomata data of the USA and Europe have the same timing of a co2 wiggle which has also been recorded (but with a much lower amplitude) in two Antarctic ice cores is evidence enough that co2 variability has been larger in the past millennium than assumed. If the variability would have been as small as the ice cores tell us, PLANTS WOULD HAVE NEVER, EVER PICKED THIS SIGNAL UP ON TWO DIFFERENT CONTINENTS ON ANOTHER HEMISPHERE”
I have been very fortunate to have discussions about this resolution issue directly with Lonnie Thompson from Ohio State who did much of the actual research on ice cores that was abused in the movie an inconvenient truth. He is a scientist and data driven and a very constructive man. His views at the time were that the resolution is potentially poor because as he described it the process of transitioning from snow to firn to ice could include time averaging as bubbles reorganize, whereas the isotopes are from solid water and stay put. So i dont disagree that there is potential for an excursion like this that was missed in deep time. However, there are other cores with annual resolution from much faster snow fall rates. They seem to record the same data at a very high resolution but dont extend back as far. I can try and get you the citation. However, i do think time averaging in proxy data is a very real concern that is often overlooked so id be interested to see what you dig up.
Regarding my previous posts sorry i reacted as i did bc there was a better way to handle myself. I was taken off guard by the implication i was not data driven… that is about as low of a blow as you can give me. I should have just shared the logic and suggested there can always be an alternative.
Lonnie Thompson, the “Serial non-archiver” ?
http://climateaudit.org/2012/07/01/lonnie-and-ellen-serial-non-archivers/
That is a shame (as reported there) and i agree strongly that all NSF funded raw data should be shared once the researcher has sufficient time to synthesize and publish. I still say he is an open-minded man that shared incredible insight with me. I studied high resolution tree rings and annual sediment layers and hence our conversation about ice resolution. It was about the same time that the paper came out indicating the lag of CO2 behind temperature-he was open minded to the new concept. As a note he also seemed open minded about a stronger natural climate forcing from the sun. He was encouraging.
Aaron, it’s amazing how easily demonized people can become in the agw debate. From the sounds of it (from some quarters) one would think that Thompson has horns growing out of his head. How did you manage to meet him? (i don’t recall you mentioning your alma mater; was it ohio state?) Maybe you could tell us how inconvenient truth “abused” his research…
http://cdiac.ornl.gov/trends/co2/lawdome.html
This is a good start. There is another 2014 nature paper about lead that shows annual resolution in ice, but they did not evaluate CO2
Obviously has nothing to do with the problem of getting Russian gas through the Ukraine.
Agreed. âş
Dr. Roy Spencer observe polar vortex at 17 km.
http://earth.nullschool.net/#2014/12/31/0000Z/wind/isobaric/70hPa/orthographic=26.65,84.20,318
http://www.livefromiceland.is/webcams/bardarbunga/
Thanks, Dr. Spencer.
It sure looks cold!
This is the snow situation here, according to NOAA:
http://www.nohrsc.noaa.gov/snow_model/images/full/National/nsm_depth/nsm_depth_current_National.jpg
And for those interested, there is the Global and Regional Climate Anomalies (NCEP GFSR 2m Temperature Anomalies. Karsten Haustein), at http://www.karstenhaustein.com/climate.php
It is snowing where I live in Lincoln so the forecast is holding up so far,I am sure that it will be dismissed as a once in a hundred year event now because of global warming.
Cherry picking much? Why single out a single and unremarkable cold period and write nothing about the fact that it has been a record warm year in Europe?
For a climate scientist, the first should not even be newsworthy, the latter should!
By the way, the ratio of renewable energy over conventional energy in Europe is still pathetic. To think that prices are significantly influenced by renewables is hilarious.
Gijs,
What ratio of alternative to conventional would suit you? Do you mind waiting a few weeks, or would you prefer it be done over a long weekend?
And if you don’t think the costs of alternatives influences pricing in general, please give me some reference material supporting your position.
In any event, appreciate the benefits that conventional energy sources have given the developed world and will give the underdeveloped world, if only allowed to.
Happy New Year
NOAA is suggesting that 2014 could well be the hottest year on record.
http://www.ncdc.noaa.gov/sotc/summary-info/global/2014/11
And, contrary to Dr. Spencer’s assertion in his December 4 post that record high temps this year were mostly due to the urban heat island effect, NOAA reports that the record global temp through November has been largely due to ocean temperature increases.
“The global ocean surface temperature for the year-to-date [Jan-Nov] was 1.03°F (0.57°C) above average, the warmest such period on record, surpassing the previous record set in 1998 by 0.07°F (0.04°C). The margin of error is ±0.07°F (0.04°C).”
@Ted
(1) That’s the satellite record. Since 1979. That’s 35 years of “recorded history.”
(2) You mean the same NCDC.NOAA that predicted on October 16, 2014 that the 90-day winter forecast for the US would mean a warmerr winter east of the Rockies with no repeat of last year’s cold weather? They couldn’t even get the Halloween blizzards in the SE USA right, much less what’s about to hit in January.
(3) You need to watch Joe Bastardi’s recent weather video on weatherbell.com to get a correction on your understanding of how the global sea surface temps work. The ocean temps around the world are not uniform. In fact, it’s their differences vis-a-vis the atmosphere that determine weather fronts.
(4) 2014 will not be the hottest year in the satellite record. The Japanese, Danes, and Europeans produce global data, use different models, and do not comport with this.
MRW, NOAA and JMA will be the warmest on record for 2014, NASA will tie or be the warmest on record. HadCrut will be the warmest on record. All in a neutral year without an El Nińo. Ocean surface temps aren’t surprising at there current level, with a year or two of more positive PDO. Imagine, a neutral year being warmer than an El Nińo year just 4 years prior (2010). Clearly natural factors are shifting back to normal coinciding with unrelenting AGW.
Below is a really great paper about the likelyhood of future warming hiatus periods under 2 emmisions strategies. It is no longer behind a paywall and recent 2014.
http://web.science.unsw.edu.au/~matthew/Maher_et_al_GRL_EOR_2014.pdf
Bassman, the thought occurred to me when I last showed you this graph that you may not have seen it (or similar graphs) before… This is a graph of the carbon GROWTH RATE coupled with Hadley southern hemisphere temps. You can clearly see that carbon growth is tracking with temperature. (that is, the amount being added to the atmosphere tracks temps) Human emissions have NO impact on carbon growth. Therefor, whether we go with either emissions scenario makes no difference what so ever…
http://www.woodfortrees.org/plot/esrl-co2/from:1959/mean:24/derivative/plot/hadcrut4sh/from:1959/scale:0.22/offset:0.10
bassman, do you REALLY believe 2014 is the warmest year on record?
Do you REALLY believe the lack of a strong El Nino is “proof” of AGW?
Do you REALLY believe the “unrelenting AGW” causes record global sea ice?
Do you REALLY believe you can ever untangle yourself from your false science and someday see reality?
Just asking….
Let’s see the oceans temperature anomalies. Clearly, the higher the temperature at North America follows to the constant air circulation.
http://weather.gc.ca/data/saisons/images_loop/[email protected]@sd_000.png
http://www.cpc.ncep.noaa.gov/products/stratosphere/strat_a_f/gif_files/gfs_z70_nh_f00.gif
Las Vegas has a chance for snow.
http://oi62.tinypic.com/2wq8u9g.jpg
Cool ocean will absorb more CO2 and life in him will be to bloom.
Its a quite odd winter to be honest. I d expected cold and even snowy weather from dec 15 th on in western europe but the opposite was treu. The 15 day ahead predictions stil dont show any sign of winterweather in west/Nw Europe.
Yoni says:
“The 15 day ahead predictions still don’t show any sign of winter weather in West/NW Europe.”
My garden pond, on the South Coast of England, froze two inches deep last night. I guess it must be summer.
I am based closed to Sheffield England. We were told we would get sleet for a few hours and ended up with 3 to 4 inches of snow. It’s freezing over at the moment. I have managed to get some great snaps of the countryside around where I live, it looks so different.
http://timawells.wordpress.com/2014/12/28/anston-and-dinnington-snow-scenes/
Soy un fan de tu foro y aunque me parece mejor que otros
considero que carece de unas cosillas que si
tienen los competidores Progresa assi y llos mejoraras.
Dr. Roy, allow me to translate the above, from my rusty Spanish: “Spam”.
(No charge.)
What will happen in east asia and over the pacific? Northern pacific and Arctic?
Winds and moisture?
Weather?
Well, this is all rather wonderful – all these lovely doubts I paid the agencies for to set this up, and you are all doing the arguing and raising doubts for free – I really must commend you.
The $1 billion we and Exxon make in revenues each year will be safe for ages to come – thank you all for contributing your own hot-air to our marketing on doubt.
So you liked that? Have some more: http://stevengoddard.wordpress.com/2014/12/30/new-years-resolutions-for-climate-scientists/
http://wattsupwiththat.com/2014/12/30/another-year-of-not-living-dangerously-in-spite-of-global-warming/
Are you saying here that the party line should never be doubted? Good grievance, you have more faith in your fellow men than is deserved…
Concerning consensus.
“the seeker after truth does not place his faith in any mere consensus, however venerable. Instead, he checks”.
Written by Al-Haytham astronomer and philosopher of science in 11th-century Iraq recognized as the father of the scientific method.
Pulled that little Gem from one of Lord Christopher Monckton’s articles.
Text written by Professor. Walter Jensen Chemol project and adapted Marlene
Rau and Andrew Brown.
“Carbon dioxide (CO2 relative molecular weight: 44.01) is a colorless,
odorless and non-flammable gas. Its density is 1.977 g / l (at
0 ° C) and the melting point of -57 ° C (at a pressure of 5185 bar).
The solubility of carbon dioxide increases with the pressure of 100 parts of water
dissolved 171 parts of carbon dioxide at 0 ° C, 119 at 10 ° C, 88 at 20 ° C,
75.7 at 25 ° C and 27 at 60 ° C. For example, 1 liter of CO2 dissolved in 1 liter of water (in
room temperature) at a pressure of 1 bar (normal pressure
air); 2 liters of CO2 at 2 bars; 3 l at 3 bar, and in 4 l at 4 bar. solution
water is slightly acidic because 0.1% of dissolved carbon dioxide molecules
reacts with water.”
Bubbles that we drink in mineral water is not carbonic acid.
“Period of stabilization of the magnetic activity Sun.
Stabilization period earthly pole position
Descending upwelling in the ocean causing a decline in their photosynthesis and warming seawater
Reducing CO2 solubility in seawater as a result of heating surface ocean waters, reducing the absorption of CO2 in the process of photosynthesis, increase the content of CO2 gas in the surface waters of the sea due to the increased acidity, decrease absorption of CO2 from the atmosphere and gradually increasing the concentration of CO2 in the atmosphere by diffusion of excess CO2 from seawater into the atmosphere to a level of 300 ppmv over the duration of about 20 000 years Earth’s poles traffic loss and the consequent warming ocean waters about 12 ° C and warming the Earth about 12 ° C.”
I’m a fan of polar stratospheric temperature as a climate regulator. This year’s temperature is right on the mean. Compare with last year. If that is predictive, I would say that this year’s winter will be more or less normal. That doesn’t mean that anomalous cold won’t show up here and there.
http://www.cpc.ncep.noaa.gov/products/stratosphere/temperature/30mb9065.gif
It depends on the magnetic activity of the sun jumps. Each jump it wave in the stratosphere.
http://cosmicrays.oulu.fi/webform/query.cgi?startday=01&startmonth=09&startyear=2014&starttime=00%3A00&endday=31&endmonth=12&endyear=2014&endtime=00%3A00&resolution=Automatic+choice&picture=on
Follow the data.
http://www.cpc.ncep.noaa.gov/products/stratosphere/strat-trop/
My New Years Prediction. AGW will be obsolete before this decade ends.
I will go so far to say year 2015 will be the start of a definitive lower trend in global temperatures in contrast to the pause that has taken place for some 18 years.
This will be tied to weak solar conditions which should come into play during year 2015 following 10 years of sub-solar activity which started in earnest in late 2005.
http://weather.gc.ca/satellite/animateweb_e.html?imagetype=satellite&imagename=goes_nam_1070x_m_………………jpg&nbimages=1&clf=1
Apologies for the following, but I hear this sort of response to unpleasant (or should I say “inconvenient” *wink*) facts so often that I just have to say it once:
Ooooh, cold and snow in winter, what a shock! But it’s a natural process, although I have no evidence indicating what that process might be.
(snark setting now returned to normal)
Happy New Year and the best of everything this year to all!
You made the same prediction in 2013. You were wrong then. And you’re wrong now.
Dear weather/climate interested people,
the 7 day winter in central europe is OVER and westwind weather will dominate the upcoming january. The year 2015 will start with warm. The record year 2014 woll continue. We expect heavy storms for the german noth sea coast in one week. Well, time will tell….
writing regards
Thank you Peter. I rest my case (made in the first part of my previous comment).
This has been a short and unimpressive cold period. Nothing special to write about on a climate blog. It’s winter in Europe. They can wake me up when this happens during summer. Or when this blog writes about a warm period somewhere and makes a remark on how that will not be welcomed by many people because of the extra costs for air conditioning.
I live in northern french alps and we have had the worst beginning for a ski season since winter 88/89. Very few low elevation resorts open, or only partially thanks to a very very hard daily work, and no snow scheduled for the coming week due to the return of mild temperatures….
I like this blog its a master peace! Glad I detected this on google.