UAH Global Temperature Update for Nov. 2014: +0.33 deg. C

December 2nd, 2014 by Roy W. Spencer, Ph. D.

The Version 5.6 global average lower tropospheric temperature (LT) anomaly for November, 2014 is +0.33 deg. C, down a little from the October value of +0.37 deg. C (click for full size version):
UAH_LT_1979_thru_November_2014_v5

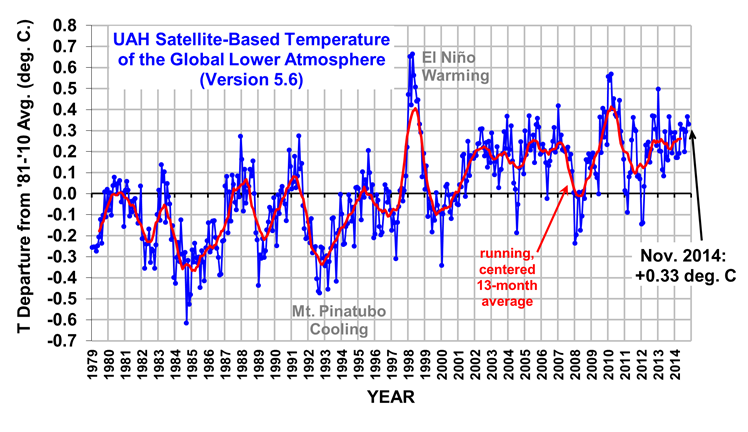
The global, hemispheric, and tropical LT anomalies from the 30-year (1981-2010) average for the last 23 months are:

YR MON GLOBAL NH SH TROPICS
2013 1 +0.497 +0.517 +0.478 +0.386
2013 2 +0.203 +0.372 +0.033 +0.195
2013 3 +0.200 +0.333 +0.067 +0.243
2013 4 +0.114 +0.128 +0.101 +0.165
2013 5 +0.082 +0.180 -0.015 +0.112
2013 6 +0.295 +0.335 +0.255 +0.220
2013 7 +0.173 +0.134 +0.211 +0.074
2013 8 +0.158 +0.111 +0.206 +0.009
2013 9 +0.365 +0.339 +0.390 +0.190
2013 10 +0.290 +0.331 +0.249 +0.031
2013 11 +0.193 +0.160 +0.226 +0.020
2013 12 +0.266 +0.272 +0.260 +0.057
2014 1 +0.291 +0.387 +0.194 -0.029
2014 2 +0.170 +0.320 +0.020 -0.103
2014 3 +0.170 +0.338 +0.002 -0.001
2014 4 +0.190 +0.358 +0.022 +0.092
2014 5 +0.326 +0.325 +0.328 +0.175
2014 6 +0.305 +0.315 +0.295 +0.510
2014 7 +0.304 +0.289 +0.319 +0.451
2014 8 +0.199 +0.244 +0.153 +0.061
2014 9 +0.294 +0.187 +0.401 +0.181
2014 10 +0.365 +0.333 +0.396 +0.189
2014 11 +0.329 +0.356 +0.302 +0.252

As I have mentioned before, month-to-month variations in global tropospheric temperature can be rather large just due to variations in convective overturning of the atmosphere (storm activity). To demonstrate how large the changes can be, the following plot shows the daily temperature anomalies for November, 2014. Note that the tropical troposphere warmed by 0.5 deg. C in less than 2 weeks, presumably coming out of a less convective phase.

LT-daily-variations-Nov-2014

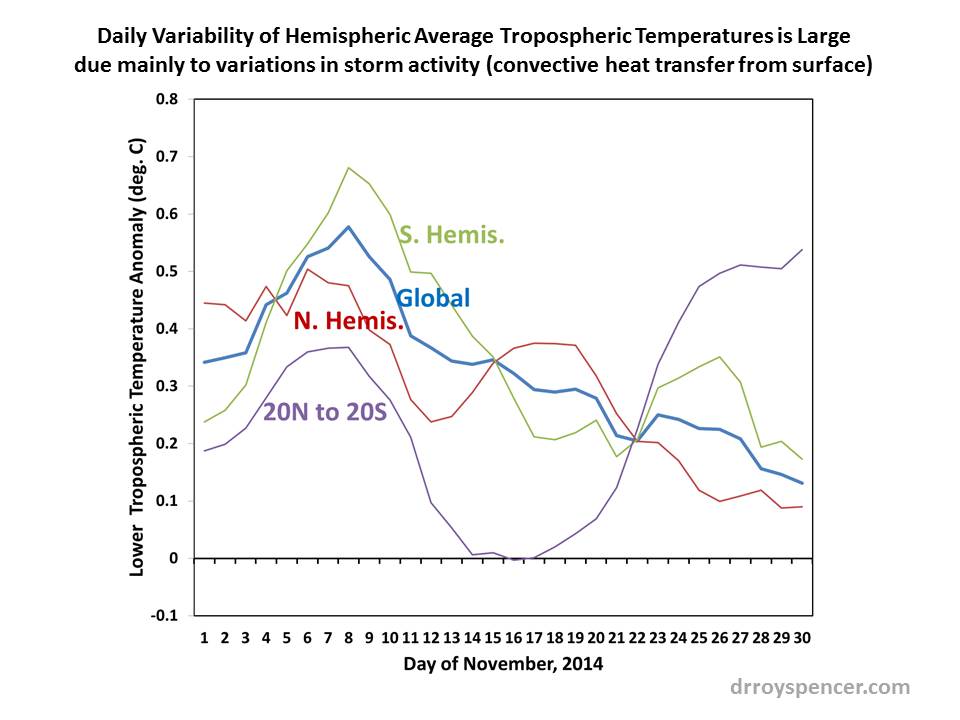
Despite this rise in late November tropical temperatures, note the extratropics must have cooled since both the NH and SH show downward trends. While this variability in tropospheric temperature might suggest just how dynamic the climate system is, it requires less than 10% variability in storm activity. In general, rapid tropospheric warming events occur during SST cooling (and vice versa), which is much weaker in magnitude owing to the very different heat capacities of water versus air.

The global image for November should be available in the next day or so here.

Popular monthly data files (these might take a few days to update):

uahncdc_lt_5.6.txt (Lower Troposphere)
uahncdc_mt_5.6.txt (Mid-Troposphere)
uahncdc_ls_5.6.txt (Lower Stratosphere)


126 Responses to “UAH Global Temperature Update for Nov. 2014: +0.33 deg. C”

Toggle Trackbacks

  1. bassman says:

    Dr. spencer, Thanks for the update and extra chart. I’m guessing this means Dec will start off a lot cooler. Dec would have to clear .20 for UAH to come in as the 3rd warmest for 2013.

  2. phi says:

    Dr Spencer,
    It seems that a divergence of the land fraction UAH TLT appear from 2005. Do you have an idea of its cause?http://oi57.tinypic.com/2nvgjmq.jpg

    • Yes, the land temperatures seems to diverge warmer than the ocean after about 1998-2000. We have been looking at this closely in our new Version 6 data (under development) to see if it is an artifact of the newer AMSU instruments starting about the same time. We don’t have an answer yet regarding how much of this is real.

      • phi says:

        Dr Spencer,
        Thank you for your reply. The consistency of all curves except CRUTEM is quite remarkable until 2005.

      • MarkB says:

        While checking and re-checking one’s measurements is never a bad thing, it’s relevant that that such a divergence in land and sea temperatures is consistent with ocean dynamics suppressing warming over the last decade and change. It’s also relevant that RSS and the surface temperature records show a similar phenomena.

        • Kristian says:

          MarkB says, December 2, 2014 at 12:24 PM:

          “It’s also relevant that RSS and the surface temperature records show a similar phenomena.”

          I believe that’s exactly what RSS don’t do. They don’t show this strange, sudden, massive 2005-06 uptick in land temps – even when ocean temps do no such thing – that UAH do. And I believe we might have found the source of the step discrepancy between the two.

  3. Ron C. says:

    Is that tropical rise related to the weak El Nino development?

  4. Thanks, Dr. Spencer.
    I have updated your graph in my climate and meteorology pages.

  5. More of the same no increase in global temperatures in response to an increase in CO2.

  6. bassman says:

    I don’t want to get in a back and forth Salvatore, but there is clearly an upward trend in the above chart that is only going in one direction, up. Everything is going up this year, record breaking monthly surface temps, record breaking yearly ocean surface temps, nonstop rise in deep ocean content 0-2000m, continuous rise in sea level, and many other indications of a warming planet.

    And just in………. “West Antarctic Melt Rate Has Tripled” from a NASA study

    http://news.agu.org/press-release/west-antarctic-melt-rate-has-tripled/

    Please stop the delusions that this planet isn’t on its way to a much warmer and dangerous future.

      • bassman says:

        NASA must have missed that…..seriously Anything? Aaron S, the dangerous future is arriving now. But ignore the models, projections and current extreme weather events. Let’s just focus on current observations. Current measurements make it clear that our planet is gaining energy at a relentless pace. With an enormous lag in ocean response the planet has around another 1C in the pipeline. We have about a decade left to prevent 2C warming. Things are becoming far more serious as it becomes clear there is no immediate way to slow emissions rather they are still growing. Does anyone on here seriously doubt that 2020-2030 won’t be warmer than the current decade?

          • Fonzarelli says:

            Bassman, human emissions have no impact on carbon growth. Carbon growth tracks with temperature as the above graph shows… we couldn’t slow carbon growth if we tried.

          • John Finn says:

            Does anyone know why commenters insist on showing plots like this?

            Mr Fonzarelli

            You have plotted the derivative of CO2 versus the Hadley temperature
            series. Your graph shows exactly what we would expect to happen, i.e. CO2 increases more in ‘warm’ years than it does in ‘cool’ years. We know this – but that can’t explain the accumulation of CO2 in the atmosphere. Note that the derivative (rate of change) is never below ZERO. If CO2 increases were simply a function of temperature then we would expect a NEGATIVE (less than ZERO) derivative in any cool year which followed a warmer year.

            There are 2 possibilities: (1) You are trying to be deliberately misleading or (2) You don’t understand what a derivative means.

          • Fonzarelli says:

            John, i fail to see where you are are in disagreement here. As you’ve stated, “CO2 increases more in ‘warm’ years than it does in ‘cool’ years”. (That is ALL that i’m saying here) Carbon growth tracks with temperature regardless of the rate of human emissions for the entire length of the mauna loa data set…

        • bassman says:

          That was true for orbital forcing, not now. Your statement is very dishonest.

          • Planet’s been warming on and off but reasonably steadily, for 300+ years. Nothing out of the ordinary. The warming would only be interesting if there was an accelerating trend. Which we don’t see.

          • Fonzarelli says:

            DISHONEST !?!?! How so? You did look at the graph, didn’t you? You can see it’s Hadley and Mauna Loa, can’t you? Where is the dishonesty? AND what problem do you have with the FACT that temperature tracks with carbon growth? (It’s been that way for the entire length of the Mauna Loa record) Who’s in denial now? So i repeat, WE COULDN’T SLOW CARBON GROWTH IF WE TRIED…

    • Aaron S says:

      Bassman,
      You say “dangerous future”, but that claim seems based on IPCC models that are getting farther and farther from the reality of the data. It was substantially hotter last interglacial from natural climate change. Sea level was 6m higher. So we dont seem to be heading towards some unnatural climate phase except in the delusion of a climate model.

    • Bob Weber says:

      I’m not surprised at higher UAH temps this year, Bassman.

      We’ve seen solar F10.7cm flux at a relatively high daily average value for 2014 of 145 sfu/day, 22 sfu/day higher than last year (18% more), 25 sfu/day higher than 2012 (21% more), and 43 sfu/day higher than the daily average F10.7 flux for all of SC24 (42% more). Source: http://www.swpc.noaa.gov/ftpdir/indices/quar_DSD.txt

      For comparison, the last three years of the Modern Maximum in solar activity had daily solar fluxes of 180, 181, and 180 sfu/day for the years 2000-2002, the solar max years of SC23.

      The major arctic blast we saw in the US several weeks ago (in Nov) was literally melted away by higher solar flux. The first half of Nov we saw the daily flux average 139 sfu; the second half of Nov it averaged 172 sfu/day, and for the whole month the average was 155 sfu.

      For the past nineteen days flux has averaged 170 sfu/day.

      For the next 45 days, the USAF has forecasted F10.7cm flux to average 175 sfu/day, a big bump upwards from previous forecasts of theirs from just a few weeks ago when they had expected activity to diminish. Only one week ago they were calling for it to average 143 sfu/day for the next 45 days from then. Source: http://services.swpc.noaa.gov/text/45-day-ap-forecast.txt

      In other words, we are still experiencing solar max in SC24, which is very closely tracking SC1 right now, and if this cycle follows SC1 in activity, we could be in for nearly another year of high solar flux and more warming.

      The Weather Channel earlier today called for 10-15 degrees above average temps for many parts of the US for the next few weeks – I’m sure they also use F10.7 in their forecasting, even though they still preach GHGs drive the climate.

      Take a look at Roy’s UAH plot above and see the big dip in temps 2007-2009. It’s smack dab in the middle of the last solar minimum. For about nine years the F10.7cm flux averaged only 88 sfu/day after the peak of SC23 before activity started rising again after the onset of SC24.

      It takes time for the higher solar activity warming to accumulate here in the oceans, and it takes time for it to dissipate under lower solar activity conditions.

      The Sun always finds a way to teach us more lessons, if we’re paying attention. This information here is just the tip of the iceberg… The Sun drives the weather and climate, not C02!

      It is the warmists who are delusional.

      The dangerous future you speak of will only happen if the deluded ignorant are still in charge then as they are now!

      • H.B. Schmidt says:

        THANK YOU!!! Excellent discussion! Now all we need are more of the mindless masses to stop parroting hysteria propagated by sensationalist media despots, and look at the big picture instead. Then maybe the CAGW dialogue will die the death is so rightly deserves.

    • wayne says:

      “Everything is going up this year …”

      Maybe, definitely the adjustments to the temperatures are going up… always have since 1940 and track the CO2 increase so perfectly. Are you blind to facts?

      Or maybe you are speaking of the record cold readings. Way, way up!

    • chili palmer says:

      Bassman, you incorrectly cite “record breaking monthly surface temperatures.” I looked up the NOAA-NCDC data for individual months Jan.-Oct 2014, global land surface temps. None broke records. Oct. 2014 was 5th highest, Sept. was 6th highest, Aug. was 2nd, July was 10th, June was 7th, May was 4th, April was 3rd, March was 5th, Feb. was 44th, Jan. was 4th. “Global Analysis – October 2014,” NCDC.NOAA.gov. Input individual months at top of report, scroll down to Temperature subhead, narrative lists land surface, sea surface, and combined land and sea.

  7. Aaron S says:

    It was warmer last interglacial. Interesting article on a well know fact that gets little media coverage in this day of dominantly one-sided coverage. For me, paleoclimate studies like this challenge the perception of dangerous or catastrophic climate change. Moderate warming from a lower sensitivity in Earths temperature to CO2 increases makes an outcome that is not outside the realm of natural climate change. It is likely this interglacial will be nothing special compared to the last and humans and other animals will adapt just like they did in the past. If u want to reduce the human impact then have less kids and encourage population control via education and family planning, especially in developing nations.

    https://www.yahoo.com/news/colorado-mastodon-bones-show-warm-ancient-earth-190530926.html

  8. bassman says:

    Aaron, great advice at the bottom, no disagreement there. The current shift in temps is unprecedented and way beyond natural variation. The CO2 forcing and current growth rate is swamping all other natural forcings. No serious person at this point doubts the evidence of GHG warming at 400ppm. The fingerprints of GHG are evident in both hemispheres.

    • No statistically significant warming for a couple of decades = unprecedented.

      Too funny.

    • Lewis says:

      Bassman,

      Your statement “No serious person at this point doubts the evidence of GHG warming…” is rather trite. There are many serious people, some of who comment on this blog, who doubt.

      Additionally, the fear you try to instigate is another psychological method used to induce compliance from those who dare disagree.

      I’ll say this, I am afraid, but of the coming ice age, not warming. I see nothing to fear from warming. Certainly Miami, New York and New Orleans might go under, but that is peanuts compared to the effects of cooling the planet any substantial amount.

      Bassman, imagine this: some winter, within your lifetime, it snows so much the grain fields of the northern plains are unable to be farmed for grain the following year. (see link
      http://climate.rutgers.edu/snowcover/chart_seasonal.php?ui_set=nhland&ui_season=1

      Now compare the effect of this to the loss of a few cities and tell me which one you really prefer.

      And if you would tell me we can control the climate and it will never get that cool, then, I suggest, you may be completely dismissed out of hand.

      Merry Christmas.

    • Bassman,

      It would probably be advisable to consult the published records of temperatures. As I hope you are aware, there are huge numbers of available time series, both for areas, hemispheres, global, and countless series for individual sites. Some of these records are pretty reliable, I suppose, though one has to have doubts when the North American compilations are routinely adjusted, despite their inventors (note, not data analysts) being asked directly what their algorithms do. The classic and non-informative reply is that they are working as intended! There can be little doubt of veracity of that informed comment+ The adjustments always lower older records, say longer ago than 40 years (guessing here) and raise the values for more recent records. That is what is intended. The discrepancies are so blatant that it is very difficult to believe that the perpetrators have not looked at their effect. Of course, because the effect is one that they, in protection of their funding, wish to promote, they have no interest in doing that.

      As I say, go and collect some records, do your own analyses and publish the data and your conclusions here. I’ll have a look at them and tell you (honestly) what they disclose to me.

  9. ossqss says:

    Perhaps you could translate the fingerprints or read the palms involved in this too Bassman?

    http://www.glerl.noaa.gov/pr/pr_images/glacier.jpg

  10. bassman says:

    Solar variation is a factor, but a small one. See this great post in Realclimate.

    http://www.realclimate.org/index.php/archives/2013/10/the-evolution-of-radiative-forcing-bar-charts/

    • David Goldstein says:

      Bassman – I am somebody who actually agrees with the climate scientists. I’m just curious…why do you post here? Is it for fun? Do you ever actually find folks that are amenable to information here? I admire your tenacity!

      • michael hart says:

        “I am somebody who actually agrees with the climate scientists.”
        What, you mean people like Dr Spencer?
        FWIW, I agree with him too. The models are clearly running way too hot.

    • Aaron S says:

      Bassman, exactly my point. The error bar on that chart is absurd if it is intended to reflect the role of solar activity in climate and it is missing a potentially major secondary mechanism in magnetics and cosmic rays all together. The IPCC is assuming they know the suns role and they just dont. It only considers TSI but uv light varies by an order of magnitude more and the influence of the component on global climate is poorly understood. So that would about like saying look at the atm oxygen trend to understand CO2. Then there are cosmic rays that build up low clouds and impact albedo during low periods of solar activity or when the earth magnetic field changes. So now the sun is linked to a much much bigger knob in the model. There is more than enough published data to consider the possibility for a significant cosmic rays influence on climate via albedo from low clouds and high clouds as a GHG. The IPCC does not consider it in a single model bc it ruins their story for CO2. It is politics only.

      • Fonzarelli says:

        Aaron, i hate to say it, but you’ve been “preaching” this to bassman for quite some time, now, and it’s been going in one ear and out the other… Bassman seems to have a one track mind; it’s either ipcc or bust. Don’t know who I feel more sorry for, bassman who seems to be stuck on all things agw or yourself who may well be wasting all your raw talents on the likes of people like bassman. If it’s any consolation to you, i (and i’m sure many others here) highly value all that you have to offer, so hopefully in some small way your “back and forth” with him is not in vane…

        • Aaron S says:

          He likes the battle and i actually get a lot out of it bc it forces me to articulate my thoughts. Im about to start publishing again at work (not climate related except for some orbital periodicity in carbonate growth patterns from the miocene: carbonates really respond to sea level bc reefs are tied to the photic zone) and that will take me away but in the mean time this is a good venue. You know we all should be very thankful for the community here bc i have learned a lot from many people including u. It is sort of like a educational center of sorts. If Bassman didnt stay at it we would not have the venue to express ourselves and learn… so in a sense he is very useful.

  11. Bob Weber says:

    So Bassman you take your cues from that dolt from NASA Gavin Schmidt? I guess you’re not really a serious person after all. For you to cite the IPCC for solar attribution is a joke, and the joke is on you!

    The Sun is firmly in the driver’s seat.

    • Aaron S says:

      Bob I couldnt agree more. Until the IPCC has scenarios include a stronger sun from cosmic rays or even the uv spectum they are not representing the suns potential. The evidence for a stronger influence on climate from the sun is overwhelming and it brings into question the validity of agw theory. Anyone answer me this. Why are there no models that consider a stronger solar component in the range of IPCC scenarios? TSI is not representative of the impact (potential impact) of solar activity. Read the literature. The answer is because shifting a little of the warming last century away from CO2 and to the abnormally active sun (from 1950 to 2000) removes much of the projected future warming because the sun has returned to lower levels. Bassman i will provide literature if u will read it?

    • bassman says:

      Bob, Gavin is just as harsh with critism to any “warmests” that make claims without solid evidence as many have observed. He sticks with strong peer reviewed evidence. The IPCC is a pretty conservative scientific group.

      All that aside ossqss and others, look at the chart under the heading “Overall View” in the link below. It clearly shows just how abrupt and significant current warming is. Too many people on here confuse slow natural changes in response to changes in and out of ice ages or local climate changes responding to other natural events.. These are in stark contrast with the sudden anthropogenic forcing that has occurred in the last 60 years. Look at the overall 5 million year trend and tell me that isn’t an “abrupt and sudden” departure from natural variations.

      http://en.wikipedia.org/wiki/Geologic_temperature_record

      Also, just to spell out how tiny natural solar variation is in terms of forcing. Its total range of variation according to the IPCC is just .1 W m2 compared to a total AGW forcing of 2.29 W m2 as of only 2011. Its really a bogus argument to be talking about the sun right now as the driver of current record temperatures.

      • Bob Weber says:

        Don’t you see Bassman that the IPCC has completely failed to accurately predict future temperatures based on their “science” that you so easily have fallen for?

        2010: Strong El Nino year. Use your search engine.

        What is amazing is how you resort to appeals to authority who have proven to be incapable of making accurate predictions, and yet you want buy their attributions hook line and sinker.

        Global warming happened because of the Modern Maximum in solar activity, a 68 year stretch that ended after the max of SC23, where for all that time solar activity as measured by sunspot number was over 30% higher than the previous 68 years.

        You really need to put that glass of kool-aid down now.

        • bassman says:

          Once you include deep ocean heat content gain, the forcing values of the IPCC are dead on. Surface warming is too easily influenced by changes in ocean currents. They are going up again however.

          • The deep ocean heat content gain is largely modeled, not measured. So it can be whatever you want it to be, to be consistent with whatever you want it to be consistent with. Strange, like God of the Gaps, the warming is disappearing into these harder and harder to find rabbit holes.

          • Bob Weber says:

            As a result of higher recent solar activity…

          • Fonzarelli says:

            Bassman, what follows is a snippet from “brother bart of the immaculate convention”: Bart October 6, 2014 (wuwt) “the immaculate convection always was a monumentally transparent flail… …the process by which heat got to the lower oceans without penetrating the upper layers first”

      • Mollie Norris says:

        Bassman, how do you rationalize the IPCC theory of positive feedback between CO2 and H2O vapor when CO2 concentration has been 6,000 in the past? What T, H2O vapor and CO2 concentrations represent the IPCC’s ‘tipping points’?

        Yury Izrael, past UN IPCC Vice President, director of Global Climate and Ecology Institute, member of the Russian Academy of Sciences 2009

        “There is no proven link between human activity and global warming.

        Global temperatures increased throughout the 1940s, declined in the 1970s and subsequently began to rise again….

        Present day global warming resembles the 1940s, when ships could easily navigate Arctic passages. However, man’s impact was much smaller at that time. A Russian expedition that recently returned from the central Antarctic says that temperatures are now starting to decrease….

        In ancient times the Earth had periods when maximum CO2 concentrations were 6,000 PPM (Carboniferous period). But life still goes on.”

  12. ossqss says:

    So what was it that melted near 2 mile thick ice if solar played such a small role bassman?

    • bassman says:

      Solar evidence just doesn’t explain the way the planet is warming (warmer nights, polar amplification, stratospheric cooling). The specific way the planet is warming plus (as one would predict from GHG and the fact that overall we are getting much less solar energy anyways (aerosols/global dimming) and yet the planet is still rapidly gaining energy. Solar hypotheses on here just aren’t convincing at all. The scientific community seems to agree with me. It just sounds like an excuse to face up to scientific reality. It’s not the sun. Look at 2010’s record temps during a solar minimum for further proof.

      • bassman says:

        Typo, “An excuse not to face up to reality”. Can everyone on here agree that it isn’t solar variation when the solar cycle ramps down again and global surface temps continue to rise beyond 2020? I mean really does anyone think that as solar radiation declines again we won’t continue to see record breaking temps, ocean heat content gain, melting land ice, further declines in arctic sea ice, sea level rise. There is no way with a GHG forcing this large that things won’t continue to warm. I’m confused by the wild ideas that get thrown around here in the face of so much solid peer reviewed evidence pouring in from journals every week agreeing with AGW theory.

        • Bob Weber says:

          And can you agree that when we head into the next minimum and temps inevitably drop as a result that it was and always will be SOLAR!?

          • bassman says:

            Bob, good luck placing those bets. Its not impossible that solar energy could suddenly decline beyond anything in the last 100 million years, but that in know way invalidates anything related to GHG forcing. Life is about probabilities and if we are adding 2-4 ppm CO2 every year well into the future we will be in a whole new era of climate. Many scientists argue we have already entered that era.

          • Nothing impossible. Simple natural variability of cloud cover would explain all warming and cooling that’s been attributed to CO2, aerosols and other things. Doesn’t mean that’s the cause, but it’s laughable when people assert there can only be one explanation: CO2

          • Bob Weber says:

            Solar activity can only drop to a baseline level of zero sunspots and F10.7 flux of about 65 sfu. When that happened in 1810, after many years of decline, temps dropped considerably in the same year, bottomed out, and gradually climbed back up again to previous levels after over a decade and a half. That time is called the Dalton minimum.

            Another instance was during the Maunder minimum, when solar activity dropped to baseline levels for many decades and temps dropped enough for people to refer to those times then as “the Little Ice Age”.

            Perhaps you should study climate and solar history more so you don’t come off as so uminformed.

          • Tim Folkerts says:

            Bob Weber says: ” … that it was and always will be SOLAR!?”

            Why do people so often insist that one and only one cause drives climate change? It is pretty clear (IMHO) that solar AND greenhouse gases AND the earth’s orbit AND ocean currents AND several other things all impact climate and can cause climate to change.

            Neither CO2 nor solar is the whole story.

          • Bob Weber says:

            Tim and Will:

            The other factors are of course operative but not as significant as solar variability.

            Stick around. As I said earlier, “…this is just the tip of iceberg”

      • ossqss says:

        So is it you opinion that the accuracy of temp measurement has enough resolution and longevity, globally, to make such a connection? What of the logarithmic nature of lab tested static, non-chaotic, CO2 concentration responses and temp?

        I appreciate your response, but am finding a closed mind of perceived settled science. Do you really think that way, or do you have to?

        I mean no disrespect, but it is obvious there is more in play than your comments.

      • ossqss says:

        That was not the question. Perhaps you could read it again?

        • bassman says:

          I’m a bioligist and teahcer, not a climatologist. I know what overwhelming evidence looks like however. I also know the tactics Intelligent designers used in the 90’s and 2000’s. This is for different reasons but the same.

          • Bob Weber says:

            Define overwhelming evidence. What evidence and what makes it overwhelming?

          • bassman says:

            Bob, for starters, Nasa has plenty. See below.

            http://climate.nasa.gov/evidence/

          • Think of eugenics and evolutionary theory, rather than intelligent design, if you’re looking for analogies. The fact that the eugenicists were so fashionable in the early 20th century doesn’t invalidate Darwinian theories. The nonsense Bassman peddles doesn’t invalidate climate science. But it’s still nonsense.

          • Bob Weber says:

            The list NASA provided:

            Sea level rise
            Global T rise
            Warming oceans
            Shrinking ice sheets
            Declining Arctic sea ice
            Glacial retreat
            Extreme events
            Ocean acidification
            Decreased snow cover

            All caused by the Modern Maximum in solar activity, and these indices are exaggerated.

            For instance extreme weather events are in decline and have been for some time now.

            Don’t you pay attention to reality or do you have your viewpoints issued to you by your teachers union or Al Gore?

          • Aaron S says:

            Bassman exactly. U are a biology teacher i have a phd in geology from a good school in paleoclimatology. The difference is u have not collected your own data and published it to understand how political the system is. I truly believe you are a very smart guy (more than capable of doing a phd) its just you are weighting a very biased perspective to heavy. I learned how political the field is when i switched from pro AGW to natural forcing. You have to remember entire departments are built by the funding from one side so the numbers are skewed bc the funding.

          • The definition of ‘smart’ is the ability to think critically. If you can’t do that, you may have many other virtues, but you’re not a smart guy.

          • Mollie Norris says:

            At around 32:00 in this video from the 4th World Wilderness Conference in 1987, Edmund de Rothschild refers to the catastrophic effects predicted by “Dr. Irving Mintzer’s global warming theory”. Did you know that Dr. Irving Mintzer is an economist with a PhD in energy and resources, with no interest or education in any field of science, and with affiliations to several UN agencies, who currently
            is a Senior Advisor to Potomac Asset Management and Chief Strategist for the Potomac Energy Fund?
            Do you think an international banker, oil billionaire and Illuminist (Luciferian/Satanist) and depopulation supporter like Rothschild, who has financed both sides of wars in the past in addition to selling weapons, and benefited from debt service on these activities, in addition to supporting a New Marshall Plan that includes recolonization of the US and Australia (video content), could support AGW theory for reasons unconnected to the welfare of the planet? With no basis in science?
            https://ia700408.us.archive.org/4/items/Unced1992GeorgeHunt/GeorgeHuntOnUnced.mp4

  13. Bob Weber says:

    The only thing that’s wild here is your rampant belief in failed scientists. It doesn’t matter how many of them there are either. Reality is not governed by “consensus”.

    You want me to take anything you say seriously? Define your statement “GHG forcing this large”.

    I can see why you’re confused.

  14. John F. Hultquist says:

    At 5:53 PM, bassman says “We have about a decade left to prevent 2C warming.

    bassman,
    Can you explain this “2C” temperature thing? You really mean 2 C° change, I believe, in global average temperature. What is the base temperature – and why? Where did the “2” come from – and why? Why is it not 1.9, or 2.3? Where is the study that came up with exactly 2 from the base (whatever that is).
    This all seems so – – – arbitrary.

    Then, at 7:03, you mention someone being harsh with critism to a person that makes claims without solid evidence. I guess I’d like to see some solid evidence regarding this 2C thing.
    Thanks.

    • bassman says:

      John, The 2C is the cumulative warming with an additional 1.2C warming on top of the .8C we already have from pre-industrial times. It is the common language in most emission scenarios discussed by governments. I assumed people on here knew what I was talking about, sorry. With the extreme weather already occurring at current temperatures, an additional 1-1.5C worth of warming involves a lot of risk when you consider that its in addition to all the other effects of ecosystem destruction etc. I worry about the stability of governments under increasing droughts and agricultural losses.

      Its upsetting that certain bloggers on here continue to tout the idea that continued warming is some how magically going to stop based on solar or CO2 isn’t a greenhouse gas or its only natural variation arguments. Such discussion ended along time ago in respected scientific circles. People on here need to know that. There are plenty of things to be skeptical about dismissing decades of research with know convincing evidence just doesn’t work. No one in the scientific world takes these arguments seriously.

      • John F. Hultquist says:

        Thanks, but . . .
        “The common language” I am familiar with … it is the evidence that seems to be missing.

  15. bassman says:

    Checking out for the night. I encourage everyone to keep following new research in climate science and to pay attention specifically to sea level rise and deep ocean heat content. These two measurements are the least susceptible to decadal variation. Goodnight everyone!

  16. Mark Bofill says:

    Well, bassman isn’t any worse than Doug Cotton I suppose.

    Bassman, are you trying to persuade us or are you trying to persuade yourself that you’ve persuaded us, or what? Do you suppose that you’re going to post a few comments here and we’re all going to say, Wow! That bassman, his sentence structure, his timing, his idiom; he’s said the same things literally thousands of others have said but his magical rhetorical powers have lifted the scales from our eyes!

    I mean, honestly.

    I hate to mock you, but what on earth else do you expect?

    Give it a rest, go think it over.

    • Rambling on about random weather events, aka, ‘extreme weather’, etc., is frankly embarrassing. But cranks start with beliefs then work backwards picking through the evidence, collecting and discarding, until their sand castle is complete. Remember, even a fundamentalist is capable of rational thought. He will spot immediately all the so called inconsistencies in the Koran. Likewise, a follower of the Koran will immediately spot all the so called inconsistencies in the Bible. But neither can see any flaws in their own beliefs. Personally I’d like to lock all the nutty Bassman’s of this world in the same room as all the greenhouse effect deniers, and let them knock each other senseless. This would spare the rest of us from having to constantly scroll over their expert sounding gibberish.

  17. bassman says:

    Mark, you are probably right. I just hate to see so much garbage go unanswered. Don’t compare be to Doug C. He could be a bot and it wouldn’t surprise me at all. At least I make a good faith effort to respond to people.

  18. bassman says:

    Will, I am just communicating the mainstream findings of modern science.

    • I suppose I find your type of crankism more offensive than the greenhouse gas deniers. The greenhouse gas deniers at least acknowledge they are in a minority. That only *they* see the truth, that everyone else–all of the scientific community–is too dumb to ‘get it’. Yes, it’s pathetic, but it’s harmless.

      On the other hand, your typical Bassman style crank *speaks for science itself.* It’s not the lone wolf delusion. It’s far more grandiose. Bassman *is* science. Hence all your beliefs are mainstream. Everyone or anyone who dare disagree is too dumb to ‘get it’. If you cite a paper (from the hundreds of thousands to pick and choose from), this paper *becomes* THE TRUTH. Because… Bassman endorses it. Yes, it’s also pathetic. But hopefully it doesn’t do too much harm in the long run.

      • Nigel Harris says:

        It’s not just Bassman that endorses it. It’s organizations like NASA and the Royal Society – in fact just about every prestigious scientific body in the world.

        Bassman is no crank. Your view of the world has become so distorted by the time you have spent reading climate blogs that you no longer recognise normality when you meet it.

        • So you’re saying that whatever obscure scientific paper, typically based on models and proxies, that goes against hundreds of published papers in the scientific literature, is endorsed by NASA and the Royal Society, and probably the National Academy for The Protection of Kittens, and such like… because you say so. OK……

          Sorry but the scientific community doesn’t endorse your beliefs because you suffer the delusion that they do…

          Look, people like you and Bassman are science cranks. The only positive side to all this is that at least, besides causing the public to waste money, your lot won’t do too much harm. I only truly despise the anti-vaccination cranks. Those guys help to cause children to get killed. At least your nonsense doesn’t lead directly to anything as bad as that.

      • MarkB says:

        “The greenhouse gas deniers at least acknowledge they are in a minority.”

        Bassman is pretty much parroting the climate science mainstream. That doesn’t necessarily make him right, but if you think he represents a minority view, you might be living in an echo chamber.

        • MarkB says:

          MarkB, Yes that is exactly what I am doing, parroting mainstream scientific consensus that continues to be reaffirmed by new studies and present day measurements.

          • bassman says:

            sorry MarkB, the comment above was made by me not MarkB. I need to slow down with the keyboard.

        • He is not “parroting the climate science mainstream.” He is parodying it. For example, if the mainstream scientific consensus is that there is little to no evidence supporting “extreme weather” – he asserts the opposite. If there us a consensus that the world has warmed, he slips in the wording that the world is warming “dangerously”, hoping, I expect, that nobody will notice. If there are hundreds of papers discussing the medieval warm period, he’ll find the 3 papers asserting there wasn’t one. Whatever junk he comes up with, he claims it’s the “consensus”. That’s what cranks do.

  19. Mark Bofill says:

    Bassman,

    With the extreme weather already occurring at current temperatures, an additional 1-1.5C worth of warming involves a lot of risk when you consider that its in addition to all the other effects of ecosystem destruction etc. I worry about the stability of governments under increasing droughts and agricultural losses.

    While the gloom and doom predictions continue, AR5 does not find evidence that extreme weather events have been increasing. This is Roger Pielke’s summary, but we could pull it out of the AR just as well:

    Here are a few:
    “Overall, the most robust global changes in climate extremes are seen in measures of daily temperature, including to some extent, heat waves. Precipitation extremes also appear to be increasing, but there is large spatial variability”
    “There is limited evidence of changes in extremes associated with other climate variables since the mid-20th century”
    “Current datasets indicate no significant observed trends in global tropical cyclone frequency over the past century … No robust trends in annual numbers of tropical storms, hurricanes and major hurricanes counts have been identified over the past 100 years in the North Atlantic basin”
    “In summary, there continues to be a lack of evidence and thus low confidence regarding the sign of trend in the magnitude and/or frequency of floods on a global scale”
    “In summary, there is low confidence in observed trends in small-scale severe weather phenomena such as hail and thunderstorms because of historical data inhomogeneities and inadequacies in monitoring systems”
    “In summary, the current assessment concludes that there is not enough evidence at present to suggest more than low confidence in a global-scale observed trend in drought or dryness (lack of rainfall) since the middle of the 20th century due to lack of direct observations, geographical inconsistencies in the trends, and dependencies of inferred trends on the index choice. Based on updated studies, AR4 conclusions regarding global increasing trends in drought since the 1970s were probably overstated. However, it is likely that the frequency and intensity of drought has increased in the Mediterranean and West Africa and decreased in central North America and north-west Australia since 1950”
    “In summary, confidence in large scale changes in the intensity of extreme extratropical cyclones since 1900 is low”
    There is really not much more to be said here — the data says what it says, and what it says is so unavoidably obvious that the IPCC has recognized it in its consensus.

    We have not seen agricultural losses due to climate change so far either, those remain in the realm of speculative predictions.

    And the scary climate model predictions remain off course and diverging from observations.

    I for one have yet to hear a plausible explanation of how the missing heat is supposed to come back out of the depths of the ocean to get us. Generally speaking, atmospheric temps follow SST’s, and if the energy is going into the depths, then that’s a good place for it. We’re never going to see that energy as higher atmospheric temperatures again.

    Few among us doubt that CO2 will cause some warming. It is far from settled that CO2 will cause catastrophic warming, or even warming severe enough to rank as a concern when measured against the other problems we might spend our time and attention on. You can act like we’re mad not to be on the alarmist bandwagon if you please. From time to time maybe I’ll make it a point to come back and burst your bubble. But wouldn’t it be simpler and more graceful; demonstrative of more respect for yourself and others, to just for the love of sanity give it a rest!

    • I’m confused Mark. If Bassman is merely “communicating the mainstream findings of modern science” why is claiming the exact opposite of the mainstream findings of modern science?

      Unless of course he is a… bullshit artist… 😉

      • Mark Bofill says:

        :/
        I try to be civil Will, seriously. I don’t want to have to get personal. But I don’t comprehend the arrogance that permits guys like Bassman to walk in here as if he’s the only guy who knows how to read, spouting the party line as if it’s Holy writ. It’s offensive and annoying. There are plenty of blogs where I’ve got to put up with that crap, leave or be censored, but not here, apparently, and I’m duly grateful for that.
        I gotta run.

        • Fonzarelli says:

          Mark, firstly, well said… The crap that many bring to the debate is part of the big picture that we’re dealing with here. If “alinski” type elements exist within the debate, then I’d actually prefer to see it. If it’s part of the challenge in overcoming agw, then we might as well deal with it. Once this is realized, it just simply becomes part of the challenge…

          • Fonzarelli says:

            Mark, one more thing (or two)… Firstly, bassman is a fairly civil fellow. Compare with my exchange up top with john finn. (i never feel like i’m dealing with a lunatic in bassman) Lastly, while bassman certainly is not perfect, he does have all his ‘ducks in a row’. (though i’m not always sure that they’re all quacking) I do think he presents some challenges to skeptics that go beyond the party line. So what ever he’s worth, we could do a whole lot worse than bassman…

  20. Dan Murray says:

    Bass believes all here are mere bloggers. He belongs to the realm of real scientists. The painful truth is his earnest pursuit of a distorted view. Has he read Don Quixote?

  21. dave says:

    The Royal Observatory of Belgium opines that the protracted and rather weak Solar Cycle 24 has finally entered its declining phase. The next ten years should provide tests of several interesting theories.

    • John Finn says:

      Why didn’t the declining phase of Solar Cycle 23, when there was a long protracted minimum with low activity, provide a test of “several interesting theories”? Also why is it that recent ARGO data shows a consistently strong accumulation of Ocean Heat. If the oceans are warming it’s highly unlikely that the atmosphere will cool in any significant way.

  22. Baseman you real have no clue when it come to climate and why it may or may not change.

    Bob, excellent commentary and it will all come to pass.

    The climate acting as expected thus far in response to solar cycle 24 maximum.

  23. Baseman if you read this carefully you would understand why may of us are so sure we are on the correct path.

    As far as climate variability over the past 100 years this has been one of the more stable periods over that length of time.

    If you want to see a unstable climate review climate changes between 20000 -10000 years ago.

    November 3, 2014 at 4:23 PM

    Many of us are of the opinion that the chances of cooling going forward are near 100%.

    CO2 is a non player in the global climate picture as past historical data has shown.

    CO2 and the GHG effects are a result of the climate not the cause in my opinion.

    I maintain these 5 factors cause the climate to change and they are:

    Initial State Of The Climate – How close climate is to threshold inter-glacial/glacial conditions

    Milankovitch Cycles – Consisting of tilt , precession , and eccentricity of orbit. Low tilt, aphelion occurring in N.H. summer favorable for cooling.

    Earth Magnetic Field Strength – which will moderate or enhance solar variability effects through the modulation of cosmic rays.

    Solar Variability – which will effect the climate through primary changes and secondary effects. My logic here is if something that drives something (the sun drives the climate) changes it has to effect the item it drives.

    Some secondary/primary solar effects are ozone distribution and concentration changes which effects the atmospheric circulation and perhaps translates to more cloud/snow cover- higher albebo.

    Galactic Cosmic Ray concentration changes translates to cloud cover variance thus albedo changes.

    Volcanic Activity – which would put more SO2 in the stratosphere causing a warming of the stratosphere but cooling of the earth surface due to increase scattering and reflection of incoming sunlight.

    Solar Irradiance Changes-Visible /Long wave UV light changes which will effect ocean warming/cooling.
    Ocean/Land Arrangements which over time are always different. Today favorable for cooling in my opinion.

    How long (duration) and degree of magnitude change of these items combined with the GIVEN state of the climate and how they all phase (come together) will result in what kind of climate outcome, comes about from the given changes in these items. Never quite the same and non linear with possible thresholds.. Hence the best that can be forecasted for climatic change is only in a broad general sense.

    In that regard in broad terms my climatic forecast going forward is for global temperatures to trend down in a jig-saw pattern while the atmospheric circulation remains meridional.

    THE CRITERIA

    Solar Flux avg. sub 90

    Solar Wind avg. sub 350 km/sec

    AP index avg. sub 5.0

    Cosmic ray counts north of 6500 counts per minute

    Total Solar Irradiance off .15% or more

    EUV light average 0-105 nm sub 100 units (or off 100% or more) and longer UV light emissions around 300 nm off by several percent.

    IMF around 4.0 nt or lower.

    The above solar parameter averages following several years of sub solar activity in general which commenced in year 2005..

    IF , these average solar parameters are the rule going forward for the remainder of this decade expect global average temperatures to fall by -.5C, with the largest global temperature declines occurring over the high latitudes of N.H. land areas.

    The decline in temperatures should begin to take place within six months after the ending of the maximum of solar cycle 24.

  24. EringoBraugh says:

    Dr. Spencer,

    I want to say that I admire your courage to express your ideas and beliefs against the conventional wisdom of the “97% of scientists” who support the so called settled science. I am currently a student who is required to take a weather and climate course to satisfy my degree curriculum. I read your blog, but I must admit I am a novice when it comes to the climate. My question is, how do you argue with a professor who is hell bent on indoctrinating his student to his beliefs, which by the way is man-made GW? I do believe the climate is changing, however, but not for the reasons expressed by mainstream alarmists. Does anyone have any suggestions on how to combat, and I use that word literally because its like war with these people, arguments for cyclical weather patterns, which is what I believe? Or do I just smile and pretend to agree with everything my professor says just to get the “A” I want? I would love to hear your thoughts.

    • MarkB says:

      For starters, never “admit I am a novice when it comes to the climate” near statements like “I do believe the climate is changing, however, but not for the reasons expressed by mainstream alarmists”, because it reveals that your view is based on ideology, not personal understanding of the science.

      If you must play contrarian, it’s better to draw on material from plausible experts who share your viewpoint. With a lay audience you could probably get away with just about any mumbo jumbo, but with your professor, if you must differ, stick to a prepared script, strongly preferring material that has made it into the published literature. Even this approach may put your grade at risk.

      Alternately, you could play along, try to learn the mainstream science, perhaps get an A along the way, and then you’ll be far better equipped to express a science-based opinion of it.

      • Mark Bofill says:

        Hey no kidding. Do yourself a favor, read without passion or prejudice the arguments on both sides. Who knows, maybe you’ll conclude the mainstream is absolutely correct and that the skeptics are mistaken.
        You can get the mainstream position most anywhere. I recommend Skeptical science, real climate, and then there’s physics, and Tamino’s open mind. There are loads of others, those are just the ones I keep track of. The skeptical position on blogs like this one, WUWT, climate etc, the blackboard, places like that.

      • EringoBraugh says:

        Mark,

        You could be right, my view may very well be interpreted as ideology, but even all the counter science in the world to the contrary to the climate change argument, and what actually contributes to it, still defines my ideology. The instant I offer a differing opinion, whether rooted in published literature or not, my ideology is defined for me by the opposing party, at least that is what I have encountered in the past.

        Alas, I will heed the advice of everyone and keep my mouth shut. I will just use it to smile at my professor with, making him think he has converted yet another climate change ignoramus, all the while collecting my A.

  25. Mark Bofill says:

    Enrigo,

    I see that you were primarily speaking to Dr. Spencer, but your query here:

    Does anyone have any suggestions on how to combat, and I use that word literally because its like war with these people, arguments for cyclical weather patterns, which is what I believe?

    seems to invite a general response.

    My short answer / advice is do not. If your purpose is to complete a degree program, it does not serve your purpose to paint a target on yourself for your professors to shoot at. If you view it as a war, the analogy is simple. Do not expose yourself to fire in a situation where your adversary has all the power and you have none. Maintain anonymity and fight from a position of strength. Hint, you will never be in a position of strength sitting in a hostile professors classroom.

    Just my two cents. 🙂 Good luck.

    • EringoBraugh says:

      Hi Mark,

      You are correct, my initial question was directed to Dr. Spencer, however, after reading many of the responses, I felt comfortable re-directing the overall question to you guys. You all seem to know know your climate science. Thank you for your responses. The consensus seems to be not to engage the professor, so I will not. Good advice from all who responded, and thank you for the suggested reading material and websites as well.

  26. Travis Casey says:

    My comment was rejected by moderation. Perhaps because I posted several links?

    I would start with a search for “1350 peer-reviewed papers supporting skeptics”, “Jonova Skeptics handbook”, several presentations by Richard Lindzen on Youtube. And lastly, the hockeyschtick blog. His quote is great, “If you can’t explain the pause, you can’t explain the cause.”

  27. Eringo – You argue it based on post from people like myself and Bob Weber as well as what Dr. Spencer has to say.

    If you look at past climatic data going back 20000 years you will see the last 100 years of the climate was very stable.

    Man made global warming is a ridiculous theory and will be proven wrong before this decade ends.

  28. Mack says:

    Just pretend and get an A Eringo.

  29. Lewis says:

    EringoBraugh,

    If you’re taking a course with the intent of graduating and need a decent grade, it is best to regurgitate what the professor intends. If you don’t need the grade and wish to argue, there are various recommendations of base material made above. However, your description leads one to believe the professor is not open to disagreement and, I can tell you from personal experience, will act as if he is an authority and dismiss you prior to any discussion starting. Thus your attempt will be doomed from the start.

    None the less, there is a certain amount of pleasure to be gleaned from these type arguments and if your personality is of that bent, I suggest go for it.

    Once upon a time, I took issue with a statement in the text my professor was using. He and a cohort had written the text. The end result was they changed the verbiage in the text because of my argument. But it wasn’t easy, but it was fun.
    Merry Christmas

    • EringoBraugh says:

      Lewis,

      Speaking of regurgitating, my professor consistently uses the whole “97% of scientists agree” mantra to support his beliefs. When another student brought up that a lot of these scientists get grants to study climate change, ultimately suggesting that it was about money to get the results they wanted, he then tried to claim that scientists are objective, and that they couldn’t be bought off. I must have been hormonal that day or something because I spoke up and said, “scientists are not robots, so it’s not fair to say that they cannot be bought off, they are human just like everyone else.” It’s sad really that they have so convinced themselves that this is settled science, and no longer continue to examine other possible explanations why the planet is warming, or cooling for that matter!

  30. ren says:

    What happens now in the weather? Solar activity increased again, as evidenced by the cosmic rays.
    http://cosmicrays.oulu.fi/webform/monitor.gif
    I think that this will accelerate the polar vortex. Wir little to shrink. However, to remain locked over Eastern Siberia. The jet stream moves north. Pattern of the northern hemisphere weather does not change.
    http://www.cpc.ncep.noaa.gov/products/stratosphere/strat_a_f/gif_files/gfs_z100_nh_f120.gif

  31. Over at the Climate Lab Book blog, a climate scientist is using Roy’s UAH data to try to claim that there is no pause in global warming!

    • Fonzarelli says:

      Paul, no harm in that… If they accept that UAH shows that there is no pause then they will have to accept that there WAS a pause during the first two decades of the UAH record.

    • Werner Brozek says:

      UAH 5.5 negative to June 2008
      UAH 5.6 negative to December 2008
      RSS negative to October 1996 (almost hit September 1996)


      Walter Dnes

  32. Bil Danielson says:

    Interesting post today by Willis Eschenbach over at WUWT that has some relevance here regarding ocean heat content. Eschenbach concludes: ” … they claim they can measure the monthly average temperature of 0.65 BILLION cubic kilometres of ocean water to a precision of one hundredth of a degree Celsius … which seems very doubtful to me. I suspect that the true error bars on their data would go from floor to ceiling.” http://wattsupwiththat.com/2014/12/04/argo-and-ocean-heat-content/

  33. Mark BLR says:

    Question to be passed on to UAH :

    Why is the file for the lower stratosphere

    http://vortex.nsstc.uah.edu/data/msu/t4/tlsglhmam_5.6.txt

    (to THREE significant figures) STILL missing the last 12 months worth of data (Dec-2013 to Nov-2014) ?

  34. dave says:

    “…why..?”

    The file above, with the link given by Dr Spencer, IS complete.

    The RSS figure for November, for the lower troposphere, has been released.

    It is down 0.028 C from October, whereas UAH is down by 0.036 C.

    • Mark BLR says:

      To dave :

      Yes, the lower TROPOsphere (T2LT) data file is indeed “up to date”, my point is that the equivalent lower STRATOsphere (T4) data file ISN’T.

      This is especially confusing / frustrating given that the “zonal” T4-V5.6 file (./t4/uahncdc_ls_5.6.txt) IS “up to date” !
      NB : The “zonal” file has more columns of data, but the data are all rounded to TWO decimal places instead of 3).

      I first noticed this “oddity” a couple of months ago, and have still not found (/ been given) a reason for its appearance / continued existance.

  35. Jack says:

    This blog has slowly degenerated over time, similar to the arguments against AGW. The hostility level is also rising somewhat like Spencer’s temp-anomaly graph.

    The denier’s comment about “building sand castles” unwittingly describes what is apparent going on with many on here, trying to buck the inescapable conclusion that they long ago chose the wrong path regarding AGW. They are determined to nobly fight to the end, to avoid admission of their mistaken path – time to move on to something more promising, because it’s an embarrassment for UAH.

  36. Doug. .Cotton  says:

    No Jack. The arguments against AGW are getting stronger as we recognise that all climate cycles are regulated by the planets from the orbits of which this plot is derived. Keep watching for continued slight cooling until 2028, then warming for 30 years, then 500 years of cooling.

  37. Doug. .Cotton  says:


    Any who are genuinely interested in understand atmospheric physics and why it’s not carbon dioxide after all should read these comments.


  38. ren says:

    Doug. .Cotton or you can enter a formula to calculate the temperature at a particular level in the troposphere? It will be convincing.
    http://www.cpc.ncep.noaa.gov/products/stratosphere/strat-trop/gif_files/time_pres_TEMP_MEAN_ALL_EQ_2014.gif

  39. yvesdemars says:

    Dear Dr Spencer

    TH FRench Meteo France say that 2014 will be probably the hottest year since 1900. Is it possible to challenge that with the UAH datas ??

    Thank you and contragulations for your blog

Leave a Reply