
 Home/Blog
Arctic air is making a return after a rather balmy December, and the Midwest will have a frigid wintry Wednesday this week after 2-4 inches of new snow falls.
By Wednesday morning, most of the U.S. will be below freezing, and the coldest air will be plunging southeastward across the upper midwest into northern Illinois and Indiana:
NWS statistical forecast temperatures for Wednesday morning, Jan. 7, 2014.
Midday Wednesday looks like much of the Midwest won’t even get above zero deg. F, even in Chicago (graphic courtesy of Weatherbell.com)…
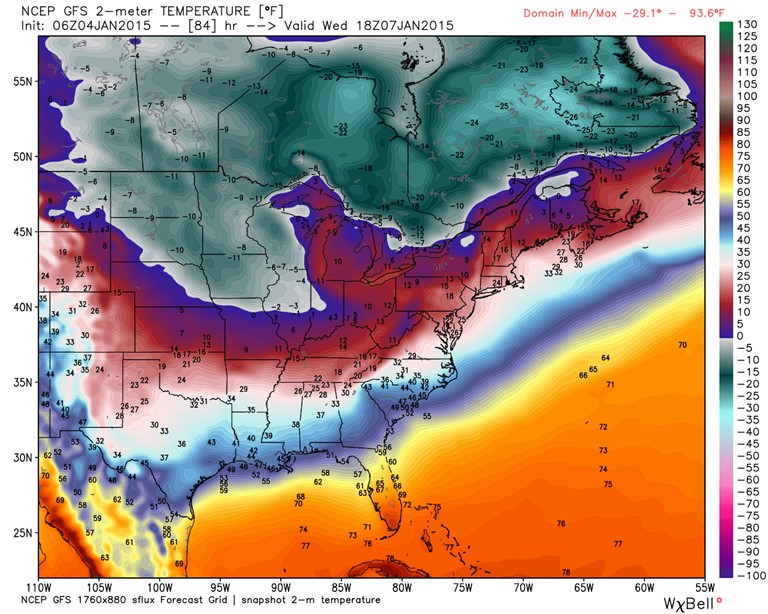
Temperature forecast for midday Wednesday (Jan. 7, 2014) from the GFS model.
…and stiff 20 mph winds will cause midday windchill temperatures of -20 F or lower. Across Iowa and Illinois, temperatures by Wednesday evening will be 30 to 40 deg. below normal for this time of year.


