Great Lakes Rapidly Freezing Over

February 19th, 2015 by Roy W. Spencer, Ph. D.

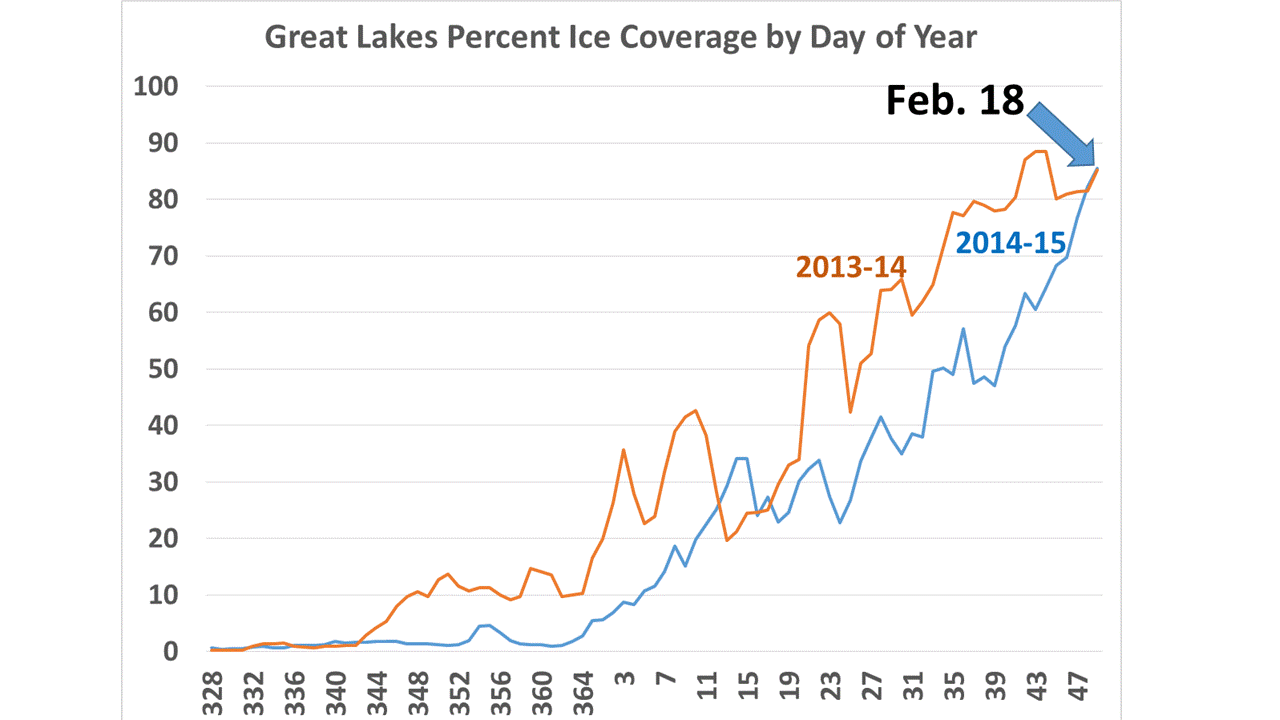
The recent frigid weather has led to a rapid freezing cycle on the Great Lakes, with ice cover increasing by another 20% in the last 10 days, which makes it now equal to last year’s epic coverage by this date (Great Lakes ice data available at GLERL):

great-lakes-ice-cover-graph

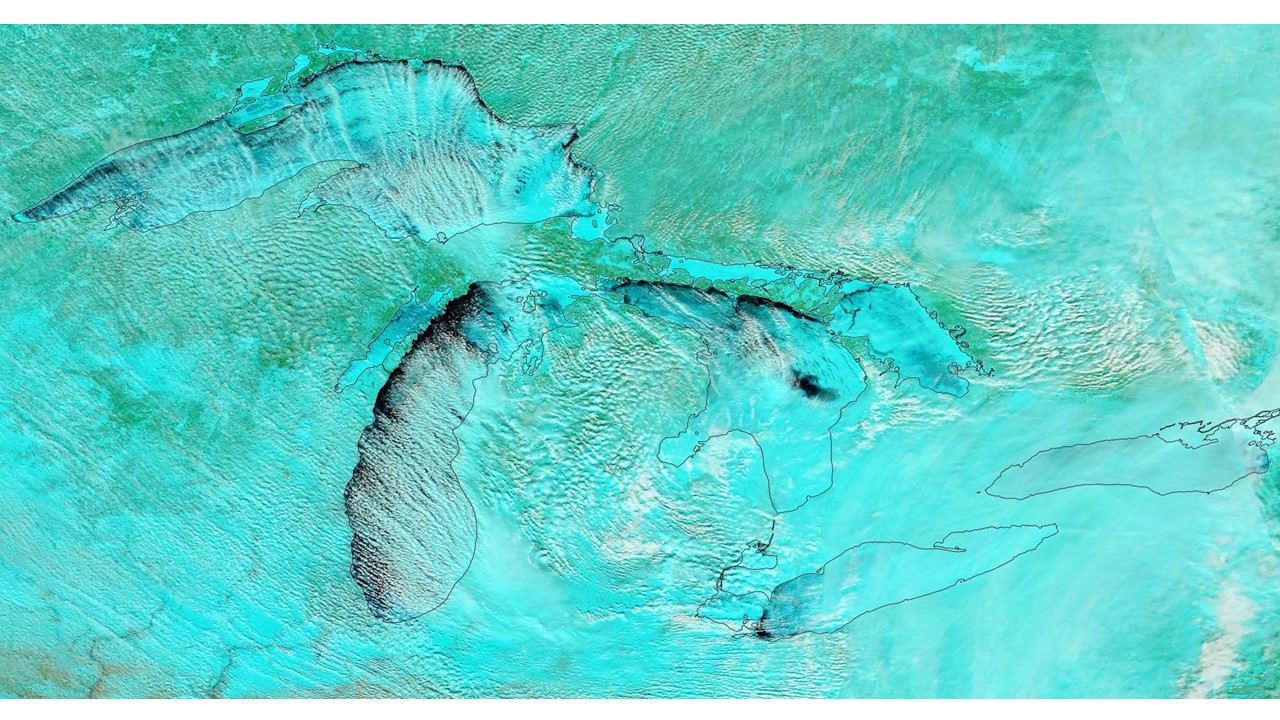
Here’s the latest MODIS false-color satellite image of the Great Lakes from yesterday, Feb. 18, 2015:
MODIS-Great-Lakes-7-2-1-Feb-18-2015

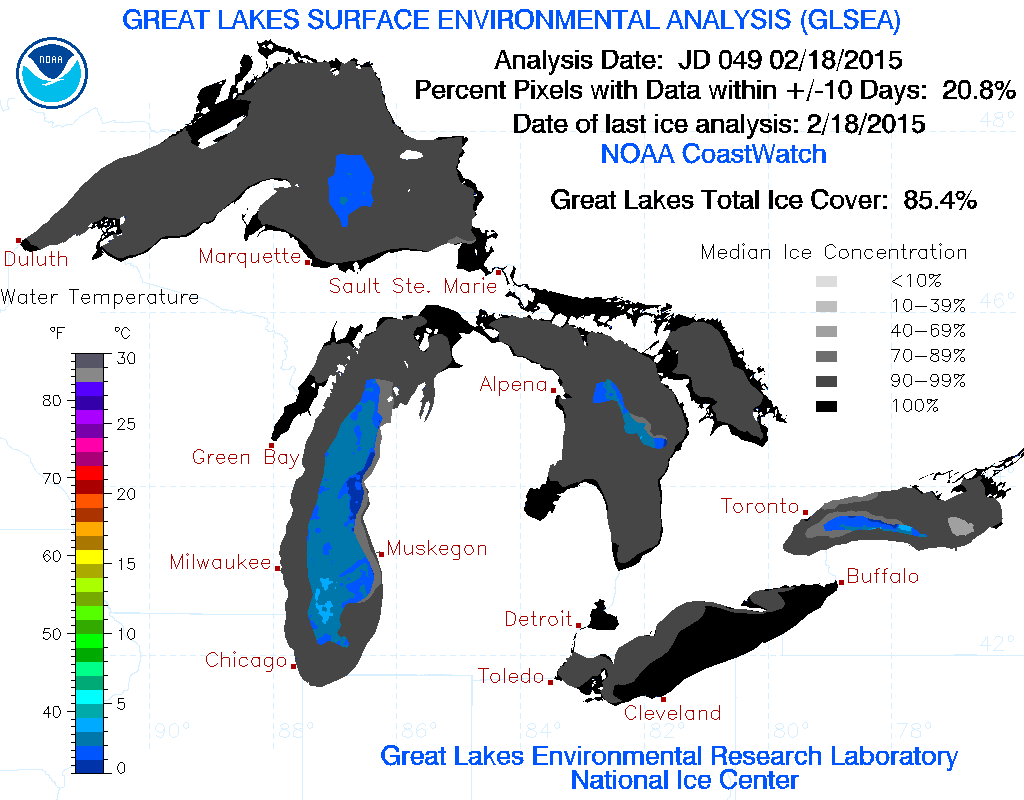
And here’s the official GLERL ice cover analysis for yesterday, which gives current coverage at 85.4%:
glsea_cur

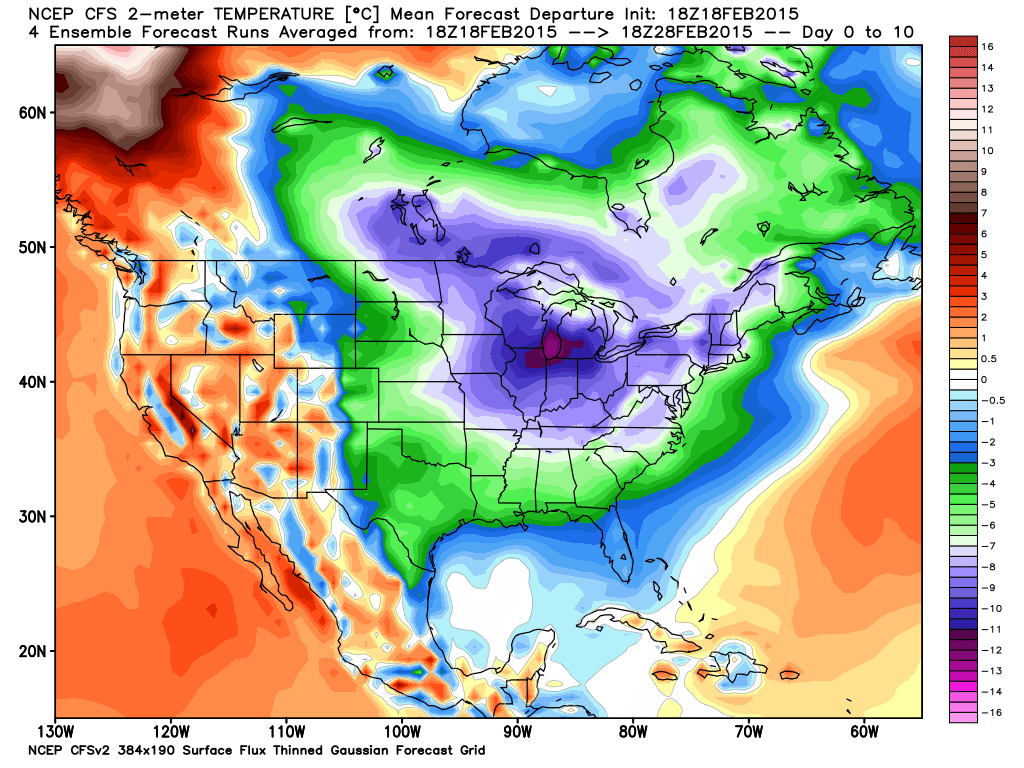
As the following graphic shows, the forecast temperatures for the next 10 days over the Great Lakes will be running an average of 15-20 deg. F below normal, so we could be looking at another record-setting ice cover season (graphic courtesy of Weatherbell.com):
cfs_anom_t2m_conus_2015021818_x41


148 Responses to “Great Lakes Rapidly Freezing Over”

Toggle Trackbacks

  1. rah says:

    According to this Accuweather article it has already exceeded last years ice coverage: “The ice extent over the Great Lakes in total this year is at 82.3 percent, rivaling last year’s coverage and nearing the all-time record of 94.7 percent.”

    http://www.accuweather.com/en/features/trend/photos_lake_michigan_ice/42552950

    They are the only ones I’ve found so far that have made such a claim.

  2. rah says:

    BTW I just finished my roughest haul this winter. Though I have taken I-90 out to MA and the 401 in Ontario up to the Toronto area quite a few times this year the worst driving conditions I’ve encountered was in Kentucky on Monday afternoon and evening. And I was in MA when they had Blizzard warnings from Albany, NY to the coast.

    Load was bound for Canton, MS. There was snow on the ground even 20 mi. down into MS along I-55. Tuesday afternoon on the way back north I noticed that the swampy area that I-55 passes through about 35 Mi south of the TN line was iced over.

  3. rah says:

    Perhaps someone can tell me why Lake Michigan has relatively so much less ice coverage. I understand that it’s further south than Superior and it’s nearly as deep and is deeper than Lake Huron that’s at about the same latitude. But still, it seems Michigan is more resistant to freezing over than any of the other lakes. Could it be the N – S orientation of the lake? Unlike any of the other big lakes in the system it’s long axis is perpendicular to the prevailing winds.

    • Gus says:

      I think it, Lake Michigan having less enthusiasm for freezing, is, like almost everything else, due to multiple factors. Indeed it does reach somewhat farther south, but not more than Erie (which freezes easily, because it’s shallow), and, on average, not more than Ontario and only a little more than Huron. No, I think it has more to do with prevailing direction of the movement of Arctic weather systems. They tend to move diagonally, from North-West to South-East. Consequently, Lake Michigan, its southernmost part in particular, tends to be spared of the worst in winter, but not always. The other factor may be, indeed, due to its north-south elongation, that waves can get very high in the south in winter gales. This is why we have Indiana Dunes. But this strong wave action may prevent ice buildup too.

      • rah says:

        Wave action due to winds makes sense based on the Map Roy posted. Notice that the west coast area which would be the lee side of the lake is iced over but the east coast is not for the most part.

        Or Maybe Gordon Lightfoot had the answer:
        “Lake Huron rolls, Superior sings
        In the rooms of her ice-water mansion
        Old Michigan steams like a young man’s dreams
        The islands and bays are for sportsmen
        And farther below, Lake Ontario
        Takes in what Lake Erie can send her
        And the iron boats go as the mariners all know
        With the gales of November remembered”

        http://www.azlyrics.com/lyrics/gordonlightfoot/thewreckoftheedmundfitzgerald.html

      • rah says:

        Over at WUWT they have a post up on the Great Lakes freezing and I learned that Michigan is not in fact the lake least likely to freeze. Here I transcribe the post:

        ____________________________________
        qam1
        February 19, 2015 at 8:45 am

        Actually and surprisingly the Great Lake that freezes up the least is Lake Ontario.

        From the Canadian Ice Services

        “Some of the Great Lakes are far more likely to freeze over than others. The Canadian Ice Service (CIS) has been keeping statistics since the 1970s, and has calculated the likelihood of the lakes freezing to the point where 90 per cent of their surface is covered in ice.

        Erie, the shallowest and farthest south of the lakes, is the most likely to freeze to that point, with a chance of 69 per cent. Huron comes next at a 22-per-cent probability, followed by Superior at 17 per cent and Michigan at 11 per cent. Lake Ontario has a mere 1-in-100 chance of having 90-per-cent ice coverage, the CIS estimates. ”

        The last time Ontario froze over was in 1934 and typically only 25% freezes over”
        —————————————-

        And so my ASSumption was wrong. But I can understand why Ontario is less likely to freeze. It’s below the Niagara escarpment at a lower elevation than any of the rest besides having a significant current from Erie flowing into it and outflow to the St. Lawrence.

        • John says:

          Ontario is the second deepset (on average) of the Great Lakes. It has a much harder time freezing over namely because artic air is modified by the time it reaches Ontario. Depth and geography, not current, leave open water on Ontario.

  4. Alick says:

    The ice is certainly not as thick as it was last year.

    Ice is nature’s way of minimizing heat and water loss from lakes and slow moving rivers during winter months.

  5. Every once in a blue moon science has the MOMENT OF TRUTH.

    This may be coming about over the next few years as the global temperature trend will determine which item has a greater influence on the climate, that being prolonged solar minimum activity (COOLLING) or increase CO2 (WARMING).

    Meanwhile, the Great Lakes ice coverage is ahead of the record pace set just last year by about 1%.

    The AMO might have flipped into it’s cold phase and if it has it will be interesting to see how the Arctic Sea Ice recovers.

    PDO is in a temporary warm spike but that to apparently is in a cold phase.

    Southern high latitude oceans cooling which should portend to high Antarctic Sea Ice levels as their fall progresses.

    With the maximum of solar cycle 24 apparently winding down ,a weakening geo-magnetic field, I conclude it is looking pretty darn good for global cooling going forward from here.

    • David Appell says:

      The west, including Alaska, is running much higher than normal. We’ve had hardly any winter at all, with mountain snowpacks running only about 25% of normal.

      In Oregon, right now, I have my back door open for my cats. I’ve been able to do that for several days in the last two weeks. In mid-February.

      • geran says:

        Davie, have you ever heard of “Alberta Clipper”?

        • David Appell says:

          Sure. The point is, just because it’s cold where in the major media marketplaces doesn’t mean it’s cold everywhere. Because it certainly isn’t:

          http://cci-reanalyzer.org/DailySummary/index_ds.php

          • geran says:

            Davie, do your homework. Where does the “Alberta Clipper” occur?

            No wonder everyone makes fun of you.

          • David Appell says:

            The relevant fact is that most of the globe is now at average temperature or above. January was the 2nd warmest January in NOAA’s records, and GISS’s; UAH LT was 5th warmest. The cold in the northeast simply doesn’t matter much for the global numbers.

          • geran says:

            No, the relevant fact is that you do not know what the “Alberta Clipper” is.

            Beyond that, you do not understand that the planet is not “overheating”, and the oceans are not boiling. The science does not support it, and the observations do not support it.

            The interesting thing, however, is you WANT the planet to be overheating and the oceans to be boiling. It has to do with your upbringing, I suspect….

          • David Appell says:

            You thing the seas have to “boil” before we can say the planet is heating? Wow, that’s just bizarre.

            The science, of course, shows AGW is happening. That’s why so many scientists take that position.

          • There are have been certain years every few years, where the global temperature has been the “warmest on record” going back 300 years. Yeap it was the warmest on record at some stage in the 18th century, then the 19th, then the 20th and so on. That’s because we’ve been experiencing a mild average warming for the last 300 years or so.

            You’ve have to be a nitwit, or a David Appell, to think that such a banal observation has any “deep” meaning by itself whatsoever.

          • David Appell says:

            “There are have been certain years every few years, where the global temperature has been the “warmest on record” going back 300 years.”

            You know the global temperature going back 300 years? Where are those data?

            “That’s because we’ve been experiencing a mild average warming for the last 300 years or so.”

            1) Why?
            2) Again, where are those data?

          • Wow, you’ve probably cited the IPCC global temperature reconstructions a million times in internet forums everywhere. Yet suddenly you have a blank memory. What a creepy little intellectual sleaze ball you are. I can understand the amnesia if you’re mentally ill. Maybe you are?

            http://en.wikipedia.org/wiki/Temperature_record_of_the_past_1000_years

          • Phyte On says:

            David, where is the science behind California’s Cap & Trade scheme having any measurable, discernible impact on the climate?

            There is zero scientific evidence that California’s mitigation of climate change has any impact at all whatsoever. It is simply blind faith to believe that these kinds of climate policies have any objective measurable impact on sea level rise, arctic ice cover, extreme weather, global temperatures.

      • crakar24 says:

        Oh please david will you stop with the “It might be colder where you live but trust us when we say it was hotter everywhere else”. I could not care less if you can leave your back door open so your cats can come and go as they please. It has as much relavance to AGW as to the fact that it was the coldest January and wettest for 23 years in Adelaide.

        • David Appell says:

          Adelaide is a mere pimple on the planet. The entire west, including Alaska — not so much.

          • geran says:

            funny you should mention a pimple, davie.

          • crakar24 says:

            Well David i must agree Adelaide is nothing more than a pimple in more ways than one (just like your house and the cat story) however once again you drove straight towards the point but at the last second swerved and hit the pink unicorn instead.

            Maybe one day you will be able to grasp a point when it is presented.

          • David Appell says:

            Here’s a temperature map of the entire surface. Read it and weep:

            http://cci-reanalyzer.org/DailySummary/index_ds.php

          • crakar24 says:

            Oh i am weeping david but not because of the wild goose chase you just sent me on but because there are more people out there just like you.

          • David Appell says:

            Do you doubt the reanalysis?
            If so, why?

          • I think they are doubting your sanity. And I feel sorry for your collection of cats. I always thought you were a bit pathetic as a lonely obese unemployed man on a personal crusade to save the world from the coming climate Apocalypse. Typing away frantically everywhere all over the internet… Which is why you write articles on your tiny blog that nobody reads, about how “unbelievers” should be sent to jail for thought-crime. I also concluded you were a bit of a weirdo when you once told me that people should compare you to Einstein.

            Now I find out you own lots of cats. Why isn’t that surprising?

          • David Appell says:

            Will: You never present much science here; just a lot of personal attacks. Why is that?

          • Because cranks and fools deserve to be mocked not encouraged.

        • llew Jones says:

          I’m a 1937 model who was born in a Melbourne suburb (Aust) and have lived in that proximity all my life. Jan 2015 through Feb has been a relatively cold summer over all. Despite the promise from the Australian BOM that we would experience a very hot and dry summer. That promise was given prior to Dec 14 , the start of our summer.

          Our BOM has been caught out fiddling with the temperature data to make it appear it has been warming more than the raw data indicates. The head of the Aussie BOM, David Jones, is a rabid warmist.

          From memory the 1940s and 50s seemed much hotter than any extended period since. So called Heat Waves seemed to be much hotter then and extended for a greater number of days than any during the post 1940 – 1950 period. The most devastating bushfires ever to occur,to date, and which burnt across most of the State of Victoria began on 13th Jan 1939.

          • rah says:

            Your BOM is playing the same game as our NASA GISS Climate unit and NOAA. Doing their best to cool the past records and warm more recent ones. Now I see that we will have a congressional investigation into the adjustments being made in the US temperature record. I suspect what will come out of it is nobody knows nothing and perhaps a revelation of lost records and emails and “failed” hard drives.

    • David Appell says:

      In fact, the AMO hasn’t flipped. But the PDO seems to have. Data here:

      http://davidappell.blogspot.com/2015/02/giss-temperature-numerology.html

      “I conclude it is looking pretty darn good for global cooling going forward from here”

      You said much the same over 4 years ago. It never happened:

      “…here is my prediction for climate going forward, this decade will be the decade of cooling.”
      — Salvatore del Prete, 11/23/10
      http://ourchangingclimate.wordpress.com/2010/10/20/andrew-dessler-debating-richard-lindzen/#comment-8875

      “Temperatures in response to this will decline in the near future, in contrast to the steady state of temperature we presently have,or have been having for the past 15 years or so.”
      — Salvatore Del Prete, 11/6/12
      http://www.drroyspencer.com/2012/11/uah-v5-5-global-temp-update-for-october-2012-0-33-deg-c/#comment-64939

  6. rah says:

    Some seem to think we’re seeing the beginning of the end of the Holocene. Personally I have no idea, but I certainly don’t believe that we have the accumulated knowledge about what causes the earth climate cycles to make such a prediction.

    But your point on the solar cycle being stunted and in its waning phase and the expected effect on our coming weather is well taken.

    I do have to laugh about some of the stuff I read concerning comparisons with past solar cycles and the mention of the
    Carrington event which occurred during the time that is most similar to the last three cycles, as if the earth being in the path of a major solar storm is not the unpredictable crap shoot it is.

  7. Robert Clark says:

    I predicted another polar vortex this Winter as last based on the rebound of the arctic ice:

    http://www.washingtonpost.com/blogs/capital-weather-gang/wp/2015/02/18/polar-vortex-to-unleash-record-breaking-cold-in-eastern-u-s-on-thursday-friday/

    I find it quite notable as well that the arctic temperatures are arising from air from Siberia coming over the arctic, a phenomenon that must be helped by extensive arctic ice.

    http://www.nbcnews.com/news/weather/siberian-express-brings-arctic-air-record-lows-u-s-n308621

    Perhaps if government climate scientists would acknowledge the arctic ice is rebounding rather than trying to ignore it, they would be able to make much better predictions.

    Bob Clark

  8. nels says:

    The simple proof that CO2 change does not cause climate change has been hiding in plain sight.

    CO2 has been considered to be a forcing with units Joules/sec. Energy change, which is revealed by temperature change, has units Joules. Average forcing times duration produces energy change. Equivalently, a scale factor times the time-integral of the CO2 level produces the temperature change.

    During previous glaciations and interglacials (as so dramatically displayed in An Inconvenient Truth) CO2 and temperature went up and down nearly together. This is impossible if CO2 is a significant forcing (scale factor not zero) so this actually proves CO2 CHANGE DOES NOT CAUSE SIGNIFICANT AVERAGE GLOBAL TEMPERATURE CHANGE.

    Application of this analysis methodology to CO2 levels for the entire Phanerozoic eon (about 542 million years) (Berner, 2001) proves that CO2 levels up to at least 6 times the present will have no significant effect on average global temperature.

    See more on this and discover the two factors that do cause climate change (95% correlation since before 1900)nin a peer reviewed paper published in Energy and Environment, vol. 25, No. 8, 1455-1471 or search “agwunveiled”.

  9. https://tallbloke.wordpress.com/2015/02/16/guy-callendar-data-shows-co2-changes-lag-behind-temperature-changes/

    More data which shows prove CO2 follows the climate and is therefore a result of the climate not the cause.

    • geran says:

      Sal, if you know that CO2 cannot “heat the planet” then why do you state nonsense like this:

      “This may be coming about over the next few years as the global temperature trend will determine which item has a greater influence on the climate, that being prolonged solar minimum activity (COOLLING) or increase CO2 (WARMING).”

      There is NO validation for an increase from “CO2 (WARMING)”.

      So, why even offer that as an option???

      • David Appell says:

        quote: “There is NO validation for an increase from “CO2 (WARMING)””

        “Increases in greenhouse forcing inferred from the outgoing longwave radiation spectra of the Earth in 1970 and 1997,” J.E. Harries et al, Nature 410, 355-357 (15 March 2001).
        http://www.nature.com/nature/journal/v410/n6826/abs/410355a0.html

        • geran says:

          Poor Davie, have you looked out your window lately?

          Have you compared the IPCC “climate forcing” with RSS temps?

          Of course you have. But you still choose to stick with your belief system. Amazing what a belief system can do to a brain. Many drugs are as harmful….

          • David Appell says:

            What makes you think RSS temperatures are right (as compared, say, to UAH’s)?

            Dr Spencer has noted here that

            1) RSS covers less of the polar regions than does UAH, and
            2) RSS now relies on a computer model to correct for a decaying satellite.

            So explain.

          • geran says:

            Okay Davie, you choose the metric.

            Where does any metric coincide with IPCC “climate forcing”?

          • crakar24 says:

            Nothing but crickets Geran as expected,

            The problem with “Davie” and others like him is that they dont even understand what they are talking about because they have been sucked in by the IPCC propaganda.

            We of course understand that CO2 will produce very little warming but IAW IPCC doctrine this will lead to more WV accumulating in the ATM until (theoretically) the oceans will be suspended above our heads thus leading to 6, 8 or 10C of warming.

            Of course we have not seen this warming but David and his pals think CO2 will give us all the warming hence his pigheaded ignorance of reality.

            I have read many excuses for the pause, most are ridiculous of course but the best two so far are:

            1, They have run out of excuses to further adjust the temps up (raw data shows virtuly no trend).
            2, The amount of WV is limited (moving into Roy’s field of expertise here) but there is only so much WV you can stick up there. Ergo no matter how co2 you have the temp ceiling is limited. If you look at the temp peaks for the last 8 or so ice ages you will see what i mean.

          • David Appell says:

            “We of course understand that CO2 will produce very little warming….”

            Where can I find your calculation of CO2’s climate sensitivity?

          • crakar24 says:

            Seriously David, You are now going to dispute one of the central planks of the AGW (IPCC) theory? Your ignorance knows no bounds.

          • David Appell says:

            crakar24: Where can I find your calculation of CO2′s climate sensitivity?

            I’m guessing you don’t have one.

          • crakar24 says:

            LOL,

            Gernan is still waiting for you to give them a temp dataset that agrees wth the models. Instead of responding to him with the data you now try and wiggle your way out of not understanding the basic premise of the theory you hold so dear.

            I, like you dont have my own personal climate sensitivity value however if you want one that someone else has prepared earlier then i suggest you go and ask one Dr Roy Spencer.

            Which brings us back to the point your are desperately trying to escape from, the amount of warming induced by CO2 alone has little to do with CLIMATE SENSITIVITY, CS is how the climate will react to the pittance of warming we will see from elevated levels of CO2.

            For someone who has pestered, harassed, annoyed and baited poeple on this site for so many years you dont know much about this subject.

          • I am still waiting for him to show why there is “NO validation for an increase from CO2,” when the observations I cited (Harries et al 2001) show the greenhouse effect is increasing, particularly at the wavelengths absorbed by CO2.

            Here’s a similar study:

            “Radiative forcing – measured at Earth’s surface – corroborate the increasing greenhouse effect,” R. Phillipona et al, Geo Res Letters, v31 L03202 (2004)
            http://onlinelibrary.wiley.com/doi/10.1029/2003GL018765/abstract

            Also, be sure to watch the science news next week.

          • “What makes you think RSS temperatures are right (as compared, say, to UAH’s)?”

            Only a nitwit would write something like that. RSS runs a little warmer than UAH but overall they pretty much report almost exactly the same global temperature.

            http://www.woodfortrees.org/plot/rss/last:120/plot/uah/last:120

            On top of that, both data sets are in close agreement with radiosones so there is no reason to conclude they are fairly close to actual temperature.

            Nitwit Appell keeps trying to rubbish RSS because he is a crank. He doesn’t like the fact that the RSS trend over the short term is lower so he spits his poison at it. But nobody cares what you think, except your fellow cranks.

          • David Appell says:

            “RSS runs a little warmer than UAH but overall they pretty much report almost exactly the same global temperature.”

            False. After adjusting for different baselines, RSS LT’s average anomaly over the last 5 years is 0.15 C. UAH’s is 0.24 C.

            Over the last 15 years, UAH LT’s trend is +0.12 C/decade. RSS LT’s is 0.00 C/decade.

          • David Appell says:

            “He doesn’t like the fact that the RSS trend over the short term is lower so he spits his poison at it.”

            That’s funny, because in the very same comment you wrote:

            “RSS runs a little warmer than UAH but overall they pretty much report almost exactly the same global temperature.”

          • You can’t even eyeball a graph nitwit?

            I like how you try to BS your way out of it by saying “after adjusting for baseline differences.” After I adjust the data the way I think it should be adjusted you’re false. Amazing.

    • David Appell says:

      What happens when independent agents — let’s call them “people” — dig up fossil fuels and burn them?

      Or are they first waiting for the planet’s temperature to change before burning what they dug up?

      • geran says:

        Davie, the old adage is “there are no stupid questions”.

        But, you challenge that adage.

        • David Appell says:

          Try answering the question, instead of ad homs.

          • geran says:

            Try presenting a legitimate question instead of imagining ad homs.

          • I have a legitimate question — What happens when people dig up fossil fuels and burn them? And when they do that regardless of any change in the Earth’s average global surface temperature?

          • Nothing happens moron.

          • David Appell says:

            Nothing happens when people shovel carbon from the ground and burn it?

            That’s what AGW is all about. An outright dismissal of that isn’t acceptable.

          • Nothing bad happens to humanity. The planet benefits from a little bit of extra warning. The rest of your fears come out of your delusional mind as a crank/Apocalypse believer.

          • Lewis says:

            David, you ask: What happens when people burn hydrocarbons stored in the ground? What kind of question is that? Do you want the chemistry of the process? Perhaps not. But I’ll play along.

            In essence a little bit of CO2 is replaced in the atmosphere, from whence it came millions of years previous after some plant used sunlight to convert it to cellulose or some such and then died and it, along with much other plant life which had been converting CO2 to hydrocarbons, accumulated their dead bodies in the ground. There, with much pressure and heat, coal and other concentrated forms of hydrocarbons lay in wait for thousands of years. All this was in expectation that some smart animal, homo sapiens perhaps, would realize what a great, GREAT, source of energy was stored in the ground, and would use it for the benefit of that animal.

            Does that answer your question or did you have some other answer in mind?

  10. Geran , I said it that way in order to show the stark difference between what AGW theory is predicting (which is wrong) and what those of us who believe it is solar are predicting.

    I was trying to say they (the AGW crowd) believe co2 will warm the climate, while myself and others do not believe it will.

    I probably could have said it differently.

    • David Appell says:

      “I was trying to say they (the AGW crowd) believe co2 will warm the climate, while myself and others do not believe it will.”

      So do you think CO2 doesn’t absorb infrared radiation, or do you think the Earth doesn’t emit it?

      • crakar24 says:

        Or you could put Davids loaded question another way

        “Have you stopped beating your wife yet David?”

        • David Appell says:

          It’s a simple question: if you think anthropogenic CO2 doesn’t create warming, do you think that CO2 doesn’t absorb infrared radiation, or do you think the planet doesn’t emit it?

          • crakar24 says:

            For the love of God………….the correct answer to both the questions is NO.

            For the slow thinkers.

            Q, So do you think CO2 doesn’t absorb infrared radiation
            A, NO

            Q, do you think the Earth doesn’t emit it?
            A, NO

            Q, What relevant information can you parse from these answers in order to enable you to continue with the debate?
            A, Nothing

            You phrased the questions in such a way that no matter how one answered you could continue with your stupid little games, Ergo it is a loaded question but alas even this simple exercise in english grammer is beyond your grasp.

          • Then what does your calculation for CO2’s equilibrium climate sensitivity (and transient climate response) give?

      • PeterK says:

        Who cares.

  11. Finally I have to get a dig in at CO2. In January of 2013 it was 395 ppm and in 1985 it was 50 points lower at 345 ppm. So despite the fact that CO2 was higher, the Earth was losing energy at a higher rate to space. CO2 was not blocking the energy from escaping despite all the claims that increased CO2 prevents heat from escaping the Earth. The Earth 30 years later was losing a significantly larger amount of energy to space than it was in the past. – See more at: http://theinconvenientskeptic.com/2013/03/misunderstanding-of-the-global-temperature-anomaly/#sthash.wK30EICB.dpuf

  12. David you keep miss representing what I have said. Below is what I have been saying. The sun has yet to reach the criteria.

    THE CRITERIA

    Solar Flux avg. sub 90

    Solar Wind avg. sub 350 km/sec

    AP index avg. sub 5.0

    Cosmic ray counts north of 6500 counts per minute

    Total Solar Irradiance off .15% or more

    EUV light average 0-105 nm sub 100 units (or off 100% or more) and longer UV light emissions around 300 nm off by several percent.

    IMF around 4.0 nt or lower.

    The above solar parameter averages following several years of sub solar activity in general which commenced in year 2005.

    IF , these average solar parameters are the rule going forward for the remainder of this decade expect global average temperatures to fall by -.5C, with the largest global temperature declines occurring over the high latitudes of N.H. land areas.

    The decline in temperatures should begin to take place within six months after the ending of the maximum of solar cycle 24.

    • David Appell says:

      “The decline in temperatures should begin to take place within six months after the ending of the maximum of solar cycle 24.”

      That’s not what you said 4 1/2 years ago. Then you wrote,

      “…here is my prediction for climate going forward, this decade will be the decade of cooling, due to the sun, soi oscillation, volcanic activity, nao,ao oscillations ,pdo/amo ocean circulations all phasing toward a colder mode, prior to 2005 they were al mostly in a warrm mode and that is what accounts for the temp. rise last century.”
      https://ourchangingclimate.wordpress.com/2010/10/20/andrew-dessler-debating-richard-lindzen/#comment-8875

      Your predicted cooling never happens, so you keep moving the goalposts. I’m sure you’ll keep doing it, using any excuse you can find.

      Yet I don’t see once where you tried to understand why your predictions have failed, and adjusted your views based on what actually happened, rather than what you wish would happen.

      • Lewis says:

        David,

        Curious comment you make “Yet I don’t see once where you tried to understand why your predictions have failed, and adjusted your views based on what actually happened, rather than what you wish would happen.”

        Would you say the same about the IPCC and their sycophants?

      • Lewis says:

        David, you said “Yet I don’t see once where you tried to understand why your predictions have failed, and adjusted your views based on what actually happened, rather than what you wish would happen.”

        Would you also say the same to the IPCC types and their sycophants?

  13. stevek says:

    I’m not sure what will happen but next 30 years will be very interesting !!!

    my gut feeling is that temperature records manipulated to show exaggerated warming. Warming by so much I think would have caused much more ice loss at poles. Too much ice for such a warming trend.

    Also Temps so low during Maunder and Dalton minimum too much of coincidence for me to think solar activity has little effect.

    Some sun experts may disagree but they base their data on recent history which is corrupted by confounded variable of ozone depletion.

    Ozone layer coming back combined with prolonged solar min will make next 20 to 30 years very interesting indeed.

    I hv not Much science background but work for hedge fund and bas my gut feelings on experience off making boatloads of money predicting things like price of wheat. Oil. Gold, stock indices and interest rates. most winning bets are based on very simple common sense thinking.

    If I’m wrong I will be happy to admit it. I’ve lost many bets in past.

  14. Dr.Dave says:

    David Appell, you are a most wearisome and odious troll. You have, however, successfully hijacked this comment thread with your bullshit. This posting was about ice extent in the Great Lakes. Nobody really gives a rat’s ass about your open door or your cats. Obviously nobody wants to read about your CO2 myths, global warming and the rest of your crap (referenced by such objective sources as the WaPo, NYT and your own insipid website.

    Stay on topic or go away.

    • David Appell says:

      There is a huge amount of bad information in these comments, just like there is on all posts here. It’s like you have a mutual admiration society, and don’t want to here another word. But it’s good you see some facts once in a while, just to stir up your thinking. For you it seems to have worked.

      • Yes there are lots of cranks on this forum. Guys who think the sun can explain everything. Guys like Doug Cotton who think only they understand physics and everyone else got it wrong except them. And then nitwits like you who think the world is going to end because of the coming climate Apocalypse.

      • David Johnson says:

        I agree and 99% of the bad information is from you Appell

  15. Actually let me clarify my last comment. There aren’t that many cranks here, just three guys mainly, who overrun the comments section with their crazy ideas. Now, the sun-explains-everything-guy and the only-I-understand-physics-guy are cranks, maybe they wear tin foil caps, and maybe there are a little simple minded, but they genuinely believe what they believe. They are a bit nuts, but they are earnest. People see those posts, roll their eyes, and skip over them.

    Then there is the world-will-end-because-of-global-warming-guy. David Appell. Appell I hold in special contempt, because he despises everyone here. He thinks of himself as possessing a vast intellect, which bestows on him special privileges. And because he hates this readership with all his heart, he lies and cheats and tries all the lame tricks to try to prove his ‘deadly enemies’ wrong. He’ll pretend he doesn’t remember some fact he knows perfectly well. He’ll make up some fake statistics that he knows is BS. But to him it doesn’t matter, he’s only communicating with sub humans he would want to see put in jail or worse. It’s fine to lie and cheat and trick them, because he is special and he does it all for the greater good of the planet.

    That is why you are one of the few people I call a troll, and why you should be mocked and jeered at, wherever you go.

  16. David you are wrong when it comes to the climate and why it is where it is at, and where it will be going.

    In addition I sent to you the data showing the recent AMO flip.

    David, shows what I said below in quotes,which is correct.

    My reply

    David I said the cooling would be due to the sun phasing toward a cold mode which I am still saying. The maximum of solar cycle 24 has delayed the sun phasing into the cold mode to the degree I think is needed in order to have a greater impact on the global temperature trend. When the maximum of solar cycle 24 ends and when my solar parameters are approached I still say as I said before (sun phasing into a colder mode) that the global temperature trend will be lower. That should happen very soon.

    What David, said I said which is the same as I am saying now. Look below.

    “The decline in temperatures should begin to take place within six months after the ending of the maximum of solar cycle 24.”

    That’s not what you said 4 1/2 years ago. Then you wrote,

    David I said the same thing below as I said in the above it is just worded differently as I tried to explain in the above commentary I made.

    David in addition solar activity for the last 4 1/2 years has been moderate it did not phase into the cold mode during those years.

    “…here is my prediction for climate going forward, this decade will be the decade of cooling, due to the sun, soi oscillation, volcanic activity, nao,ao oscillations ,pdo/amo ocean circulations all phasing toward a colder mode, prior to 2005 they were al mostly in a warm mode and that is what accounts for the temp. rise last century.”

  17. David, the AMO has just flipped your data is not up to date.

  18. Slipstick says:

    Rah – Ummm, no, Greenland’s glaciers are shrinking in volume. And regarding Antarctic sea surface ice, ever watch a candle burn? Keeping in mind that fresh water freezes at a higher temperature than salt water, where do you suppose all that frozen water is coming from? Don’t try to compare Arctic and Antarctic ice. The Arctic ice is a floating pack, 10’s of meters thick; Antarctica is a rocky continent covered with an ice sheet averaging around 1900 meters thick.

    • This is the crank talking point that sea ice is increasing *because* its getting warmer. Did a junk science paper ever get published anywhere arguing that this might be physically possible? Or even just a speculation somewhere on a scientists blog? Or is this claim purely pulled out of your group’s nether regions?

      • Slipstick says:

        WN- Given your propensity for the ad hominem attack rather than a reasoned debate based on evidence, I was hesitant to respond but I will make one attempt. Analysis of data from the GRACE and GOCE missions shows a net mass loss in Antarctica on the order of 50 gigatons per year. Is the ice flowing out to sea, are the rocks of the continent dissolving, or are a trillion previously hidden penguins being teleported into space each year? Which do you think is most likely?

        • Gordon Robertson says:

          @Slipstick “Analysis of data from the GRACE and GOCE missions shows a net mass loss in Antarctica on the order of 50 gigatons per year”.

          Polar expert Duncan Wingham claims it is too cold on the Antarctic continent for ice to melt. If there is ice loss on the continent it is a natural process of glacier calving. There has been some melting high on the Antarctic Peninsula, closer to the latitude of the tip of South America but ice simply cannot melt on the continent.

          When ice flows down to the ocean from a glacier (it does flow under extreme pressure, like a plastic) it flows out over the ocean, balancing above it. It is pounded by wave action from one of the roughest seas on the planet, with waves up to 100 feet high.

          Besides all that, it has been noted that the foot of the glaciers in West Antarctica lie on bedrock that is below sea level.

          http://www.nasa.gov/jpl/news/antarctic-ice-sheet-20140512/

          The only thing that stops the waves eroding the ice completely is pack ice lodged between the glacier toe and the extreme wave action. Sometimes the pack ice moves off, as it does in the Arctic, and the glacier toes are exposed to the full effect of the ocean. Eventually, massive chunks of ice will break off due to flexing.

          There is nothing strange about massive chunks of ice breaking off the continent and the location is likely selected by ocean currents.

          If the ice loss was due to general warming one would expect ice to be breaking off all over Antarctica but it is confined to parts of West Antarctica.

      • Toneb says:

        No it’s “crank” to suppose a complex system such as the Antarctic environment should respond simplistically to warming (ie it warms therefore all ice melts in “straight line” fashion). If you warm the sub-equatorial regions of the S oceans and barely warm the Continent (as is happening) then the latitudinal DeltaT of the atmosphere will increase …. stronger PJS …. more intense storms circulating around the continent…. stronger surface winds (convergent into storms, so off-shore with katabatic winds from the interior) … ice gets blown further out to sea (by frigid winds). That plus the generally fresher waters being created making it easier for that ice to form.
        The bulk of the ice, as far as I am aware, melts back by the end of the summer.

        • I ask again: do you have any links to a scientific basis for this claim? If not – then you’re simply made up a just-so story on why more ice means warmer temperatures. In other words, you’re talking out of your arse. Put up, or shut up.

      • Slipstick I asked a reasonable question. Does your claim that increasing sea ice is consistent with global warming have any scientific basis whatosever or is this an activist talking point you pulled out of your arse? Your reply was to change the topic, and discuss Antarctic mass balance (MB). Do you have the slightest idea what you’re talking about? Of course you don’t. You’re an idiot. Global warming theory has nothing to say directly about mass balance. It does make predictions regarding surface mass balance (SMB). Do you understand the difference? Of course you don’t. Because you’re an idiot.

        Now, is it reasonable or fair for me to be so aggressive in my responses? Not if I was dealing with an intelligent person who has a different point of view. But if I’m not dealing with an intelligent person with a different point of view. I’m dealing with a moron who doesn’t have the slightest idea what he or she is talking about, so why shouldn’t I mock you for being an idiot? Time is precise, and sometimes the only way to deal with idiots is to mock them.

        • bev says:

          “…time is precise…”

          And sometimes even precious.

          There are certain frequent posters whom I regard as nonsensical or unnecessarily repititious or nasty. I certainly do not want to interfere with their freedom of speech. I think that Dr Spencer should simply shift their comments (he will have to be vigilant for their changes of name!) and any responses to them, automatically, to a parallel thread called “Here we go again!”

    • JohnKl says:

      Your’ knowledge of Antarctica proves very limited. You should know the Antarctic ice sheet not only extends over the entire continent but far out to sea as well. In addition, the depth of…

      “The Antarctic ice sheet that forms and melts over the ocean each year is nearly twice the size of the United States.”

      ramwell, Martyn. Glaciers and Ice Caps. Belgium: Franklin Watts, 1986: 19. “The average thickness of the Antarctic ice is 2,000 m (6,500 feet), and the greatest measured thickness is more than 4,770 m (15,650 feet).” 4,470 m
      (maximum)
      Simon, Seymour. Icebergs and Glaciers. New York: Mulberry, 1987. “In some places, the Antarctic ice sheet is more than fifteen thousand feet thick.” 4,500 m

      Further, I’ve read if memory serves that the Antarctic ice sheet off the continental shelf extends thousands of feet below the water line.

      Have a great day!

      • Slipstick says:

        JohnKL- My remarks regarding Antarctica were intentionally simplistic. By the way, your references are three decades old. Be well.

    • rah says:

      I made no comparison of arctic ice to Antarctic ice. I understand the difference. I also understand the circumpolar currents around Antartica. But the FACT remains that if that if this glob of metal, rock, and water was warming one would expect a decrease in Antarctic ice mass both terrestrial and sea, and instead the sea ice extent has been growing and that is a point that alarmists judiciously ignore if at all possible. Limiting their claims of loss to the western sheet and “thinning”. Both of which are dubious and not admitting that what was predicted to occur there due to warming has not!

  19. Slipstick says:

    Llew Jones – While not as warm as the last few summers, Melbourne’s summer has been about 4 deg. above average so far. Perhaps your recollections were “recalibrated” by the Angry Summer.

  20. dave says:

    “…essentially unchanged…”

    Yes, they bury it away in the fine print where most people will not read it – but there it is.

    The NOAA background stat is that the total volume of the Greenland glaciers is 2,850,000 cubic kilometers. They say it went down by 6 last year. I suppose we must change it to 2,849,994 cubic kilometers. Don’t know how anybody measures six (not five! not seven!) in three million.

    As for the Arctic SEA ice, the latest (for January) PIOMASS estimate is that it is up about a thousand cubic kilometers compared to same time last year.

    All trivial amounts, of course, compared to the total volume of the oceans – 1,335,000,000,000 cubic kilometers.

  21. nigel says:

    And the estimate of Arctic Sea Ice volume at the end of December 2014 was much the same as at the end of December 2013, namely about 15,000 cubic kilometers.

  22. nigel says:

    A gigaton of ice/water is about the same as a cubic kilometer.

    If the sea ice reduces, the net effect – a little surprisingly – is a a cooling effect for the Globe. Although the albedo goes up in the summer, the exposed liquid water in the winter ultimately radiates more infrared to space than when it is under an ice-blanket. Over the course of a year, the two effects are contrary, but the cooling will predominate.

  23. nigel says:

    When sea ice disappears the albedo goes DOWN of course.

  24. numberer says:

    At present, in the sea ice, there is a negative anomaly in the Northern Hemisphere of -972,000 sq. km., and a positive anomaly in the Southern Hemisphere of +598,000 sq. km.
    Both are cooling anomalies. That million sq. km. of open water in the North is radiating to space with a weak winter sun to compensate; and the six hundred thousand sq. km. in the South is reflecting strong summer sunshine back to space.

    Of course, the irony is that some of these cooling effects actually show up as increased brightness to the satellites (if their view reaches so far) and will be treated as evidence of warming!

    Naturally, everything may well be reversed in six months’ time. It is swings and roundabouts.

    • bassman says:

      Nigel or numberer, Do you have a specific paper to cite with quantitative data showing that increased radiation from open water is actually greater than the positive feedback of decreased albedo? I’m referring to the year as a whole. I have never seen any kind of estimate in the literature before. I have heard of the decline of arctic sea ice as comparable to a ball bouncing down a long set of stairs (large declines followed by temporary (2013,2014 for example) increases. The reasoning was increasing heat escape (negative feedback) due to less ice cover as has been mentioned above.

      With the temporary antarctic sea ice increase, it would be interesting to see research into how much negative forcing it would produce to cancel out some of the GHG forcing that is dominating the southern hemisphere. I am amazed at how lopsided the warming is between hemispheres (just as the models predicted) and wonder how much longer melting land ice and increased wind will sustain gains in antarctic sea ice cover. I give it until 2025 at best until other factors (increasing sea surface temps, air temps and current changes) reverse the trend.

      • torontoann says:

        You do not “need a paper”. That is because nigel is wrong. At high latitudes the albedo does NOT go down when ice is replaced by water. There, the angle of incidence of sunlight is such that, whenever the sun is seen, the specular reflection from calm* liquid water is close to 100%

        *If there are steep waves the effective angle of incidence increases by a little; i.e. you begin to get diffuse rather than specular reflection. This is a minor qualification.

        • torontoann says:

          On second thoughts, I have not allowed for the scattering of part of the sunlight in the atmosphere, which means that some of it comes straight down. Therefore ‘nigel’ is probably right – at least for the two or three months of high summer.

          However, it is a simple matter of spherical geometry and known solar power that, above a certain latitude, water, radiating straight up, at 270 C, will lose more heat than it can absorb directly from incident sunshine, even in high summer, and even with a low albedo (some people do assume 0.07.) In other words, clear water above this latitude will be a cooling influence compared to ice-covered water, at all times of the year, and therefore definitely for the whole year.

          A lot also depends on cloudiness. Open water in summer always produces clouds. These clouds can halve the incident radiation at the surface. So the albedo of a part of the globe can be sustained, even if the effect be now in the atmosphere rather than at the sea surface.

          Until UAH and RSS show their “global temperatures” as beyond, for three consecutive months, the extremes set in the 1980’s (lows) and 1990’s (highs) – or my beach hut drifts out to sea with me in it – I suggest insouciance
          in the face of claimed ‘trends.’

          • torontoann says:

            ” …lows..[and] highs… ”

            Obviously, should be lows OR highs.

          • Gordon Robertson says:

            @Ann “I suggest insouciance in the face of claimed ‘trends.’”

            I hope you don’t write scientific papers using such language. 🙂

            I wanted to comment because I participate on other blogs and there is a serious misunderstanding about trends and the difference been apparent warming and true warming.

            I presume you are referring to the subjective quote from John Christy of UAH that there has been little or no warming detected over the 33 years of the UAH data sets.

            I think what is missed in all the verbiage and outright propaganda about warming is how little of it there has actually been. The average cooling of the ’80 to which you refer peaked out in 1984 at -0.35 C on the UAH graph on Roy’s site. That’s 0.35 C below the 1980 – 2010 average.

            Post ’97/early’98, the pendulum swung suddenly circa 2001 to about +0.25 C above the 1980 – 2010 average. Then it leveled off leaving a flat trend between 1998 and the present. As of January 2015, we are sitting at 0.35 above the 1980 – 2010 average. There is no evidence however that the trend since 1998 has changed from being flat.

            The 1990s for the most part were just as cool as the ’80s till the whopping El Nino of late 1997 drove the global average as high in a few months as what any other force managed to accomplish in the previous century. Of course, we’ll never know if that’s true since surface stations are incapable of intricate measurements and they have all been amended by alarmists.

            All in all, compared to the absolute claimed (theoretical) global average of +15 C, a swing of 0.35 C is 2.3%. That means global temps have been swinging + 1.6%/- 2.3% either side of the 1980 – 2010 average the past 33 years.

            Remember, the 0.35 C is a maximum, not an average, and any trend involved is a recovery from cooling, not true warming.

            I seriously don’t know what the alarm is about. If you take room temperature at 20C, a 2.3% variance would mean a change of temperature from 19.54 C to 20.46 C.

            AGW is actually statistical smoke and mirrors. As John Christy explains, it’s like a teeter totter (seesaw for you Brits) with its pivot on 1998. It’s impossible to overlay a trend line on the data that has any meaning since the contexts vary so much during the 33 years. The teeter totter analogy explains why the recovery from cooling in the first 17 years of the data has tilted the overall trend line upward at 0.14 C/decade.

            The actual ‘true warming’ trend line is closer to 0.09C/decade once the cooling component is removed.That comes from the UAH 33 year report:

            http://vortex.nsstc.uah.edu/climate/2011/November/Nov2011GTR.pdf

            Even at that, the transition from the -ve anomaly region into the +ve or true anomaly region was so abrupt (coming in two years separately, 1998 and 2001) that one has to expect some kind of rebound effect from the 1997/98 El Nino.

            There is certainly no signature for anthropogenic warming in the data.

          • Gordon Robertson says:

            I should clarify when I mention swings either side of the 1980 – 2010 average that I am taking liberties. I realize the 1998 and 2010 averages reached 0.4 C above the baseline.

            Even at that, compared to the claimed absolute global average of 15C, 0.4 C is only 2.6%. The way alarmists talk about it one would think we were talking a 20% increase in warming.

            Based on the IPCC scare tactics in which they claimed warming by 2100 of 4C to 6C, that is a 27% to 40% increase in the absolute global average.

            In the past 33 years of high quality sat data we have seen no evidence of that whatsoever.

  25. rah says:

    Well Ontario may not freeze over after all. Ice coverage has decreased markedly. http://iceweb1.cis.ec.gc.ca/Prod20/page2.xhtml?CanID=11080&lang=en

    http://iceweb1.cis.ec.gc.ca/Prod20/page3.xhtml

    Pretty heavy winds apparently have pushed the new ice to the East.

    Is that it Doc? Or was the original data incorrect?

  26. numberer says:

    “Yes, Greenland was cold over the last year…”

    Again according to the NOAA Arctic Report Card:

    “Summer temperatures in Greenland were above the 1981-2010 average, but were not unusually warm.”

    Summer temperatures are the relevant ones since the melt happens usually from mid-May to mid-September.

  27. nigel says:

    I really want Greenland to warm up again. Then I might be able to get shot of the time-share Leif Ericsson sold to my Great,Great,,,.,Father.

  28. ray says:

    The following, from the Daily Telegraph newspaper in England, may be of interest:

    February 21, 2015

    “The head of the United Nations Nobel Prize-winning panel on climate change is being investigated for stalking and sexually harassing one of his employees.

    Dr Rajendra Pachauri is under police investigation in New Delhi after a member of his staff complained that he had bombarded her with suggestive emails and text messages and engaged her in ‘sexually-laden conversations.’ Dr Pachauri applied for a High Court injunction, to prevent the allegations being reported, on Thursday.”

    • rah says:

      Yep. A 2nd woman has come forward. It’s beginning like the Bill Cosby thing did. Pachauri canceled a trip to India. Wonder why?

    • Robert says:

      “he had bombarded her with suggestive emails and text messages”

      How stupid leaving evidence. But then he believes in Mann-Made Global Warming.

  29. bev says:

    Climate scientist, traceable emails, attack on free speech.

    Why does this seem so familiar?

  30. Robert says:

    Antarctic sea ice is growing again and even earlier than last year.

    2015, 02, 18, 3.53244,
    2015, 02, 19, 3.58506,
    2015, 02, 20, 3.60761,
    2015, 02, 21, 3.64377,

    2014, 02, 18, 3.59074,
    2014, 02, 19, 3.55059,
    2014, 02, 20, 3.51506,
    2014, 02, 21, 3.52853,

    ftp://sidads.colorado.edu/DATASETS/NOAA/G02135/south/daily/data/SH_seaice_extent_nrt.csv

  31. Slipstick says:

    Will Nitschke,
    I responded to your question, in the simplest, albeit somewhat satirical, manner that occurred to me at the moment, and yet, you respond with more insults. I only feed trolls once and I’m done with you; you might as well retire to your hovel under the bridge.

  32. bev says:

    Commenters on these winter weather events sometimes seem to forget that it is not simply a matter of a cold wave ‘pushing down.’ North America is the most cyclonic of the continents. Activity in the South of the USA, in the form of a cyclone moving rapidly Eastwards, is the usual precursor – which pulls in the cold air-mass from North-west Canada.

  33. Milly says:

    If the U.S. was hit so hard by freezing temperatures, blizzard and large waves of snow, it is obvious that the Great lakes area will face similar freezing conditions.
    It is good that the snow is back and the glaciers are not melting to increase the water level of the oceans.

    http://www.alternative-energies.net/are-you-prepared-for-the-monstrous-snow-storm/

    Sadly, more freezing temperatures are expected to hit the area so we might face even tougher conditions.

Leave a Reply