Much has been said in recent weeks about how bigger snowstorms in Boston are (supposedly) just what climate models have predicted. “Global warming” is putting more water vapor into the air, leading to more “fuel” for winter storms and more winter precipitation.
While this general trend is seen in climate models for global average conditions (warming leads to more precipitation), what do the models really predict for Boston?
And what has actually been observed in Boston?
The following plot shows that the observed total January precipitation in Boston has actually decreased since the 1930’s, contrary to the average “projections” (in reality, hindcasts) from a total of 42 climate models, at the closest model gridpoint to Boston:

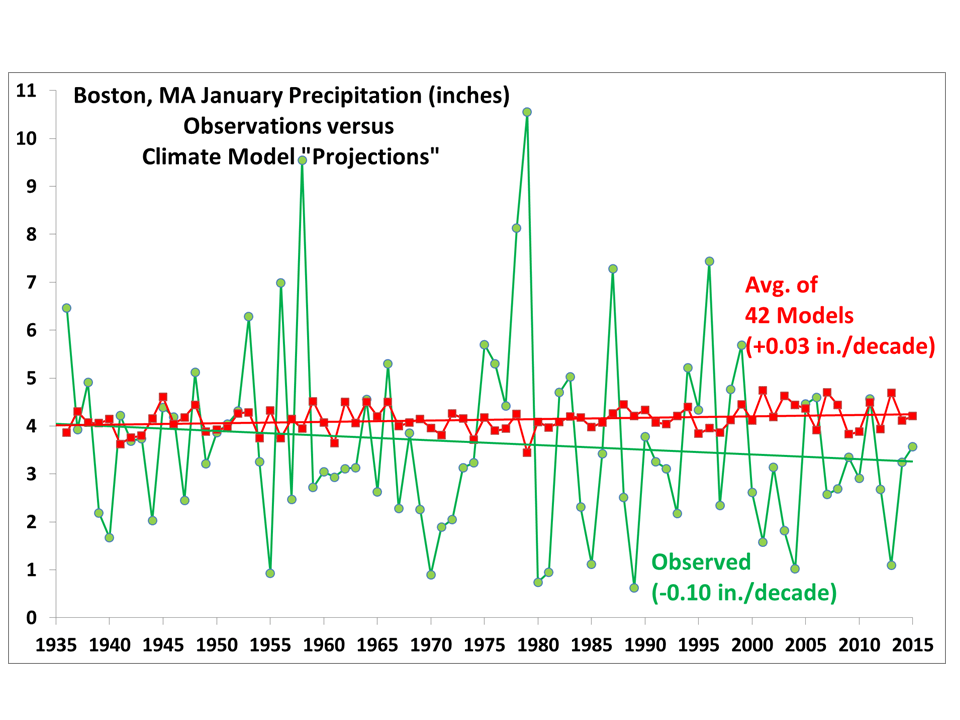
Fig. 1. January total precipitation at Boston, 1936 to 2015, in observations versus the average of 42 climate models. A small bias in the model precip is removed so the linear trends start at the same point early in the record.
Note that even the forecast increase in January precipitation is so small that it probably would never be noticed if it actually occurred.
During the same period, January temperatures in Boston have seen a statistically insignificant +0.1 deg. F per decade warming, in contrast to 2.5 times faster average warming produced by the 42 climate models:
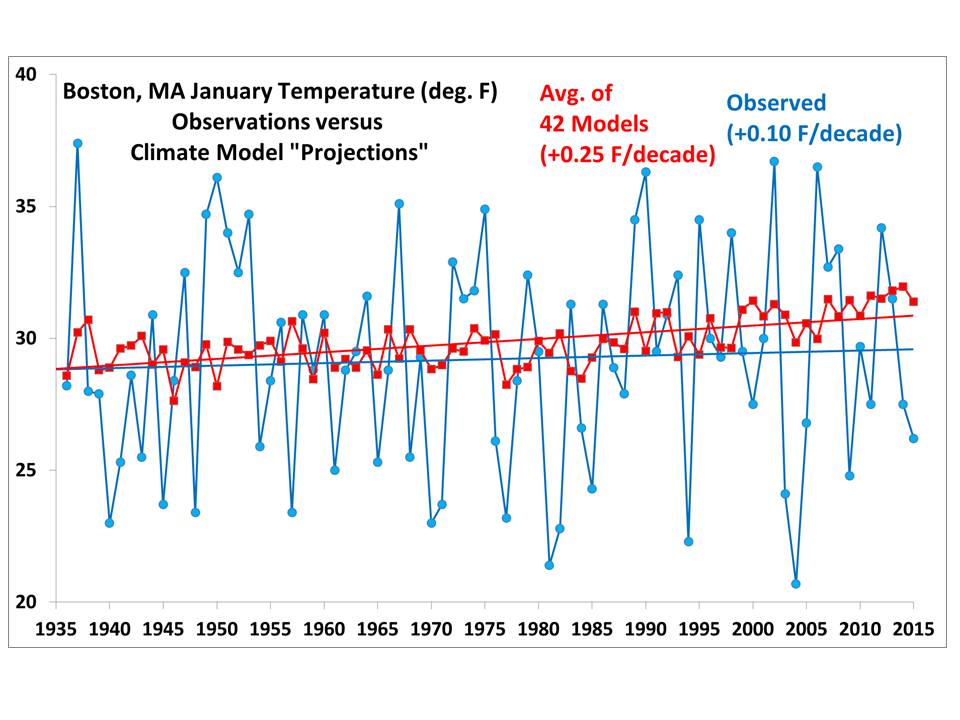
What is very evident is the huge amount of natural variability from year to year, as Bostonians are well aware.
It’s just weather, folks. Blaming everything on “climate change” is just plain lazy.
Exactly.
The climate has been quite stable for quite sometime ,and especially for the last 18 years.
Acutally, I am impressed how VARIABLE the actual data is compared to how STABLE the modelled data is.
Take a look at the max / mins over the years. Some immediately after each other.
Makes a mockery of the modelling data, IMO.
Another way to look at this is that if you assume that there is an underlying linear fit to the long term data, and you put a two sigma error bar around the observed data, the trend line average from the 42 models would probably fall within the error bar. So it’s too early to definitively say the models are right or wrong.
Taking this further, if you assumed that the variance of the data isn’t changing, you could figure out how many more years of data would be required to conclude that there is a 95% chance that the models are wrong. Eyeballing the data, this would probably be many years away…
“So it’s too early to definitively say the models are right or wrong.”
The models are wrong because they assume that isothermal conditions would occur in the absence of GH gases. That is not supported by the laws of physics, nor by evidence from other planets and nor by experiments such as that documented in our comment below.
Would be interesting to see the data for # of jan winters above or below a number of threshold values.
Observations?? But what are the “adjusted” values? Why would anyone publish at actual raw data? đŸ™‚
Northeasters, (aka the perfect storm) are not well captured by monthly or annual data, so basically Roy, this is about as useless as the Pat and Chip show on the same thing.
The issue is when the sea surface temperature is high (it is) and the wind is blowing from the southeast into the Cape and Boston, a load of water gets dumped on Eastern MA. If a cold (even dry) wind is blowing from the west (and in general the wind in Boston flows from the west, then you get a load of snow dumped.
Same basic principal as lake effect snow in western NY.
Exactly Brer Wabbit. Gorebull Warming Projections are as useless as whiskers on yours truly.
Now pontificate on Michael Mann’s tweet where he claimed the Atlantic SST anomaly off the cape was ~11.5c higher than normal putting more moisture in the air causing the snow dumps!!
HAHAHAHAHAHAHAHAHAHAHAHAHAHAHAHAHAHAHAHAHA
Was he really suggesting the Atlantic is normally frozen this time of year??
Was he really suggesting that evaporation downwind will cause huge snowfalls upwind?!?!
Seriously, maybe the first front, BUT, after the first front pushes the moisture laden air out to sea you BOTH are MORONS suggesting the next two fronts are dumping from the BS high evap from the BS elevated SSTs!!
Found here:
http://mattsweatherrapport.blogspot.com/2015/02/new-england-snow-has-officially-gotten.html
Here is the new Unisys:
http://weather.unisys.com/surface/sst_anom.gif
Nope, no exceptionally high SSTs upwind of Boston and New England especially since most of that precip was carried in from the west.
Those of us who live in eastern parts of New England know that snowfall (precipitation) amounts depend greatly on storm tracks which are highly variable. Fifty miles can mean the difference between 2 and 12 inches of snow. That’s why the data are noisy.
Interesting……….
Temperature cycles on East Coast are exactly opposite to those of West Cost, check them out! When East Cost is Warming, West Coast is cooling and vice versa. This suggests energy exchange between Pacific and Atlantic Oceans. What causes these cycles?
You cannot have global warming and precipitation increase at the same time, it is impossible. Increased precipitation means more evaporation and more evaporation means more surface cooling, basics physics. The fact that precipitation decreases is the reason why surface is warming. If one multiplies precipitation reduction by the latent heat of water vapor condensation, the result is energy accumulation in surface, or climate forcing. Check this simple calculation and compare it with IPCC observations and you will be right on the money.
Increased water vapor causes surface temperatures to be lower because it reduces the gravitationally induced “dry” temperature gradient, thus causing the thermal profile to rotate, lowering the supporting temperature at the surface.
It also leads to greater cloud cover, thus increasing albedo and lowering that 255K effective radiating temperature that anchors the overall level of the thermal profile.
The water cycle has little net effect, because as rain is about to re-enter the ocean it is warmed on descent back to almost the same temperature as was the original water from whence it came up from the oceans or wherever. More detail here.
“It also leads to greater cloud cover”
Not necessarily. Cloud cover is an effect and not a cause. If the energy exchanged with the earth is constant, then cloud cover is constant.
The most important issue in the whole climate debate is whether or not back radiation helps the Sun to warm the Earth’s surface (by supposedly delivering about twice as much thermal energy as the solar energy being absorbed) or whether (as happens on planets even without a surface) a temperature gradient evolves as entropy approaches a maximum.
Is there an experiment that resolves this issue? Yes there is!
Experiment outline: I determine that centrifugal force ought to have the same effect on air molecules as does gravity in forming the temperature gradient that we observe in every planetary troposphere. So I invent a tube shaped gadget in which I will inject air tangentially so that it spirals down the tube in a helical path. I expect it to experience centrifugal force along any radius of the cylinder, and so I expect (from the Second Law of Thermodynamics) that there will be a propensity for entropy to increase, and so a temperature difference should be observed between the air in the center and that on the outside. I find that someone has already constructed such a gadget (calling it a Ranque Hilsch vortex tube) and so I use it and find that indeed the air on the outside is far hotter than that on the inside. I do some calculations (see my comment on the Talk page of the Wiki article) and I find the temperature difference is indeed in accord with the expected -g/Cp temperature gradient along the radius when I use dry air. For more detail read the “Evidence” page on our website whyitsnotco2 dot com.
“The most important issue in the whole climate debate is whether or not back radiation helps the Sun to warm the Earth’s surface (by supposedly delivering about twice as much thermal energy as the solar energy being absorbed)”
But this is not true, Doug. The amount of IR that passes from the atmosphere to the surface has little to do with the fundamental mechanism of the GHE. I think this is why you and apparently so many people are confused.
The fundamental physics driving the GHE is that of radiative resistance to cooling. That is, the absorption of upwelling IR emission acting to cool that is absorbed by GHGs and clouds and subsequently re-radiated back downward toward the surface, thereby acting to warm. This mechanism has hardly anything to do with the amount of IR that the atmosphere passes to the surface, as there are multiple energy inputs to the atmosphere, including not the least of which is the latent heat of evaporation from the surface and post albedo solar power absorbed by the atmosphere.
Much of the downward LW incident on the surface is only replacing non-radiant flux leaving the surface but not entering as non-radiant flux, making it a net zero energy flux across the surface/atmosphere boundary.
Moreover, you fail to recognize that a radiative transfer simulation of a global average atmosphere results in about 300 W/m^2 of upwelling IR captured, for which it takes about +150 W/m^2 of net surface gain to offset (i.e. to establish equilibrium with space). It’s no coincidence that this is virtually exactly half the difference, as the probability of a photon emission at any discrete level in the atmosphere is 50/50 up or down. This is the same as what would independently be required by a black body emitting over twice the area it absorbs (the area of the surface and the TOA are about equal).
Or that in order to offset a W/m^2 of atmospheric absorption, it only takes 0.5 W/m^2 of additional net surface gain. This supports that even if 100% of upwelling emissions were absorbed, it would take only an amount equal to half that absorbed — of net surface gain — to establish equilibrium with space, effectively limiting atmospheric opacity to 50%. That is, the same as what would be predicted by considering only the raw properties of the photons (i.e. radiant boundary fluxes and isotropic emission on a photonic level).
I note there seems to be immense push back by Roy and others on this notion due primarily to the lapse rate and the fact that the atmosphere as a whole mass emits more to the surface than it does out into space; however, net opacity itself is independent of this and is determined by the amount of additional net surface gain needed to establish equilibrium with space. Additionally, it’s important to note that net opacity in this context is not that describing the thermodynamic path the system takes from one equilibrium state to another, but only that relative to the final equilibrium, as depicted here:
http://www.palisad.com/co2/div2/div2.html
BTW, the conclusion here among other things is that the IPCC’s claimed ‘no-feedback’ of 1.1C at the surface from 2xCO2 is actually only about half or 0.55C; or that incremental GHG ‘forcing'(i.e. forcing equal to post albedo solar power) derived from incremental GHG absorption is only half of what everyone apparently thinks or has accepted.
More importantly though in this context, it shows that equivalent balance emerges by considering only the elemental properties of the photons, thus demonstrating that the +33C or +150 W/m^2 of net surface gain is indeed radiatively induced as claimed by so-called mainstream science.
Regardless, Mr/Ms anonymous RW, you have to explain how the required thermal energy gets into the surface. The models and energy diagrams show 324W/m^2 of back radiation into the surface as in the diagram at the foot of this page. That is added to solar radiation, then non-radiative losses are deducted, so they get (as in the linked diagram):
168-24-78+324 = 390W/m^2
which, surprise, surprise is the exact requirement for a
black body temperature of 288K.
Seeing that back radiation (324) makes up 87.7% of that 390, I suggest they think it rather important as it is, after all, delivering about twice (193%) of what the Sun supplies, and of course that’s why we get so hot even at night. /sarc
Meanwhile, do please tell me, what is the sensitivity for a 1% increase in water vapor? I really don’t want to waste time with you until you answer that simple question, even if only approximately – perhaps 10 degrees of warming or maybe 15 degrees of warming for each 1% of water vapor would you think?
Try reading the real explanation based on real physics showing why water vapor sensitivity is negative – at
http://climate-change-theory.com
“Regardless, Mr/Ms anonymous RW, you have to explain how the required thermal energy gets into the surface.”
Why? We have a measured surface temperature of about 287-288K. From basic physical laws and a surface emissivity near 1, I can deduce that the surface must be gaining a net flux of about 390 W/m^2, which is needed to replace the 390 W/m^2 radiated away as a consequence of the surface temperature.
“The models and energy diagrams show 324W/m^2 of back radiation into the surface as in the diagram at the foot of this page.”
It’s not really ‘back radiation’ from the surface as the term implies, but just the amount of downward LW that passes from the atmosphere to the surface (a key difference).
“That is added to solar radiation, then non-radiative losses are deducted, so they get (as in the linked diagram):
168-24-78+324 = 390W/m^2
which, surprise, surprise is the exact requirement for a
black body temperature of 288K.”
Yes, as this is dictated by the S-B law when the surface emissivity is 1 (or at least very close to 1). For a state of energy balance, all power in excess of 390 W/m^2 entering and leaving the surface must be net zero across the surface atmosphere boundary, i.e. exactly cancel one another (otherwise the surface temp. can’t be 288K.)
“Seeing that back radiation (324) makes up 87.7% of that 390, I suggest they think it rather important as it is, after all, delivering about twice (193%) of what the Sun supplies,”
It’s not actually delivering 324 W/m^2 to the surface, as the additional amount of power gained at the surface is actually only about 150 W/m^2, since about 240 W/m^2 is supplied into the system by the Sun, though of course it doesn’t all pass directly to the surface (none the less, the joules have to be conserved, and the Sun is the only significant energy source to the system).
A large fraction of the 324 W/m^2 is just replacing non-radiant flux leaving the surface, but not entering the surface as non-radiant flux. Using those numbers, that amount would be 102 W/m^2, where the remaining difference after the post albedo solar power entering the system is subtracted, is 155 W/m^2. The additional 155 W/m^2 at the surface accounts for your +33C.
“Meanwhile, do please tell me, what is the sensitivity for a 1% increase in water vapor? I really don’t want to waste time with you until you answer that simple question, even if only approximately – perhaps 10 degrees of warming or maybe 15 degrees of warming for each 1% of water vapor would you think?”
To answer this, I would need to know how much additional IR power the atmosphere would capture with +1% water vapor from the current global average. That would require a detailed radiative transfer calculation. Such a calculation is not in my toolbox, but if I had a number, I could give you a rough estimate.
Anonymous RW (with an obvious pecuniary interest in promoting the hoax) writes about those whom he or she thinks claim that “the atmosphere as a whole mass emits more to the surface than it does out into space.”
The colder atmosphere cannot “emit” (meaning transfer by radiation) any thermal energy what-so-ever to warmer regions of the surface. All such radiation is pseudo scattered and, as even Roy knows, such radiation does not penetrate water by more than a few nanometers.
For what really happens on all planets and satellite moons, above and below any surface, join the 800 per week visitors to http://climate-change-theory.com
“The colder atmosphere cannot “emit” (meaning transfer by radiation) any thermal energy what-so-ever to warmer regions of the surface.”
A more appropriate term would be ‘passes’, which doesn’t necessarily mean gained.
The balance (or non-balance) at the surface is the sum of the fluxes in and out where the additive superposition principle must apply to the effects of energy (and power) on the surface temperature. At 288K, if more than net of 390 W/m^2 is added, the surface warms and radiates more; if less than net of 390 W/m^2 is added, the surface cools and radiates less. This is independent of how the joules are added at the surface.
The amount of IR that passes to the surface is simply one component of the thermodynamic path that ultimately manifests a net of 390 W/m^2 gained at the surface. This particular component has very little to do with the underlying physics driving the radiatively induced GHE.
A warm planet might make more vapor evaporate into the atmosphere but the warmth will not create snow. A cooling planet caused by an inactive sun will allow cosmic rays to seed clouds all the while the planet is cooling and thus cause snow.
Have you ever noticed clouds – those things made from water vapor? They shade the Earth, increasing the albedo from about 10% to 30%, and thus lowering the effective radiating temperature from that for
0.9(1366/4)=307.35W/m^2 (black body temp 271.34K) to
0.7(1366/4)=239.05W/m^2 (black body temp 254.82K)
So surprising isn’t it that no one has picked up on this obvious error of 16.52 degrees in Hansen’s and Pierrehumbert’s calculations about an earth without clouds because it lacked water vapor. /sarc
We interrupt this discussing for breaking news …
“Last week in Brussels, Christiana Figueres, executive secretary of U.N.’s Framework Convention on Climate Change, admitted …
“This is the first time in the history of mankind that we are setting ourselves the task of intentionally, within a defined period of time, to change the economic development model that has been reigning for at least 150 years, since the Industrial Revolution,” she said.
Like, get rid of capitalism.
Holy Cow!! Doug did not have enough on the other thread.
Anyway I am glad for Roy’s historical research on the Boston area. Using severe weather events to manipulate the Public emotioanal state to drive them to endorse all left-wing plans for saving the Earth is bad science and bad news reporting. It is propoganda.
If you take 500 rivers on the Earth as a whole, the probability of a 500 year flood becomes much greater than when you only look at one river. You might have a 500 year flood every year somewhere.
The flaw to the severe weather crowd (I got banned from Skeptical Science for questioning the severe weather dogma) is that they use the whole globe and look for a relatively small region that is having severe weather, blast it on the media and create this perception among the Public that DOOMSDAY is here now and will only get much worse. Somewhere in a small region you probably will have a record broken (especially if you are motivated to use this information for emotional response).
The media made a huge deal about the Texas drought and now the California drought. Historically droughts in both areas have been much much worse (based upon tree-ring data) but that information will not see the light of day in the media frenzy to peddle and idea and pull emotional strings.
Doug will not “have enough” until the world is convinced that the AGW physics is wrong, hopefully before 2027, after which 30 years of warming will start. As I’ll be in my 80’s by then, I may be able to retire and start travelling the world with speaking engagements. Meanwhile, join about 4,400 others who have visited http://climate-change-theory.com since January 8th this year.
Interesting post. I have to agree that the temperature and precipitation trends shown in Figures 2 and 3 indeed look unremarkable. However, the actual trends for the entire period of record for the longest-running station here in Boston paint a different picture:
Temperature – http://www.bluehill.org/climate/anntemp.gif
Precipitation – http://www.bluehill.org/climate/annprec.gif
What counts is the weighted average, it is decreasing based on the Aerican Meteorological Society Reports. Costal areas generally show some increased precipitation, but their impact on the weighted average is negligible.
Fix costal areas to coastal areas
J Williams
I am not sure about the source for you data. I pulled up this article on Boston. They use the same temperature graph you have linked to but they have another precipitation one so it puts the individual composing the graphs in question. What is the source of raw data and how can two graphs show such different trends?
http://www.mass.gov/eea/docs/eea/energy/cca/eea-climate-adaptation-firstpart.pdf
Scroll down to Page 18 of this document for a precipitation graph starting at 1818.
This calls into question the whole idea of graphing trends when it comes to climate and drawing conclusions of what is going on. It seems you can alter trends easily by picking different starting points. We only have a few hundred years of accurate measured data in only a few locations.
To get a true picture of what is going on you might have to trend thousands of years.
Getting excitd by 100 year trend in one location without understanding a fraction of the inputs that effect a location (regional climate would be much more stable with fewer inputs) may be too much emotion.
Norman—Agree 100% with your point regarding: “It seems you can alter trends easily by picking different starting points.” That is the whole reason I made my comment. I think the temperature plot in particular is a perfect example, as Figure 2 in the original post is not really consistent with pretty much any temperature trend I’ve seen published here in Boston.
I also agree about the importance of acknowledging the source of one’s data. You can find out more about the Blue Hills data here:
http://bluehill.org/observatory/2014/02/graphs-of-annual-blue-hill-observatory-climate-data.
On the other hand, the data shown above in Figure 2 have zero documentation, so I have no idea where those come from. Could be Logan Airport, I suppose, but it’s not specified.
Precipitation does admittedly get a bit murky. The plot you reference is two data sets pulled together, and the older data in that plot is from a publication in 1944 that is difficult to access; so I can’t comment on that.
See also this long term temperature record for Northern Ireland where temperatures would closely match sea temperatures.
I was in the Boston area several times during the late 1980s during the winter. There were some 50 degree and 60 degree days. This “must be global warming” was the reaction. At the 2006 climate hearings, many complained about the lack of snow and these mild winters. Basically, as Lovelock said, “nature is playing the same tricks as it always did.”