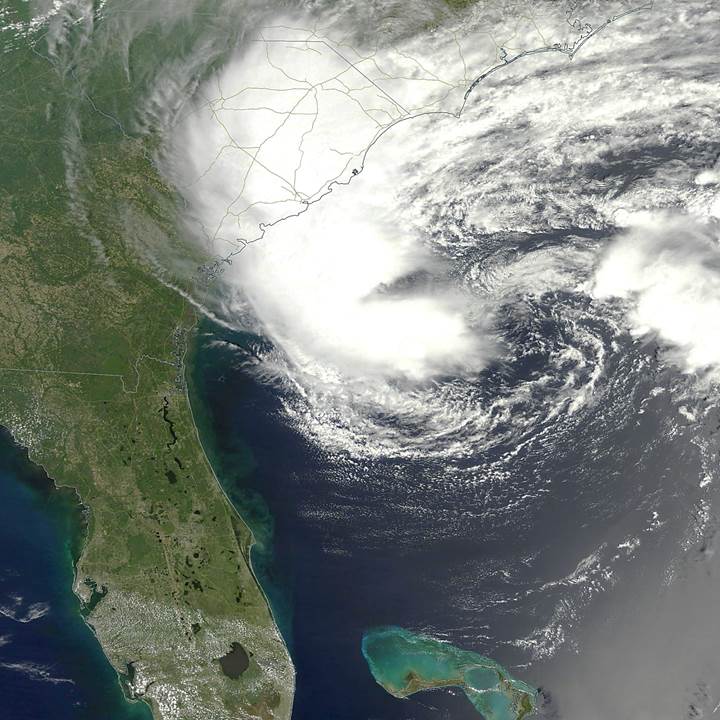
As Subtropical Storm Ana churns off the southeast U.S. coast, the global atmosphere has exceeded 400 ppm carbon dioxide content for the first time in…well…who knows?
And also on tap for this month (May 25th, Memorial Day) is another milestone: 3,500 days since the last time a major hurricane (Cat 3 or stronger) struck the U.S., which was Hurricane Wilma in 2005.
Maybe we can all pause to remember the “good old days”, when hundreds or thousands of people died in major hurricanes. /sarc
You remember 2005, right? Hurricane Katrina? So many hurricanes that the National Hurricane Center ran out of names? The next year, Al Gore blamed it all on humanity’s carbon dioxide emissions in his movie, An Inconvenient Truth.
You might not remember that 2 years ago news reports also were reporting we hit record CO2, at 400 ppm. So why the latest report regarding 400 ppm? Well, because now we’ve exceeded 400 ppm, rather than just hitting 400 ppm.
The minor distinction illustrates an important fact: it takes a huge amount of CO2 emissions to raise the atmospheric CO2 concentration by even a tiny amount.
It took nearly a century to raise atmospheric CO2 concentrations from 3 parts per 10,000 to 4 parts per 10,000. That’s right, nearly a century to add 1 molecule of CO2 to every 10,000 molecules of atmosphere.
Most people aren’t aware that the atmospheric concentration would have gone up twice as fast if not for the fact that nature loves the stuff. No matter how fast we produce it with our cars and planes and power plants, nature sucks up half of it, like a starving dog that has just been fed dinner.
In fact, without CO2 life as we know it on Earth would not exist.
More CO2 has led to global greening. Increased agricultural productivity. It probably has contributed to recent warming, in my professional opinion, but that warming has been relatively benign, with no observable increase in severe weather.
Which brings me back to hurricanes. There is a huge amount of natural variability in global hurricane activity from year to year, and even decade to decade. For example, see Dr. Ryan Maue’s charts here.
This extreme variability would happen with or without humans, just like it happens in tornado activity. Yet, many people tend to anthropomorphize everything that happens in nature. Changes in nature are seen as an extension of changes in human behavior, specifically our use of fossil fuels. It really isn’t much different from medieval witches being blamed for bad things that happened.
Eventually a major hurricane will strike the U.S. again. Maybe it will be this year, maybe next year. No one knows.
But you can be sure that when the current drought in U.S. major hurricane strikes ends, that, too, will be blamed on humans.
Yes, Dr Spencer, the blame humans first crowd is alive and well, and as stupid as every. I guess we can be happy they are not burning women at that stake, yet their stupidity still kills albeit not directly anymore, they are not as quite as bold as they use to be, yet now they kill in stealth mode and they do and can kill millions.
Just a few points. “Superstorm Sandy” was barely a hurricane when it came ashore. Why would you ever “build” a city (New Orleans) that was below sea level? And California is basically a desert. Do people understand these things? Apparently not.
“Superstorm Sandy” hit land at 80mph, which is a Cat 1. It was only a superstorm because its diameter was so large and the damage it made. It’s diameter was so large because of the slow speed. Like an ice skater, in a spin will pull in their arms to spin faster. The damage made was from 50 years of building on the coast. Duh.
Of course uncle sugar helped everyone rebuild on the scenic shores at your expense.
Actually Sandy did so much damage because the windward side struck a very vulnerable area during a high tide. But the nomenclature “super storm” was merely alarmist/media hype. No different than the Weather Channel deciding to name winter storms really.
Sandy killed 128 people in the mid-Atlantic states, and caused tens of billions of dollars in damages. Is that enough to qualify as “super?”
Tell me David A. How many killed and/or how much damage must something do to be classified as “super”?
The earthquake in Haiti killed 10s of 1,000s and nearly wiped out that underdeveloped nations whole economy. Was it a “super earth quake”. If so, why? If not, why not?
The reason the alarmists say “super storm” is because they think that it is SUPER to have something to shrill alarms about.
rah: There is no offical classification of “super” — it’s a product of free speech. Perhaps you should lobby for one.
David A says:
May 9, 2015 at 3:35 PM
“rah: There is no offical classification of “super” — it’s a product of free speech. Perhaps you should lobby for one.”
Yea, it was a product of the press I believe. But I was just asking how many and how much since that is what you implied was the standard for the use of the term. Remember?:
David A says:
May 9, 2015 at 9:51 AM
Sandy killed 128 people in the mid-Atlantic states, and caused tens of billions of dollars in damages. Is that enough to qualify as “super?”
——————————————————–
So we have established that there is no objective standard for the word. But the Merriam-Webster dictionary provides us with with the definitions:
ull Definition of SUPER
1
a : of high grade or quality
b —used as a generalized term of approval
2
: very large or powerful
3
: exhibiting the characteristics of its type to an extreme or excessive degree
Which use applies to “Super storm”?
The 40 deadliest storms of all time killed over 1000 people each. More than half of those happened two or more centuries ago.
“Will Nitschke says:
May 11, 2015 at 4:56 PM
The 40 deadliest storms of all time killed over 1000 people each. More than half of those happened two or more centuries ago.”
Despite the massive build up of sea side habitation in that time. Of course some of the death rate would be off set by modern developments in forecasting. But does anyone really believe that a Galveston type even could happen again today in the US? Katrina was bad but nothing like that! And the death toll from Katrina was to a significant extent due to failure of the Civil authorities to perform both in long term preparation (The Levees)and short term preparation and reaction.
rah, the drainage (levee) system in new orleans was put in place in response to the concerns over flooding from betsy in ’65. So civil authorities actually performed their duties, but obviously did not do them very well. I’ll always wonder if it’s simply a case of hindsight being 20/20 or simply gross neglect in the engineering work (or perhaps both…). Short term preparation seemed to go well. The evacuation was hugely successful due to years of tweaking the evacuation plan. A special needs public evacuation was in place for the elderly and the infirmed. The superdome was also open as a shelter for those who chose to remain behind. It also was highly successful despite the horrid depictions by the media. (yours truly was not only there, but very impressed!) The aftermath was also lauded as much BETTER than expected. This due to the utter resourcefulness of these louisiana folks who never have ceased to amaze this transplant from up north. Most of the casualties came from senior citizens who lacked the stamina to wait the days it sometimes took to be rescued. All in all the city did a fairly good job all around. There is a mentality down here that the government “ain’t yer mama” and if people chose to wait out a cat 3 storm in a home that’s 20 feet below sea level then that was their perogative (and by the way still is today).
fonzarelli,
I disagree. First off the city administration over the years took money ear marked for improving the levees and pumping systems and pumped it into other things despite repeated warnings from concerned citizens and the US Army Corp. of Engineers.
Then they failed miserably in evacuating before the storm. Thus the crowd trapped at the Super Dome with 100s of school buses parked and idle. Geriatrics died in the nursing homes because they were not evacuated.
The National Guard wasn’t activated before the storm nor even positioned to react for recovery operations afterward.
Hell, the Mayor sent his family out of state and was convicted on multiple charges of corruption for his time as Mayor.
And recovery? http://riehlworldview.com/2010/05/now-they-tell-us-postkatrina-nagin-to-blame.html
The death toll and to some extent the destruction was simply much higher than it should have been had the city planned properly and acted responsibly even given the fact that New Orleans is so vulnerable.
RAH, thanx for the reply… There was quite a glut of info in the times-picayune after the storm. I certainly couldn’t ingest everything. Furthermore, i never dreamed that i’d be commenting about it in a blog ten years after! So, i really don’t recall all that much. I do believe that much was sensationalized by the media. As well, one has to wonder how accurately it was reported. I can remember laughing out loud about the ridiculous media accounts of life in the superdome. In fact, i bristle a little bit when you used the words “trapped at the superdome”. It smacks of the sensationalism that pervaded katrina coverage…
Let me start with the public evacuation: there was none! I must have mistakenly implied that there was. There was evacuation for special needs people including nursing homes, but that was it. Remember that katrina came up very quickly and i really don’t know how well that was pulled off. I do recall there being some liability issues with the nursing homes themselves. (I don’t think that involved the city though) For people who chose to ride out the storm, the superdome was given as a shelter of last resort. THAT was the plan. I think it would be erroneous to say the city “failed miserably in evacuating” because there never was an evacuation in the first place. It simply wasn’t in the plan and folks understood that. (again, “the government ain’t yer mama”) Now the private evacuation (automobiles) went exceedingly well. A year before with hurricane ivan it was a disaster. Thankfully we had that miserable dress rehearsal so that when katrina rolled around the modified evacuation plan went off without a hitch…
As far as the national guard goes, i don’t know the full extent of deployment. I do know that they were on hand to greet us at the superdome. The dome was equipped with “meals ready to eat” (MREs) and water from day one. There was also a nursing station. Helicopters were on hand to fly people out if necessary. Immediately after the storm people were being air lifted off of roof tops and brought to the dome. I don’t know the extent of rescue operations by the government. I do know that the estimates of the dead were initially projected to be in the tens of thousands. But this didn’t take into account the grass roots effort by the local citizenry which cut the death toll down to about 1,500…
As far as the accounts of corruption go, i really never read much about that. The drainage system was still a work in progress from betsy until when katrina hit. And remember, on the city side (west of) the industrial canal it was the canal walls that failed not the levees which held up fine. There was some shoddy work done on the walls. Would the lack of corruption have changed that? Who knows. The main problem was the basic design which put the pumps on the back end of the canals. Any breach would empty the entire lake into the city. Now that the pumps are placed at the lake, any breach henceforth will only empty water contained in the canal. The public corruption certainly did not affect the implementation of a bad design like that…
Again, when it comes to katrina coverage, you have to take everything you hear with a grain of salt. (I don’t even know how far off my own little accounting is!) It became very politicized very quickly and we here at the spencer blog know full well how that goes. I would say that from my vantage point things went exceedingly well. Friends who stayed behind here in the french quarter also gave good accounts. So much WAS sensationalized…
One thing i never could understand were accounts of what happened at the state and federal level. Reports seemed so confused. Hard to say where each of the players (president bush and govenor blanco) were coming from. Never really understood the hold up at that level. And again, with the toxic media environ it was really hard to get a clear charitable rendering of what happened. Just like agw, EVERYTHING was sensationalized…
RAH, this is from wikipedia:
Responsibility for the design and construction of the levee system belongs to the united states army corps of engineers; the responsibility of maintenance belongs to the local levee boards. The corps hands components of the system over to the local levee boards upon completion. When katrina struck in 2005, the project was between 60-90% complete. Five investigations (three major and two minor) were conducted by civil engineers and other experts in an attempt to identify the underlying reasons for the failure of the federal flood protection system. All concur that the primary cause of the flooding was inadequate design and construction by the corps of engineers.
David A says:
May 9, 2015 at 9:51 AM
Sandy killed 128 people in the mid-Atlantic states, and caused tens of billions of dollars in damages. Is that enough to qualify as “super?”
NO! That was merely a result of where and when it hit. Would an F2 tornado be a “Super Tornado” if it happened to go down Wall Street or anywhere else in Manhattan during rush hour and do a lot of damage and kill 100 people?
Was the volcano on Montserrat a “Super Volcano” because it resulted in most of the island being evacuated?
I’m hanging out for the first “uber-storm”. We’ll quibble about the definition later
Concerning hurricane Katrina, my professor of sedimentary processes said that New Orleans was a disaster waiting to happen; this course I took in 1975, or thirty years before Katrina.
The facts according to my prof: half of New Orleans is below sea level and the levee that held back Lake Ponchartrain was inadequate to protect the city against a strong hurricane that piled up the waters of Pontchartrain against the inadequate levee.
Thirty years later this happened and that levee was breached, the city was flooded and the alarmists were delighted.
Undoubtedly city leaders were aware of this vulnerability, but they chose to play “hurricane roulette”.
Interesting that hurricane activity has been diminished since then. In my view, any beach house or structure on the strand is “hurricane roulette”.
yes, it was well known they were on borrowed time. Lots of federal money went to upgrade the levees over the years, but it got siphoned off. Go figure.
I live in an area in the Northwest that has a remote Airbase that was used to support NORAD back in the sixties. Well technology advanced and the base was closed but the pulling out air force didn’t take all the transformers and other infrastructure with them. Base became an EPA superfund site in the 90’s and a guy was awarded the contract to clean it up. Well one thing and another and the job didn’t get done. The guy went on the lam (if my memory serves he stole a little over $2 million). Air force sold the base. The base is no longer a superfund site and the mess still isn’t cleaned up! Another project to generate a little cash flow in the area required the Army Corps of Engineers to approve a permit after the state had done so and, of course, they had to “study” on it and they found that Native Americans had a claim because of ancient water rapids near the location (rapids which no longer exist because of the construction of a downstream dam in the 30’s) The county involved had spent a million dollars out of the general fund in preparatory excavation and engineering on the pledge that the Army Corps would approve the project certainly not disapprove it on such specious reasoning.
I submit if we could simply drive the thieves and incompetent clowns out of government we would have no problem balancing the budget.
mpainter, it’s nice to see that you’ve survived “hurricane jan” !!!
I live in the french quarter, so maybe i can be of some help… West of the industrial canal (which separates the main part of the city from the lower ninth ward and N.O. East) saw flooding from breaches in the outflow canals and one breach in the industrial canal itself. The ponchartrain levies held up fine (they ARE massive)… After investigations were completed it was found that there were flaws in the engineering work of those outflow canals. Had the work been properly done it is thought that the outflow canals should have held up as designed. The major flaw in the design itself (as opposed to the shoddy work done on the design) was the placement of the pumps into the canals at the back end of the canals. This would ensure that any breach in the canals would empty the entire lake into the city. NOW, the pumps have been moved to the front end of the canals (where the canals meet the lake). Should there ever be another breach in the canal walls, which would be unlikely because they are now shielded form the storm surge, ONLY the water in the canals will empty into the city. Had this been in place when katrina struck, she would have been just another storm…
East of the industrial canal is another story. It was such a mess in so many ways. My scant understanding of hurricane betsy in 1965 was that these same areas were devastated. It was concern over betsy that began the all the drainage work that failed so miserably during katrina. As far as i’ve been able to learn (and there SO much yet that i haven’t learned) the only real longstanding concern before katrina was the placement of those pumps. They were a well known disaster waiting to happen…
levies should read levees…
Thanks for your info, fonzarelli.
Then the aerial view showed water pouring through a breach in the canal wall, and not the Ponchartrain levee? Interesting. You indicate the breach was due to the storm surge… from Ponchartrain? What a nightmare. Hope you did not suffer too badly, yourself.
In the same course the prof touched on the hydraulic instability of South Louisiana, with the Mississippi aching to change its course through the shorter Atchafalaya River and all the massive hydraulic works that have been erected to control Old Man River and how these have pissed off Ma Nature. Made a deep impression on me, young feller that I was.
Oh yes, reminds me of the song by Asleep at the Wheel : “river rose all day, river rose all night, some people were lost in the flood, some got away alright”. This was the 1927 flood, I believe. Cheers.
Yes, the large breach that got all the attention was that at the 17th street canal which separates orleans from neighboring jefferson parish (county). The storm surge came from the storm’s counter clockwise winds which pushed water from the gulf into the lake and from there into the outflow canals. Nowadays they have large gates at the mouths of the canals which close when the storm surge gets too high…
I, myself, made out o.k. The french quarter being located on the river has some of the highest ground in the city. I was fortunate enough to be back just a couple weeks after the storm. It was like a ghost town; i could walk for blocks through the quarter without seeing a soul. It was not until christmas before people began arriving back in appreciable numbers. Even then, it would be a year or so more before the return of the usual “hustle and bustle”. So, me? Yeah, i made out alright. (but at what a price…)
I had some first hand accounts of the aftermath. Don’t bear repeating. Yep, I know the old city is the high ground. I had some relatives in Metairie. Cheers.
the city was flooded and the alarmists were delighted.
Yes, and they are praying for more.
They want their disaster predictions to come true. Sea Level is perhaps off topic here but a few years ago when sea level dropped, the folks at Colorado University who keep the satellite records referred to it as a “… Pothole on Road to Higher Seas.”
Their glee at every drought flood & violent storm is very poorly disguised.
And the folks in Colorado were right, weren’t they?
Nope. Those folks are perennially wrong. Sea level data from stable coasts show no increase in SL. Go read the fine print at their website. Their “sea level” is not a direct measurement but an “estimate” (their word) based on Jason, tidal gauges, and theoretical ocean volume adjustments. We are talking about the U of Colorado, right? I regard that place as exhibit A of fabricated pseudoscience.
Meaning their sea level crowd, the ones who propagate fake SL rise.
False — sea level rise picked up again after the 2011 pothole. The scientists were right again:
http://sealevel.colorado.edu/
Note the black and yellow caveat immediately above the sl chart that warns that the plot is not actual measurements. Note the words estimate, revised, models. These are legal caveats meant to relieve the U of Colorado of tort liabilities. David A is well fooled, however. Fine print is fine with him.
For reliable SL data, see NOAA Mean Sea Level Trends for any stable coast, this data from scores of tidal gauges.
David A said at 9:50 AM
And the folks in Colorado were right, weren’t they?
?????????????
Were they right to use the term “Pothole” on the way to disaster, in this case higher seas?
Only if they were in a hurry to get to said disaster. Otherwise I would have used a term with a different flavor, like remission, reprieve, or perhaps a lull. That they are cheerleaders for ever faster sea level rise just simply can’t be denied.
How about if you use the words you like, and they use the words they like? Because it was indeed a pothole; here’s the data:
http://sealevel.colorado.edu/
People anthropomorphize many things so as to have a feeling of power that they can change it or a feeling of hopelessness so they can be a victim.
It’s at the point the formation of a sub tropical storm is headline news pushed by the media as proof of global warming.
CO 2 is a trace gas in the atmosphere and insignificant by definition.It is a poor absorb-er of IR from sunlight. Water vapour is seven times better., molecule for molecule, and has 80 times as many molecules making 560 times the air heating effect.But carbon is reponsible for 80% of our energy. Control and taxing carbon will give the elected class more power than anything since the Magna Carta.
Ozone is also a “trace gas” in the atmosphere — its maximum concentration is at about 20 km in altitude, where its concentration is 5 ppmv, 80 times less than CO2.
But without this 5 ppm ozone, we’d all be dead.
The dose makes the poison.
In fact, atmospheric CO2 is entirely beneficial, being the most basic compound of life (in combination with water, another “deadly” greenhouse gas) and the very foundation of the food chain, beneficial for all forms of life, even polar bears, and the more the better.
CO2 is a heat-trapping gas. That warms the planet, and the change in temperatures and the hydrological cycle affects ecosystems and species. It’s a question of whether species can adapt to the high rate of changes. Calling it “entirely beneficial” is simplistic.
Fright impairs the ability to reason, so calm yourself. You must not succumb to the climate hysteria.
Now who is being simplistic? Those who demonize CO2 and depict it as a poison, or those who point out that CO2 is the fundamental basis of life? It can’t be both.
There are sound reasons for concluding that the CO2 alarms are baseless, these reasons founded in solid science.
You say “high rate of changes”. I see no reasons for alarm and I can tell you that my view is well founded in the life sciences. In fact the warming of the past century is not unusual nor threatening.
The real scythe of death is cooling. The threat to life on earth is not warming but the approach of another ice age. This is coming, as the temperature record of the Holocene shows (as per d18O, the only proxy shown to be temperature related).
Do you prefer cooling? Because the temperature indices are never show stasis, but warming or cooling (MWP, LIA, for example).
No one calls CO2 a “poison.” Claiming so is a lie.
“In fact the warming of the past century is not unusual…”
In fact, our current rate of warming is about 30 times faster than when the last ice age ended.
… and yet no faster than it was a century ago.
Uh David? Don’t look now, but we are now and all homo sapiens always have lived in an “ice age”. We live in the Holocene Epoc, which is an interglacial span of time in the Quaternary Period. A period characterized by cycles of glacial advance and retreat but always with permanent ice packs at each pole which continues to this day.
If the warmist predictions ever come true and the permanent ice packs found in both the Arctic and Antarctic circles substantially melt away then the current Ice Age will have ended.
A lie? Getting a little red in the eye, David A?
Many have depicted CO2 as a poison (a toxin is a poison). The EPA, on the principle that the dose makes the poison, has instituted alarmism in the government via CO2 regulations. (Small doses okay, big doses a no-no). Obama agrees that the dose makes the poison. Many others adhere to that view: a claque of noisy alarmists, the poor, frightened dimwits.
Do you now deny that the dose makes the poison? A fellow named David Appell put the same on his blog, Quark Soup, recently. What did he mean by “the dose makes the poison. It’s not the amount of something you have, it’s its [sic] effect that kills you”
Regarding the recent warming vs the start of the Holocene, you have it backwards. Ice core data shows an extradinarily abrupt warming of 6-10 ° C, this “within a few decades” according to researchers. Can’t get any better resolution in ice data.
Stay away from that alarmist trash if you don’t wish to look foolish. Better to read comic books and
Think Happy Thoughts.
BTW, as far as we know: “Late Carboniferous to Early Permian time(315 mya – 270 mya)is the only time period in the last 600 million years when both atmospheric CO2 and temperatures were as low as they are today (Quaternary Period)”
http://wattsupwiththat.files.wordpress.com/2015/05/clip_image002_thumb3.jpg?w=593&h=404
mpainter:
I would agree with all of your assessment of David A’s flawed reasoning, except for your addition of “[sic]” to the statement, “It’s not the amount of something you have, it’s its [sic] effect that kills you”. This seems to imply that there is something wrong with “it’s its”. However, the usage is entirely correct, as the abbreviation of “it is” is followed by the possessive pronoun “its”, which relates to “effect”.
Unfortunately, Dr. Spencer also gets “it’s” and “its” mixed up from time to time. Otherwise, he gets everything else right — meaning climatology of course.
Walrus, thanks for your comment. You are right that the usage is not ungrammatical; my purpose was to signify that I correctly quoted, lest the reader assume some clumsy tautology on my part.
“CO2…That warms the planet, and the change in temperatures and the hydrological cycle affects ecosystems and species.”
Can you please be more specific, measurable, accountable in your claims? (I assume the science is settled)
1) What change in temperatures (in North America) will we see in next 20 years due to increase CO2 in the atmosphere?
2) Please describe the changes to North America hydrological cycles will occur in next 20 years directly as a result of too much CO2 in the atmosphere?
3) Can you please describe more specifically the high rate of changes and the species most impacted next 20 years (in North America) – as a result of too much CO2?
Being vague is not helpful. Sounds like emotive alarmism.
mpainter:
I much appreciate your posts. It is refreshing to read concise and well written commentary. This applies equally to Dr. Spencer’s manifold contributions on sundry climatic questions since more or less the beginning of the Ice Age.
Bit by bit, such commentary helps to set the record straight… and it really does need much straightening after what the alarmists have done in recent years.
— The Great Walrus
(having no problem whatsoever with the piles of nice ice up here at 80 North)
Great Walrus
Thanks heaps for the kind words. Give my regards to everyone at the next haul-out.
David A claimed:
“In fact, our current rate of warming is about 30 times faster than when the last ice age ended.”
Last I checked we still face Ice Age conditions and the permafrost that used to bear what many consider tropical vegetation and large animal life forms remains in place. Of course for gullible children in the suburbs, devoted climate alarmists perhaps seeking cash from climate chaso and some others your comments might pass as revelatory.
Have a great day!
Just curious. How much CO2 is emitted everyday from carbonated beverages world wide, or how many cans of Pepsi does it take to equal a gallon of gas from a CO2 emissions stand point?
Somebody had to get funding for a study like this, no?
This guy estimated it to be one thousanth of one percent of U.S. CO2 emissions are from carbonated drinks:
http://www.scottblogs.com/sodas-contribution-to-global-warming/
So, to translate one thousanth of one percent …
one thousandth = .001 1 percent = .01
so .001 X .01 = .000001 a small number.
That’s my 2 ¢ !
Thanks doc
After reading his write up, I agree with him. He really doesn’t know.
After doing some due diligence research, I really don’t know either. There is very little out there in the way of studies on said subject. Most only focus on soda and health impacts.
I see a golden opportunity to end this knowledge deficit.
If we can only get some funding for the study of the impact of carbonated beverages on Global Warming, we could make history. There could be a whole industry out there for CO2 sequestration via carbonated beverage to boot. Just don’t open that container.
Bloomberg may have been unknowingly on to something after all 🙂
Yes, but — isn’t the CO2 used in carbonated drinks extracted from the atmosphere?
Where does the CO2 that’s put into the cans come from?
From the breath of the alarmists… and polar bears.
Commercial CO2 often comes from the emissions of burning natural gas. So that CO2 would have ended up in the atmosphere anyway.
That is entirely illogical. We burn fossil fuels when we need energy, or some by-product of the reaction. There isn’t some guy hanging around saying “well, we’re not going to bottle any Fresca today, so let me go outside and burn some natural gas for haha’s …..”
While there have been no major storms in the US, that doesn’t mean there haven’t been any major storms in 3,500 days. Just ask the people in The Philippines. Don’t take that to mean I believe in the religion of Global Warming…er…Climate Change or that humans play a major role in it. I am only pointing out that major storms still occur despite what the headlines reads.
Sooo…how much CO does a square foot of grass turf consume? If we in California tear up all of our grass because it consumes “scarce” water resources, will the CO level rise dramatically and require us to hold our breath for 10 seconds every minute to reduce CO emissions? Also how much temperature rise will that cause (tearing out the turf) from the loss of reduction of cooling through photosynthesis that the grass contributed? The facts are out there, it’s just that masses don’t want to know those pesky facts if they don’t support the political agenda…Don’t worry though, Jerry Brown will take care of us.
It’s CO2, not “CO.” And breathing is carbon neutral.
We were told the quantity and intensity of hurricanes would increase. LIES. We were told the ice caps would be gone by now, they are not. LIES. We were told temps would continue to rise and yet for the past 18 years, no rise. One giant lie after another just to gain control over us, our money and world power.
Nope. GISS shows +0.16 C of surface warming in the last 18 years.
And ocean warming…..
Oceans stopped warming ten years ago.
CO2 does not warm oceans; increased insolation was the cause of that and likewise of the late warming trend ending in 1997, or if you like, 2002. Relax, comfort yourself; global warming is over.
No, the ocean certainly did not stop warming 10 years ago:
http://www.nodc.noaa.gov/OC5/3M_HEAT_CONTENT/
Wrong DAVID the ocean has stopped warming.
https://bobtisdale.files.wordpress.com/2013/03/30-ukmo-ohc-0-2000m-v-models-to-750m.png
Notice the drop off in ocean heat content 2008-2010 corresponding to the solar lull.
As for Argo data, it first showed cooling in the oceans. The alarmists were alarmed: Tsk, Tsk, cooling?..can’t be.. fiddle, fiddle, there, fixed.
And now it shows warming, see how it warms?
It is all explained at the NOAA website, how the fellow who was in charge if the Argo had his eyes opened for him.
SST warming stopped ten years (at least) ago. So how does the heat get to the deep ocean without being detected at the surface? (No atmospheric warming, no SST warming)
No one tries to explain that.
But, see fiddle, fiddle above. The alarmists are suckers for it all. You must control your fright.
“As for Argo data, it first showed cooling in the oceans.”
That was before an error was found in the data model.
Do you prefer they publish data which is knowingly wrong?
Nor did SST warming stop 10 years ago. In fact, HadSST set a record in 2014. The last 10 years of HadSST monthly anomalies are +0.07 C warmer than the previous 10 years.
So far, every claim you’ve made about the data has been wrong.
Actually, global SST has been flat since ’97. The spikes are El Ninos, these due to insolation, not CO2. Argo data is politically correct; otherwise it should be disregarded as unreliable. You cannot show a trend of rising SST for 97-present. Fool yourself but no one else.
I should correct myself. I only regard the submerged data from Argo, in particular the temperature data, as questionable.
GISS. That made me laugh
IPCC, AR5 (2013), WG1, Chapter 2, p. 194:
“Regardless, all global combined LSAT and SST data sets exhibit a statistically non-significant warming trend over 1998–2012 (0.042°C ± 0.093°C per decade (HadCRUT4); 0.037°C ± 0.085°C per decade (NCDC MLOST); 0.069°C ± 0.082°C per decade (GISS)).
http://ipcc.wikia.com/wiki/152.4.3_Global_Combined_Land_and_Sea_Surface_Temperature
Speaking for myself, I cannot give serious regard to a warming trend (so called) that has a margin of error of over twice the trend magnitude, which margin of error allows the possibility of a cooling trend of the same magnitude.
Others use such dubious figures to trumpet alarms. One can only wonder at them.
I thought I read in the IPCC reports that hurricanes in the Atlantic region would decrease in number but perhaps increase in intensity when they did form. Isn’t this what is happening? And doesn’t the protracted El Nino we are experiencing reduce hurricane formation in the Atlantic as well?
Flying Cactus says:
May 9, 2015 at 9:55 AM
I thought I read in the IPCC reports that hurricanes in the Atlantic region would decrease in number but perhaps increase in intensity when they did form. Isn’t this what is happening?
Yes they have said that. The fact is though that both frequency and intensity are trending down: http://www.aoml.noaa.gov/hrd/Landsea/downward/index.html
“Downward trends in the frequency of intense Atlantic hurricanes during the past five decades
5 Conclusions
In summary, contrary to many expectations that globally tropical cyclones may be becoming more frequent and/or more intense due to increasing concentrations of greenhouse gases, regionally the Atlantic basin has in recent decades seen a significant trend of fewer intense hurricanes and weaker cyclones overall. In addition, the maximum intensity reached in each year has shown no appreciable change. These trends have been accentuated in recent hurricane seasons – 1991 to 1994 – with the lowest frequencies recorded of tropical storms, hurricanes, and intense hurricanes in the 50 year period of accurate counts. These decreases have primarily been manifested in the deep tropical latitudes (i.e. equatorward of 25°N excluding all of the Gulf of Mexico) and the countries surrounding the Caribbean Sea have particularly benefited as five years with no hurricanes in the region is the longest hurricane-free span since the turn of the century.
However, 1995 has, at least temporarily, heralded the return of Atlantic basin hurricanes. Most of the regional and global factors which previous research has shown to be related to active Atlantic hurricane seasons were present during 1995. It is possible that this sharp increase of activity was a consequence of an increase in the strength of the oceanic thermohaline circulation. It will likely take several more years before it can be established whether 1995 was simply a single year anomaly in continued quiet conditions or whether it was the beginning of a regime of active hurricane seasons.”
http://www.wunderground.com/education/webster.asp
Dear Dr. Spencer,
Hurricane Dean and Felix of 2007 were both Cat 5 storms when they landed on the Yucatan peninsula of Mexico after doing damage in the U.S. Virgin Islands. Both storms affected North America and by their proximal hits should be mentioned if not considered. I am afraid that your failure to mention these 2007 Cat 5 storms goes a long way to nullifying your article title or at least making it sound a bit shrill and specious.
His article specifically addresses the United States. Your attempt to include another region into the mix (fraudulently) invalidates your complaint.
Hurricane Sandy?? October 2012? Jesus, you people never cease to amaze me with your complete lack of critical thinking skills.
really, Wenfen? And what category was Sandy at landfall? Can you educate the rest of us?
The damage done by Sandy, aided by its size, shows that a hurricane’s category isn’t the only measure by which they should be judged.
Yes, when circumstances are unfavorable, such as a spring tide, a densely populated area, and a conurbation at landfall, damage can be great even with a weak hurricane, much to the delight of the alarmists. So what?
Want to see what a really bad storm can do? See Galveston hurricane, 1906. Or Caribbean hurricane, 1780. More recently, Carla, which wiped out Port O’Conner in 1961, a category 5 hurricane with gusts up to 175 mph. Hand-wringing over the weak ones looks silly.
Correction, Carla was rated category 4 at landfall.
“Hand-wringing over the weak ones looks silly.”
Hurricane Sandy killed 43 people in New Jersey, 14 in Pennsylvania and 71 in New York State.
Calling it “silly” disrespects the human and financial carnage.
Control yourself; Sandy was a category 1 hurricane which only proves how vulnerability to hurricanes has increased because of population growth.
You are exhibit A for alarmism: wolf wolf wolf you shrill. Very tiresome.
“Sandy was a category 1 hurricane which only proves how vulnerability to hurricanes has increased because of population growth.”
1960’s Hurricane Donna killed 16 people in NY, NJ and PA.
Was the 1960 population only 16/128ths of 2012’s population?
(Answer: no.)
Sandy is the pride and joy of the alarmists, their consolation in a decade of fewer hurricanes. Such nice people.
What’s jesus got to do with it?
The problems associated with the building of New Orleans on the soft sediments of a downwardly compacting river delta have been compounded by up-river damming that has halted the replenishment of delta sediments. Hurricane Katrina’s legacy has already been forgotten and bad engineering has been absolved with the arrival of a more convenient scapegoat – AGW, no less.
When I was about 8 or 9 years old, I am 55 now, I was delivering newspapers in NYC when we got hit by a monster hurricane. Yes, nyc does get hit by hurricanes on occasion. Nobody said anything about global warming. You see, things happen because mother nature is random. I also recall a monster snow storm in the 1960s which closed NYC for a week. Nobody said anything about global warming because people knew, snow storms do happen. Now the liberals want to blame odd weather on man made global warming. MORONS
I’m giving an outside voice here to people who more than likely don’t care, but I must ask, what if global warming doesn’t exist? If all those scientists vouching for global warmings existence are wrong, we lose absolutely nothing. What we will gain though is independence from the middle east and their oil. No longer feeding the proxy wars that occur there. The middle east will revert back to having the same relevance as Africa, which isn’t much. We have little to lose and so much to gain through innovations that are gained from preparing for the speculated warming of the earth.
Wrong Dean Kaufman – we will lose freedom because even though the scientist might in fact be wrong, the UN and the liberal dictators will still use it as a tool to control us.
HOW will these supposed liberal dictators “control” us? Me thinks you listen to Glenn Beck way too much, that arbiter of paranoid delusions.
Really? Are you trying to claim that the UN does not have a gun control agenda?
Dean, I’m pleased you are adding your voice to the millions calling for eliminating government restrictions on energy production in the US. The Keystone Pipeline, fracking, offshore oil drilling are all important ways to help reduce America’s dependence on foreign oil, and I’m glad you’re with us on those issues.
Well played, John. I hope he is on board with us for all those things because we can’t power this country on wind and solar, now, or anytime in the near future.
America wouldn’t get first dibs on (foreign) Keystone oil. It would be sold on the world market, and we’d only get it if we paid that market’s price.
The Keystone would have a moderating effect on oil prices. It is simple enough to see: the pipeline moves the crude to the buyer more efficiently, the exploitation of those tremendous reserves (est. at upwards one trillion BBl of oil in place) is thereby given an impetus and supply is increased (presently transport costs of Athabasca crude is high and considerably reduces profits).Please try not to get alarmed.
At its peak Keystone XL could deliver 830,000 b/d, 0.9% of current world production, sold on the world market. The market, of course, already factors in costs of transportation to where it would be delivered.
How little you understand. That much crude would send prices into another tailspin, if offered in the market. The US refiners gets dibs on the Keystone crude because of proximity- again transport costs determine this. Crude prices do _not_ include transport costs. I know this business. Crude price quotes are at the point of loading.
I have to agree. Coming up with innovations that remove fossil fuels from the energy cycle is good–regardless of the reasons. A gigantic economic boost is ahead if we embrace renewable resources. And isn’t that what we want? A vibrant economy? Everyone with a job? Eliminate poverty? Improve education? If we can do that in the US, then we may be able to it effectively help those in other countries as well. Education, food, and off-the-grid energy is a way to end war and poverty. I am for that!
“Giant economic boost” for who?
“Over 3 Times More Green Jobs Per $1 Invested Than Fossil Fuel Or Nuclear Jobs,” Clean Ars Technica 3/20/13
http://cleantechnica.com/2013/03/20/over-3-times-more-green-jobs-per-million-than-fossil-fuel-or-nuclear-jobs/
“Across a broad range of scenarios, the renewable energy sector generates more jobs per average megawatt of power installed, and per unit of energy produced, than the fossil fuel-based energy sector,” the report concludes. “All states of the Union stand to gain in terms of net employment from the implementation of a portfolio of clean energy policies at the federal level.”
http://www.berkeley.edu/news/media/releases/2004/04/13_kamm.shtml
Yeah, more proof that “renewable” energy is inefficient, compared to alternatives. But nobody with any business sense believes that hype. Tell it at RealClimate™.
It’s call Appell-onomics. If decrease efficiency we can increase employment. I.e., cut everyone’s wages in half and we can employ twice as many people!
It’s possible that ” they ” have got some control of the weather with HAARP or some other process to control large atmospheric conditions. There was last year ( 2014 ) a less violent tornado “season” also. But no help for Asia.
Dean, it is completely ABSURD! that “fighting global warming” is going to get us off Middle Eastern oil. There is not even a slowing down of use of oil in the world. Currently, there is not even the slight hope for a technology to get us off of oil.
Perhaps there is — per capita global oil production peaked in 2005.
As has been pointed out, a key ingredient for producing tropical storms is the equator-to-polar temperature gradient. It provides the thermodynamic driving force to create and move the major hot vortices we call hurricanes. In the 20th century warming (and in the climate models) this gradient decreased since the poles warmed and the equator basically not at all. So perhaps we should not be surprised that the general drift of hurricane activity over the last 20 years or so has been down.
There are other factors in hurricane production such as the water vapor cycle but energy is critical.
As has been pointed out, a key ingredient needed to produce tropical storms is the equator-to-polar temperature gradient. It provides the thermodynamic driving force to create and move northward the major hot vortices we call hurricanes. In the 20th century warming (and in the climate models) this gradient decreased since the poles warmed and the equatorial regions basically not at all. So perhaps we should not be surprised that the general drift of hurricane activity over the last 20 years or so has been down.
There are other factors in hurricane production such as the water vapor cycle but energy is critical.
Amazing.
Dr. Roy, you have a Ph.D. in meteorology, yet you cannot predict the weather:
“Eventually a major hurricane will strike the U.S. again. Maybe it will be this year, maybe next year. No one knows.”
Your academic training provided little in the field of quantum physics, but you are absolutely certain your IR thermometer is “proof” of the IPCC CO2/GHE nonsense.
Amazing.
Most of the public wants to know today’s and tomorrows weather. There is little skill beyond 5-10 days. But that skill is of major utility. So, to infer from my statement that I can’t predict weather seems a bit of a stretch.
And, regarding the IR thermometer, it is indeed proof that downwelling infrared sky radiation warms an upward viewing surface. That’s exactly what an IR thermometer measures!
http://www.drroyspencer.com/2013/05/imaging-the-greenhouse-effect-with-a-flir-i7-thermal-imager/
An IR thermometer is DESIGNED for that purpose, duh!
Let us know when you can bake a turkey in a freezer filled with ice.
Why bitterly cling to the failed IPCC science?
It’s not IPCC science.
GHG properties have been known of for ~150 years and are empirical science. Not up for argument.
Next time you have a covering of frost on your car at marginal temps, note what happens when a patch of cloud comes over. It melts because of GHG back radiation (in this cse from WV in the cloud).
Same thing happens from CO2, but is unnoticed as the CO2 is well-mixed and invisible.
And yes, I’ve observed it countless times (ground temps rising due back-radiated IR) when working as an on-the-bench meteorologist. Even from ice cloud at 6 miles high and at ~ -30C.
Being a sceptic is fine but (sorry) “denying” basic, well understood science is quite another.
1) The GHE “science” was largely dismissed back when Arrhenius first imagined it. But it has been taught in “soft” sciences, like meteorology and geology, since then. The Arrhenius GHE formula has been debunked numerous times.
2) NO, it is not “empirical science”. You have been grossly misled. The last 20 years of “empirical science” should shove that notion right up Al Gore’s …
3) False, bogus, bad “science” is ALWAYS up for argument.
4) “Next time you have a covering of frost on your car at marginal temps, note what happens when a patch of cloud comes over. It melts because of GHG back radiation.”
########
What is the temp of your cloud? Are you saying a warmer surface can warm a cooler surface (ice)? GHE “science” preaches that a cooler surface can warm a warmer surface. If you believe in GHE, then your windshield ice should be evaporating the cloud.
3,500 days since the last major storm? So, what was Hurricane Sandy?? I’m no math genius, but I’m certain that the end of October 2012 through today’s date is well under 3500 days. In fact it is under a 1000 days. Based on this error alone, everything else you say must be bullshit. Dumbass.
Read well: “3,500 days since the last time a major hurricane (Cat 3 or stronger) struck the U.S., which was Hurricane Wilma in 2005.”
Your insult is well noticed, though.
Who’s the dumbass here?
Gross ignorance is the greatest boon to the alarmist camp. Case in point in typical.
Thanks, Dr. Spencer.
Yes, Dr. Ryan Maue’s ACE history is a fantastic graph.
ACE is not a very good measure of hurricanes, since it does not include the size of a storm. Hence it likely misses a lot of energy.
In other words, a bird flying at 30 mph has the same ACE as a loaded tractor-trailer moving at the same speed.
Is it an African or European bird? And is it carrying a coconut?
BruceC. That’s silly, a swallow can’t possibly carry a coconut.
Alarmists – I fart in your general direction. Good use of excess methane.
Dr. Roy’s point is well-taken but you must mention Sandy, barely a hurricane but awfully
destructive due to some peculiar circumstances. It doesn’t have to be category 3 to be a killer.
I’m sorry, Doctor, but the thesis of this particular post is a contrivance at best. Trying to make a point about the connection, or lack thereof, between global warming and severe weather, while limiting the globe to about 1.9% of the Earth’s surface and severe weather to hurricanes of Cat 3 or stronger, is valueless.
Sorry Spalding, my reply was meant for the original post. A bit of operator error.
North Atlantic Tropical Storms and Majjor Hurricanes, 1970-2011:
http://policlimate.com/tropical/north_atlantic_hurricane.png
That’s a nicely choosen image, since 1971 marked the start of a below normal hurricane era.
“All of the Atlantic hurricane seasons since 1995 have been above normal, with the exception of two moderate to strong El Nino years (1997 and 2002). This contrasts sharply with the 1971-1994 period of generally below-normal activity (Goldenberg et al., Science, 2001).”
http://www.cpc.ncep.noaa.gov/products/outlooks/hurricane2006/May/hurricane.shtml
http://www.cpc.ncep.noaa.gov/products/outlooks/hurricane2006/May/figure4.gif
Here are more current numbers for the north atlantic basin:
North Atlantic Basin – Number Tropical Storms And Hurricanes 1950-2014:
http://www1.ncdc.noaa.gov/pub/data/cmb/images/hurricane/2014/annual/NAT_storms_2014.png
North Atlantic ACE Index 1950-2014:
http://www1.ncdc.noaa.gov/pub/data/cmb/images/hurricane/2014/annual/NAT_ace_2014.png
And for the sake of completeness here the numbers for the eastern pacific basin:
Eastern Pacific Basin – Number Of Tropical Storms And Hurricanes 1970-2014:
http://www1.ncdc.noaa.gov/pub/data/cmb/images/hurricane/2014/annual/EPAC_storms_2014.png
East North Pacific ACE Index 1970-2014:
http://www1.ncdc.noaa.gov/pub/data/cmb/images/hurricane/2014/annual/EPAC_ace_2014.png
It was “chosen” by Ryan Maue, not me. He’s a noted skeptic.
I’m sorry, Doctor, but the thesis of this particular post is a contrivance at best. Trying to make a point about the connection, or lack thereof, between global warming and severe weather, while limiting the globe to about 1.9% of the Earth’s surface and severe weather to hurricanes of Cat 3 or stronger, is valueless.
So we should be alarmists, then? No thanks.
The problem with fright is that it handicaps the brain. For example, Sandy was a weak category one hurricane, but the alarmists put up a chorus of wails over Sandy. You wring your hands over global warming which is nonexistent.
Tidal gauges on stable coasts show a flat sea level trend and you bleat about rising sea levels.
You do all of this and when someone says that it is not as bad as the alarmists claim, you say “contrivance”. It is your fright that operates alarmism, not balanced judgement.
Why do use the blog name “slipstick”?
As in your “1.9% of the earth’s surface”.
Slipstick says:
May 8, 2015 at 9:46 PM
“I’m sorry, Doctor……[snip].
The fact is that the reason why the US has gone so long without a strike from a major hurricane (CAT III or higher) is because Atlantic hurricane incidence has been running at or near historic lows. That is the the exact opposite of what many Alarmists have predicted would happen. And THAT is the point. Get it?
BTW Joe Bastardi at Weatherbell.com predicted this very storm would happen in last weeks Saturday Summary. Joe has been on a role predicting the formation and tracks of Atlantic tropical storms that threaten the US for some time. His forecast for the formation, intensity of and track for Hurricane Arther last year could not have been more accurate. He has maintained since late this winter that the greatest threat for a hurricane strike on the US this year will come from storms that form close in to the Atlantic or Gulf shores.
Government should issue and post:
NOTICE – Any construction near the coast is in danger of storm damage and flooding. Tax payers will not pay for rebuilding.
Unfortunately, taxpayers are still subsidizing flood insurance:
http://www.forbes.com/sites/realspin/2014/03/25/washington-is-encouraging-the-next-hurricane-sandy-by-creating-new-subsidies-for-flood-insurance/
I imagine this early tropical storm will be blamed on anthropogenic global warming, if it hasn’t already.
Maybe it’s very late.
The point has been raised in this thread, if we spend a huge amount of resources to tackle the forecasted global warming by switching to renewable energy, and if the forecast eventually proves to have been wrong, then we have nothing to lose.
We would have created many new jobs in the process and freed ourselves from a reliance upon limited quantities of fossil fuels which would have gradually become scarcer and more expensive had we not moved towards solar power and other renewables.
It’s an argument that has some merit, but which is also fundamentally flawed, as I see it, because people are not asking the right questions and assessing the risks in a rational manner.
For example, which of the following scenarios is more certain?
(1) That regions of the planet that have in the recent past experienced extreme weather events on a fairly regular basis, such as cyclones, floods and droughts, will continue to experience such extreme weather events of approximately similar but varying magnitude and varying interludes.
(2) Or, that such extreme weather events will become significantly more extreme and/or more frequent as the climate warms due to CO2 emissions?
I would suggest that the former scenario is far more certain, and that the latest IPCC report would seem to agree, in the sense that their summary declares a ‘low confidence’ in predictions that extreme weather events are becoming more severe and/or more frequent.
Now let’s consider the following outcomes if we invest trillions of dollars in attempting to use CO2 levels as a sort of control knob, in order to prevent the increasing severity of climate disasters.
(1) Let’s consider what some folks might claim is the best scenario. After a miraculous degree of cooperation between nations on a global level, and after an expenditure of several hundred trillions of dollars over a 30 to 40 year period, building renewable-style power stations, we find that extreme weather events, on balance, have not got worse and that the climate seems to have stabilised in its usual pattern of weather variability.
The politicians congratulate their fathers and grandfathers for having had the fortitude to push through the necessary CO2-reducing methods, and the AGW alarmists continue to assert that they were right all along because, after CO2 levels have been reduced, or at least stabilised, the extreme weather events are now no more terrifying than they were in the past.
Perhaps they will quote death-rate statistics to justify that the expenditure of hundreds of trillions of dollars had been worth it, because during the period between 2020 and 2060, no greater number of people have died or suffered injury during droughts, floods and hurricanes, than died during the previous 40 year period between 1980 and 2020.
(2) Now supposing that the same amount of money (ie. energy) had been spent in protecting people
against ‘natural’ extreme weather events, by building dykes and levees around low-lying areas subject to flooding; by building dams and long-distance water pipes in areas subject to droughts; and by strengthening buildings and homes in areas subject to cyclones and hurricanes etc.
Is it not very likely that deaths due to extreme weather events during that 40 year period, between 2020 and 2060 would be significantly less than the previous 40-year period?
Now, I admit it is conceivable that deaths might still be the same in the event that extreme weather events have become worse, either as a result of continuing rises in CO2 levels or as a result of unpredicted natural causes, but for that to happen, the increase in storm severity would have to very significant.
If a town has been demolished by a category 4 cyclone, and needs rebuilding using more stringent building codes, then it is only sensible to rebuild to a standard which will resist category 5 cyclones, especially if there are meterological records of category 5 cyclones occuring in the general region in the past.
Likewise, if there are meteorological records indicating the flood heights of previous floods in an area, it would be only sensible to ensure one’s house was raised above the maximum height of the worst flood that had been recorded at the location.
If the worst flood had occurred say 100 years ago, as is the case in the city of Rockhampton, near Brisbane, Australia, then one might want to ensure that one’s home is constructed above that level by a reasonable margin of a metre or two, to allow for the possibility that the next ‘one-in-a-hundred-year’ flood might be even worse.
In other words, we do have something to lose if we attempt to fix uncertain problems at the expense of fixing more certain problems.
We can’t spend the same energy twice, and we can’t do anything without energy.
At a practical level, the sorts of choices that have to be made are:
(1) Build new solar and windmill farms with a sufficient output to replace the current coal-fired power station supplying a near-by town.
(2) Or, use the same amount of money to protect that near-by town into the future, from a repitition of the effects of previous, known weather disasters.
(3) Or, do both, spending twice the amount of money, cutting everyone’s salary in half to pay for it.
I think the third option would be admirable, but the Automobile, TV, Electronics and Fashion industries might not be too keen on that idea, as well as the consumers.
At the same time, we should all know that we ‘can’t have our cake and eat it’.
Hello Dr Spencer,
I came across the article about clouds being responsible for the observed global warming. I thought it might be of interest to you.
http://www.scirp.org/journal/PaperInformation.aspx?PaperID=50837#.VU9MPtqqqko
Late Twentieth-Century Warming and Variations in Cloud Cover, John Maclean in atmospheric and climate sciences.
Regards Rob
Rob,
A very interesting paper. If McLean is right, then AGW is belly-up. Use this on the alarmists and see their screeches turn to howls. Great fun.
The radiative forcing of CO2 is a settled scientific fact. Whatever other science might develop in the mext 30 billion years, that won’t change.
“First Direct Observation of Carbon Dioxide’s Increasing Greenhouse Effect at the Earth’s Surface,” Berkeley Lab, 2/25/15
http://newscenter.lbl.gov/2015/02/25/co2-greenhouse-effect-increase/
“Observational determination of surface radiative forcing by CO2 from 2000 to 2010,” D. R. Feldman et al, Nature 519, 339–343 (19 March 2015)
http://www.nature.com/nature/journal/v519/n7543/full/nature14240.html
The radiative properties of CO2 are not in dispute. The effect of these properties on temperatures (the global temperature anomaly) is very much an open question, despite the insistence of those like yourself that the “science is settled”. Such a phrase reveals a rigid mindset, not a spirit of scientific inquiry.
Like your use of the word “forcing”, as if this were a settled fact. But the truth is that there is no evidence, circular arguments notwithstanding, of such “forcing” in the atmosphere.
The AGW hypothesis lacks any support, all observations being contrary to the hypothesis.
The AGW proponents seem to grasp this truth at some fundamental level in themselves, hence their hyper alarmism is the constant companion of their dubious science.
No scientists I know say “the science is settled” — it’s not their mindset. They say it’s settled *enough*.
“Climate science is settled *enough*” Raymond Pierrehumbert, Slate 10/1/14.
http://www.slate.com/articles/health_and_science/science/2014/10/the_wall_street_journal_and_steve_koonin_the_new_face_of_climate_change.html
You wrote:
“But the truth is that there is no evidence, circular arguments notwithstanding, of such “forcing” in the atmosphere.”
Amazing; I just gave you direct evidence, and it seemed to go right past you.
“First Direct Observation of Carbon Dioxide’s Increasing Greenhouse Effect at the Earth’s Surface,” Berkeley Lab, 2/25/15
http://newscenter.lbl.gov/2015/02/25/co2-greenhouse-effect-increase/
“Observational determination of surface radiative forcing by CO2 from 2000 to 2010,” D. R. Feldman et al, Nature 519, 339–343 (19 March 2015)
http://www.nature.com/nature/journal/v519/n7543/full/nature14240.html
Nor is this all.
So, the science is not settled, but it is “settled enough”. I can see that you are not joking and that you take your RealClimate™ friend seriously. I dont, myself.
Your two references are one and the same: Feldman et al, 2015, the first being a press release to hype the study. So much for your “two” references. You should read before you link.
And no, it did not “go right past” me, as I know the study from several months ago when it was posted on WUWT.
The authors have merely utilized ordinary spectroscopy to measure increases in CO2 (which is not an issue), then hyped this up into proof of global warming, trying to pass this humdrum metric off as something at the cutting edge of science. They give a hypothetical calculation of .2W/decade of
radiative “forcing” to their results and claimthis is 10% of total increase in total “forcing”, or 2W/decade.
To continue, a “forcing” of .2W/decade of a total “forcing” of 2W during the decade 2000-2010. Since it is unclear how these “forcing” figures were derived, my bet is they are hypothetical. The 2W/decade “forcing” calculates into 3.6W increase of “forcing” since 1997, which “forcing” increase yields a flat trend on the global temperature anomaly. So much for your favorite word.
The circularity if this “evidence” becomes apparent when it is realized that the study merely utilizes CO2 detection combined with hypothetical “forcing” estimates to bolster the hypothetical AGW claims.
More smoke and mirrors.
I gave two links because one is less techical.
If you read the Nature paper, you’ll see how the forcings were meausured.
“They give a hypothetical calculation of .2W/decade….”
a) The number was a change in CO2’s RF of 0.2 W/m2 over a decade.
b) It comes from measurements, not a “hypothetical calculation”
“The 2W/decade “forcing” calculates into 3.6W increase of “forcing” since 1997”
Wrong.
The paper is pay walled. So why dont you share with us your understanding, instead of stiffing us with the dead end of a pay wall. You haven’t shown much except AGW refrain so far. Show something more, if you can.
Also, do you see the annual dips in the Keeling curve? Or do you still deny these?
“The paper is pay walled.”
No excuse for dismissing it without reading it. Go to the library. Buy a copy. Write to a co-author.
“So why dont you share with us your understanding, instead of stiffing us with the dead end of a pay wall.”
I suggest you read the paper.
“Also, do you see the annual dips in the Keeling curve? Or do you still deny these?”
So what?
Do see the rises that follow them, to a new high each year?
Do you see that the minima increase year after year?
All you need is the press release to get the published measured incease in CO2’s RF.
And all you need is some understanding of the basic science to know that it’s absurd to think that CO2’s forcing is increasing by 3.6 W/m2 in 18 years.
There is something lacking in your faculties of comprehension. You repeatedly misapprehend my meaning. I made no such statement concerning CO2. The paper gave a total forcing increase of 2W/decade, which gives 3.6 W increase in forcing in 18 years.You haven’t read the Feldman study, have you?
“The paper gave a total forcing increase of 2W/decade….”
Wrong again. From the paper’s abstract:
“The time series both show statistically significant trends of 0.2 W/m2 per decade….”
http://www.nature.com/nature/journal/v519/n7543/full/nature14240.html
You need help.
From your link:
“This approximately ten per cent of the trend in downwelling long wave radiation”
This quote referring to the .2W per sq. m/ decade of CO2.
Sometimes your sort of problem is caused by poor vision. Did you read the Feldman study?
No — the change in downwelling longwave radiation is not equal to the change in CO2’s radiative forcing, since DLR is affected by more then just CO2 (water vapor, clouds, other GHGs…).
mpainter wrote:
“They give a hypothetical calculation of .2W/decade of
radiative “forcing” to their results and claimthis is 10% of total increase in total “forcing”, or 2W/decade.”
False.
Radiative forcing of CO2 is not downwelling longwave forcing.
Nor is their number “hypothetical” — it’s measured.
And you need to learn that the units of forcing aren’t Watts, they are W/m2.
The IPCC quantifies so-called ‘radiative forcing’ as an incremental increase in optical depth from the surface through the TOA due to added GHGs. What the radiative transfer simulations do though is subtract the increase in optical depth looking down to the surface from the increase in looking up through to the TOA. The net difference is quantified as ‘radiative forcing’, but it’s only a quantification of incremental GHG absorption and in no way accounts for what happens to the energy after absorption. For 2xCO2, it’s calculated to be about 3.6 W/m^2 on global average, resulting in a -3.6 W/m^2 TOA deficit that has to be restored. The basic GHE theory says this should push the climate in warming direction.
David A. is correct in that ‘radiative forcing’ by the IPCC’s definition is not in anyway quantified as downward LW – either passing to the surface or anywhere else.
What’s stupid though is the atmosphere re-radiates absorbed energy equally both up and down on a photonic level, thus net forcing should only be about half that incrementally absorbed and so-called ‘no-feedback’ should only be about 0.55C and not the 1.1C ubiquitously cited. How the IPCC gets away with that I’ll never know, but they apparently have.
See my reply below. The derivation of the radiative transfer equations takes account (of course) that some of the re-emitted radiation goes upward, and some downward, and in fact that it goes in all directions.
See Pierrehumbert’s textbook, section 4.2.1
http://cips.berkeley.edu/events/rocky-planets-class09/ClimateVol1.pdf
Salute!
I highly recommend all to visit the Wunderground site that has a great summary of the Katrina storm surge.
http://www.wunderground.com/education
Katrinas_surge_contents.asp
I grew up one block from the intersection of Gentilly and Elysian Fields in NOLA. The old ‘Spanish Trail” and rumor had it that Hwy 90 was on the gentilly “ridge” Turns out that was the case. You can look at the sat photos and that intersection did not get flooded. It was maybe 4 or 5 feet above sea level
At my old home we had about a foot of water, but further toward the river it got to 6 or 7 feet. Ditto heading north to the lake. Right at the lake, the water was maybe a foot, but it was flowing down to the lower land. Our house was on short plings – figure 3 feet. No problema for us or all but two neighbors that had built on slabs since the 60’s when I left town.
The original city did not flood ( along the Old Muddy or the Quarter), despite the best efforts of the storm and the shoddy canal levees. The area east of the Industrial Canal flooded big time from both a canal breach and the storm surge that came in from the southeast. It also happened in 1965 with Betsy. Fer Chrissakes, the Katrina surge was over 20 feet!!! Imagine New York City with that!!! Talk about “super” storm, yep. Then miles and miles of subways way below sea level. Hmmm…..
There are many reasons to build in hazard zones, but precautions need to be taken. The Dutch have likely seen and dealt with “sea level rise”, and the Louisiana folks go with them once the water receded.
Gums sends…
Gums, i live in the quarter… I always wonder why more people didn’t know to start walking toward esplanade ridge when the water started rising. My scant memory from the glut of times-picayune articles was that folks could walk it the whole way down to the river. I’m a transplant (damn yankee?) from maryland and have never stopped to ask anybody that question not knowing the answer myself. As one who grew up here, how conscious are you (and others) of the topography in these low lying areas? I don’t know about you, but if i lived in, say, lakeview and saw water rising after the storm, i’d have gotten my ass movin’ toward the highest ground i could think of. (esplanade is only a couple miles walk from the lake) It seems such a shame that so many died when they could’ve escaped to higher ground…
North Atlantic tropical storms for the last 15 years:
1999- 12 named storms, 8 hurricanes, 5 major
2000- 15 named storms, 8 hurricanes, 3 major (cat 3+)
2001- 15 named storms, 9 hurricanes, 4 major
2002- 12 named storms, 4 hurricanes, 2 major
2003- 16 named storms, 7 hurricanes, 3 major
2004- 15 named storms, 9 hurricanes, 6 major
2005- 28 named storms, 15 hurricanes, 7 major
(Note: 2005 was a record year in ALL categories)
2006- 10 named storms, 5 hurricanes, 2 major
2007- 15 named storms, 6 hurricanes, 2 major
2008- 16 named storms, 8 hurricanes, 5 major
2009- 9 named storms, 3 hurricanes, 2 major
2010- 19 named storms, 12 hurricanes, 5 Major
2011- 18 named storms, 7 hurricanes, 4 Major
2012- 19 named storms, 10 hurricanes, 2 Major
2013- 13 named storms, 2 hurricanes, 0 Major
(First time since 1994 with no major hurricanes)
2014- 8 named storms, 6 hurricanes, 2 Major
So, about 6 1/2 hurricanes per year since the record year 2005. Hard to get alarmed over such a figure, try as one might.
Dr Spencer,
On this page:
http://vortex.nsstc.uah.edu/data/msu/v6.0beta/tls/
the file listed
tlsglhmam_6.0beta2
which is at
http://vortex.nsstc.uah.edu/data/msu/v6.0beta/tls/tlsglhmam_6.0beta2
has, as its first line
MONTHLY MEANS OF MID-TROPOSPHERE c46.0beta2
Is that line wrong and it should read …LOWER-STRATOSPHERE…?
“That’s right, nearly a century to add 1 molecule of CO2 to every 10,000 molecules of atmosphere.”
I say a century to add 0.3 molecule of CO2 to every 10,000 molecules. The residence time is 7 years and man contributed only 30% to the increase in CO2.
http://hockeyschtick.blogspot.com/2015/03/a-recent-seminar-presentation-by.html
The residence time is 7 years, but that’s for an individual CO2 molecule — another CO2 molecule takes its place because it was there initially.
In fact, even after 100,000 years, about 10% of today’s extra CO2 molecules will, in effect, remain in the atmosphere. It won’t be the same CO2 molecule, but the ones that will be there will be because of the CO2 molecules emitted today.
See the work of David Archer of the Univ of Chicago, including his book “The Long Thaw.”
You are still frightened.
You should study the MonaLoa CO2 plot, that little squiggley line? Note the annual decline in atmospheric CO2 during NH summers, antipodal winters. This decline despite no decline in CO2 emissions. This shows that CO2 is consumed faster than it is presently emitted, during this time of the year.
It is obvious to anyone whose faculty of reasoning is not impaired by fright that there is no cause to be alarmed over CO2, the pseudoscience notwithstanding.This talk of 100,000 years is alarmist hype.
“This shows that CO2 is consumed faster than it is presently emitted, during this time of the year.”
You’re kidding, right, with “this time of year?”
Atmospheric CO2 has been increasing year-after-year for well over a century, including the annual mimima. We know why.
You have not studied the MonaLoa chart, have you? Study it, and you will see that CO2 ppm dips each year during the NH summer. You are too frightened to even see, much less think. Your reference link shows this, too. Did you not study it?
Have you noticed a year consists of more months than May-Sept?
Have you noticed the annual CO2 minima keep increasing year after year?
“but that’s for an individual CO2 molecule — another CO2 molecule takes its place because it was there initially.”
Therefore, no increase in CO2. You need to replace one molecule with more than one to increase concentration. By your logic, the molecules are in the air forever but we are interested in how many.
Atmospheric CO2 is increasing becasue we keep putting new CO2 molecules into the atmosphere.
Let: dC = change in number of CO2 molecules in atmosphere
R = residence time in atmosphere
dM = change in annual emission of man
dN = change in annual emission of nature
dA = change in annual absorption by CO2 sinks (molecules exiting the atmosphere)
Below is relationship of the above variables:
dC = R (dM + dN – dA)
If dC > R dM, then man is not the cause of all the increase in CO2
IPCC assumes dN = 0 and dA = 0
To make dC = R dM, they arbitrarily adjust R so they can blame everything on man. That’s why it’s important to empirically determine the value of R because it is not a free parameter.
Dr. Strangelove
Interesting math.
Atmospheric nuclear testing==>14C==>R derivation, correct or no?
The IPCC certainly does not take dN = dA = 0, or “adjust” R.
Read the 5AR WG1 Ch6.
The correct equation is simply
dm(C) = dM + dN(C) – dA(C)
where m is the mass of CO2 in the atmosphere, so dm = W dC with W the molecular weight of CO2.
All but dM are nonlinear functions of C. A CO2 molecule does not stay in the atmosphere for precisely R years, and then is immediately taken out of the atmosphere. And if humans stopped emitting CO2 today, the CO2 concentration of the atmosphere wouldn’t return to a natural state in R years. David Archer’s research finds the CO2 content of the atmosphere will still be preturbed in 100,000 years.
Apparently similar names think alike. David A claims about David Archer:
“David Archer’s research finds the CO2 content of the atmosphere will still be preturbed in 100,000 years.”
Who’ll be around to prove him wrong? I dare anyone to prove him wrong!
Have a great day!
mpainter
R derivation by isotope ratio C13/C12 by mass spectrometry
http://hockeyschtick.blogspot.com/2013/08/paper-finds-lifetime-of-co2-in.html
David A
In my equation, dM, dN and dA are annual changes, not annual emissions and absorption. Your equation uses annual emissions and absorption, and should be written as M, N and A.
IPCC has a different definition of residence time R. They define it as time to return to a “natural state” presumably the pre-industrial level of CO2. A misnomer. Better terminology is “decay or extinction rate.” Let’s label it D to distinguish it from R.
D is dependent variable of original (natural state) atmospheric concentration Co and present concentration C
D = (C – Co)/(M + N – A)
when (M + N – A) > 0
D is essentially forever because it will not return to Co
R is the average time of molecules in atmosphere (some will be longer, some shorter). Unlike D, R is not derived from an equation but empirically determined. R is an independent variable and dC is dependent on R
To simplify the equation, assume:
dN = 0
dA = 0
R = 7 years
dC = 1/7 dM7 + 2/7 dM6 + 3/7 dM5 + 4/7 dM4 + 5/7 dM3 + 6/7 dM2 + dM
dM7 means change in annual emission 7 years ago and so on. There is a lag of R years.
dN and dA are not equal to zero in a real atmosphere — in fact, they’re functions of the partial pressure of CO2 in both the atmosphere and the ocean.
In the long-tail, it won’t be the same CO2 molecules in the atmosphere that were put there today, but they will be there because some other CO2 was put there today, and they wouldn’t be there if it had not.
Dear Dr Roy,
Great article as usual!
This is just a quibble over vocabulary. In the UK we would refer to a “dearth” of hurricanes not a drought. A drought, in UK English, refers only to the absence of rain, not of other stuff. Does US English vocabulary not contain the word “dearth”? If it does why is it not used to describe the low number of hurricanes recently?
Susan,
If I may, “dearth” is rarely used in the US. It is in our dictionaries but hardly in our vocabulary of everyday discourse.
Several times in this thread it has been claimed that Sandy was a hurricane at landfall. That is not true: “National Oceanic and Atmospheric Administration (NOAA) reaffirmed its initial conclusion that Hurricane Sandy was no longer officially a hurricane when it made landfall on Oct. 29.”
It was a storm that caused much damage (and many on this thread seem to forget that the storm from sea was joined with land-based stormy weather) but Sandy was not a major hurricane — nor was it even a hurricane and landfall.
There have been hurricanes in the last ten years, but the experience of the last ten years points out another failed prediction of the warmist camp.
Ten years just doesn’t prove anything about climate change — too much natural variability.
Here’s a longer view:
http://policlimate.com/tropical/north_atlantic_hurricane.png
David A
You state: “Ten years just doesn’t prove anything about climate change — too much natural variability.
Here’s a longer view:”
I think the person who created the graph you are using may be trying to paint a false picture of what is going on by starting at a low hurricane period.
A slightly longer view will demonstrate this.
http://appinsys.com/globalwarming/gw_4ce_hurricanes.htm
http://www.ncdc.noaa.gov/oa/climate/research/hurricane-climatology.html
From the first link it would seem North Atlantic hurricanes seem to follow the AMO.
“I think the person who created the graph you are using may be trying to paint a false picture of what is going on by starting at a low hurricane period.”
That someone is Ryan Maue, a noted climate skeptic.
Are you saying he’s wrong?
David A,
I do not know the mentality of Ryan Maue, but I know the graph you linked to does not show a true picture of hurricane activity. Maybe he picked those years for a different reason and you looked at the many graphs presented and chose this one (cherry picking on your part) because it showed an increase in hurricane activity from 1970 to present. I would say you may be the one with the deceptive genetics since you were able to see many graphs and chose this one to try to make some point.
https://www.google.com/search?q=graph+of+hurricanes+numbers&espv=2&tbm=isch&tbo=u&source=univ&sa=X&ei=-S1TVb3_JsXvoATgwoGQBg&ved=0CB4QsAQ&biw=1920&bih=955#imgrc=318Qd0W4jmwF_M%253A%3ByusmrQ159ToVBM%3Bhttp%253A%252F%252Fmarineecology.wcp.muohio.edu%252Fclimate_projects_04%252Fel_nino%252Fgraph7.jpg%3Bhttp%253A%252F%252Fmarineecology.wcp.miamioh.edu%252Fclimate_projects_04%252Fel_nino%252Fresults.html%3B600%3B410
With so many graphs to choose from it is easy to find one that will fit your narrative. Be more of a science writer and not a propaganda agent. Let the science drive your thinking not your emotions.
Norman: Your Google link goes to a graph of Eastern Pacific hurricanes, not North Atlantic hurricanes.
“I know the graph you linked to does not show a true picture of hurricane activity.”
Based on what?
BTW, Maue’s graph shows statistically significant trends (I extended it to 2014:
named storms: +2.1 ± 0.9 per decade
tropical storms: +0.7 ± 0.6 per decade
major hurriances: +0.5 ± 0.4 per decade
(uncertainties are 2σ)
David A
My Google link is of many graphs. The one that it was directly linked to was pacific hurricanes but there are several graphs of North Atlantic hurricane numbers. From this large selection of graphs you may be able to paint any narrative you like. With you it seems you are making the claim increased CO2 is the cause of increase in hurricane number but if you go back further in time it does not seem to be the case. That was my point.
Norman, I’m not going to try and guess what graph you have in mind. Provide links.
I said nothing about CO2 — I simply showed the trends in North Atlantic tropical storms and hurricanes. Both have a statistically significant upward trends since 1970, and that’s with the 3500-day dearth of major hurricanes.
“From the first link it would seem North Atlantic hurricanes seem to follow the AMO.”
Then why is Roy Spencer claiming the hurricane dearth disproves AGW?
David A
You state: “Then why is Roy Spencer claiming the hurricane dearth disproves AGW?”
Where did you get that statement from. There is nothing in his material above that would make this claim. From what I have read Dr. Spencer does believe in AGW to an extent. Not an alarming extent of the psuedo scientific feedbacks that currenly are not proven by empirical evidence.
Can you verify what statement he made that would lead you to your conclusion? Thanks.
Norman, you’re right, my statment went too far. Sorry Dr Spencer.
What is the point of this post, then? Dr Spencer admits there is natural variability, but then tries to go further and implies that the last 3500 days of the North Atlantic somehow says something about CO2’s influence. It doesn’t.
Hi David A,
You state:
“Dr Spencer admits there is natural variability, but then tries to go further and implies that the last 3500 days of the North Atlantic somehow says something about CO2′s influence. It doesn’t.”
That’s a matter of interpretation. Why doesn’t it?
Have a great day!
Why doesn’t it? Natural variability is certainly one reason.
Why have there been so many huge hurricanes in the western Pacific lately?
Enquirer,
Right you are. The final report by the National Hurricane Center said it transitioned to storm status 50 miles offshore. Thanks for the information. So the mortality was probably due to flooding, not high winds. Blow me over.
In hurricanes, floods and drowning usually kill far people than winds.
NOAA:
“FACT FOR THE DAY: Historically, storm surge had been the
leading cause of death during hurricanes….”
http://www.erh.noaa.gov/gyx/HUR05PN4.txt
You are in fantasy land.
Sal, I’m afraid Davy has lost it way past the ability to ever recover. His “debate” has always been hilariously obtuse. If someone says “Roses are usually red”. Davy will respond with a link showing the color spectrum for the color blue?
The fact that he must come here and comment illogically, ad nausea, tells us he is lost. If he has to constantly debate minute data points, trying to keep the hoax alive, that just proves the hoax has died.
NOAA gives statistics on the page I cited. For
Tropical Cyclone Deaths (1970-1999)
they say 59% were caused by freshwater flooding, and 12% by wind.
http://www.erh.noaa.gov/gyx/HUR05PN4.txt
See what I mean?
Science is about evidence and numbers. Perhaps that’s really what you have a problem with.
http://hockeyschtick.blogspot.com/2013/04/new-paper-demonstrates-temperature.html
The latest data shows CO2 is still following and lagging the temperature.
This makes a very strong case that it is still the temperature which is controlling CO2 concentrations.
Look at the graph.
So drivers are first checking the temperature outside before they drive to work, and if it’s higher they drive farther?
Power plants burn less coal as the temperature decreases?
Note: monthly sunspot number peaked in Fed 2014.
“salvatore del prete says: (July 13, 2013) “”I think the start of the temperature decline will commence within six months of the end of the solar cycle maximum and should last for at least 30+ years.””
http://www.drroyspencer.com/2013/07/uah-v5-6-global-temperature-update-for-june-2013-0-30-deg-c/#comment-84963“
Dr Spencer I have just a small question.
Does there exist a spatial overview of those regions of the earth where satelite temperatures and ground based temperatures have the largest differences? Is it the poles, or the highly populated land areas or the oceans?
A map would be nice explaining the discrepancies.
http://icecap.us/images/uploads/Crux_Flawed_Science.pdf
From Dr. Gray who I agree with.
Where is Gray’s climate model?
Science is about evidence and numbers. Perhaps that’s really what you have a problem with.
David says.
My reply – Which is why your theory is wrong.
http://wattsupwiththat.com/2015/05/12/22-very-inconvenient-climate-truths/
David why don’t you address each issue with data to show this is not the case.
Salvatore, I don’t take homework assignments. Nor consider anything on that site to be automatically honest.
mpainter,
The IPCC quantifies so-called ‘radiative forcing’ as an incremental increase in optical depth from the surface through the TOA due to added GHGs. What the radiative transfer simulations do though is subtract the increase in optical depth looking down to the surface from the increase in looking up through to the TOA. The net difference is quantified as ‘radiative forcing’, but it’s only a quantification of incremental GHG absorption and in no way accounts for what happens to the energy after absorption. For 2xCO2, it’s calculated to be about 3.6 W/m^2 on global average, resulting in a -3.6 W/m^2 TOA deficit that has to be restored. The basic GHE theory says this should push the climate in warming direction.
David A. is correct in that ‘radiative forcing’ by the IPCC’s definition is not in anyway quantified as downward LW – either passing to the surface or anywhere else.
What’s stupid though is the atmosphere re-radiates absorbed energy equally both up and down on a photonic level, thus net forcing should only be about half that incrementally absorbed and so-called ‘no-feedback’ should only be about 0.55C and not the 1.1C ubiquitously cited. How the IPCC gets away with that I’ll never know, but they apparently have.
I should clarify in that the optical depth looking down the surface isn’t really increased, but as a result of increased absorption per the added GHGs, each layer emits is little more both upwards and downwards than prior. This changes the IR fluxes at the TOA and at the surface, where the TOA flux is reduced by some amount and the IR flux to the surface is increased by some amount. The difference between the two is quantified as the net absorption increase.
RW, i’ve always wondered about that 1.1 degrees C number, thanks for the explanation… We are not too far away from the half way point of the doubling of co2. That would mean we that we should have seen about .5 degrees C from co2 (alone) already. And if most all the agw warming is concentrated in the last half century, then it’s clear we haven’t seen .5 degrees C warming from co2 alone. Are there any prominent criticisms (that is, critcisms from prominent scientists) on this? It would seem that someone somewhere should be pointing out this obvious flaw…
Unfortunately, no. I’ve even discussed it with Roy himself, but neither he nor anyone else seems to have any clue or demonstrates any ability to understand the notion at all. It’s baffling, but appears to be a lost cause.
fonzarelli says:
“And if most all the agw warming is concentrated in the last half century, then it’s clear we haven’t seen .5 degrees C warming from co2 alone.”
Why is that clear?
Because recent warming has only seen .5 degrees C… Therefor, the entire rise would have to be from co2 alone. No forcing and no other causes of warming (which the ipcc concedes could be half).
No numbers, no logic, no calculations, no science, therefore no proof — just your beliefs.
0.5-0.5=0.0
Just like I said — no logic or calculations or science.
Science is not based on beliefs, but on what can be proved.
David, i gave you logic: Since there is only half a degree of warming and we should expect half a degree from co2, then that gives no room for warming from forcing nor other causes of warming. Therefor, the warming from co2 cannot be the entire half degree.
I gave you numbers: half a degree of observed warming, half a degree of warming expected from co2, zero warming from forcing if co2 warming comprises the whole rise (and zero warming from other causes as well).
I omitted the calculation (only adding it facetiously after the fact) because it was so simple and was implied in the comment.
Mine is not a belief, rather a conclusion. (granted, one that could certainly be challenged…)
Changes in radiative flux are found by solving the Schwarzschild equation. Applied to the atmosphere, they reduce to the “two-stream equations,” which specify the upward and downward fluxes as two coupled differential equations involving the Planck function at every frequency and vertical point.
There is no missing factor of 1/2 — the consideration of upward and downward is included in the two-stream equations. In other words, solving for the downward flux has already taken into account the fact that some radiation goes upward. (And, moreover, that a GHG molecule’s emissions goes in all directions. But the integration over the angular dependences is easy to do by hand.)
Besides, it would be extremely suprising if all the work done on radiative transfer by hundreds of scientists for many decades now somehow missed this factor of 1/2. They did not.
Hi David A,
You state:
“Changes in radiative flux are found by solving the Schwarzschild equation.”
Please note, you didn’t say CALCULATED or DERIVED from OBSERVATION by using the Schwarzschild equation. Do you expect to FIND atmospheric changes in radiative flux by an equation rather than empirical observation and measurement? Interesting!
Have a great day!
David, think of all the hundreds of scientists who have missed the fact that co2 tracks with temperature (and not emissions) including doctor spencer. Nothing is “extremely surprising” when it comes to agw…
“David, think of all the hundreds of scientists who have missed the fact that co2 tracks with temperature (and not emissions) including doctor spencer.”
That’s simply (and very obviously) wrong when applied to AGW. Humans are burning fossil fuels every day, regardless of the temperature. The CO2 comes first. And we know the extra atmospheric CO2 comes from man’s emissions.
http://www.woodfortrees.org/plot/esrl-co2/from:1959/mean:24/derivative/plot/hadcrut4sh/from:1959/scale:0.22/offset:0.10
Did i really have to spell it out as “carbon growth” instead of “co2” for you?
That plot proves nothing except that both have an increasing trend.
To prove a correlation, you need to do statistical tests. Have you done those?
David, two very different data sets going in lock step for over half a century?!!! (are you nutso?)
“Please note, you didn’t say CALCULATED or DERIVED from OBSERVATION by using the Schwarzschild equation.”
The Schwarzschild equation is derived logically from two basic, well established physical laws: conservation of energy and the Planck law.
David,
The calculated 3.6 W/m^2 per CO2 doubling is only incremental GHG absorption, i.e. additional upwelling IR instantaneously captured. The atmosphere will re-radiate this absorbed flux both up and down (equally both up and down on a photonic level). The calculated 1.1C of so-called ‘no-feedback’ does not take this into account.
Schwarzschild had much to claim about General Relativity, radiation transfer and other things, but don’t you think any equation describing actual atmospheric changes in radiative flux must be based on measurements and observation of the atmosphere?
Just asking.
Have a great day!
“Schwarzschild had much to claim about General Relativity, radiation transfer and other things, but don’t you think any equation describing actual atmospheric changes in radiative flux must be based on measurements and observation of the atmosphere?”
Schwarzschild’s equation is a logical consequence of the Planck law and conservation of energy.
Are you saying these aren’t established physical laws?
Hi David A,
First you merely repeated yourself and then you asked:
“Are you saying these aren’t established physical laws?”
No, but you haven’t answered the question.
Have a great day!
“First Direct Observation of Carbon Dioxide’s Increasing Greenhouse Effect at the Earth’s Surface,” Berkeley Lab, 2/25/15 (press release)
http://newscenter.lbl.gov/2015/02/25/co2-greenhouse-effect-increase/
“Observational determination of surface radiative forcing by CO2 from 2000 to 2010,” D. R. Feldman et al, Nature 519, 339–343 (19 March 2015)
http://www.nature.com/nature/journal/v519/n7543/full/nature14240.html
Hi David A,
Thank you for the links. It pleases me to know that in the end you provided observation.
Have a great day!
RW says:
“The atmosphere will re-radiate this absorbed flux both up and down (equally both up and down on a photonic level). The calculated 1.1C of so-called ‘no-feedback’ does not take this into account.”
You’re repeating yourself. Did you look at the section in Pierrehumbert’s textbook I suggested? The derivation of the two-stream equations given there obviously takes into account radiation in all directions.
No. The calculated 3.6 W/m^2 is the difference between the IR flux reduced from passing into space and the IR flux change passing to the surface (which is positive for increased GHGs). I don’t know what the actual numbers are, but if it were -6 W/m^2 at the TOA and +2.4 W/m^2 at the surface, the net change in absorption would be 3.6 W/m^2. This 3.6 W/m^2 is entirely that of additional upwelling IR instantaneously captured and is the net instantaneous imbalance imposed. This calculation itself has nothing to do with how the 1.1C of so-called ‘no-feedback’ is arrived at.
Prior to an imposed imbalance from added GHGs, the atmosphere captures roughly 300 W/m^2, for which it only takes about +150 W/m^2 of net surface gain to offset, i.e. establish equilibrium with space. Mainstream climate science arbitrarily assumes (incorrectly) that just because in the case of +3.6 W/m^2 of incremental GHG absorption and in the case of +3.6 W/m^2 of post albedo solar power entering the system, there is -3.6 W/m^2 TOA deficit that has to be restored and that each’s intrinsic surface warming ability is equal to each other.
This fails to account for 1) that none of GHG absorption, incremental or otherwise is new energy being added to the system (like post albedo solar power entering), and 2) that the atmosphere re-radiates absorbed energy both up and down. The IR energy absorbed by GHGs and re-radiated (no matter how many times) by and large has 50/50 probability of going up or down until the initially captured energy finds its way out of the atmosphere somehow. Only when this energy is re-radiated downward toward the surface is it acting to ultimately warm the surface or resisting the push toward radiative cooling of the system by radiation from the atmosphere into space.
David,
“You’re repeating yourself. Did you look at the section in Pierrehumbert’s textbook I suggested? The derivation of the two-stream equations given there obviously takes into account radiation in all directions.”
What happens when you add GHGs is each atmospheric layer absorbs a little more from above and below and subsequently emits a little more upwards and downwards. From this the total TOA flux change and total surface flux change (which have contributions from all the layers) are re-calculated to arrive at the net change in absorption, which for 2xCO2 is about 3.6 W/m^2. Of course, for the total surface IR change, it’s the fluxes emitted downward from the layers and for the TOA IR flux change, it’s the fluxes emitted upward from the layers.
RW:
The derivation of the two-stream equations makes it clear than they account for conservation of energy, including all directions of flux.
They are then solved for the fluxes at the TOA and the surface.
Again, see Pierrehumbert’s derivation of the equations, if you can follow the math. He makes this very clear.
David,
“The derivation of the two-stream equations makes it clear than they account for conservation of energy, including all directions of flux.”
I never claimed it didn’t. What you don’t seem to know is that the 1.1C of so-called ‘no-feedback’ is not arrived at by radiative transfer simulation. The 3.6 W/m^2 per 2xCO2 calculated by RT is correct, but it’s not correct to consider its intrinsic warming ability equal to +3.6 W/m^2 of post albedo solar power entering the system.
Do you even know how the 1.1C is calculated?
“I never claimed it didn’t. What you don’t seem to know is that the 1.1C of so-called ‘no-feedback’ is not arrived at by radiative transfer simulation.”
Yes, it is. It’s calculated from a radiative-convective model, and that model includes the Schwarzschild equation, which conserves energy. It’s been done that way since Manabe and Wetherald.
Example: Hansen et al 1988.
The 1.2 C is explicit in the second equation in Appendix B.
http://pubs.giss.nasa.gov/docs/1988/1988_Hansen_etal_1.pdf
David,
No, it’s dTs = (Ts/4)*(dE/E), where Ts is equal to the surface temperature and dE is the change in emissivity (or change in OLR) and E is the emissivity of the planet (or total OLR).
Plugging in 3.6 W/m^2 for dE we get dTs = (287K/4) * (3.6/239) = 1.08K. About 1.1K.
All this formulation does is validate the T^4 relationship between the surface and the TOA, which is specifically offsetting post albedo solar power entering the system, and is not connected, physically or mathematically, to that amount offsetting GHG absorption.
No RW.
First of all, emissitivity is not a change in OLR.
Emissivity is a characteristic of a substance, and it is a pure number, with no units.
David,
Look up the definition. There is more than one meaning.
The Earth’s emissivity relative to space is 0.62 (239/385 = 0.62), which means 239 W/m^2 of the 385 W/m^2 radiated from the surface is transmitted into space. When GHGs are added, the emissivity decreases resulting in an imbalance (more post albedo solar power enters than is leaving at the TOA).
The formulation is based on Arrhenius and is how the 1.1K is arrived at.
RW:
“Emissivity” is most commonly used to characterize how close a substance is to a blackbody. You’re talking about radiation.
“The Earth’s emissivity relative to space is 0.62 (239/385 = 0.62), which means 239 W/m^2 of the 385 W/m^2 radiated from the surface is transmitted into space. When GHGs are added, the emissivity decreases resulting in an imbalance (more post albedo solar power enters than is leaving at the TOA).”
Yes — and that change in emissivity (as you call it) is calculated from radiative-convection models. Manabe and Wetherald were the first ones to do it right, and they correctly accounted for energy conservation.
It’s right there in the Hansen formula I referred to earlier:
deltaT(2x_0) = f(2_x0) – f(x_0) = 8.04-6.82 = 1.2 C
where x_0 = 315 ppmv.
Great article at WUWT http://wattsupwiththat.com/2015/05/12/22-very-inconvenient-climate-truths/
The gist of it:
The 22 Inconvenient Truths
1. The Mean Global Temperature has been stable since 1997, despite a continuous increase of the CO2 content of the air: how could one say that the increase of the CO2 content of the air is the cause of the increase of the temperature? (discussion: p. 4)
2. 57% of the cumulative anthropic emissions since the beginning of the Industrial revolution have been emitted since 1997, but the temperature has been stable. How to uphold that anthropic CO2 emissions (or anthropic cumulative emissions) cause an increase of the Mean Global Temperature?
[Note 1: since 1880 the only one period where Global Mean Temperature and CO2 content of the air increased simultaneously has been 1978-1997. From 1910 to 1940, the Global Mean Temperature increased at about the same rate as over 1978-1997, while CO2 anthropic emissions were almost negligible. Over 1950-1978 while CO2 anthropic emissions increased rapidly the Global Mean Temperature dropped. From Vostok and other ice cores we know that it’s the increase of the temperature that drives the subsequent increase of the CO2 content of the air, thanks to ocean out-gassing, and not the opposite. The same process is still at work nowadays] (discussion: p. 7)
3. The amount of CO2 of the air from anthropic emissions is today no more than 6% of the total CO2 in the air (as shown by the isotopic ratios 13C/12C) instead of the 25% to 30% said by IPCC. (discussion: p. 9)
4. The lifetime of CO2 molecules in the atmosphere is about 5 years instead of the 100 years said by IPCC. (discussion: p. 10)
5. The changes of the Mean Global Temperature are more or less sinusoidal with a well defined 60 year period. We are at a maximum of the sinusoid(s) and hence the next years should be cooler as has been observed after 1950. (discussion: p. 12)
6. The absorption of the radiation from the surface by the CO2 of the air is nearly saturated. Measuring with a spectrometer what is left from the radiation of a broadband infrared source (say a black body heated at 1000°C) after crossing the equivalent of some tens or hundreds of meters of the air, shows that the main CO2 bands (4.3 µm and 15 µm) have been replaced by the emission spectrum of the CO2 which is radiated at the temperature of the trace-gas. (discussion: p. 14)
7. In some geological periods the CO2 content of the air has been up to 20 times today’s content, and there has been no runaway temperature increase! Why would our CO2 emissions have a cataclysmic impact? The laws of Nature are the same whatever the place and the time. (discussion: p. 17)
8. The sea level is increasing by about 1.3 mm/year according to the data of the tide-gauges (after correction of the emergence or subsidence of the rock to which the tide gauge is attached, nowadays precisely known thanks to high precision GPS instrumentation); no acceleration has been observed during the last decades; the raw measurements at Brest since 1846 and at Marseille since the 1880s are slightly less than 1.3 mm/year. (discussion: p. 18)
9. The “hot spot” in the inter-tropical high troposphere is, according to all “models” and to the IPCC reports, the indubitable proof of the water vapour feedback amplification of the warming: it has not been observed and does not exist. (discussion: p. 20)
10. The water vapour content of the air has been roughly constant since more than 50 years but the humidity of the upper layers of the troposphere has been decreasing: the IPCC foretold the opposite to assert its “positive water vapour feedback” with increasing CO2. The observed “feedback” is negative. (discussion: p.22)
11. The maximum surface of the Antarctic ice-pack has been increasing every year since we have satellite observations. (discussion: p. 24)
12. The sum of the surfaces of the Arctic and Antarctic icepacks is about constant, their trends are phase-opposite; hence their total albedo is about constant. (discussion: p. 25)
13. The measurements from the 3000 oceanic ARGO buoys since 2003 may suggest a slight decrease of the oceanic heat content between the surface and a depth 700 m with very significant regional differences. (discussion: p. 27)
14. The observed outgoing longwave emission (or thermal infrared) of the globe is increasing, contrary to what models say on a would-be “radiative imbalance”; the “blanket” effect of CO2 or CH4 “greenhouse gases” is not seen. (discussion:p. 29)
15. The Stefan Boltzmann formula does not apply to gases, as they are neither black bodies, nor grey bodies: why does the IPCC community use it for gases ? (discussion: p. 30)
16. The trace gases absorb the radiation of the surface and radiate at the temperature of the air which is, at some height, most of the time slightly lower that of the surface. The trace-gases cannot “heat the surface“, according to the second principle of thermodynamics which prohibits heat transfer from a cooler body to a warmer body. (discussion: p. 32)
17. The temperatures have always driven the CO2 content of the air, never the reverse. Nowadays the net increment of the CO2 content of the air follows very closely the inter-tropical temperature anomaly. (discussion: p. 33)
18. The CLOUD project at the European Center for Nuclear Research is probing the Svensmark-Shaviv hypothesis on the role of cosmic rays modulated by the solar magnetic field on the low cloud coverage; the first and encouraging results have been published in Nature. (discussion: p. 36)
19. Numerical “Climate models” are not consistent regarding cloud coverage which is the main driver of the surface temperatures. Project Earthshine (Earthshine is the ghostly glow of the dark side of the Moon) has been measuring changes of the terrestrial albedo in relation to cloud coverage data; according to cloud coverage data available since 1983, the albedo of the Earth has decreased from 1984 to 1998, then increased up to 2004 in sync with the Mean Global Temperature. (discussion: p. 37)
20. The forecasts of the “climate models” are diverging more and more from the observations. A model is not a scientific proof of a fact and if proven false by observations (or falsified) it must be discarded, or audited and corrected. We are still waiting for the IPCC models to be discarded or revised; but alas IPCC uses the models financed by the taxpayers both to “prove” attributions to greenhouse gas and to support forecasts of doom. (discussion: p. 40)
21. As said by IPCC in its TAR (2001) “we are dealing with a coupled non-linear chaotic system, and therefore the long-term prediction of future climate states is not possible.” Has this state of affairs changed since 2001? Surely not for scientific reasons. (discussion: p. 43)
22. Last but not least the IPCC is neither a scientific organization nor an independent organization: the summary for policy makers, the only part of the report read by international organizations, politicians and media is written under the very close supervision of the representative of the countries and of the non-governmental pressure groups.
Rah,
This only appears to be ’a great article’ to those who do not understand basic science. For those who do, most of it is tosh.
It is , however, ‘a great article’ from the warmist perspective, since it proves that sceptics base their position on pseudo-scientific mumbo-jumbo
Mumbo-Jumbo is not taking the time to dispute a single point in the article and instead just trying to insult the intelligence of the person that posted it.
The AMO is switching to it’s cold phase and we’re currently in the weakest solar cycle since 1906. So it seems to me that it’s likely we’re heading towards times a bit chillier than we’re used to after the coming super el nino effects end in a couple years. http://www.weatherbell.com/saturday-summary-may-9-2015
But I’m sure there will be people, possibly including you, that will believe it was caused by CO2. Just as there are some that claimed the last two brutal winters in eastern half of the country were caused by AGW. And claim that the massive growth in Antarctic sea ice extent is being caused by melt of the continental ice sheets pushing more fresh water into the oceans where it freezes.
I’m just a truck driver with a little education trying to get a handle on it all. But what I do know is I can tell when someone is pissing down my back and trying to tell me it’s raining.
Tell me MikeB. Has ANY of the major catastrophes that have been predicted over the last 30 years by the warmists occurred or even show good evidence that they are about to? Will the Arctic be essentially ice free this summer and the NW passage be open this year? Will children in England not know what snow is? Will the big dig in Boston be flooded due to rising sea levels? Is Texas still in a permanent drought? And so on and so forth with the never ending BS claims by “scientists” that have not happened.
Harvard graduates explain the seasons:
https://www.youtube.com/watch?v=p0wk4qG2mIg
Failure to understand or care to understand or observe the world around them. The only people that would answer that question the way they did would have:
1. Never been curious enough to find out what a solstice or equinox is.
2, Never learned what the tropical lines on a globe mean.
3. Never observed that the Ecliptic (apparent path of the sun) changes in their skies with the seasons.
4. Never even realized that when it is summer in the Northern hemisphere it’s winter in the Southern.
5. Did not pay attention to when the longest day of the summer was announced as it always is all over the news and wondered why the period of daylight varies.
6. Never questioned why there are long periods of darkness and other periods of continuing daylight at the poles.
Never mind the fact that many of the greatest scientific discoveries made are attributed to people who did not have a degree in the field in which they made their discoveries.
Every year I spend about 50 nights with my 10″ Meade Star finder star hopping to find faint fuzzies or looking a planets or trying to count the stars in the Orion Nebula, or observing moons and planets to learn about the universe about me. How much time do you actually dedicate to making direct first hand observations of the universe around you MikeB?
rah wrote:
“Mumbo-Jumbo is not taking the time to dispute a single point in the article….”
Because disputing them won’t matter.
It hasn’t mattered. All those claims have been disputed and debunked endlessly, for years and years. Yet people like you throw throw them up again and again, because it’s easy to cut-and-paste, and because some won’t do the work necessary to understand why scientists have concluded they’re not factors and instead come to other conclusions.
David A,
You claim:
“All those claims have been disputed and debunked endlessly, for years and years.”
The same data-sets have been disputed for years and years yet you still post on this site.
You go on:
“Yet people like you throw throw them up again and again, because it’s easy to cut-and-paste, and because some won’t do the work necessary to understand why scientists have concluded they’re not factors and instead come to other conclusions.”
All the points David? All scientists have come to other conclusions even disputing observation claims based on Earth’s albedo for example?
Have a great day!
“The same data-sets have been disputed for years and years yet you still post on this site.”
By bloggers like WUWT. There is little dispute from the science community, and when there is, it’s addresed.
“All scientists have come to other conclusions even disputing observation claims based on Earth’s albedo for example?”
What observations? (Don’t cite blogs or blogwork.) Several months ago I asked a scientist who wrote about vegetation changes if there was any work on changes in global albedo. He said he didn’t know of any, because we lack the data.
Hi David A,
You state:
“There is little dispute from the science community, and when there is, it’s addresed.”
Sounds ominous if not terrifying. In an academic discipline based on skepticism and analysis no dispute exists and when there is it’s “ADDRESSED.” Dissenters silenced? Tomes of facts outside the acceptable realm of discussion ignored? How exactly are they addressed? If successfully addressed why do so many scientists including the blog master here dispute many CAGW claims?
It just seems some schools didn’t get all the memo’s.
lasp.colorado.edu/sdo/meetings/session_1_2_3/presentations/session3/3_06_Palle.pdf
Have a great day!
P.S. –
“In an academic discipline based on skepticism and analysis no dispute exists and when there is it’s “ADDRESSED.” Dissenters silenced?”
Of course not. You put up one red herring after another.
Science is a debate. When issues are solved scientists move onto the next issues. If and when necessary, they reexamine new data in light of what has come before and reexamine what is necessary.
You are trying to paint science as some monolithic block that tolerates no dissent. Nothing could be further from the truth. You should go to some seminars at your local university to see how it goes — that’d be a start.
Hi David A,
You state:
“You are trying to paint science as some monolithic block that tolerates no dissent. Nothing could be further from the truth. You should go to some seminars at your local university to see how it goes — that’d be a start.”
I never claimed any such thing. Your statement made it sound that way.
Have a great day!
Hi David A,
Btw, the link I provided makes curious claims about albedo. Has it been addressed?
Have a great day!
Your link is not to a paper, it’s to presentation slides that appear to be at least 10 years old.
Has this work been published anywhere? I can’t find the first paper in its references, which says in was in press at Science in 2004.
The one recent paper on albedo I do know about is
K. Pistone, I. Eisenman, and V. Ramanathan (2014). Observational determination of albedo decrease caused by vanishing Arctic sea ice. Proc Natl Acad Sci USA 111, 3322-3326.
http://eisenman.ucsd.edu/papers/Pistone-Eisenman-Ramanathan-2014.pdf
Hi David A,
Thank you for the link, but it primarily covers ARCTIC albedo. The following material apparently published in 2006 from Palle again. In any case, any information you can find will be welcome.
http://onlinelibrary.wiley.com/store/10.1029/2006EO040002/asset/eost15365.pdf;jsessionid=2F35EDE17ADCE05D403CC7BF3FA2255E.f03t02?v=1&t=i9p74pef&s=a1c67d4d06a006fa0c0c336faec12dac5c02b1dd
Have a great day!
David,
It is obvious to an observer that dissent from the religion of AGW or CAGW is dealt with as heresy.
There seem to be 2 types adherents of the religion: those who want control of industrial society and those who have a basic anthropological self loathing.
Otherwise those who differ in belief or concern would be met with rational thought or indifference. But no, attempts are made to silence dissent and even to ruin the lives of dissenters.
That reflects a religious attitude whose modern methods originate with the Inquisition and continue on with the EPA, IRS, OSHA and IPCC and associated environmental radicals.
Have a pleasant day!
Lewis Guignard
Followup 2008 paper by the same lead author, which found very different results after 2000:
bbso.njit.edu/Research/EarthShine/literature/Palle_etal_2008_JGR.pdf
See figures 1 & 2.
Here are some discussions:
http://www.realclimate.org/index.php/archives/2006/02/cloudy-outlook-for-albedo/
http://www.skepticalscience.com/print.php?r=111
Lewis:
What you are trying to do by calling the science a “religion” is dismiss it without the hard hard work of actually disproving the science, with evidence, with data, with logic, with reasoning, with rationality.
Make all the silly accusations you want — there is only one way to disprove AGW (which, at this point, is extremely^2 unlikely).
John: In 2008 Palle corrected his results (Figures 1 and 2) after 2000:
http://bbso.njit.edu/Research/EarthShine/literature/Palle_etal_2008_JGR.pdf
The Earthshine method doesn’t look very reliable for calculating Earth’s albedo. Here are some discussions:
http://www.realclimate.org/index.php/archives/2006/02/cloudy-outlook-for-albedo/
http://www.skepticalscience.com/print.php?r=111
David none of the data supports AGW theory.
Salvatore, that’s just ridiculous. The entire scientific community (minus episolon) doesn’t accept the human influence on climate any supporting evidence. Denying that doens’t make your claims true, just blind.
Thanks Rah,
You stated:
“the albedo of the Earth has decreased from 1984 to 1998, then increased up to 2004 in sync with the Mean Global Temperature. ”
It explains a lot.
Thanks again.
Have a great day!
JohnKl says: “You stated:”
I didn’t. The portion of the article I posted did.
Hi Rah,
You stated:
“I didn’t. The portion of the article I posted did.”
#19 of your post-statement read:
“19. Numerical “Climate models” are not consistent regarding cloud coverage which is the main driver of the surface temperatures. Project Earthshine (Earthshine is the ghostly glow of the dark side of the Moon) has been measuring changes of the terrestrial albedo in relation to cloud coverage data; according to cloud coverage data available since 1983, the albedo of the Earth has decreased from 1984 to 1998, then increased up to 2004 in sync with the Mean Global Temperature. (discussion: p. 37)”
You didn’t put it in quotation marks on your post. So, while you list reference pages I was unsure if the statements comprised exact quotes. In any case, great post and the information provided does explain a lot.
Have a great day!
Roy
I am offering a AU$5,000 reward to the first in the world to prove me wrong (regarding the physics in my 2013 paper) and produce evidence that the greenhouse gas water vapor makes rain forests 40 degrees hotter than dry regions as the IPCC in effect claim it should. Read my peer-reviewed papers or my book linked from http://climate-change-theory.com
Nearly 3,500 Days Since Major Hurricane Strike… Despite Record High CO2
Why that “despite”? Everything else is coupled to rising CO2 by the climate community, so naturally it must be because of the rising CO2, i can’t think of anything else.
Like the increasing sea ice at antarctica, it is perfectly corrolated with CO2. Why bother with deeper explanations, when the corrolation shows it so convincing.
Hi Svend Ferndinandsen,
You stated:
“Like the increasing sea ice at antarctica, it is perfectly corrolated with CO2. Why bother with deeper explanations, when the corrolation shows it so convincing.”
Why bother indeed? Even when some Californian’s dump 1.6 billion acre feet of water into the ocean it somehow gets labeled a drought as a result of CO2 emissions. Mighty powerful chemical that CO2 proves to be. Question it at your peril. Earlier I tried to provide links supporting the information just provided but some moderator did not let it through. You can find it all over the web though.
Have a great day!
P.S. – I apologie to any moderator for any immoderate comments.
Is there any correlation between sea level rise and the rise of Co2? If there isn’t after all this time then it would seem to me that such a discrepancy should be pointed out regularly to the alarmists.
I didn’t read through all of the comments, but I searched for some reference to Hurricane Charley, and found none. So I assume that no one has mentioned the following.
By traditional reporting standards, Wilma was not a major hurricane at landfall. As I recall, the category 3 force surface winds at landfall were derived from Doppler radar estimates in the off shore waters. There were no reports of sustained winds exceeding 110 mph in any of the surface observations.
We are dealing with a record that was last set over 100 years ago, long before the advent of airborne Doppler radar. The qualifications for a major hurricane back then required a measurement (or some other direct observation) of winds in excess of 110 mph. If we are comparing apples to apples, Wilma does not qualify as the last major hurricane to strike the US coastline. That honor should go to hurricane Charley, which also hit Southwest Florida about 2 years earlier.
On May 25th, by declaration of the National Hurricane Center, it will be 3,500 days since the last major hurricane hit the US Coastline. But the reality is that it will actually be 3,937 days since Hurricane Charley made landfall, and that is where the record really stands. If no major hurricane hits the US before July 27th of this year (which is extremely likely), the real record will reach 4,000 days!
John, this site won’t accept my reply to your albedo PPTs.
Any thoughts on the HuffPuff article? In the midst of ever increasing ice, they think this ice shelf will break off….why?
http://www.huffingtonpost.com/2015/05/15/antarctic-ice-shelf-disin_n_7291782.html?ncid=txtlnkusaolp00000592
Yes,
http://stevengoddard.wordpress.com/2015/05/15/climate-scientists-pushing-the-same-scam-century-after-century/
Yep it’s never ending. Record sea ice extents for the Antarctic. So far 45 days worth or record extents for this year https://sunshinehours.wordpress.com/2015/05/14/sea-ice-extent-day-133-3rd-highest-global-sea-ice-for-this-day-antarctic-sets-45th-daily-record-for-2015/
So much ice that the supply of fossil fuels to Mawson Station and others is threatened and there is talk about moving. https://notalotofpeopleknowthat.wordpress.com/2015/05/11/increasing-antarctic-ice-a-worry-for-research-stations/ But what gets the press? The fact that an ice shelf that has been receding for over 10,000 years is still receding.
The Arctic is losing sea ice about 10 times faster than the Antarctic is gaining it.
Yea, it’s losing it so fast that the global sea ice extent has remained over one standard deviation above mean for 30 days and this year has recorded multiple days when the extent was the 3rd highest ever recorded. [sarc/off]https://sunshinehours.wordpress.com/2015/05/12/sea-ice-extent-day-131-3rd-highest-global-sea-ice-for-this-day-antarctic-sets-43rdd-daily-record-for-2015/
The Cryosphere Today
Image comparison of Arctic sea ice extent and northern hemisphere snow coverage. May 5th, 2013 to May 5th, 2015
http://igloo.atmos.uiuc.edu/cgi-bin/test/print.sh?fm=05&fd=05&fy=2013&sm=05&sd=05&sy=2015
“The Arctic is losing sea ice about 10 times faster than the Antarctic is gaining it.”
+++++++
Davy, your humorous “science” never ceases to amuse.
But, you seem to be running out of new material for your comedy routine. May I offer some suggestions?
1) The Arctic forest fires are the worst in recorded history.
2) Antarctica is now so hot that air conditioners are being installed to keep the penguins alive.
3) The Pacific Ocean has completely boiled away. (That’s why sea levels are not rising, duh.)
4) The Earth is so hot it is warming the Sun. (Oh yeah, that’s a “Luker” belief!)
5) Not only are all the mountain glaciers gone, but the mountains have melted.
Hope this helps. We love your comedy.
Ice is 3-dimensional, not 2-dimensional. Global sea ice volume is plummeting.
Geran: Here are the data for you:
http://davidappell.blogspot.com/2014/05/how-fast-is-planet-losing-ice.html
As I wrote: “We love your comedy.”
Why are you so opposed to citing data?
Why do you assume I am opposed to citing the data? Locked in your “belief system” much?
The data are out there for everyone. That is why your comments are so hilarious.
And yet most people here make all kind of grand pronouncements without offering any data. They don’t even seem to go look for it. How come?
Davy, you do not want REAL facts. You would search for anyway to DENY real facts, as we see constantly.
For example, what about “Climategate”? Why do you never mention it? I can understand that you do not understand the science. I have good friends that do not understand the science. Dr. Spencer has indicated he does not understand the science. But, EVERYONE should understand the Climategate emails. Everyone should understand Climategate shows the duplicity of the AGW “scientists”.
(But, keep the comedy coming.)
Which of the data I’ve cited are not “real?”
What about Climategate?
Climategate was REAL. So, you try to ignore it. QED
Again, what about Climategate?
See!
Hurricanes are a stealth issue for warmists. They know storm activity is more associated to cooling rather than warming periods. It’s all about the size of the differentials in temperature between the equatorial regions and elsewhere.
But they keep claiming global warming causes bad weather anyway. Because if the future cools, or even if there is just a return to 1950’s weather, then the increasing stormy weather can and will be blamed on CO2.
Actually, here is what the 5AR says:
“No robust trends in annual numbers of tropical storms, hurricanes and major hurricanes counts have been identified over the past 100 years in the North Atlantic basin.”
IPCC 5AR WG1 Ch2 section 2.6.3 pg 216
Davy, you forgot to mention AR1, AR2, AR3, and AR4. In addition, you forgot to mention all of the Alarmists rants about things like “hurricane” Sandy.
See why you are so hilarious?
Geran, i gave up laughing at this jerk month’s ago. (good to see that your able to maintain your sense of humor; cheers…)
Fonz, keep laughing at him. It’s healthy!
Why mention older assessments?
Hurricane Sandy was a strange storm, especially its track and big left turn. It killed a lot of people. Yes, some people care about. It also cost a lot of money. You and I are helping to rebuild what was destroyed.
“Why mention older assessments?”
*********
Because, as you know, the older ARs provide more evidence of how bad the IPCC “science” really is.
You could admit the IPCC science is flawed, or you could continue with your “climate comedy”.
(I actually hope you will continue with the comedy.)
Sandy was not strange or different in the least.
The 1938 storm was much worse.
Sandy’s left turn was unusual:
http://www.weather.com/storms/hurricane/news/hurricane-unusual-northeast-track-20121024#/3
David A,
Yes — and that change in emissivity (as you call it) is calculated from radiative-convection models. Manabe and Wetherald were the first ones to do it right, and they correctly accounted for energy conservation.
The 3.6 W/m^2 is calculated via radiative transfer simulation alone. Convection is not considered (nor should it be).
The point is the 3.6 W/m^2 per 2xCO2 is only instantaneous incremental GHG absorption, i.e. upwelling IR additionally absorbed, and in no way accounts for what happens to the absorbed energy after absorption.
It’s right there in the Hansen formula I referred to earlier:
deltaT(2x_0) = f(2_x0) – f(x_0) = 8.04-6.82 = 1.2 C
where x_0 = 315 ppmv.
Your link is not working for me, but I think Hansen uses 4 W/m^2 to get 1.2C. The formulation I provided also yields 1.2C if 4 W/m^2 is input for dE (the change in emissivity). None the less, all this formulation really does is validate the T^4 relationship between the surface and TOA boundaries, which is specifically offsetting post albedo solar power and is not connected, physically or mathematically, to an amount offsetting GHG absorption.
The physical meaning of the power densities ratio between the surface and the TOA (385/239 = 1.6) is it takes about 1.6 W/m^2 of net surface gain to allow 1 W/m^2 to the leave the system at the TOA, offsetting each 1 W/m^2 of post albedo solar power absorbed. That fact that if you apply this same 1.6 to 1 ratio to +3.6 W/m^2 of GHG absorption and that will restored balance, is trivially true. Because it each case, whether it’s +3.6 of post albedo solar power or +3.6 W/m^2, there is -3.6 W/m^2 TOA deficit that has to be restored. The concept of ‘no-feedback’, which is really measure of the intrinsic warming ability of an imbalance, should be a linear increase in aggregate dynamics. The 1.6 to 1 power densities ratio between the surface and the TOA is a linear increase in aggregate dynamics for post albedo solar power entering, but it’s not for GHG absorption. Prior to an imposed imbalance, total GHG absorption is only about 300 W/m^2, for which it only takes about +150 W/m^2 of net surface gain to offset (or only about 1/2), where an amount equal to the remaining 150 W/m^2 ultimately is flowing from the atmosphere into space.
The properly account for this, you have to cut the instantaneous change of 3.6 W/m^2 in half before it’s applied to the change in emissivity. When this is done, the correct calculation is only about 0.55C for 2xCO2.
This should have said:
“Because it each case, whether it’s +3.6 of post albedo solar power or +3.6 W/m^2 of GHG absorption, there is -3.6 W/m^2 TOA deficit that has to be restored.
Hansen’s paper is here:
http://pubs.giss.nasa.gov/abs/ha02700w.html
Yes, the calculation does (and should) include convection. What it doesn’t include are feedbacks. See the first paragraph in Hansen’s Appendix B.
“I think Hansen uses 4 W/m^2 to get 1.2C.”
Where does he do that? His equation for the RF of CO2 comes from fitting the results to a logarithm. That doens’t “use” 4 W/m2, it’s a calculation from a radiative-convective model.
Unfortunately, the link doesn’t fully work for me. I can get to the PDF document, but can only see the first page. When I scroll to the second page and beyond it’s blank (i.e. it doesn’t load up).
“Yes, the calculation does (and should) include convection.”
Why? That would involve feedback processes and how the system responds to the imbalance. The 1.1K of so-called ‘no-feedback’ is based on the 1.6 to 1 power densities ratio between the surface and the TOA (385/239), where +1.08K equals 5.8 W/m^2 of net surface gain and 5.8/1.6 = 3.6 W/m^2. Or if you use 4 W/m^2, you get about 1.2K or 6.5 W/m^2 or net surface gain and 6.5/1.6 = 4 W/m^2.
Then find the paper elsewhere. It’s a famous paper and is no doubt lying around in lots of places.
Convection isn’t a feedback, it’s a fundamental part of the atmospheric dynamics.
Your calculation takes a result from a radiative-convection model, which already shows the 1.2 C, and shows in another way that the change is 1.2 C. Everything you’ve calculated has already been calculated from the model — that’s where your 3.6 W/m2 number comes from. You’ve gone in a circle, so it’s no surprise you’ve shown what the model already calculated.
“I provided also yields 1.2C if 4 W/m^2 is input for dE….”
Why would you input 4 W/m2, and not 5 or 3?
Because 4 W/m^2 (or really 3.6 W/m^2) is the net absorption increase for 2xCO2. It’s the amount OLR is reduced by the additional GHG absorption.
“It’s the amount OLR is reduced by the additional GHG absorption.”
Right. And it comes from a radiative-convective model.
All you’re doing here is going in circles. You’re taking a result from the model calculation and using it to show the no-feedback temperature change is 1.2 C.
And that model employs the Schwarzschild solution, which conserves energy. That’s what I said long ago.
David A.,
“Right. And it comes from a radiative-convective model.
All you’re doing here is going in circles. You’re taking a result from the model calculation and using it to show the no-feedback temperature change is 1.2 C.
And that model employs the Schwarzschild solution, which conserves energy. That’s what I said long ago.”
And it’s still not correct for the reasons I laid out. Of course all models are required to conserve energy, so I don’t get the point of that. The 3.6 W/m^2 is calculated via atmospheric radiative transfer simulation, and is instantaneous, which means it does not account for how the system responds to the imbalance. Convection is not involved in that calculation, as it’s radiation alone.
The point from the beginning is the 3.6 W/m^2 is only incremental GHG absorption and none of it is new energy being added to the system like post albedo solar power. The atmosphere will re-radiate the absorbed energy both up and down.
Of course convection is involved. Hansen even calls it a “radiative convection model.”
Go back and read the famous 1967 paper by Manabe and Wetherald, the first climate model to successfully calculate the correct surface temperature of the Earth. See Figure 2? It includes a convective adjustment.
http://www.clidyn.ethz.ch/ese101/Papers/manabe67.pdf
See their Appendix 1, “Detail of the method of convective adjustment.”
David,
That has nothing to do with quantifying the incremental increase in IR opacity of about 3.6 W/m^2 due to 2xCO2. That is done by radiative transfer simulation, which for the instantaneous 2xCO2 change, specifically does not factor in any convective changes or responses.
Ice is 3-dimensional, not 2-dimensional. Global sea ice volume is plummeting.
No it is not David.
Since 1979, global sea ice’s trend is -30,100 km2/yr.
The most recent 10 years are 1.9% below the previous 10 years.
David global Sea Ice coverage is clearly shown to be above normal on cryosphere today.
But then again any data that does not conform to what you want it to be will be ignored? That is how AGW theory operates, ignore data that shows it to incorrect which is volumes of data.
What do you mean by “normal?”
You probably mean above some baseline since 1979, but that baseline isn’t “normal,” it’s just a baseline.
Yes, lately global SIE is above the trendline in the last few years, by a good amount. The long-term trend is still downward (and is statistically significant) at -21,600 km2/yr, due to the expansion of Antarctic SIE. The question is, how to explain this in an AGW world? (Probably winds and melting freshwater glaciers.) But it is interesting.
https://www.skepticalscience.com/Has-Arctic-sea-ice-recovered-intermediate.htm
Volume is increasing of late.
Is it statistically significant over such a short interval? (No.)
David
I’m sure you will be disturbed by Joe’s forecast for things to come. http://www.weatherbell.com/saturday-summary-may-16-2015
Has one of Joe’s forecasts ever been right?
He’s a lot more accurate than the alarmists’ predictions or those from IPCC.
But, here’s your chance. What are your predictions for the next two years? Joe gets pretty specific on occasion, so don’t come out with some nebulous “hand-waving”. Give some specific, verifiable forecasts. Since most of us here think you know nothing about climate, prove us wrong.
Here’s just one example of Joe’s poor predictions skills, from 2008:
http://davidappell.blogspot.com/2014/09/six-years-ago-when-joe-bastardi.html
Here’s another:
http://davidappell.blogspot.com/2012/12/warm-november-joe-bastardi-fail.html
And still another:
http://davidappell.blogspot.com/2012/01/another-bastardi-failed-prediction.html
I don’t make forecasts, except that over the long-term the Earth will keep warming.
Trying to make a prediction about climate over a short-term period like 2 years is silly.
We could have predicted you would not make a prediction!
(Please keep the humor coming.)
http://www.bing.com/images/search?q=arctic+sea+ice+volume&view=detailv2&&&id=019E9CCEB4F01F20C5C9FCB7173AFE485D839DFC&selectedIndex=0&ccid=N0IKNtbO&simid=607991873022986362&thid=JN.PFYImSmKA4KGbzm9iKnyCA&ajaxhist=0
IGNORE THE GARBAGE I SENT 11:14 AM I made a mistake.
Salvatore,
The amount of Artic and Antarctic ice doesn’t really matter much, because each is located in areas that receive little Sun and are dark 6 months of the year. Not to mention each are randomly variable from year to year, decade to decade, etc.
Yes, it does matter. This paper found that the decrease in Arctic sea ice in 1979-2011 has led to an albedo decrease, that, averaged over the globe, “corresponds to a forcing that is 25% as large as that due to the change in CO2 during this period.”
K. Pistone, I. Eisenman, and V. Ramanathan (2014). Observational determination of albedo decrease caused by vanishing Arctic sea ice. Proc Natl Acad Sci USA 111, 3322-3326.
http://eisenman.ucsd.edu/papers/Pistone-Eisenman-Ramanathan-2014.pdf
There are effects from the expansion of Antarctic sea ice, too, especially since it is occurring at lower latitudes than Arctic sea ice decreases.
25% as large? Of less than 1 W/m^2? That isn’t much.
Read the paper — it’s not paywalled.
“That isn’t much.”
It’s a decade’s worth of CO2.
25% of ZERO is ZERO.
The decadal change in CO2 forcing is now about 0.2 W/m2.
That’s according to models. It’s also according to observations:
“Observational determination of surface radiative forcing by CO2 from 2000 to 2010,” D. R. Feldman et al, Nature 519, 339–343 (19 March 2015)
http://www.nature.com/nature/journal/v519/n7543/full/nature14240.html
Atmospheric CO2 is NOT a heat source. It does not, can not, bring new energy to Earth’s atmosphere. This is the major reason IPCC models have been consistently wrong.
“Atmospheric CO2 is NOT a heat source. It does not, can not, bring new energy to Earth’s atmosphere.”
Nobody says it does.
“This is the major reason IPCC models have been consistently wrong.”
You have badly misunderstood the science.
“Nobody says it does.”
++++++++
IPCC “science” says it does. IPCC promotes CO2 “radiative forcing”, measured in Watts/sq. meter. They are claiming that then adds to Earth’s energy budget. They are trying to make CO2 a “heat source”.
You have badly misunderstood the science.
Keep the comedy coming, you make fun of yourself better than I can!
“They are claiming that then adds to Earth’s energy budget.”
No, they do not. Just look at any energy budget diagram:
http://www.cgd.ucar.edu/cas/Topics/energybudgets.html
Davy, you are amazing!
You do not understand science, and you do not even understand the pseudoscience you promote!
http://en.wikipedia.org/wiki/Radiative_forcing
And I thought you might be running short of comedy material….
CO2 intercepts some outgoing longwave radiation from the surface, and then sends some of it back downward.
That’s not creating new energy…. Obviously. Climate scientists are well aware of the principle of conservation of energy. and if you look at the energy budget I linked to, you’ll see that it holds.
Davy, Davy, Davy! The more you try to untwist your own twists, the funnier it gets. Read the Wiki link on “Radiative Forcing”. They even quote from IPCC. IPCC “science” is WRONG, yet you fully support it, yet you don’t know what IPCC “science” is!
Does it get any funnier than this?
Typical — you don’t understand the science, but insist that it’s all wrong, and that generations of climate scientists somehow missed something as basic as conservation of energy, which they learned in high school physics.
I can’t take you seriously anymore.
Oh, Davy, “conservation of energy” is only ONE of the things the IPCC “missed”.
And don’t worry, I NEVER took you seriously!
Paul Homewood at ‘Not A Lot of People Know That’ just posted on Arctic sea ice volume and extent. According to PIOMAS the volume AND extent are at the same level they were during 2006 at this time. https://notalotofpeopleknowthat.wordpress.com/2015/05/17/the-arctic-ice-death-spiral/
So David, you really have to reject the source from which you derived your claim that: “The Arctic is losing sea ice about 10 times faster than the Antarctic is gaining it.”
This glob of rock, dirt, minerals, metal, and water is in fact GAINING ice. I’m sure it is disturbing to those such as you that have propagated the Arctic “Death Spiral” mantra.
I’m talking about the long-term trends — the ones relevant to climate change. You’re talking about natural variability, which as present is an upward fluctuation that’s been seen before, and will be seen again.
Comparing one month this year to month in 2006 is simply not how trends are measured. (And in any case, recent months are below 2006’s values.)
Really? Long term? Your statement ”
David A says:
May 15, 2015 at 7:45 PM
The Arctic is losing sea ice about 10 times faster than the Antarctic is gaining it.”
There is NO TREND that shows any such thing in the long term David. It is just plain FALSE in both the long term and short term context.
Why would you not be happy to be proven mistaken about this? To find out that the “Arctic Death Spiral” is not happening? To know now that you have nothing to worry about and that the Polar bears are doing fine?
And oh, BTW, in the short term: “Sea Ice Extent – Day 136 – Antarctica Smashed Old Daily Record By 400,000 sq km” https://sunshinehours.wordpress.com/2015/05/17/sea-ice-extent-day-136-antarctica-smashed-old-daily-record-by-400000-sq-km/
Yes, there are data that Arctic sea ice is melting 10 times faster than Antartic sea ice. I gathered the data and put it here:
http://davidappell.blogspot.com/2014/05/how-fast-is-planet-losing-ice.html
Too funny! I’m beginning to think you Giorgio Tsoukalos.
Do you have data showing otherwise?
I don’t need it since you never showed any that was cited to the source.
My sources are all listed in the table on this post:
http://davidappell.blogspot.com/2014/05/how-fast-is-planet-losing-ice.html
So where’s your evidence?
David your sources are not correct.
Another 6 word reply that gives no reasoning whatsoever. Nice.
http://arctic.atmos.uiuc.edu/cryosphere/
This tell the story for ice and snow coverage trends presently and in the past.
This data shows quite clearly that Arctic Sea Ice is recovering while Antarctic Sea Ice continues at record highs.
Unless this changes David is wrong.
“Arctic Sea Ice is recovering…”
What are you talking about?!? This year’s winter maximum Arctic sea ice extent was the lowest since the satellite record began.
If one goes back to 1975 one will find Arctic Sea Ice was less then today.
Really? Reference?
Salvatore doesn’t reference things. Like this:
http://psc.apl.uw.edu/wordpress/wp-content/uploads/schweiger/ice_volume/BPIOMASIceVolumeAnomalyCurrentV2.1.png
David A,
Thank you for the references, in this thread and elsewhere.
http://www.eoearth.org/files/153301_153400/153362/table_1.jpg
Antarctic Sea Ice increases are clearly compensating for any albedo changes due to Arctic Sea Ice amounts.
Ummmm…not entirely. Even with the increases in Antarctic sea ice due to wind pattern changes and the freshening of the waters around Antarctica from melting land ice, the global ice coverage is still about one million square km less than twenty years ago.
But the Antarctic sea ice extrent is increasing at a lower latitude than Arctic sea ice extent, meaning it receives more sunlight on average.
So it could well be that global sea ice albedo is increasing, but that would require some careful analysis, which of course Salvatore did not offer.
But the Antarctic sea ice extent is increasing at a lower latitude than Arctic sea ice extent, meaning it receives more sunlight on average
David which is why it is more effective in increasing the albedo, not less effective
That’s what I wrote: “it could well be that global sea ice albedo is increasing….”
David I know my mistake. David I think answers will be coming in the next few years.
Keep up the good fight. This is interesting and different points of view are what makes this so great.
IT WOULD BE BORING IF WE ALL AGREED.
Salvatore, people can disagree with out being disagreeable. THAT’S interesting. (Appell is not…)
Paul Homewood did the work a while back,yes the Albedo effect is growing:
Albedo Changes – What NSIDC Don’t Want You To Know
“We often hear it said that the loss of Arctic sea ice is more important than gains in the Antarctic.
I saw it again the other day, when some idiot made a comment to the effect that “Arctic summer = Antarctic winter” – his train of thought apparently being that, in the Arctic summer, the sun is shining and therefore less ice means less sunlight being reflected back into space. At the same time, it is winter in Antarctica, and therefore the albedo effect there is not relevant.
We should not be surprised that people make such stupid comments, as NSIDC seem equally confused. In their 3rd October press release, they talk of:”
https://notalotofpeopleknowthat.wordpress.com/2014/01/10/albedo-changes-what-nsidc-dont-want-you-to-know/
http://arctic.atmos.uiuc.edu/cryosphere/IMAGES/global.daily.ice.area.withtrend.jpg
Here is the data it shows global sea ice currently above average and it has picked up since 2006 /2007.
I would say currently global sea ice values are closer to the top of the range then the bottom of the range since 1979.
Gentlemen,
I find the science and links you offer interesting, both for the information and the indirect information – how much time and money is spent keeping up with such things.
What is curious is how concerned many seem to be with what is known about a 30 or 40 year time span; a blink of an eye, so to speak. So, let us presume that the ice sheets continue to melt at the estimated rate which gives us the 1.5 mm to 2.9 mm rise in ocean levels we see bandied about. At that rate it would take 10,000 more years for all the ice to melt and earth to leave the ice ages it has found itself in the past 2.8million years. Lucky for us, Salvatore would be wrong.
On the other hand, it seems as if that rate of melting is extraordinarily slow, on a human scale. In 100 years the oceans will come up 7 or 8 inches. In 200 years, 16 inches. Can we deal with that or, should we pretend something we can do, some sacrifice we can make in our industrial lives, will stop the oceans from rising.
Note: in order for that to happen we will have to have more freezing; more snow and ice. We will be able to grow less food and many people will die. So David, tell me, is that what you are wishing for?
Lewis,
Unfortunately, just a few inches of sea level rise and increases in rainfall means an enormous increase in flooding, affecting a large fraction of humanity. The mitigation costs will be in the tens of trillions of dollars.
I think the main point of all this argy-bargy (of Scots origin for you Americans), is that the climate change issue is simply too complex and chaotic to allow any certainty about predictions.
The interesting aspect of this, for me, is why so many people insist on being certain (the AGW alarmists) in the face of such clear uncertainty within the context of the true scientific method.
Is it possible that many scientists, including climatologists, are reluctant to speak out, regarding the undeniable uncertainty, because they think that a switch to renewable fuels will eventually be necessary, as the world population increases and develops towards an American standard of living?
The nature of our economies is such that we so often tend not to prepare for future problems. When times are good, we tend to get into an Alice-in-Wonderland state of mind and kid ourselves that the economic boom will continue forever. Then the crash occurs.
In light of this, is it not merely sensible to spend a portion of our current fossil-fuel energy on the development of alternative sources of energy, in order to avoid a future, world-wide, massive recession, due to a shortage of fossil fuel?
What is the best way of achieving this? My experience of politics in democracies, leads me to believe that people are often not receptive to sensible, rational and practical proposals to make sacrifices in the present in order to bolster future security.
If a government, when delivering the annual budget, were to set aside a billion or two dollars for research into renewable energy, on the basis that fossil fuels will become ridiculously expensive, due to scarcity, in 50 years time, the public wouldn’t buy it.
However, if the same public is scared by alarmist reports that the CO2 emissions from our fossil fuels will destroy our way of life and cause mass destruction due to a radical change in climate, then they might buy it.
To motivate people, one often has to use exaggerated scenarios to create alarm.
Vincent, you just gave the store away. You know best, others have to be manipulated.
Vincent, that just sounds like bad governance to me… What if agw doesn’t pan out? People will forget all about the quest for renewable fuels. The best way is the honest way. State the problem as is. That way policy won’t be effected by changes in the weather (that is global cooling). Plus, i’d hate to see governments manipulating the masses with half truths and lies. That can’t be healthy for society…
I really enjoyed your comment here. It’s SO well written. (I wish that i could write like that) One last thing i’d like to add is in response to your statement, “then the crash occurs” (your reference to our economies) There is an old saying, “the federal reserve: causing recessions since 1913”. Crashes don’t just ‘occur’. The u.s. federal reserve has this dopey policy of stalling the u.s. economy when the unemployment rate here gets down to 4%. Keeping people poor means they spend less thus ‘demand inflation’ is held in check. (this is unnecessary as the growth of personal wealth must exceed that which inflation takes away to have a growing economy) With the economy stalled out, sooner or later a drag on the economy pops up and viola(!), we get a recession. This has been happening for so long that folks just think it’s just “the nature of our economies”; it’s not…
fonzarelli says:
May 19, 2015 at 6:16 PM
Vincent, that just sounds like bad governance to me… What if agw doesn’t pan out? People will forget all about the quest for renewable fuels. The best way is the honest way. State the problem as is. That way policy won’t be effected by changes in the weather (that is global cooling). Plus, i’d hate to see governments manipulating the masses with half truths and lies. That can’t be healthy for society…”
Fonzarellie,
If it becomes clear and undeniable, that in 20 years time, for example, the average global temperature is no higher than it was in 2015, and perhaps even slightly lower despite CO2 levels being 450 ppm, I’m sure there will continue to be scientific disputes regarding the causes of such a halt in the global warming trend, or the causes of a slight cooling trend.
After all, we still don’t know for certain what were the causes of the Little Ice Age, do we?
Also, in 20 years time, I imagine it could be possible that Solar energy might have become the most efficient method of producing electricity. I don’t think anyone would complain about that.
The attractive thing about solar power is we can use lots of vacant surfaces which are free, or use arid, desert lands which are not being used for anything else.
In Australia, we’ve just recently completed the first solar farm which floats on water. It is claimed that the solar panels are 57% more efficient because the water mass keeps them cool.
http://www.adelaidenow.com.au/news/breaking-news/first-floating-solar-system-turned-on/story-fni6ul2m-1227326835295
Here’s an extract: “On a broader scale, the technology is suitable for any body of water,” Ms Whiting said.
“We can cover large reservoirs, hydro dams, treated waste water … there’s just such a large number of applications.”
Yeah, but still, wouldn’t it be better (and perhaps ultimately more effective) if governments came out and said that we’re eventually going to run out of fossil fuels so we have to start conserving and diversifying NOW? You may be ultimately right. The important thing, certainly is results. AND good intentions (as i’m suggesting) don’t always produce good results. I just think that there are too many negative consequences in doing things the way that you’re suggesting…
It would certainly be better if the populations of most countries were more rational and logical, and more receptive to the general good of humanity as a whole.
But the reality seems to be that each country is driven to achieve, or at least maintain, its economic advantages compared with other nations. We live in a competitive world.
I can’t see any democratic government being re-elected on the grounds that it will introduce austerity measures to prepare for a predicted shortage of fossil fuels in, say, 50 years time, and set aside billions of dollars for research into alternative methods of generating energy.
Scaring the wits out of people just might be more effective.
Vincent,
You suggest it would be preferable if prople proved more rational and logical, but then appear to lack such skills yourself. The earth’S HYDROCARBONS are not all fossil fuels. The most abundant hydrocarbon fuel methane, CH4, is a primarily a VOLCANIC gas and and found throughout the earth’s crust in increasing quantities. It forms under enormous heat and pressure approximately 100 miles beneath the terrestrial from three common earth ores iron oxide, calcite, and water as first theorized by astrophysicist Thomas Gold and confirmed experimentally using lasers by Sandia Labs. YOU DON’T NEED TO SCARE THE IGNORANT OUT OF THEIR EQUAL CLAIM TO THE EARTH’S RESOURCE.
Have a great day!
Please excuse my typing errors in the previous post. I’m not used to typing from a Galaxy 3 phone.
Have a great day!
The test is coming now. We shall see what the global temperature trend will do from this point on. If it declines in the face of rising CO2 concentrations even as little as .1c -.2c over the most recent 30 year trend(1980-2010) ,AGW theory will be proven wrong, solar will be in play to a much greater extent.
This would take into account the PDO/AMO phase, ENSO variability and volcanic activity, all of which have been the factors that have governed the temperature trend against a backdrop of increasing CO2 concentrations and high solar activity for the past century. CO2 and Solar acting in concert on their possible effects on global temperatures up to year 2005.
From 2005 through the present and going forward CO2/SOLAR have been acting in opposition to one another and we shall see if the trend in global temperature goes down taking into account the PDO/AMO phase, ENSO and VOLCANIC ACTIVITY.
Will the trend post 2015 be .1c to .2c or greater lower then it was from the average global temperature from the period 1980-2010? If it is, then solar is going to have to be realized as a player and CO2 as a non player.
NOTE – a strong case can be made for solar /volcanic activity correlations and to a lesser degree for ENSO correlations, which is part of the case to be made for solar/climate connections.
I will add I am quite confident the global temperature trend going forward will be down. To what degree is the question.
I might add it is not total TSI that tells the whole story because UV light variations act in opposition to visible light and obscure the total variability of solar activity due to the opposition of the two mitigating TSI total change.
3500 days! What about the hurricanes in the Pacific Ocean? There have been quite a few in that time span hitting the Philippines, Bangladesh, Australia, Japan, etc.
“The most abundant hydrocarbon fuel methane, CH4, is a primarily a VOLCANIC gas and and found throughout the earth’s crust in increasing quantities.”
JohnKL, That might be true, but you seem to have overlooked the environmental considerations, which is not very rational of you.
To determine the true cost of any particular type of energy, one should take into consideration all externalities, including environmental and health consequences. Having done this, one might draw the conclusion that the cheapest fuel is the best, except there are ethical issues concerning matters of health, which cannot be always be quantified in terms of money.
The following article addresses the environmental and health concerns of natural gas.
http://www.ucsusa.org/clean_energy/our-energy-choices/coal-and-other-fossil-fuels/environmental-impacts-of-natural-gas.html#.VV4zUvmqpBc
As solar PV panels gradually become cheaper and more efficient, there will come a point when the unsubsidised cost of solar generated electricity will be no more expensive than electricity from gas and coal.
When the health and environmental costs are taken into consideration, solar generated electricity could be become the cheapest form of energy by far, with the advantage of also being essentially an unlimited source of energy because the sun is always shining somewhere.
Without the scare of AGW, such development of solar generated electricity would probably not have taken place, nor the continuing development of the electric car. That was my point.
A scare based upon a future shortage of fossil fuels and gas could not be effective for a variety of reasons, one of which you’ve mentioned, the abundance of CH4. There is also an abundance of Methane Hydrate which has just recently begun to be mined, with new concerns about the dangers of this form of the gas.
Great discussion last dozen posts.
Curry has an excellent discussion now underway regarding research and agendas and ideology.
http://judithcurry.com/2015/05/25/scientific-integrity-versus-ideologically-fueled-research/
Make no mistake, the skeptic/sceptic folks and the outright “deniers” do a lot of cherry-picking of the available data. Of course, the GISS and other agencies keep adjusting the original raw data, so what should we all use? The thing that hits me so often is the use of the cherry-picked data by the prophets of doom.
Seems to this old engineer that the CAWG folks more closely resemble ideologues than the scientists that doubt all climate change is due to human influence on the planet.
– I only know of one person that denies all human influence upon our planet’s ecology or even climate. The question is to what extent?
-I know of nobody that denies the climate is changing and that it got a bit warmer the last 100 – 200 years ( I am only in 70’s, but I can’t really feel much change).
– The CAGW ideologues seem to attack all folks that have even a small problem with the results of their research, cause and effect evidence, mentioning the actual climate changes since 14,000 years ago before humans used lottsa oil and gas and coal, and most problematic – the current “hiatus”. Shoot, they even insist upon that term because they are convinced the Earth will continue to warm in “x” years or decades or whatever. BEAM ME UP!! I do not see this behaviour by the skeptiks, the lukewarmer or the actual “deniers”.
The Fonz and I see that amazing resilience of the folks in south Louisiana after storms and storms and more storms. We also see their resistance of excessive government influence and regulation. Many folks cannot pay for insurance because the government has dictated rates that the insurance companies cannot refute.
As a yute I saw most all “getaway” places on the bayous and in the marshes on stilts. No slabs. Why was that? I then noticed new houses built in the mid fifties with exposed earth at the edge of their slabs. The foundation repair folks made a lotta money, heh heh. My old homestead on 3 foot concrete pilings preserved our floor during Katrina’s levee flood and for over 80 years it made kept termites from bulding hidden tunnels up to the wood floor joists. Guess those old folks knew something before DDT was invented.
As I sign off, I wonder what the big deal is with the CAWG ideologues. I would prefer a few degrees warmer up in my mountain cabin, and i can easily add a few inches to my floor here in Florida. If folks want to live right on the bayou or worse, the coast, they had better be prepared and have a sense of humor. Apparently, the dumbasses ( dumb masses) don’t know or don’t care or don’t understand what all the hoopla is about “climate change” , ya think? The folks in southern Louisiana, Mississippi, Alabama, Florida Panhandle and southeast Texas know and understand their risks to have their way of life and to hell with the government rules and interference.
Steps off soapbox….