
 Home/Blog
NOTE: This is the first montly update with our new Version 6.0 dataset. Differences versus the old Version 5.6 dataset are discussed here.
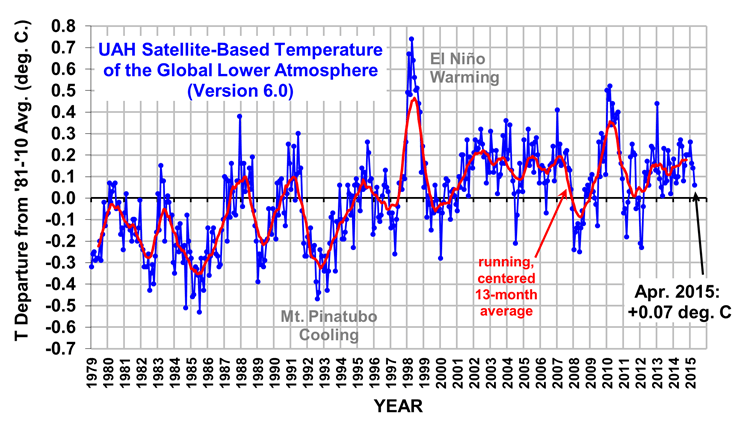
The Version 6.0 global average lower tropospheric temperature (LT) anomaly for April, 2015 is +0.07 deg. C, down a little from the March, 2015 value of +0.14 deg. C (click for full size version):
The global, hemispheric, and tropical LT anomalies from the 30-year (1981-2010) average for the last 4 months for the old Version 5.6 and the new Version 6.0 are:
YR MON GLOBAL NH SH TROPICS
v5.6
2015 1 +0.351 +0.553 +0.150 +0.126
2015 2 +0.296 +0.433 +0.160 +0.015
2015 3 +0.257 +0.409 +0.105 +0.083
2015 4 +0.162 +0.337 -0.013 +0.074
v6.0
2015 1 +0.261 +0.379 +0.143 +0.119
2015 2 +0.157 +0.263 +0.050 -0.074
2015 3 +0.139 +0.232 +0.046 +0.022
2015 4 +0.065 +0.154 -0.024 +0.074
The global image for April, 2015 should be available in the next several days here.
The new Version 6 files, updated shortly, are located here:
Lower Troposphere: http://vortex.nsstc.uah.edu/data/msu/v6.0beta/tlt
Mid-Troposphere: http://vortex.nsstc.uah.edu/data/msu/v6.0beta/tmt
Tropopause: http://vortex.nsstc.uah.edu/data/msu/v6.0beta/ttp
Lower Stratosphere: http://vortex.nsstc.uah.edu/data/msu/v6.0beta/tls


