
 Home/Blog
We discovered there were several days during June when communication problems prevented the transfer of some of the raw satellite data to our computer. This is an update of the June 2015 numbers with the missing satellite data included.
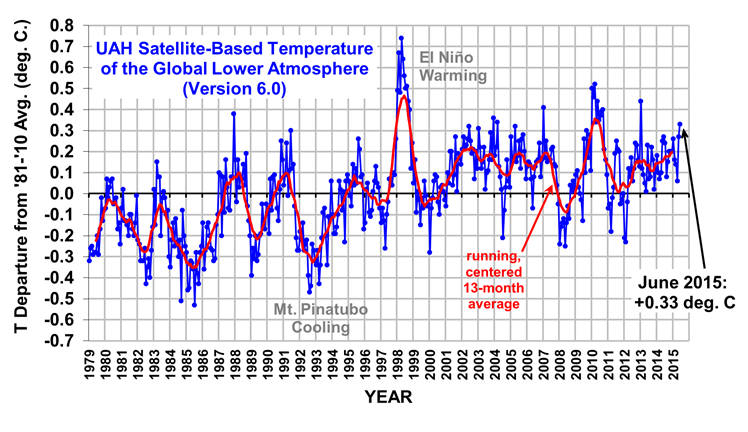
The Version 6.0 global average lower tropospheric temperature (LT) anomaly for June, 2015 is +0.33 deg. C, up somewhat from the May, 2015 value of +0.27 deg. C (click for full size version):
The global, hemispheric, and tropical LT anomalies from the 30-year (1981-2010) average for the last 6 months are:
YR MO GLOBE NH SH TROPICS
2015 1 +0.26 +0.38 +0.14 +0.12
2015 2 +0.16 +0.26 +0.05 -0.07
2015 3 +0.14 +0.23 +0.05 +0.02
2015 4 +0.06 +0.15 -0.02 +0.07
2015 5 +0.27 +0.33 +0.21 +0.27
2015 6 +0.33 +0.40 +0.26 +0.46
Notice the strong warming in the tropics over the last 2 months, consistent with the strengthening El Nino in the Pacific.
The global image for June, 2015 should be available in the next several days here.
The new Version 6 files, which should be updated soon, are located here:
Lower Troposphere: http://vortex.nsstc.uah.edu/data/msu/v6.0beta/tlt
Mid-Troposphere: http://vortex.nsstc.uah.edu/data/msu/v6.0beta/tmt
Tropopause: http://vortex.nsstc.uah.edu/data/msu/v6.0beta/ttp
Lower Stratosphere: http://vortex.nsstc.uah.edu/data/msu/v6.0beta/tls


