
 Home/Blog
While the world frets over global warming, sea ice amazingly persists as far south as James Bay in Canada–not much farther north than Maine–as seen in this NASA color satellite image of swirling ice patterns from yesterday, August 8, 2015 (click for full size):
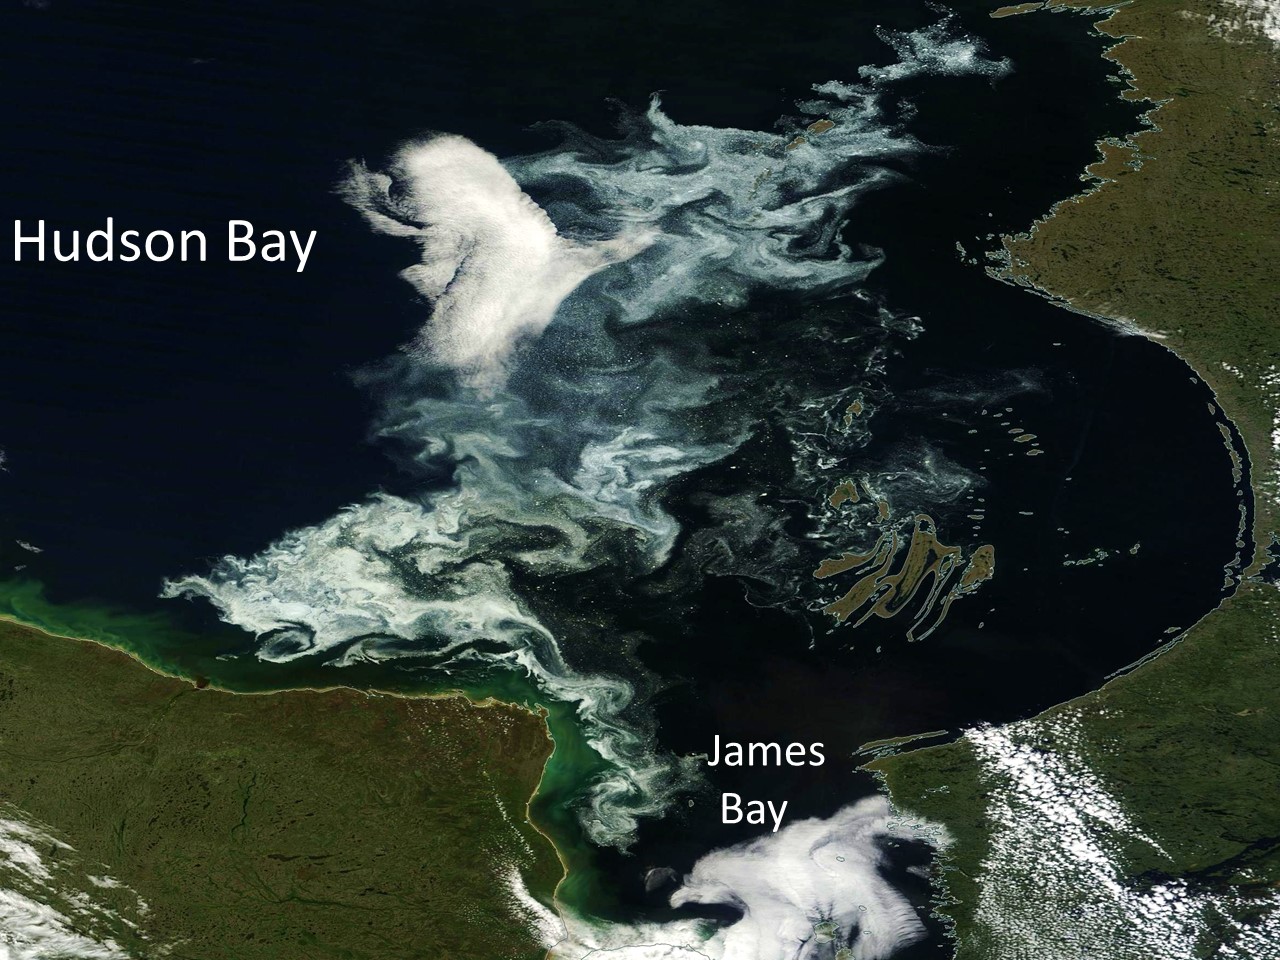
NASA MODIS image of sea ice persisting as far south as James Bay (Canada) on 8 August 2015.
Two weeks ago it was reported that the worst mid-summer ice conditions in 20 years was preventing the routine delivery of supplies by ship in eastern Hudson Bay, and a Canadian ice breaker had to be called in to help.


