
 Home/Blog
There is no question that the flooding in South Carolina is exceptional, even historic.
But a once on 1,000 year event? Sorry, but there is no way to determine that…there are simply not enough rainfall statistics over a long enough period of time to establish such a claim.
But we do have information on previous floods over the last 100 years or so. So, let’s look at how the current event compares.
The greatest multi-day rainfall reported on the CoCoRaHS cooperative rainfall monitoring website was 27 inches in Columbia, SC. The Congaree River crested at 31 ft. there on Sunday:
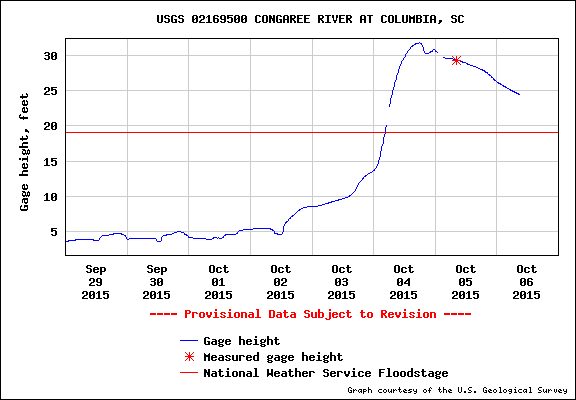
Congaree River gage height at Columbia, SC.
Here’s a photo taken about the time the river crested:
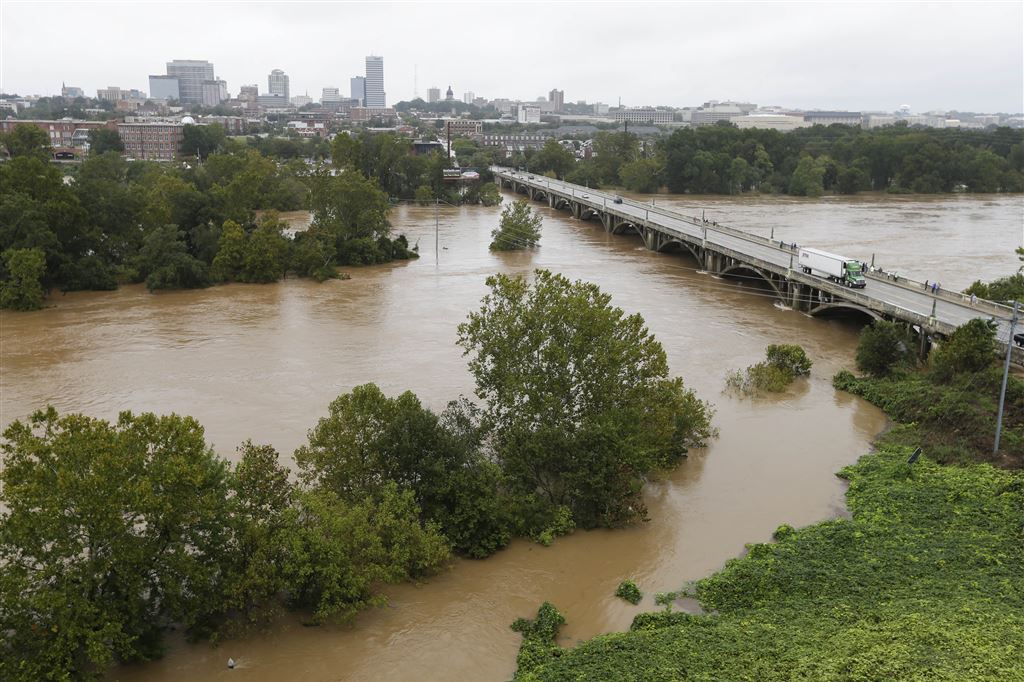
Photo of Congaree River, Columbia, SC, Oct. 4, 2015, taken about the time of cresting.
Now, for comparison, take a look at a bridge over the Congaree River during the record flood of 1908, when the river crested at 40 ft…about 9 ft. higher than the current flood event:
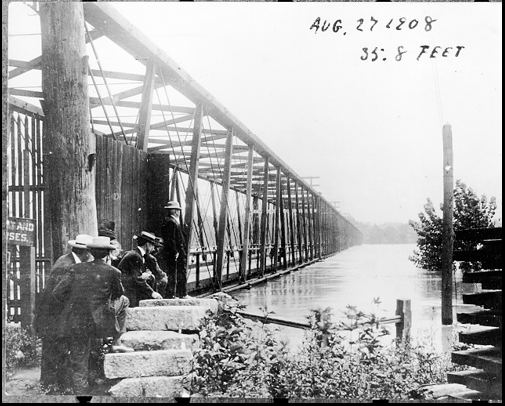
Congaree River bridge in Columbia, SC, during the 1908 record flood event.
Not to discount the misery and likely billions of dollars of damage caused by the current event, but when someone claims that a weather disaster is 1 in a 1,000 year event, they need to back it up.
Unfortunately, there seems to be an trend toward classifying events as “1 in 1,000 years”, when there is no way of knowing such things. This is especially true for floods, where paving of urban and suburban areas causes increasing runoff, making river flooding worse for the same amount of rainfall. This is a big reason why flood events have gotten worse in the last 100 years…it has nothing to do with “climate change”.
For some areas the current flood is no doubt a 1 in 100 year event, or even worse. But remember, it is perfectly normal to have a 1 in 100 year event every year…as long as they occur in different locations.
That’s how weather records work.


