Models vs. Observations: Plotting a Conspiracy?

November 3rd, 2015 by Roy W. Spencer, Ph. D.

John Christy and I received an email today from Marcel Crok, who presented our satellite observations-vs-models graphs to the Dutch version of the American Physical Society (APS).

He said there was considerable push-back about the way we plot the data…not from the society itself, but from global warming activist bloggers.

I’ve heard these objections before, and mostly ignored them as uninformed and lame, since I’ve never heard one from an actual climate scientist.

But apparently it’s worthwhile to address the objections, since they seem to be lurking out there in the blogosphere.

Marcel summarized the objections he heard as follows, where “they” refers to us (Spencer & Christy):

1. They shift the modelled temperature anomaly upwards to increase the discrepancy with observations by around 50%.

2. Using a four year baseline from 1979-83 shifts UAH down lower compared to the surface record.

3. Why did John Christy use a four year baseline period instead of a 30 year baseline as is usual?

4. One other trick played in the Spencer/Christy graph is to start all of the models from the same point. That’s not what is done in practice – they are run-up over a period of time and and have a distribution along the entire period.

5. The baseline Christy used 1979-1983 is a 5 year period, it includes 79,80,81,82 and 83. It’s basically the first point on his running 5 year mean. Of course that ISNT the 5 year average centered on 1983. It’s the average centered on 81. So Christy’s graph is shifted 2 years to the right.

These complaints are all interrelated, and are mostly variations on the same objection.

Let’s start with one of our graphs Marcel presented (this isn’t exactly the same as the one he presented, but it would cause the same objections he encountered):

CMIP5-90-models-global-Tsfc-vs-obs-thru-2013

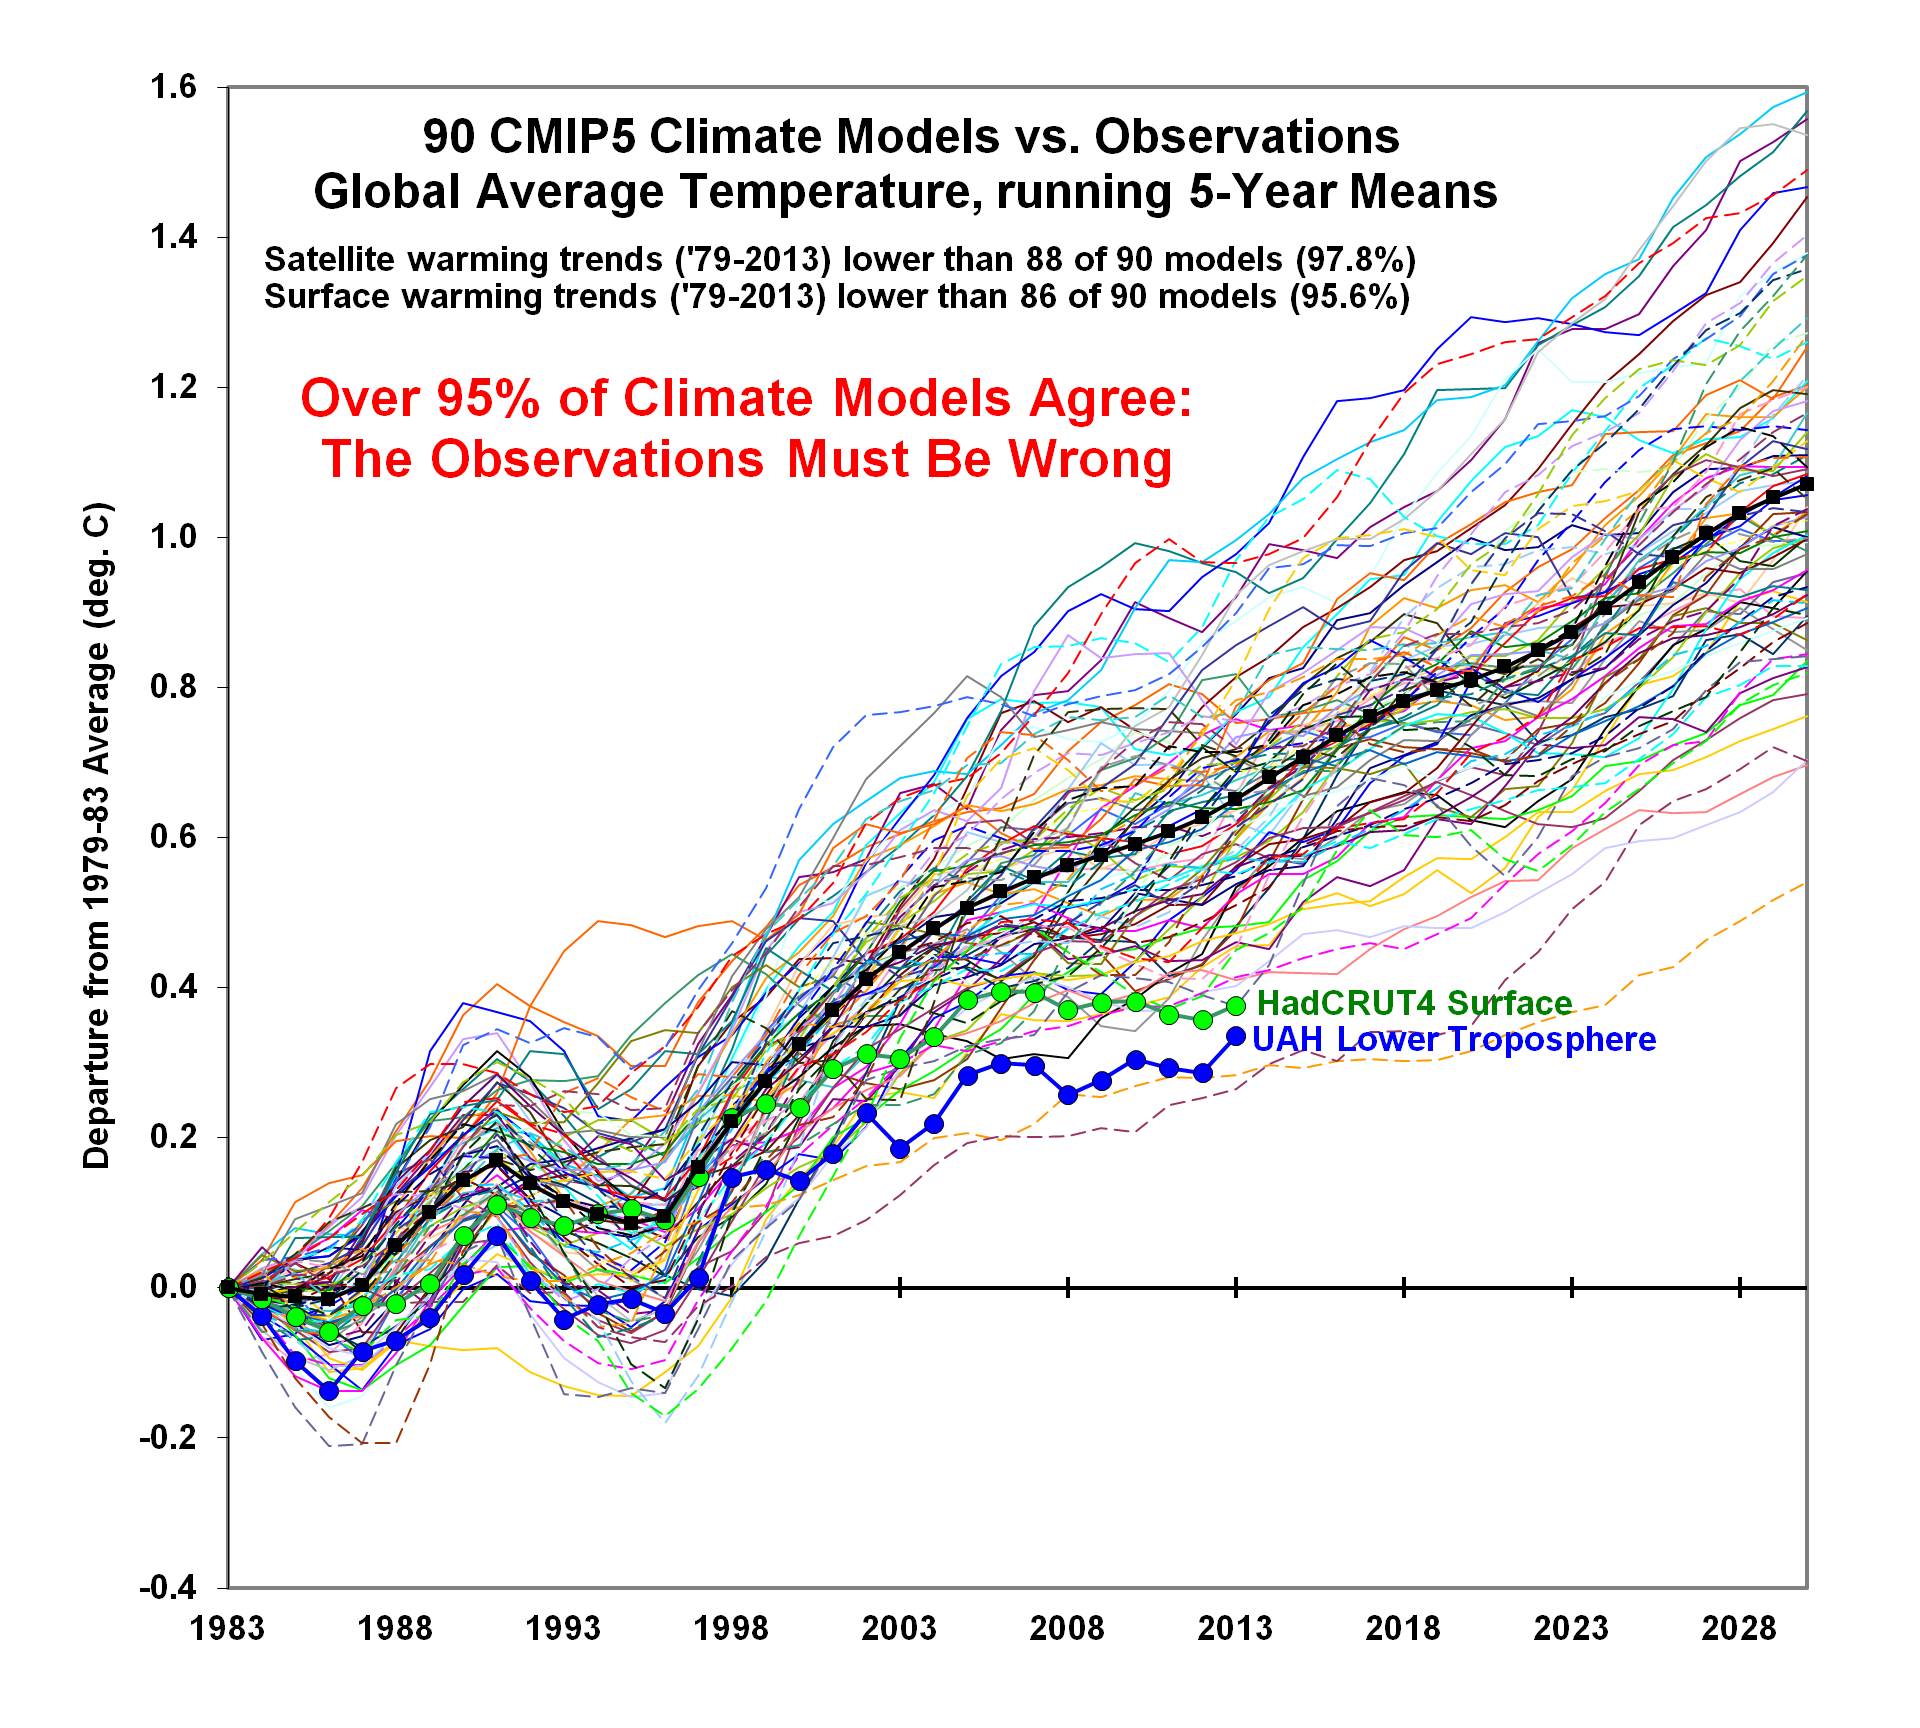
Now, see the text on the graph about how the warming *TRENDS* are almost always greater in the models than the observations?

Well, the difference in trends between models and observations is not affected by any of the 5 objections listed above.

It doesn’t matter how you plot the data with vertical offsets, or different starting points: these issues do not affect the trends, and trends are probably the single most important statistical metric to test the models against observations.

The vast majority of the models have greater warming trends than the observational data show. How members of a Dutch “Physical Society” would not know any of this is beyond me.

Beyond this overriding issue which make the 5 objections moot, I will still answer them (in sequence, see above) because John Christy and I believe that the way we plot the data is the most physically meaningful and the most defensible.

1. We do NOT shift the models upward to enhance the discrepancy with the observations. They diverge upward when starting at the same initial point: the 1979-1983 average (the first 5 years of the satellite record).

2. See #1.

3. The anomalies ARE relative to the same 30-year baseline. But when you plot the results, and the models have such a different warming trend, you then must decide whether to plot just the anomalies (which would have the models too COLD early in the record, then too WARM late in the record), or have them all start the “warming race” at the same time…like we did…relative to their respective 1979-1983 starting temperatures.

4. See #3.

5. Shifting of the year labels on the graph by 2 years has no impact on the discrepancy between models and observations.

I hope the above helps to clarify why we plot the model-vs-observations comparisons the way we do.

NOTE: The above has been edited to better reflect who Marcel Crok received objections from.


208 Responses to “Models vs. Observations: Plotting a Conspiracy?”

Toggle Trackbacks

  1. http://www.longrangeweather.com/images/gtemps.jpg

    This chart is an illustration of when they say a picture is worth a 1000 words and this shows CO2 has next to no effects on the global temperature trends up till today.

    As I have said despite high to moderate solar activity due to this weak but still a solar maximum, no major volcanic activity this century ,a pretty strong current El Nino taking place, CO2 concentrations continuing to increase, Low Arctic Sea Ice values, cloud coverage I think lessening but not sure of this one, DESPITE all of this the global average temperature trend has failed to make any additional progress to the upside post 1998.

    My argument is what is going to happen to global average temperature trend when many of the factors I just mentioned favor cooling rather then warming not to mention , all this against the gradual climatic drivers which are in a cooling trend post the Holocene Optimum those being Land /Ocean arrangements , Milankovitch Cycles and the weakening Geo Magnetic Field.

    I will tell you the answer which is this rather warm period of the global average temperatures is coming to a rather sudden end and it will be before this decade is through.

    • Steve Ridge says:

      Your graph from Cliff Harris is based on the bible rather than any proxy, such as ice cores, pollen studies, tree ring studies, etc…

      It is unpublishable in a science journal and will never be found in a university library except as a religious or sociological curiosity.

      There’s simply no legitimate reason to prefer this depiction over something published by actual paleoclimatologists.

  2. As far as the observations of global temperatures the one that have not been manipulated show the climatic models are way off. This of course is going to continue get worse and worse with time.

    I just do not know when AGW enthusiast will throw in the towel.

    My confidence in what the global temperature trend will do in response to certain low average value solar parameters being met and the important associated secondary effects is very high, my bigger worry is will these low average value solar parameters be attained and if they are will the duration be sufficient? I think yes and yes but the patience is growing thin as this solar activity seems to hang on and on although it is weakening some of late.

  3. Richard says:

    OK. But one question: While the “models” do very poorly as a whole, aren’t there 2, 3, or 4 models that actually do a moderately ok job? It’s hard to tell in the spaghetti graph, but a couple lines seem to track the satellite record a bit.

    1) Getting rid of the bad spaghetti, how well do the “good” models perform?

    2) Is there something about the 2, 3, or 4 good models that differentiates them from the bad bunch?

    • bob sykes says:

      Thank you, Richard. I asked exactly the same question the last time the spaghetti chart was published. I’m still waiting for a reply.

      On another site (and not in response to me) it was suggested that the few models that do follow the data have a number of freely adjustable parameters that are continually updated to match the data.

      • yes, there are a few models that just happen to do much better…the question is, Why?

        There are 2 basic possibilities (assuming the models actually conserve energy, which I’m not convinced of):

        1) those few models have temporary cooling due to internal climate variability, which eventually goes away as strong warming resumes. This is the possibility that model supporters would use to say the observations are undergoing a temporary cooling influence, and strong warming will inevitably return.

        2) the real climate system actually has low climate sensitivity, and eventually there will be no models close to the observations because the real climate system will continue with little warming.

        I tend more toward the second possibility, because we have published a time dependent energy balance model with observed ENSO activity as an “internal forcing”, and get a climate sensitivity well below all of the models.

        • Gunga Din says:

          “A few” out of the, how many?
          The problem is that we’re being asked, at times forced, to turn our wallets and more over to the policies based on the “many” that are wrong.

        • richard verney says:

          Yes. But if one looks at the two coolest running models, it will be seen that they project rapid warming post 2018. If this rapid warming does not occur, by the time AR6 is being finalised in 2019, and shortly after it is published, by 2020/1 it will be seen that all these models are well off target.

          It appears to me that unless there is rapid warming between now and 2019, all the models will be outside their 95% confidence bounds when AR6 is published. how will the IPCC deal with that?

          There is no good scientific reason not to immediately get rid of the models that show the greatest amount of warming but there is a political reason why this is not done. That is because the IPCC presents some consolidated average of the model runs as their projection and if the high running models were taken out of the conglomeration then the resulting average would be considerably lowered and it would be impossible to claim a high Climate Sensitivity for CO2 (ie., say above 3degC, perhaps even above 2.5degC). the IPCC does not want to paint a picture that the worse case scenario is an upper region of say 2.5degC.

          Coupled to this is the fact that should the current strong El Nino just produce a temporary blip in the record showing late 2015/early 20166 to be warm, but then cancelled out by a following La Nina, and should in these circumstances the ‘pause’ continue into 2019, there will be ever more papers suggesting ever lowering Climate Sensitivity; the loner the ‘pause’ the lower Climate Sensitivity must be. Last time round (AR5), the IPCC essentially ignored the then recent papers suggesting Climate Sensitivity below 2degC. It will not be so easy for the IPCC to do the same this time round, and many papers are likely to suggest a figure for Climate Sensitivity in the region of 1.5 or below.

          There are a lot of headwinds being faced by the IPCC in the coming few years unless there is a step change in temperatures coincident with the current strong El Nino, just as there was a step change coincident with the Super El Nino of 1997/8. results

      • Steven Mosher says:

        “1) Getting rid of the bad spaghetti, how well do the “good” models perform?

        2) Is there something about the 2, 3, or 4 good models that differentiates them from the bad bunch?

        WRT 1: They perform pretty well as you can see.
        2: The is no one feature that all share.

        the funny thing is this issue is always ignored. from one perspective people want you focusing on the mean of all models
        and from the skeptical position, they want to ignore that some
        individual models perform better.

        • David L. Hagen says:

          Steven Mosher re “some individual models perform better”
          1) Then apply the scientific method and reject 95% of models that do NOT perform well.
          2) Why not call out and deal with the severe Type B systemic warming bias?
          3) Focus all funding on say three that DO better.
          4) Look at the stochastic variations. The “good” models still do poorly.
          5) With numerous fittable parameters (~100+?) why do we not just have a futile curve fitting exercise? cf John Von Neuman:

          With four parameters I can fit an elephant, and with five I can make him wiggle his trunk

          • richard verney says:

            None of the models perform well, and that is the reason why they produce projections not predictions.

            But there are only 4 or 5 that are reasonably close to reality but I suspect that that is by chance, and not because they have got the physics right including an appropriate level of sensitivity for Co2 and for aerosols.

            Have a look at my above post. IF (and that is a big IF) the ‘pause’ continues into 2019/20 all the models will be outside their 95% confidence bounds. Presently there are only 2 models running cooler than the satellite data and these project rapid warming by 2018 so by 2019/20 the divergence between reality (assuming the ‘pause’ continues) and model outputs will be even more stark, and will cover all the models in Dr Spencer’s plot

    • Bart says:

      OK but, isn’t this the Texas Sharpshooter fallacy?

      “The name comes from a joke about a Texan who fires some gunshots at the side of a barn, then paints a target centered on the biggest cluster of hits and claims to be a sharpshooter.”

      Just because we can tweak some parameters to produce a vague resemblance does not tell us that the model is realistic.

      • Doug Lampert says:

        For one thing, if the models include random factors, which they should, then some model runs will include things like major volcanic eruptions or massive solar minima.

        If the “good” models are based on runs that assumed a major factor not actually present, then they’re not really good models. I don’t know that this is the case, but as a modeler it makes sense to me.

        The reason for using multiple models (rather than the one model you actually think is closest to correct), is precisely to provide error bars that include various variations and random factors. If there had been a big volcano or something similar, and the climate was on the bottom of the model range, that might well say the models were fine, even if the graph looks exactly like it does.

        But there’s really no good reason for us to be at the bottom of the model range, so the fact that we’re pretty well outside their 95% confidence level says there’s probably a problem with the models.

        • mpainter says:

          There’s a problem with the most fundamental assumption: climate sensitivity. They will never address that problem because then there is no problem with AGW and then funding, jobs, livelihoods, everything goes POOF! and vanishes. And then there is the sacred cause. The flame must never even flicker. Yep, there’s a problem.

  4. Andre says:

    And while you’re at it, Roy, could you please indicate (link to) the origin of the model data, so that we can replicate them for the activist bloggers?

    thanks

    • John got the monthly- and global-average pressure level temperatures from the KNMI Climate explorer, run by Geert Jan van Oldenborgh. those then have to be weighted appropriately to match the satellite weighting function. I don’t know whether Geert still has those data online or not.

      The alternative is to get the CMIP5 model data from
      https://pcmdi9.llnl.gov/projects/cmip5/

      …and good luck with that, unless you have a high datarate connection, programming skills, and lots of patience. We found it nearly impossible to get the data…you have to accept hundreds of model data variables, even if you only want to use a few.

      • ehak says:

        That is just an incredible answer. Are you suggesting that you use some kind of TLT-weighted model run results and pretend that it is surface-temperaures? After all you use surface-temperatures in the plot.

        Just incredible.

        Of course: no one can check your weighting either. No description or source code. Obscurity by design. Which weighting by the way? Old TLT or the new TMLT?

        Another point: If you are to compare hadcrut with models you will have to generate a mask for the model data that corresponds to the coverage in hadcrut. You could of course avoid that by using Cowtan and Way.

        But for some reason that was not done.

        • Hans Erren says:

          Using cowtan and way is simply comparing one model (space extrapolation) with another (time extrapolation).

          Better compare lower troposphere cmip5 model results with lower troposphere observations
          https://klimaathype.files.wordpress.com/2015/11/spencer_upd2014.png

          • ehah says:

            Space extrapolation is done in UAH. Which of course is much better infilling than using the global average for the infilling of areas with no coverage. So why is that ok in UAH but not in gistemp, Best, Cowtan and Way.

            Please explain.

        • Roy W. Spencer says:

          Sheesh. The surface data just happen to ALSO be on the chart I showed, because I couldn’t find the exact chart Maurice Crok used. For the direct apples-to-apples comparison, of course I was referring to the model comparison to the UAH satellite observations curve (also on the chart).

        • Ken Gregory says:

          The weighting functions used to create the climate model curves are;
          for the lower troposphere over land,
          http://data.remss.com/msu/weighting_functions/std_atmosphere_wt_function_chan_tlt_land.txt
          for the lower troposphere over oceans,
          http://data.remss.com/msu/weighting_functions/std_atmosphere_wt_function_chan_tlt_ocean.txt

          Weight the weighting factors 70% oceans, 30% land for global.
          Positive weighting factors are from the surface up to 13 km altitude, then negative weighting factors from 13 km up to about 40 km altitude.

          These are from Remote Sensing Systems. Dr. John Christy confirmed that the weighting functions he used are the same as RSS.

          Referring to his tropical mid-troposphere graph http://www.drroyspencer.com/wp-content/uploads/CMIP5-73-models-vs-obs-20N-20S-MT-5-yr-means1.png , he wrote, “All pressure levels are used in the radiosondes and models to generate the simulated satellite profile (how else could it be done?). All comparisons are apples-to-apples. All levels are used according to their proportional weighting of the microwave emission function.” The same procedure would have been used for the Global Lower Troposphere graph.

          Dr. Roy Spence wrote on June 6, 2013 his post “STILL Epic Fail: 73 Climate Models vs. Measurements”, where the tropical mid-troposphere graph was first displayed, “In this case, the models and observations have been plotted so that their respective 1979-2012 trend lines all intersect in 1979, which we believe is the most meaningful way to simultaneously plot the models’ results for comparison to the observations.”

          I agree that this is the best way to compare model trends to observational trends.

      • Aaron S says:

        Strongly agree. The data is difficult to get and there is no good reason it cant be downloaded easily.

  5. Mary Brown says:

    One thing that bothers me about your chart Roy is that the model forecasts are “hindcasts”. The Pinatubo eruption is included.

    A true forecast verification has no hindsight. Weird stuff happens in the future. I know. I do forecast modelling for a living. We have to be right. We watch out for “volcanoes”. In the real world, you don’t get to add in the uncertainty later after the fact. Lehman Brothers didn’t get to retroactively add in the mortgage meltdown and not go bankrupt.

    Hansen made the famous “Scenario A” forecasts back in ’88. Verifying that is a true test without look-back bias. That forecast doesn’t look so good at this point.

    • Andre says:

      That’s exactly my point of attention. What is forecast and what is hindcast? Correct me if I am wrong but I understand that the CMIP5 models do a ten year forecast every five years as of 1960. https://curryja.files.wordpress.com/2012/05/kim-et-al-2012_grl.pdf

      So one could wonder if Roy graph is tying all 5-year forecasts together in sequence or if it’s a forecast-hindcast mix.

      • all of the models are a combination of forecast and hindcast. It’s a hindcast regarding the known history of (especially) CO2 and volcanoes. It’s a forcast using assumed CO2 concentrations (and many other radiatively active gases, as well as land use change). I frequently point out the models discrepancy versus observations wasn’t a forecast problem, but a hindcast problem.

        It doesn’t prove the models won’t eventually be, in their average projection, basically correct…but it doesn’t give me a warm feeling about them, either.

        • richard verney says:

          But are the models runs not started at around 2006, ie they are hindcasted prior to about 2006, and their future projections only start at about 2006 onwards.

  6. I think it would be appropriate to shift the curves of the observations (or the models) to minimize the difference between models and observations during the period where the output of the models is hindcasting instead of forecasting. The divergence after this period would be the error in forecasting of amount of warming.

    • NO, because any bias in the climate model sensitivity will affect the hindcast as much as the forecast.

      • richard verney says:

        Really?

        Not if the hindcast is deliberately fudged.

      • ehak says:

        If so… the models hindcasts will show more warming than the observations.

        Well. Do they Spencer?

        • Jake says:

          ehak;

          I believe that common courtesy would demand that you refer to the owner of this site as Dr. Spencer. For the most part, even those who disagree use civil discourse on this particular climate discussion venue.

          At least Dr. Spencer puts himself “out there” and doesn’t remain anonymous.

        • I have noticed that the models are mostly hindcasting more warming than observed as well as forecasting more warming than observed. But I still think that the “acid test” is to have the hindcast shifted to minimize difference from observations. The forecasting error of most of the models seems to me as great due to The Pause, and the hindcasting error seems small in comparison. But even if the models are shifted to minimize difference from observations during the hindcasting period, I expect a majority of the models to flunk.

          I see appearance of the models being tuned to consider the rapid warming from the early 1970s to shortly after 2000 as being all manmade, and none of it due to multidecadal oscillations. I think about .2-.22 degree C of the global surface temperature increase during that time was from multidecadal oscillations.

  7. lemiere jacques says:

    it is all about the trend, relevant or not.

  8. MarkB says:

    Dr Spencer,

    How well do you believe the recent Cowtan, etal paper reconciles the apparent difference between observations and models?

    http://onlinelibrary.wiley.com/doi/10.1002/2015GL064888/full

    • Andrew_FL says:

      You can improve the agreement between incomplete observed data with models by creating fake data where none is observed. This is “reconciliation”

      Yeah, no. This is stupid is what it is.

      • ehah says:

        Some prefer to using the global or hemispheric mean for the infilling. Some prefer interpolation/kriging.

        UAH prefer the latter over the poles. So you must be accusing Spencer and Christy for something that begins with s.

        • Andrew_FL says:

          UAH does not krig over the poles, or use the mean over the poles. Don’t make things up.

          However, what I said was stupid was comparing fake data to models and thinking that is meaningful compared to comparing actual data to models. UAH hasn’t done that either.

      • MarkB says:

        Andrew, I think you’re confusing the linked Cowtan (2015) paper with the Cowtan paper regarding coverage bias. The gist of the linked paper is that one has to account for the difference between metrics: global temperature anomaly at 2 meters (the model result usually cited), 2 meter land & SST (ala HadCRUT), and TLT (ala UAH) in performing a model vs measurement analysis.

        • Andrew_FL says:

          In that case, all model projections publicized for future temperature changes should be corrected to the methodology of what we actually measure.

          You know, we do actually have measurements of marine air temperatures. Why didn’t the try using those?

    • I remember an article at Wattsupwiththat.com mentioning how HadCRUT4 would be modified if uncovered areas of the globe were added in by the ECMWF weather forecast model instead of by the methodology of Cowtan and Way. Results: HadCRUT4 has warming rate as smoothed by a few years being essentially unchanged. I would give a lot more credibility to a modeling system that has to work in order to predict weather, and is arguably the best weather model in the world, than to a modeling system that uses much simpler interpolation and smacks of being designed to report more warming. I tried Googling for this Wattsupwiththat article and could not find it quickly for some reason, maybe by using ECMWF rather than another name used for that weather model.

  9. Bret says:

    Why not just produce a chart of the trends of each of the models with error bars, and the trends of the satellite data with error bars?

    Gets rid of the spaghetti, gets rid of the complaints, and I think it would be clearer to everybody.

  10. Soon when the global temperature trend is down this will all be put to rest.

    • rah says:

      If the long range forecast coming out of Scripps Institute of Oceanography is correct then AGW is going to take a big hit when the strong La Nina they are forecasting comes to pass. Check out Joe Bastardis daily update for 11/3

      http://www.weatherbell.com/

  11. mpainter says:

    The real, albeit unspoken, objection to the comparison is that it starkly demonstrates the egregiousness of the climate models. The true believers (global warming activist bloggers) can’t handle that. It disorders their brains. Everything starts whirling around.

  12. C. Daulton says:

    How can Ph.D. scientists appear to be so mathematically naïve? I never quite made it to calculus and I sure didn’t need your explanations to understand you are pointing at relationships between trend lines and that any particular time base isn’t important to the points being made. Apparently, PC in social science may be equated with that other “strong force,” that one in particle physics.
    /– a slightly educated cowboy.

  13. Andrew_FL says:

    These are the exact arguments Nick “Race Horse” Stokes made about these comparisons last year.

    Here’s the thing I think you should do, Roy:

    In addition to creating charts like these, you should also calculate the linear trends for the models, and present a comparison of the numbers.

    There can be no ambiguity or accusations of “chartsmanship” there. The numbers for the trends will speak for themselves.

  14. Kurt says:

    I am curious how the data from the USCRN network compares to model projections. I know that network has not been around for very long, so there isn’t much data, but with the care taken in constructing the USCRN stations, I am very curious to see where it falls in your graph. Thanks for the great work!

    • richard verney says:

      My understanding is that USCRN clearly shows the ‘pause’ So it will show similar divergence from about 2006 onwards.

  15. 1.

    “1. We do NOT shift the models upward to enhance the discrepancy with the observations. They diverge upward when starting at the same initial point: the 1979-1983 average (the first 5 years of the satellite record).”

    So, the “same initial point” is the average 1979-1983 both for the satellite data and the model simulations?

    This is the wrong initial point and actually not the “same” initial point, if the 1979-1983 average of the satellite data doesn’t lie on the trend line of the satellite data, but deviates upward or downward from the trend line due to unforced short term variability in the satellite data. Five-year averages still show substantial unforced variability. If the deviation relative to the trend line is positive or negative, then this will create a negative or positive offset of the satellite data relative to the model ensemble mean right from the start years, and wrongly make the model ensemble appear to be running warm or cold, respectively, by this offset, compared to the satellite data.

    From looking at the UAH graph for the lower troposphere, which starts with an upward wobble, it looks indeed like that there is such a negative offset of the satellite data relative to the model ensemble mean right from the beginning of the time period. The offset seems to be about -0.05 to -0.1 deg. Celsius. If this offset is there, then the whole graph of the satellite data needs to be moved upward by the magnitude of this offset for a proper comparison.

    2. Even if there wasn’t such an offset, as long as the model evaluation doesn’t account for differences between the forcings, with which the models were driven, and the forcings in the real world, no conclusions can really be drawn about the ability of the models to reproduce the real world data. Even a simulation with a perfect model, i.e., a model that was flawless by definition, would deviate from the real world, if the forcings are different. If the input already deviates the output will also deviate. Even for a perfect model.

    3. When will you publish a scientific paper about this in a peer-reviewed journal with the data, assumptions, and methodology? As long as it is just opinion presented by you in a blog, it’s not science. Unless this whole thing is mainly about model bashing without being willing to make the evaluation open to the strong scrutiny by other scientists.

    • mpainter says:

      See my comment at 3:56 pm above.

    • Andrew_FL says:

      1. Completely wrong. The models have unforced variability, too. So each individual model will be offset from the data by random amounts both up and down. But the divergence between the models and the data is not a constant offset. It is growing with time

      You’re saying “please present the data in a way that makes it harder to see that the trends of models and the data are different”

      No. That’s dumb.

      2. The real world forcings haven’t deviated enough from the model projections to account for this growing divergence over time. This attempt to muddy the waters is irrelevant.

      3. An idiotic comment. Peer reviewed journals don’t make science and facts don’t become opinions just because they’re posted on blogs. Plenty of people have independently shown a divergence between model trends and observed trends has occurred. It’s not incumbent on Roy to try and get a comparison published which journals might justifiably consider “old news” not worth printing.

      • Andrew_FL,

        “1. Completely wrong. The models have unforced variability, too.”

        I can’t have been completely wrong about something I didn’t assert. I didn’t say the model simulations didn’t have unforced variability.

        Each individual model simulation shows strong unforced variability. Like Nature. Nature provides only one realization of all possible realization for a given climate state, though, whereas we have about 100 simulated realizations from the models.

        The individual short-term random wobbles of the model simulations are smoothed out for the ensemble mean. The averaging acts like a low-pass filter.

        “So each individual model will be offset from the data by random amounts both up and down.”

        There are no random up and downs from the satellite data in the same five-year average. The satellite data are only a single realization. If a random upward wobble of the satellite data in the average 1979-1983 is aligned with the model ensemble mean, where the random wobbles of the model simulations are averaged out, an offset is introduced right from the beginning.

        “But the divergence between the models and the data is not a constant offset. It is growing with time”

        Which is only of consequence, if this difference becomes statistically significant. How would you know it was? To determine that, model simulations and observations need to be aligned properly, i.e., w/o any initial bias. Positive or negative. Otherwise, the conclusions will be drawn using a flawed statistical metric.

        “You’re saying “please present the data in a way that makes it harder to see that the trends of models and the data are different””

        Where did I say that? You are hallucinating.

        It seems to me instead that you are projecting your own confirmation bias onto me.

        “2. The real world forcings haven’t deviated enough from the model projections to account for this growing divergence over time.”

        How would you know that?

        “3. An idiotic comment. Peer reviewed journals don’t make science and facts don’t become opinions just because they’re posted on blogs.”

        Opinion in blog posts don’t become facts just because they confirm your opinion. What the facts are needs to be established first. This is done with evidence that is presented in a proper way in the peer-reviewed scientific literature. Which requires that the data, assumptions, and methodology presented are open to the full scrutiny by other scientists, so that the conclusions become scientifically reproducible. It’s not science without that.

        “Plenty of people have independently shown a divergence between model trends and observed trends has occurred.”

        You mean “plenty of people” who have presented similar opinion in blog posts in the Internet? There are also “plenty of people” on the Internet, who have “proven” that they have been abducted by aliens.

        • Andrew_FL says:

          My god you’re breathtakingly stupid.

          “I can’t have been completely wrong about something I didn’t assert.”

          Yeah it makes sense to completely disconnect my first sentence from the subsequent one. 1 is completely wrong because models have unforced variability too.

          “Which is only of consequence, if this difference becomes statistically significant. How would you know it was? To determine that, model simulations and observations need to be aligned properly, i.e., w/o any initial bias. Positive or negative. Otherwise, the conclusions will be drawn using a flawed statistical metric.”

          This, and the rest of what you’ve said, illustrate that you have a basic inability to understand that offsets don’t matter for the divergence of trends.. Plotting the data to deliberately obscure a trend difference is not how you determine whether the divergence is “Statistically significant”. But that’s a statement which is just totally flipping wrong! Whether the divergence is statistically significant-a meaningless term without any meaning in an of itself-is a different matter from whether it is consequence.

          Though this was helpful in revealing that you’re a complete flipping moron.

          “Where did I say that? You are hallucinating.

          It seems to me instead that you are projecting your own confirmation bias onto me.”

          Wow, my God you’re obtuse. You can’t tell the difference between someone calling you out for the deliberate obfuscation you are asking someone to do for you, and literally imputing those exact words to you?

          Apparently you’re not even smart enough to know when you’re being accused of duplicity. I hadn’t realized I was dealing with an infant. So you’re not capable of duplicity after all, you’re actually stupid enough to believe you’re asking for the comparison to be done the right way. I’m sorry For thinking you might have brain somewhere up there.

          “How would you know that?”

          Because there’s an order of magnitude flipping difference between the two? I’m not going to waste my time teaching someone without a brain how to do Fermi estimation.

          “Opinion in blog posts don’t become facts just because they confirm your opinion. What the facts are needs to be established first. This is done with evidence that is presented in a proper way in the peer-reviewed scientific literature. Which requires that the data, assumptions, and methodology presented are open to the full scrutiny by other scientists, so that the conclusions become scientifically reproducible. It’s not science without that.”

          You’re welcome to try and reproduce the result yourself, but I doubt you have any interest in putting in the effort, seeing as you adhere to the Peer Review Literature cargo cult. However, this state is irrelevant, anyway. You are merely arguing that opinions cannot become facts, but you are still asserting that presented facts become opinions and have to be approved as facts if you put them on a blog. You’re just. Wow. How do you function?

          As for what my opinion is, I haven’t got one so good on you for assuming you know what it is. Remarkable that you possess psychic powers when you don’t have brain.

          Although I do have the opinion that you’re mentally competent to comment without adult supervision.

          “You mean “plenty of people” who have presented similar opinion in blog posts in the Internet? There are also “plenty of people” on the Internet, who have “proven” that they have been abducted by aliens.”

          It’s not my job to do your homework for you, kiddo.

          Snide remarks about alien abductions, on the other hand, show you’re not worth having a discussion with anyway. You’re stupid troll who apparently literally believes anyone who questions your religious faith is on the level of some crazy person who believes they’ve been abducted by aliens.

          Anyone who has the slightest clue about time series analysis will be able to understand what mental defective you are.

          • Andrew_FL,

            “My god you’re breathtakingly stupid.”

            You don’t seem to have much confidence in our own arguments, considering that you feel the psychological need to bolster them with many insults toward your opponent.

            “Yeah it makes sense to completely disconnect my first sentence from the subsequent one. 1 is completely wrong because models have unforced variability too.”

            I quoted the first sentence together with the second one. What are you talking about?

            “This, and the rest of what you’ve said, illustrate that you have a basic inability to understand that offsets don’t matter for the divergence of trends..”

            This alleged divergence needs to be shown, not merely asserted. And it must be shown that it was statistically significant. Otherwise it is without any consequence for anything.

            “Plotting the data to deliberately obscure a trend difference is not how you determine whether the divergence is “Statistically significant”.

            Properly aligning the observation data with the model simulations and the model simulations with each other has nothing to do with “obscuring trend differences”. This is just your hallucination.

            And nowhere did I say that such proper alignment was how a possible statistical significance of a divergence was estimated. You are just lying by making up statements which I didn’t make.

            “But that’s a statement which is just totally flipping wrong! Whether the divergence is statistically significant-a meaningless term without any meaning in an of itself-is a different matter from whether it is consequence.”

            I didn’t say anything about the divergence being a consequence. You apparently didn’t understand what you read.

            “You can’t tell the difference between someone calling you out for the deliberate obfuscation you are asking someone to do for you, and literally imputing those exact words to you?”

            I asked where I said what you asserting I said. I didn’t say anything about “literally”. You are making up things I didn’t say, neither literally, nor implicitly. What you do is called lying.

            “Because there’s an order of magnitude flipping difference between the two?”

            Is this a fact? Show the calculation and the numbers.

            “I’m not going to waste my time teaching someone without a brain how to do Fermi estimation.”

            Insults and pretense of being competent.

            “You’re welcome to try and reproduce the result yourself, but I doubt you have any interest in putting in the effort, seeing as you adhere to the Peer Review Literature cargo cult.”

            Fake skeptics hate peer review. No surprise here. I know why that is.

            “You are merely arguing that opinions cannot become facts, but you are still asserting that presented facts become opinions and have to be approved as facts if you put them on a blog. You’re just. Wow. How do you function?”

            You obviously don’t have a clue how science works. And you very likely have never worked in science in your life. Ever.

            “As for what my opinion is, I haven’t got one so good on you for assuming you know what it is. Remarkable that you possess psychic powers when you don’t have brain.”

            I don’t need any psychic powers to read your opinions that you are stating here. What else do you believe are you doing here, when you make assertions about the data and the models. Or about anything else.

            “Snide remarks about alien abductions, on the other hand, show you’re not worth having a discussion with anyway.”

            That’s funny that you believe to be in a position to state such a judgment. I wonder what your self-perception is. Do you think about yourself as someone who is worth it to have a discussion with? And as someone who has the capability to have a civilized discussion?

            “Anyone who has the slightest clue about time series analysis will be able to understand what mental defective you are.

            There is no evidence whatsoever in your comments that you really know anything about time series analysis. I suspect, that’s why you need to haul all the insults. To bolster your pretense.

      • Some of the model simulations are, by mere chance, in a similar phase of the unforced short-term variability as the UAH data for the average 1979-1983. These are the only simulations which are about properly aligned with the UAH data in the figure.

        • Andrew_FL says:

          About half the rest are offset too low, not too high. The problem in question does not monodirectionally bias the result unless you’re clinically insane. This is not for you Jan, you’re not intelligent enough to understand why that is. But for any readers who don’t understand, maybe it will help.

          • The satellite data have a mono-directional bias in the anomalies in the period 1979-1983 relative to the model ensemble, unless they are by mere chance right in between positive and negative phase of unforced variability.

            If the satellite data start with an upward wobble in that period than they have a negative offset relative to the model ensemble mean right from the start, which will perpetuate throughout the whole period of comparison. There can be an additional divergence, but if there is an artificial offset due to misalignment you make the magnitude of the divergence relative to the model ensemble mean appear larger than it really was.

            If you talk about the offset of the anomalies of the individual model simulations relative to the model ensemble mean, half of them have indeed a negative offset, the other half a positive offset. Which means that the model simulations are also wrongly aligned with each other in the figure. The simulation with the largest positive phase is aligned with the simulation with the largest negative phase as supposedly being at the same state in the period 1979-1983.

            The model simulations that are in the positive phase of unforced variability in the period 1979-1983 are better aligned with the satellite data, since the unforced variability in the satellite data is also in a positive phase. The simulations in a negative phase in that period are strongly misaligned with the satellite data. This creates an artificial bias of the satellite data relative to the model ensemble, due to flawed alignment, which is not real.

          • Andrew_FL says:

            Jan, I’m not going to waste my time with you anymore. I don’t have the patience for educating you. It’s just gonna be more “I’m a real scientist, so even though I’m saying things that don’t make any flipping sense, I’m clearly right.”

          • “Jan, I’m not going to waste my time with you anymore.”

            Of course, you aren’t. ROTFL

      • mpainter says:

        Jan, such rigid and extreme views you have, most repugnant. Much worthy science is presented outside the publications. You think to condemn by mere dicta the symposiums, annual meetings,etc. where many thousands of scientists present their work to their fellows outside the publications. The internet, too, and yes on blogs.So climbdown.

        • I don’t condemn anything of these. Of course, scientists exchange ideas and opinions and present (preliminary) results in conferences and other venues where scientists gather. That all belongs to the scientific process. But the same scientists also won’t accept anything at face value and blindly believe anything, if something is claimed by some scientist, especially, if someone comes and declares that what the other were doing was all wrong, without reproducible evidence. At the end, the evidence that supports a theory is almost always being presented in the peer-reviewed literature. Because there are standards that need to be fulfilled to make the research and the conclusions scientifically reproducible.

          In contrast, I’m being asked here to accept a presentation in a blog post that doesn’t adhere to any of the standards, as a presentation of scientific truth, and not just as an opinion. Why should I do that? And I’m being attacked, partially viciously on a personal level, for not doing it, and for criticizing the methodology, insofar it can be inferred.

          It seems that the skepticism of “skeptics” is very selective.

  16. Jan the models are in a word useless.

  17. http://models.weatherbell.com/climate/cfsr_t2m_2005.png

    This data and satellite data I go by.

    MOST OF NOAA’S DATA LIKE THEIR MODELS ARE USELESS.

    Why are the models useless because they have the initial state of the climate wrong, they do not give the proper weight to items that influence the climate ,they have incomplete data and last but not least inaccurate data.

    I have much more faith in my climate forecast then what any model may predict and by the end of this decade that will put an end once and for all to AGW theory an asinine theory that has already been proven wrong from historical as well as from current data.

    • Andrew_FL says:

      You do realize that Weather Bell image is of output from an model, right? CFSR or Climate Forecast System Reanalysis is a reanalysis model, it’s not observed data.

  18. Aaron S says:

    So doubling CO2 causes about 1 deg C warming with a range of uncertainty. The feedback to this warming (from CO2) from water vapor could be strong positive, nearly neutral, or even negative. Other factors like the magnetic field could influence the feedback (svensmark high vs low cloud ratios depending on solar activity). My point is the models only cover a very narrow range of posibilities. They are not representative.

    • geran says:

      “So doubling CO2 causes about 1 deg C warming with a range of uncertainty.”

      Beware Aaron, that is what warmist pseudoscience says. It is NOT actual science.

      CO2 does not cause warming.

      The warmist propaganda has fooled many. Don’t be taken in.

      • Aaron S says:

        Geran,

        As i understand it, CO2 absolutely can cause warming in a lab, but the absorption is less certain in the real world. The issue is political so i am skeptical about the role of CO2 and appreciate any data or literature showing alternative views.

        Also, i want to say i love the passion on this page… amazing to see such interest in science… both sides.

        • geran says:

          Aaron, that’s why I thought I needed to comment. CO2 does NOT cause warming. It does not cause warming in the atmosphere, or in a lab. CO2 is a “spent” fuel. It is the byproduct of complete combustion of a hydrocarbon with oxygen. It is NOT a thermodynamic “heat source”.

          • Aaron S says:

            Ahh… fair enough. I will work on my wording. It can redirect heat back towards Earth that was escaping.

          • geran says:

            Well, here again, that is what they have conditioned us to believe. But, it is not correct. That “redirected heat” is of little consequence to our planet. Earth’s average surface temperature is said to be about 59ºF (15ºC), give or take a degree or so. CO2 emits mostly at a wavelength of about 15 microns. A 15 micron photon corresponds to a black body temp of about -112ºF (-80ºC). So there is no way such a photon is going to “warm the planet”.

            Trying to heat the planet with atmospheric CO2 is somewhat analogous to trying to bake a turkey with ice cubes.

  19. Greg Goodman says:

    #3 is the key point and it is the warmists you have been mislead and are shocked when they see the reality of the discrepancy.

    Modellers and activists usually present the models with half the discrepancy as an early negative error and the other half as later positive error. It puts the spaghetti roughly evenly each side of the observations and gives the IMPRESSION that the models are not too bad.

    Of course the error in the trends is just the same ( just as bad ) but it’s less obvious to the untrained eye.

    Models also over estimate climate sensitivity to volcanic forcing. This kinda works while you have both volcanic and GHG, Since Y2K there has been negligible volcanic eruptions reaching the stratosphere. With only one of the two opposing forces present the erroneously high climate sensitivities becomes apparent.

    The problem arises because at some stage in the late 1990’s modellers abandoned physical modelling of volcanic forcing and started the almost arbitrary juggling of poorly constrained “parameters” in an attempt to reconcile model output with the climate record. ( see refs in following article).

    http://judithcurry.com/2015/02/06/on-determination-of-tropical-feedbacks/

    The volcanic forcing was reduced by about 30% leading to a corresponding increase in sensitivity to restore the balance.

    Had they reduced the CO2 sensitivity instead and kept the physically correct AOD scaling for volcanoes, there would be a much better match to post 2000 observations.

    Of course that was the one parameter that they were determined NOT to change.

  20. richard verney says:

    Dr Spencer,

    I hope that you will update this thread should you receive any response from Marcel Crok commenting upon the clarification that you provided to him.

  21. G. VanVleet says:

    I have been an avid fan of Dr. Spencer’s site for over 6 years, and I have to say without a doubt that mpainter is the most annoying person to grace the comments in that time (except for D. Cotton of course).

    Rarely has so little been said with so many words – nasty, sarcastic, and uninformed words at that. Go away please. Your comments subtract from the sum of human knowledge.

    GV

  22. G. VanVleet says:

    For further reading, check out the “deep scientific” thinking in the posts of mpainter below. Note the entire lack of any scientific perspective. Should we not question the motives? Why doesn mpainter post here? Would mpainter like to enlighten me?

    Posted Sep 28, 2015 at 2:07 PM | Permalink | Reply
    “The University conflict of interest policies require comprehensive and formal disclosure of personal and family financial interests to the Office of Sponsored Programs.”
    ###
    Should be a public record here, unless Shukla has neglected this step.

    Could be just a simple physical relocation of IGES from Rockville, Md to GMU. In other words, an address change heaped up on the rhetoric of a press release. The consequences are that GMU is now providing support for a private corporation which nets the Shukla family a good deal of wealth skimmed from NSF funds. Time for a big, well-connected D.C.law firm.

    Posted Oct 4, 2015 at 3:18 PM | Permalink
    It is my bet that this affair will be viewed as an opportuniy to delve into this smelly mess of climate alarmism that has issued from publicly supported science and academidians, all abetted and fomented by the present administration. Discredit is the name of the game. Dave Verardo, an old DC veteran, understands this very well.
    I would imagine that there will have been formal agreements between George Washington University and Jagadish Shukla, hammered out by attorneys, addressing the status of IGES and COLA within the framework of that institution, the so-called “partnership” referred to in the press release issued by GMU in 2013. These agreements will cover, in the first instance, the employment of Shukla by GMU, and in the second, the absorption by GMU of IGES and COLA within that institution. I predict that the terms of these agreements, when brought to light, will cause the university immense discomfort.

    Posted Oct 5, 2015 at 9:18 AM | Permalink | Reply
    Ed Maibach, second signatory of the RICO 20 Letter, might have composed the letter. In fact, he may be the originator of the idea. The letter smacks of attention seeking, something devised with an eye toward its publicity value, and that is Maibach’s line. His little corner at GMU is essentially a school for aspiring young climate change propagandists.
    Steve: some of Shukla’s online PPTs for presentations show that he had already drunk Oreskes-type kool-aid
    Posted Oct 1, 2015 at 12:39 AM | Permalink
    Obviously, Shukla figures to circumvent his obligations to Virginia law via IGES Inc.,a shell corporation located in Maryland. This dodge needs to be tested in court. I don’t think Shukla will get away with it; it’s too obvious.

    It seems that a possible rationale for Shukla not to have filed a schedule F was that the IGES which paid him and is family was a Maryland entity and he felt it did not apply to question 7 since in question 8 it refers to Virginia businesses. Of course, this fails since IGES operates in Virginia (through COLA) even if IGES is incorporated in MD has an office there. According the the Maryland corporate lookup IGES was formed 12/04/1991 by Shukla who is registered agent and sole owner of the corporation. There is no entity filing in MD or VA for COLA. It may be that IGES is dba (doing business as) COLA.

    Posted Sep 30, 2015 at 8:28 PM | Permalink | Reply
    Shukla joined GMU in 1994 as Professor, according to his cv. George Mason U recruited him from the University of Maryland.
    Shukla founded COLA in 1984 and IGES in 1991 or 1993 (his two cv, one abbreviated and the other complete, give contradictory dates for the IGES organization). The point is, there would have been discussion about the status of COLA and IGES between GMU and Shukla, for Shukla would have brought these entities to GMU, eventually. An agreement on these points would have been reached, presumably, before Shukla accepted employment at GMU. These discussions and agreements are public documents at GMU, I assume. There may have been an agreement regarding Shukla’s outside “work” at IGES, his own privately held corporation, after all. The whole point I am trying to make is that there should be a cache of public documents at GMU that bears on the questions raised here.
    Posted Oct 1, 2015 at 2:13 PM | Permalink | Reply
    There might be a problem with the Rockville address. The phone number there is no longer a working number. This office could be shut down. Hope the chairman has sent an email to Shunkla at GMU.Otherwise, Shunkla and associates will be frantically deleting/shredding the evidence.
    Posted Oct 2, 2015 at 4:50 PM | Permalink
    If one accepts the premise that NSF and the other Grantors determine the use of the funds per their stipulations, and that no sort of arrangement devised by the recipient may circumvent those stipulations, then Shukla has no ground to stand on. The matter may go to the courts, but what judge would look favorably on Shukla’s pocketing of 10(?) million $ in funds meant for research?

    Posted Oct 3, 2015 at 7:24 AM | Permalink
    Shukla organized COLA in 1984. In 1991 he erected a shell corporation, IGES, and put COLA inside of that. Shukla has some explaining to do. The IDES-COLA shuffle does not seem to be justifiable for the purposes of conducting research. Shukla must show why it was not meant as a means to skim the grants of multi-millions.
    Posted Oct 3, 2015 at 9:56 AM | Permalink
    Was COLA incorporated at its formation? I am assuming that it was founded as some sort of organization, not a corporation. Am I wrong?
    Posted Oct 4, 2015 at 9:30 AM | Permalink
    From the website of Alan Betts:
    After moving to Vermont, Alan Betts was funded as an independent scientist by the National Science Foundation for 30 years on long-term grants (most recently by grant AGS05-29797, 2005-2012).
    It appears that Alan Betts has subsisted on NSF grants, NOAA grants, and NASA grants for the past 30 years….!!

    mpainter
    Posted Oct 3, 2015 at 8:53 AM | Permalink | Reply
    That some in the NSF holds such views as expressed by Verado will shock and disgust most scientists. Verado is an ethics enforcer in the NSF. In my view, the issue presented in the incident cited by Steve McIntyre above is as important as the Shukla affair, or even more so. I pray that the House Committee on Technology and Science delves into this matter of “secretive science” being encouraged by government employees.
    The principles espoused by Verado is the antithesis of science, and Science and the general public both need to be protected against against the evils that such perversions entail.
    Posted Oct 6, 2015 at 10:52 AM | Permalink | Reply
    Now we shall see this self-righteous fellow explain before the cameras to the US House of Representatives Committee on Science, Space, and Technology if he considered it as his “civic duty” to skim uncounted $ Millions from NSF grants. I will not miss this.
    Shukla’s statement is in fact a rallying call to the faithful to step up and defend his behavior. It should be interesting to see those who do, and those who do not.

    Posted Oct 31, 2015 at 4:20 PM | Permalink | Reply
    The petition is watered down: it calls for a “federal probe” of XOM’s “potential misconduct”, says nothing of RICO or DOJ, as in the RICO 20 letter. Apparently these folks had a little chit chat with their attorneys before they did this. Will Obummer pay any attention? As in fat chance?

    Posted Oct 31, 2015 at 11:43 AM | Permalink | Reply
    Thanks for the update, Ron. This is interesting beyond words and oh, so delightful. The public spotlight has been focused on Exxon-Mobil,and RICO20 and Shunkla will be caught in the glare.

  23. G.VanVleet says:

    In case any of you are wondering how long the climate science world has been infected with the mpainter virus, it has been a bit longer than the infection at Dr. Roy’s site. For example:

    ——————————————
    mpainter January 9, 2013 at 10:14 am

    I, of course, am not a climate modeler …

    —————————————

    Unfortunately this hasn’t stopped mpainter from pretending
    he knows something about climate modelling (which he
    clearly doesn’t).

    He must be a paid troll. Who else has endless time to post opinions on something he knows nothing about?

    • mpainter says:

      First time that this G.VanVleet has ever posted anywhere. He professes to despise my science and then copies my comments from the last Climate Audit post which has as its topic the skimming of $millions from NSF grants by Jagadish Shunkla, which post addresses no scientific issues but only those of law and personal behavior. This is weird.

    • mpainter says:

      Weirder yet. This G.VanVleet invents and thens cites a non-existent comment as mine:
      See above. In fact, I never commented on that thread. Bizarre. I think this person may be demented, or is trying to launch a canard against me. Repeat, bizarre.

  24. CC Reader says:

    I suggest that you all read Dr. David Evans articles at http://joannenova.com.au/tag/climate-research-2015/. I quote from the first of 17 articles, ”

    Breaking the Intellectual Standoff

    There is an intellectual standoff in climate change. Skeptics point to empirical evidence that disagrees with the climate models. Yet the climate scientists insist that their calculations showing a high sensitivity to carbon dioxide are correct — because they use well-established physics, such as spectroscopy, radiation physics, and adiabatic lapse rates.

  25. CC Reader says:

    He goes on to state, “Most skeptics arrived at their doubts in the carbon dioxide theory of global warming by noting the discrepancies between that theory and empirical evidence. They are empiricists. Consequently, many skeptics are unaware of the basic model, or its power, because it has been irrelevant to them.

    But establishment scientists are well aware of the basic climate model, and that it unambiguously points to carbon dioxide as the cause of recent global warming. If you believe the conventional basic model, there is indeed good reason for being alarmed about rising carbon dioxide levels. So the first part of this series, on the errors in the conventional model, may mean more to the leading lights of the establishment than to skeptics.”

    If you understand math you will LOVE it, if you do not then the Maths are still sumerized in terms that most people will understand. There are currently 17 articles to be followed by more. Start ar entry 1.

  26. G. VanVleet says:

    The road to scientific maturity of mpainter:

    mpainter January 25, 2013 at 8:43 am

    This is the usual score talk that is propagated by the global warmers. The oceans are alkaline and will be for the next bilion years or so. Don’t let the global warmers make you wet your britches.

    mpainter January 28, 2013 at 3:59 am
    And Pat,
    In 1981 people like you were wetting their britches over global cooling. But you do not know that, do you?

    01/28/13–03:59: mpainter
    And Pat, In 1981 people like you were wetting their britches over global cooling. But you do not know that, do you?

    mpainter May 29, 2013 at 1:37 pm
    Dollis:Show me some evidence of climate change- real evidence, not the wet-my-britches kind of talk about droughts, tornados, etc. that alarmists screech about.

    mpainter November 4, 2014 at 10:24 am
    Rupert Affen,
    Try not to let the alarmists get to you. They would have you wetting your britches in fright, if they could.

    mpainter December 13, 2014 at 4:39 pm
    Mother Nature did that so that alarmists would have something to wet their britches over.

    mpainter December 20, 2014 at 2:20 am
    Incoherence will not win the day for you, rooter. You must squabble with sock rates over the difference in the two plots.
    You should be aware that most people do not wet their britches when it is minus 27°C.
    mpainter
    December 21, 2014 at 1:56 pm

    Because it don’t make them wet their britches.
    Jan, such rigid and extreme views you have, most repugnant.

    mpainter December 27, 2012 at 8:47 pm

    “Suppuration and festering resentment” because they cannot advocate liquidation of the skeptics? May they fester their britches into knots.

    mpainter December 30, 2014 at 5:56 pm
    Well now, B. Gates
    “The truth shall make you free” (or at least keep your britches

    • mpainter says:

      I copy more invention from VanVleet, immediately above

      mpainter
      December 21, 2014 at 1:56 pm

      Because it don’t make them wet their britches.
      Jan, such rigid and extreme views you have, most repugnant.
      ###

      Note the last phrase, which comes from my comment addressed up thread to Jan Perlwitz yesterday, November3, 11:03 pm. Bizarre.

      Appell, is this you?

  27. The people that support the asinine AGW theory are now grasping at straws as the data keeps going against them as each month passes by.

    Even with a strong El Nino the global temperatures have not made any head way on the upside.

    As I have pointed out time and time again the earth has been in a gradual cooling trend since the Holocene Optimum, and this trend is still intact as of today.

    The blips of warmth within the gradual cooling trend have been due to periods of strong solar activity from time to time this latest blip 1840-1998 being no exception similar to the Medieval warm period around 1150 AD but not as warm.

    All the indicators from Milankovitch Cycles, to the Geo Magnetic Field, to Solar Variability suggest the cooling trend post the Holocene Optimum is alive and well and I expect if solar variability declines to Dalton, if not Maunder Minimum conditions the global temperature trend will be clearly down.

    The worthless models do not take into account Milankovitch Cycles, Soar Variability ,or the Geo Magnetic field which makes them useless.

    They do not take into account all of the associated secondary effects with changing solar variability ranging from ocean heat content, to cloud coverage, to atmospheric circulation changes, geological activity changes etc.

    This is a joke and how AGW theory has made it thus far is a mystery since this theory has the data conform to it while the theory does not conform to the data.

    Lastly the climate when it changes is usually in a step like fashion it is not slow and gradual another fatal flaw of the climate models which have no concept of how an abrupt climatic change may evolve and take place. The models have no concept of climatic thresholds which are out there.

    Then again the models have been created though human emotional agenda driven desires and have garbage input into them which gives a garbage out put result.

    I am better then any climatic models could ever be when it comes to evaluating the climate in an objective way because I base it on the historical climatic record and have made my climatic theory conform to the data in contrast to having the data conform to the theory which is what AGW theory has done. A travesty to science.

  28. Mike M. says:

    Dr. Spencer,

    I agree with you that, in comparing trends, the various curves should be aligned at the beginning, not at some point in the middle. The latter creates a false appearance of agreement between the various curves.

    However, I do take issue with one aspect of your graph. The temperature variation is a combination of a trend and internal fluctuations. Even if the models contain internal fluctuations with similar statistical properties to those in the data, one can not reasonably expect the model fluctuations to correlate with those in the data. Then if the point chosen for alignment has an extreme fluctuation in the data, a false appearance of disagreement is created.

    This appears to be the case in your graph. The satellite data drop by about 0.15 K over the first 5 years. That looks like an internal fluctuation. The individual models show fluctuations of similar magnitude, but they do not correlate with each other; so they average out in the model mean. The result is that an offset between model and data is quickly produced and that offset is preserved in subsequent years.

    To put this a little differently: Some of the model-data disagreement is due to a difference in trend and some is due to internal fluctuation. A fair comparison would try to remove the latter effect. It looks like shifting the satellite curve up (or the models down) by about 0.1 K would accomplish that by making the two curves generally agree over the first decade or so.

    I note that this point was raised earlier by Jan Perlwitz. I did not reply there, and am somewhat reluctant to mention this here, due to the invective hurled at Perlwitz for daring to be critical. The authors of that invective should be ashamed of themselves.

    • Toneb says:

      Indeed Mike:
      See……

      http://phys.org/news/2014-07-vindicates-climate-accused.html

      The “accuracy” of GCM’s comes in showing that (chiefly) it is the PDO/ENSO cycle that is the cause of their “inaccuracy”.
      GCM’s that have been run with it in the correct phase have shown remarkable accuracy.

      Also one only has to see how the 2 sat data models handled the 97/98 Nino that you are also comparing apples to oranges (never mind the usual logic).

      • Mike M. says:

        Toneb,

        You wrote: “GCM’s that have been run with it in the correct phase have shown remarkable accuracy”.

        Do you have any evidence for that claim? I don’t see any in the link you provided. The problem is that the overall trend in the models is still something like 50% higher than what is observed.

        • Toneb says:

          Mike:
          The link is there on my link – though it is behind a pay wall in large part.

          http://www.nature.com/nclimate/journal/v4/n9/full/nclimate2310.html

          Also:

          http://iopscience.iop.org/article/10.1088/1748-9326/6/4/044022/meta

          http://www.skepticalscience.com/pics/FR11_All.gif

          You cannot judge GCM’s on something that is impossible for them to do, namely incorporate within them the Earth’s biggest natural (stochastic) climate variable PDO/ENSO.
          This is the trend in GMT’s …
          http://www.skepticalscience.com/pics/JohnN-G_ENSO_trends.gif

          As can be seen it amounts to a difference of ~0.2C in the swing to/from Nino to Nina.
          And what has the Pacific largely had since ’98?

          • mpainter says:

            The egregiousness of the models is due to their incorporation of a climate sensitivity that has no basis except in faulty, unsupported assumptions. When the proper CS is incorporated into the models, these will agree with observations and project no warming trend. The reassessment of CS is already underway. The real truth is that AGW has no valid theoretical basis.

          • mpainter says:

            Thanks, WordPress, but I think once will suffice. Maybe.

          • ehak says:

            Another mpaintering analysis. Guess he wants to show his ignorance. Again.

            Climate sensititvity is not incorporated into GCM. Climate sensitivity is an emergent property of GCMs.

          • mpainter says:

            Emergent? Look at Dr. Spencer’s above post, the GCM spaghetti, and tell us what else emerges from the GCMs, please and thank you Hint: don’t forget to look at the real data plotted below the spaghetti.

            Then tell us which “emergent” CS is the one that you believe is the correct one, please and thank you.

            What you fail to understand is that the CS is built into the models. You also confusedly attribute to the model’s product real-world observation value, in typical global warmer fashion. Thank you for being Exhibit A in that regard.

          • mpainter,

            So, you claim a false climate sensitivity has been “incorporated” into the climate models. How has this false climate sensitivity built into the models?

            How would you incorporate a “climate sensitivity” into the models that would be the correct one, according to you?

          • Mike M. says:

            ehak wrote: “Climate sensititvity is not incorporated into GCM. Climate sensitivity is an emergent property of GCMs”.

            Technically true, but the sensitivity is a result of assumptions built into the GCM’s. High sensitivity is a result of cloud feedbacks which in turn are a result of assumed parameterizations. There is no meaningful observational evidence for the cloud feedbacks. And the parameterizations do a terrible job of matching cloud properties to what is observed.

          • mpainter says:

            Jan, the same question to you as to ehack: of the scores of models, which produces the one true CS, allowing that CS “emerges” as a product of the model as per ehack. Tell us that and it follows that the rest are false, or do you disagree?

            I have no doubt that you will dodge this obvious trap, but my point is made.

            CS is not a determinable factor. All CS estimates are no more than guesswork. You know this, I’m sure. We do know that CO2 made no contribution to the warming circa 1920-45. We can account for the last episode of warming without reference to CO2 or AGW. All of this hard observational science notwithstanding, climate scientists like yourself cling to their unsupportable assumptions, and the products of the egregious models. Meanwhile, the pause continues.

            Put that in your comment mincing apparatus and chop chop, Jan.

          • Mike M. says:

            Toneb,

            A well-estimated 15 year trend is pretty much an oxymoron, since the error bars on such a short trend are so large.

            As for the second paper, yes there is a warming trend. But it is closer to the bottom of the IPCC range than the model mean.

    • Andrew_FL says:

      You should be ashamed of yourself for being his sock puppet spewing more of his nonsense. You have yet to explain how internal variability generates a monodirectional bias in the comparison, outside of your insane mind, Jan.

      • Mike M. says:

        Andrew,

        To whom are you directing your comment? Jan? Or me?

        Speaking for myself, I am not now and have never been either a sock or anyone’s puppet.

        Both Jan and I have explained (to those willing to exert a little effort in understanding) how internal variability can generate a monodirectional bias. Here is another attempt:

        Take the data points for the model mean and satellite data in Spencer’s graph and subtract 0.1 K from a randomly chosen point from the model mean. What effect does that have on the comparison? Negligible, unless it is added to the first point. Then it has a big effect since it shifts the entire curve downward. The result will be fairly decent agreement up until the late 90’s, then an increasing discrepancy since then. But the final discrepency will be 0.1 K smaller than in Spencer’s graph.

        • Mike M. says:

          I should have said “add” 0.1 K to a single point. If that is the first point in the model mean values, then you will have to shift the entire model mean curve downward to make the first point agree with the data, thus producing better agreement.

        • Andrew_FL says:

          So you’re just, independently incapable of understanding that each model is zeroed individually, and that some of them will be anomalously warm in the zeroing period, some anomalously cool, and the result cancels out.

          That’s depressing.

          • Each model simulation is indeed zeroed individually. The individual simulations are not zeroed to a common reference state that is the same for all models, but each simulation to its own individual reference state that depends on in what phase of unforced variability each simulation is, by chance, for the average of 1979-1983, relative to the climate state of this period in the simulation.

            The effect of aligning the model simulations how it is done by Roy Spencer in the figure, i.e, not accounting for the different phases of unforced variability of the simulations for the average 1979-1983 cancels out only for the model ensemble mean. But the anomalies in time of each of the individual simulations has a positive or negative bias relative to the model ensemble mean. The magnitude of this bias depends on how much the 1979-1983 simulated value deviates, due to unforced variability by chance, from the climate state of the simulation for this period.

            If the model simulations in the figure were properly aligned to their respective climate state of 1979-1983, and not to the climate state plus the individual chance deviation from this state due to unforced variability, the spread of the model simulations in time would be narrower in the figure, even though the model ensemble mean anomaly with time would be the same.

            And like each individual model simulation has its own bias in the figure, relative to the model ensemble mean anomaly, so does the anomaly with time of the satellite data. The anomaly curve of the satellite data in the figure is biased toward a colder anomaly relative to the model ensemble mean, because nature was in a positive phase of unforced variability, just by chance, relative to the climate state of the period 1979-1983. The satellite data in the figure are also biased to a colder anomaly relative to such individual model simulations whose biases are less negative than the bias of the satellite data.

            The satellite data are only about properly aligned in the figure to such model simulations that were in a similar phase of natural variability for 1979-1983 as nature.

          • In the last sentence, replace “natural variability” with “unforced variability”.

          • Mike M. says:

            Andrew FL,

            “some of them will be anomalously warm in the zeroing period, some anomalously cool, and the result cancels out.”

            That is my point. The anomalies in the models cancel, but the anomalies in the observations do not since we do not have an ensemble of Earth’s to average. The result is an offset.

  29. Mike M that is so BS! The models are way off and this is just more of the same BS from the AGW CROWD which is if the data does not agree with their stupid theory change it or something is wrong with the data.

    The reality is AGW THEORY is wrong and the data is never going to conform to it.

    • Mike M. says:

      Salvatore,

      What is “so BS”? The fact that I think the models are wrong, because they don’t agree with the data? Or that fact that I think that comparisons of data with models should be made carefully, with all due efforts taken so as not to bias the results?

  30. See how sickening AGW enthusiast are they will do anything to give life to their soon to be obsolete theory.

  31. Jeff Id says:

    Roy,

    I have repeatedly made the same point to people. Those who are claiming the last datapoint of climate change is on the bottom edge of the uncertainty window so they haven’t failed are incorrect. It is the TREND! we need to consider. They know it I believe because they are technical but the level of obfuscation is extreme.

    I have made the same argument regarding your exact graph referenced in this post many times.

    Warming is about the gradual accumulation of excess energy at a point in a power flow. If the rate of accumulation is wrong (trend), the model is wrong.

    Thank you for saying it again!

    • Jeff Id says:

      And just to pile on to my own comment. If there were a single point or even several points out of whack and the trend was right — I wouldn’t be a skeptic!

    • ehak says:

      Then why not show the trends. Of the surface observations and the trends (not just the mean) of all the model runs.

      Avoid this funny graph with this ridiculous aligning at the start. Even aligning of the model runs. How could anyone come up with such an idea?

      • mpainter says:

        ehak, did you observe how egregiously the models perform in the chart posted above? Compare their product with the real world data, displayed in the graphic thoughtfully provided above by Dr. Spencer, our host and a real scientist. The climate models perform absurdly, do they not?

        • ehak says:

          Ok. They perform absurdly.

          Then why is it necessary for Christy to zero in on a 5 year period? When they perform in this absurd way it is not necessary to artificially lower the temperature series by using that trick.

      • Jeff Id says:

        Actually, Steve McIntyre’s rebuttal of the Santer paper a couple of years ago did just that. It was rejected with one of the final comments being (in paraphrase) we already knew that.

        Other than that, there are dozens of resources which show the trend lines and their CI’s and how dramatically out of whack the models are.

  32. For a more detailed exposition of why this graph is misleading, see e.g. http://climatechangenationalforum.org/john-christy-richard-mcnider-roy-spencer-flat-earth-hot-spot-figure-baseline/ (the section entitled “Model-observation comparison”).

    Jos Hagelaars reproduced Spencer’s graph, and the tactics that were used to produce this graph are telling.

    This is (an English version of the originally Dutch) critique Marcel Crok was referring to.

    • Mike M. says:

      Bart,

      Your argument is at least half wrong. For comparing a trend, it is appropriate to baseline to one end of the interval, not the middle or the mean. That is especially true with a spaghetti plot in which it is hard to see the individual curves. If you baseline to the mean, the viewer’s perception is then skewed by the general appearance of overall agreement; but that has nothing to do with the trend, it is all from forcing the data to have the same mean.

      That 5 years is too short a period is a more valid criticism, but a sufficiently long period is problematic with the relatively short satellite record.

      • Neven says:

        In a comment on Bart Verheggen’s blog Jos Hagelaars produced a similar graph to explain how a different, but equally short base line produces a graph that shows models and obs are in almost perfect agreement. Of course, we know there’s no perfect agreement because of short-term influences that the models show less well (they’re for predicting climate, not weather), but it just goes to show how easy it is to either minimise or maximise the discrepancy.

        As I’ve argued over on Marcel Crok’s blog the problems with using the graph in a presentation as he did, are:

        1. The misleading tricks to maximize the discrepancy (see for instance this animation).
        2. The graph is from 2013, it’s almost 2016 now, with 2014 and 2015 being the warmest years globally on record.

        I believe Marcel asked Drs. Spencer and Christy for an update (but hasn’t received it). I would like to ask them to wait for a couple of months, so that they can include the results from the current El Niño as these have a very pronounced effect on the satellite data charts.

        But you know what, I don’t believe they’ll do that, because most probably a maximized discrepancy will not look big enough to convince anyone but the fans. I’d love to be proven wrong, though.

  33. Larry Kummer says:

    Roy,

    This is great material! Two questions…

    What is the scenario input to the CMIP5 models, the assumed emissions that generate the projections shown? Is it one of the RCPs, and if so which one?

    What is the transition date from the hindcast (input of actual emissions) to forecast?

  34. Larry Kummer says:

    Bart,

    Leaving aside the question of statistical mechanics, how do you describe the difference between Jos Hegelaars’ graphs #1 and #3 (like Roy’s)?

    The major difference I see is the wider range of model projections in #3. In both the instrument temperatures are below most projections, so they tell roughly the same story. I suspect (guess) that people’s interpretation of these varies with their preconceptions.

    More broadly, drawing interpretations from these complex graphs is inherently problematic. Which is probably why both sides in the climate wars deploy them as “gotchas”. We’re not equipped for the visual analysis of complex quantitative information, as quite a bit of research has shown. For example, Meir Statman at Santa Clara U has shown that the meanings of some commonly cited graphs in finance are the *opposite* of what people conclude from seeing them.

    Which is why we have numbers in addition to pictures.

  35. Dan Pangburn says:

    Popular assessments of climate sensitivity have been declining over the years. Eventually it will be broadly realized that climate sensitivity is zero.

    Evidence CO2 has no effect on climate & Identification of what does (97% match since before 1900) are at http://agwunveiled.blogspot.comCO2

    That CO2 has no effect on climate is also demonstrated in a peer reviewed paper at Energy & Environment, Vol 26, No. 5, 2015, 841-845

    • mpainter says:

      Agreed. Climate sensitivity is effectively zero. We know that CO2 made no contribution to the warming of circa 1920-45 and we know that the late warming that ended early this century was due to reduced cloud albedo globally. AGW is a modern day witch hunt conducted by modern day witch hunters.

      • mpainter,

        “Climate sensitivity is effectively zero.”

        How has climate ever changed?

        “We know that CO2 made no contribution to the warming of circa 1920-45”

        How would you know that?

        “we know that the late warming that ended early this century was due to reduced cloud albedo globally.”

        How would you know that?

        What changed the cloud albedo, globally? Clouds are not an external climate driver. They are a dependent variable.

        “AGW is a modern day witch hunt conducted by modern day witch hunters.”

        A conspiracy that must have been going on over decades now, of which thousands of scientists from all over the world, all relevant international academic institutions, the scientific journals, the media, politician in governments (not Lamar Smith, though. He is fighting it) are all part of it.

        And no whistle blower has come forward for the whole time, exposing this global, evil conspiracy. But I guess, this is just proof for how all-powerful this conspiracy is. Everyone who wanted to expose it has been vanished, and the memories of them that were in the heads of their family members and friends, and all records of them have been erased (that will probably happen to Lamar Smith too. No one will have ever heard of him, eventually. But, perhaps, the tin foil on your head will help you).

      • mpainter says:

        I said witch hunt, not conspiracy. That’s your word Jan. And CO2 is the figurative witch. Here’s the truth: atmospheric CO2 is entirely beneficial and the greatest favor done to the biosphere by humankind has been to increase its presence in the atmosphere.
        The AGW warming which has yet to manifest itself would also benefit the biosphere.

        Your view that CO2 is the “control knob” of climate is manifestly untrue, a credo teetering atop a heap of false assumptions and dubious science.

        I have already given you my arguments for this. Go read the archives for the answers to the rest of your questions. Adios.

        • It really doesn’t matter whether you say “conspiracy” or whether you use another term. It’s obvious that you believe in some omnipotent sinister plot that had invented a big lie and has been able to take control over the universities and other research institutions, scientific academies, science journals, media, governments, all over the world. They are all in it, aren’t they? They all are spreading this “lie”.

          As for what is “the truth”. There is no scientific truth without evidence. All what you have to offer regarding what you claim was “the truth” are mere assertions without any evidence. Your “skepticism”, like the “skepticism” of the “skeptics” in general, is a religion. It is a religion because it’s purely faith based. It’s not based on scientific evidence.

          • mpainter says:

            A reduction in cloud albedo at the end of the last century fully accounts for the warming. That settles it, as far as I am concerned.This is solid, incontrovertible data, and it is utterly ignored by you and your kind. That tells me all that I need to know about “climate science”. My science maxim: Dubious science comes from Dubious Scientists.

            Still denying the pause, Jan? You lack reasonableness. You are tiresome.Your views are rigid, dogmatic. You and your CO2 “control knob”. You are in the grip of the mass hysteria that is the AGW movement and your comments show it, almost everyone. What do Karl and Peterson have to hide, Jan? If someone took such an interest in my work I would feel flattered. We shall one day have a look see at the sort of science these guys do in the dark. Hello Climategate multiplied.

            And finally, you attribute thoughts to me that spring from your own febrile imagination. You seem to have gotten yourself into a real fever. Lamar Smith has got you rattled, it seems.

            Have a great day

          • “A reduction in cloud albedo at the end of the last century fully accounts for the warming. That settles it, as far as I am concerned.”

            You haven’t answered my question what caused the change in the cloud albedo. “Reduction in cloud albedo” doesn’t explain anything, since the cloud albedo is not a climate driver. It’s a dependent variable. Or did the cloud albedo change by pure magic?

            Also, you claimed that climate sensitivity was “effectively Zero”. You haven’t answered my question how climate has ever changed then. And how could a cloud albedo change (caused by pure magic), have led to global warming, if climate sensitivity was effectively Zero?

            Apparently, climate sensitivity was effectively Zero, unless it wasn’t. Whatever is convenient at the moment.

            “Still denying the pause, Jan? You lack reasonableness.

            “Debunking the climate hiatus”

            Abstract
            The reported “hiatus” in the warming of the global climate system during this century has been the subject of intense scientific and public debate, with implications ranging from scientific understanding of the global climate sensitivity to the rate in which greenhouse gas emissions would need to be curbed in order to meet the United Nations global warming target. A number of scientific hypotheses have been put forward to explain the hiatus, including both physical climate processes and data artifacts. However, despite the intense focus on the hiatus in both the scientific and public arenas, rigorous statistical assessment of the uniqueness of the recent temperature time-series within the context of the long-term record has been limited.
            […]
            We find compelling evidence that recent claims of a “hiatus” in global warming lack sound scientific basis. Our analysis reveals that there is no hiatus in the increase in the global mean temperature, no statistically significant difference in trends, no stalling of the global mean temperature, and no change in year-to-year temperature increases.”

            (doi:10.​1007/​s10584-015-1495-y)

            I don’t know whether the results of this scientific study are correct, but it addresses exactly the questions that I asked.

            I don’t lack “reasonableness”. I’m on the side of scientific rigor. You are not. You are on the side of ideology driven propaganda.

            “What do Karl and Peterson have to hide, Jan? If someone took such an interest in my work I would feel flattered.”

            If you “feel flattered”, if someone wants to sniff through all your personal email to find something incriminating against you, that is fully up to you, of course.

            You apparently have an authoritarian mindset, so it seems to be beyond your comprehension that other people don’t feel in this way.

            “We shall one day have a look see at the sort of science these guys do in the dark. Hello Climategate multiplied.”

            This comment is already the evidence for the bad faith, with which you are approaching this matter. You are assuming wrongdoing and fraud as given (as also evidenced by the many of your assertions about the alleged fraud collectively committed by climate scientists), and then you are trying to find the confirmation for it. Tell me one good reason why I shouldn’t think that Lamar Smith and Co. are approaching this with the same bad faith, particularly since no accusation has been made and no initial evidence presented for singling the scientists out and making them a target of an investigation. The “investigation” is a fishing expedition w/o any prior justification, which is apparently done with the hope to find something that finally justifies it.

            The fake climategate is a good example what they hope for. Looking as long through the personal communication between scientists until they find something where the scientists may have said something wrong, to be used against them. Or quote-mining the emails, i.e., stripping quotes from their context, to fill the quotes with another meaning, to be used against the scientists. “Skeptics” have sufficiently demonstrated how they do that with the stolen emails from the fake climategate.

            The concept of freedom of science apparently doesn’t exist for you, as evidenced by your support for the harassment by someone with power, of scientists for publishing a scientific study whose results are in conflict with the ideology of the ones with power.

            What else can we expect from people like you, if you have all the power in the country? In addition to even more aggressive harassment and intimidation of scientists, I suspect, you would defund all science that produces scientific results which are in conflict with your ideology. Will scientists who don’t denounce the science on anthropogenic global warming be put into prison under the government that you would like to have?

          • mpainter says:

            For any who are interested:

            John McLean, 2014. Late Twentieth Century Warming and Variations in Cloud Cover.
            It can be downloaded from the internet. He uses data from NASA Earth Observatory, I believe. He computes an increase in insolation of 2.5 W/m^2 to 5 W/m^2 during the interval 1985-2002; due to a reduction in cloud albedo.

            I have referred this to you before, Jan, at your insistence. You sneered at it without reading it, earlier this year. You said that it did not meet the “control knob” criteria. I’ll bet that you don’t read it this time, either.

          • mpainter says:

            As far as the pause is concerned, I use my own eyes and my own judgement, which I find serve me very well, indeed. See my above comments on the stepup at circa 2000.

            Your name is on their list and it is circled, Jan. They have their methods of getting people to talk. You will also talk. You will tell all. Try to stay calm, it is only worse if you allow yourself to get frightened. Above all, do not struggle when they come for you.

        • JohnKl says:

          Hi Jan P Perlwitz,

          You state:

          “It’s a dependent variable. Or did the cloud albedo change by pure magic?”

          Nature is not a controlled experiment. Everything in nature ( read universe ) is in motion and thus effected by outside causes. The sun, atmospheric particulates and many other causes can effect albedo. Truly, a more seemingly nit-picky, irrelevant statement would be hard to derive. Do you imagine that CO2 is the only force that counts? May the farce be with you!

          Have a great day!

          • Nothing that I have written anywhere implies that CO2 was the only factor influencing the state of the Earth system. Nor do I know any scientist who works in the field, who would claim such a thing. The assertion, which comes here in the form of a rhetorical question, that CO2 was considered the only factor is one of the very common straw man arguments brought by “skeptics” (And then, based on this straw man argument, alleged contradictions are being asserted between what climate science says and what has been observed, e.g., the divergence between continuing CO2 increase in this century and the observed time series of the global temperature anomaly that didn’t follow this CO2 increase in a linear way).

            mpainter, referencing McLean, claims that the global temperature increase had been caused by reduction in the albedo due to a reduction in the global cloud cover. One point among others of my criticism of the McLean paper is that this doesn’t explain anything by itself, because cloud cover, unlike anthropogenic CO2 or solar activity, is not an external climate driver. Cloud cover is a variable that responds to changes in the environmental conditions for cloud formation. Clouds are also part of various feedbacks. So, unless McLean can identify an external climate driver (here “external” means one that isn’t itself a dependent variable that responds to the changes of other physical variables in the system on the time scale considered) that changes the cloud cover, he hasn’t really explained anything. An external driver could be, for instance, anthropogenic aerosols via the indirect aerosol effect on clouds. But it would have to be shown that a decrease in this effect was sufficient to explain the reduction in cloud cover.

            Another point is that McLean uses false numbers in his estimate. He assumes that 79 W/m^2 of solar radiation are reflected by clouds, referencing a paper by Trenberth et al. on the global energy budget. But the 79 W/m^2 in the Trenberth et al. paper are the amount of solar radiation reflected by clouds and atmosphere. Latter includes scattering by gases and aerosols. McLean also totally neglects that clouds not only reflect solar radiation. They also absorb and re-emit longwave radiation. They exert a greenhouse effect. The net effect of clouds on the radiation balance in the atmosphere is the sum of the effect on the solar radiation and on the thermal radiation. Because these two effects act opposite to each other, the net effect of clouds on the radiation balance in the atmosphere is much lower than assumed by McLean. About -20 W/m^2 compared to McLean’s -79 W/m^2. Thus, the effect of a 6% reduction in total cloud cover on the change in the radiation balance would be accordingly much lower than claimed by McLean. And this is already a substantial (perhaps fatal) flaw in the paper, even w/o the point below.

            And yet another point is that a the ISCCP data may overestimate the decrease in the total cloud amount.
            (see http://www.wcrp-climate.org/documents/GEWEX_Cloud_Assessment_2012.pdf, page 127 ff.)

            McLean doesn’t take this into consideration at least by discussing uncertainty in his own estimates. Also, why did he only use the ISCCP data for the analysis? AVHRR Pathfinder PATMOS-x and HIRS-NOAA are similarly long data sets.

            Extraordinary conclusions require extraordinarily evaluated evidence, instead of arbitrary assumption and questionable use of data.

          • mpainter says:

            Jan Perlwitz says: “Nothing that I have written anywhere implies that CO2 was the only factor influencing the state of the Earth system.”
            ###

            Then what are such statements as this supposed to mean (quoting you from a previous comment): “CO2 is the control knob of climate”
            <<<<<>>>>>>

            Jan, I suggest that you read studies by our host, Roy Spencer, who has written extensively on clouds and who holds the view that global cloud cover variation has a large effect on temperatures.

            However, if you maintain that there is no long term variation in global cloud cover, I can only point out that the data shows otherwise.
            Or, if you maintain that such long term variation has no effect on temperatures, it can only be that you ignore the basic physics of climate.

          • mpainter,

            “Then what are such statements as this supposed to mean (quoting you from a previous comment): “CO2 is the control knob of climate”

            A quote by me? To assert that CO2 was the only factor influencing the state of the Earth system? Is that a fact?

            Full quote with proof of source, where I supposedly said something like this, please!

            “However, if you maintain that there is no long term variation in global cloud cover, I can only point out that the data shows otherwise.”

            I don’t need to “maintain” that, because I didn’t say anything like that.

            What I said is that clouds are not a climate driver, unlike, e.g., anthropogenic greenhouse gases, anthropogenic aerosols, or natural solar variability. Clouds do not change by themselves by some sort of magic. Since they are not a climate driver they can’t be the cause of climate change. Clouds fully depend on other variables in the system. Clouds respond to other changes, and, thus, they can, of course, show long-term variations, e.g., in response to the ongoing climate change, which itself is caused by something else. And by responding, clouds are also part of various feedbacks because of their radiation effect, amplifying or diminishing the effect on temperature or climate, in general, by the climate driver.

            So, now tell me. What do you think about McLean using a false number in his paper for the albedo effect of clouds in the short wave range? What do you think about McLean totally neglecting the effect of clouds on longwave radiation? Do you think that a correlation between cloud changes and temperature changes proved that the cloud changes caused the temperature change? Do you think that uncertainty due to possible artifacts in a data series should be taken into account when doing an analysis using this data series in a scientific study? Should a scientific study use all available data, or only the ones with which the conclusions seem to be supported best?

          • mpainter says:

            McLean posited some causes of cloud change, which you seem to have ignored.
            It hardly matters, does it? Your criticism in this respect diverts from the main principle: decreased cloud cover means increased insolation. There can be no dispute that this occurred during the period of the study, your obfuscation notwithstanding.

            Yes you did use that phrase (control knob) and if you make a wager with me I will look it up. But I wish to be paid for my trouble.

          • Norman says:

            Jan P Perlwitz,

            I did find this quote from an earlier Roy Spencer blog from you.

            “If you took out the CO2 from the atmosphere, most of the water vapor would condense and precipitate out quickly, plunging Earth into a deep freeze, due to this positive feedback. CO2 is the “control knob” for the water vapor in the atmosphere.”

            From this blog post:
            http://www.drroyspencer.com/2015/05/uah-v6-0-global-temperature-update-for-april-2015-0-07-deg-c/

          • Norman,

            Yes, I called the CO2 a “control knob” for the amount of water vapor in the atmosphere, since water vapor, even though it is also a greenhouse gas, is not a climate driver either. Like clouds are not a climate driver.

            However, the assertion by mpainter was a different one. He/she asserted that I had said that CO2 was the only factor that influenced the state of the Earth system. Which is a very different statement. It’s absurd to attribute such a statement to me. That would be in contradiction to what I have said in the past about what various factors can influence climate variability, or to what science says in general about all the factors that influence the Earth system and climate.

          • mpainter says:

            How now, the internet remembers well, does it not? See Jan wriggle.

          • mpainter:

            “Jan Perlwitz says: ‘Nothing that I have written anywhere implies that CO2 was the only factor influencing the state of the Earth system.’
            ###

            Then what are such statements as this supposed to mean (quoting you from a previous comment): ‘CO2 is the control knob of climate'”

            (http://www.drroyspencer.com/2015/11/models-vs-observations-plotting-a-conspiracy/#comment-201304)

            Jan P Perlwitz:

            “A quote by me? To assert that CO2 was the only factor influencing the state of the Earth system? Is that a fact?

            Full quote with proof of source, where I supposedly said something like this, please!”

            (http://www.drroyspencer.com/2015/11/models-vs-observations-plotting-a-conspiracy/#comment-201306)

            I’m still waiting for the quote with proof of source.

            The statement by me where I talk about the relationship between CO2 and water vapor in the atmosphere it’s not it.

          • mpainter says:

            Jan, your wriggles do not convince. You clearly believe that CO2 controls climate.

          • The assertion was that I would consider CO2 the only influencing factor on the state of the Earth system. But not some other statement.

            I’m still waiting for that you bring the alleged quote by me with proof of source, where I supposedly said something like this. Are you going to bring the quote? Or are you not? I guess not.

          • mpainter says:

            Norman furnished the quote. It is enough. It makes it clear that you see CO2 as the “control knob” of climate, and you have not denied that such is your belief.

            No doubt you were instructed in this by James “boil the ocean” Hasen, notorious climate alarmist, and your mentor. Hansen also believed that CO2 was the “control knob” and that the onset of the Holocene was determined by this “knob”. Well, Hansen in 2013 formally repudiated his “boil the ocean” remark. Control knob, indeed.

          • http://www.drroyspencer.com/2015/11/models-vs-observations-plotting-a-conspiracy/#comment-201401

            mpainter,

            You are the one who is wiggling. You wiggle and wiggle, using one strawman argument after another, while you are being asked for not more than providing a quote by me and proof of source to back up your assertion that I said CO2 was the only factor influencing the state of the Earth system.

  36. Andrew_FL says:

    Another thought: plot the differences (Model-Observations). The zeroing period becomes irrelevant.

  37. Olof R says:

    Hi Roy,
    I agree with those who are complaining that the graph is misleading.

    Firstly, Hadcrut4 should not be included in the graph, since it shows model data weighted to emulate satellite data (not surface data).
    For a fair comparison with Hadcrut the models should be Hadcrut masked, and made up by modelled 2 m land temps and SST in the right places and proportions.

    Secondly, It is not fair to baseline the models and obseravations at 1979-1983. During that period the real world encountered one of the two strongest el Nino events of the 20th century. May we call it a 50-year recurrence event? How many of the 90 models started with a 50-year el Nino in the base period?
    The last five year period is centered around a strong la Nina event. How likely is that among the 90 models?
    How many of the models had more el Ninos in the beginning and more la Ninas at the end of the 1979-2013 period?
    To conclude, I believe that period chosen, considering the natural variation, disfavour the real world vs that of the 90 modelled worlds..

    At last, when models and observations disagree, an explanation could be that the observations are bad.
    The satellite series deviate from weather balloon data after year 2000. If we put Ratpac A 800-350 hPa global in the graph above the last point would be at 0.45 C, clearly better than the satellites.
    We could also consider the RSS uncertainty ensembles, which if I get it right have a mean and 95% CI of 1.34+/-0.68 C per century. The upper bound would produce a trend quite close to that of the model mean above.

    • mpainter says:

      If you would more completely read the post, and Dr. Spencer’s previous responses to similar objections, you might find your questions answered.

      You say “At last, when models and observations disagree, it could be that the observations are bad”
      ####

      I consider such a statement as unscientific and indicative of the anti science that has emerged in the attempts to prop up the collapsed AGW hypothesis.

  38. What is “so BS”? The fact that I think the models are wrong, because they don’t agree with the data? Or that fact that I think that comparisons of data with models should be made carefully, with all due efforts taken so as not to bias the results?

    Mike it the comparisons of the data with the models which should be made more carefully which is BS.

    The models have proven wrong by any reliable data source for years and years this is just not some fluke.

    This is only the beginning by the end of this decade the models will be twice as much off as they are currently.

    People like you will probably still say let us question the data the comparisons have not been made in an adequate manner. That is a joke.

  39. mpainter says:

    Also, you seem to blame ENSO on the discrepancy between models and real world data, as if this justifies the egregiousness of the models. This is spurious reasoning. ENSO is a process of variation in meridional ocean overturning, itself a prime determinant of global temperature fluctuations.

  40. You say “At last, when models and observations disagree, it could be that the observations are bad”
    ####

    I consider such a statement as unscientific and indicative of the anti science that has emerged in the attempts to prop up the collapsed AGW hypothesis.

    From mpainter which is exactly 100% correct.

    AGW enthusiast always try to say the data is wrong if it does not agree with their soon to be obsolete theory.

    • Olof R says:

      Well, if models and observations don’t agree, there are three possible explanations:
      -the models are wrong
      -the observations are wrong
      -the comparison is unfair
      Or combinations of those three components..

      I believe that all three explanations contribute to the discrepancy in the spaghetti graph above.
      At least some models are wrong. According to Schmidt et al 2015, the forcings could be wrong in the recent decade. Some models may run on the wrong TSI.
      The comparison is not fair, at least with Hadcrut.
      Also, observational data suggest up to 60 year natural cycles. To avoid bias the base should be 60 years. That’s not possible with satellite data. The second best is to choose a base with equally warm and cold ENSO events,e.g 1991-2010.
      The observations could be wrong, but the surface indices are likely not very wrong. The trends are all inte range of 1.6-1.8 for the period 1979-2013, and the individual 95% CI is typically 0.10-0.15.
      The spread and uncertainty in troposphere indices is much larger, reanalysis and weatherballon data are similar to surface data, whereas satellite data have wide uncertainty bounds, which in the upper regions also cover the other indices mentioned above.

      • mpainter says:

        Olof,
        Many errors in your comment:

        1. “Observations are wrong”. This is an egregious claim, entirely unsupportable. All the temperature data sets show the egregiousness of the models. Your claim that all data sets are wrong is ludicrous.
        2. “Some models may run on the wrong TSI”. TSI does not fluctuate by more than .1%. This has no effect on temperatures here on earth, hence your claim is spurious.
        3. “60 year natural cycles” is conjecture. Your statement concerning any bias introduced by this claimed cycle is dogmatic, not scientific.
        4. ENSO cycles have no permanent effect on climate. Your suggestion that these bias the record is more faulty reasoning.
        5. Flagrant cherry picking by you in choosing the interval 1979-2013. For example, a slightly different cherry picked interval of 1980-2012 gives a temperature increase of only 0.1°C for that thirty two year interval. Your cherry picking is gross bias.
        6. UAH data bounds are very slight, less than thermometer data. You baldly claim otherwise.

  41. No global warming at all for 18 years 9 months – a new record – The Pause lengthens again – just in time for UN Summit in Paris

    No global warming at all for 18 years 9 months – a new record – The Pause lengthens again – just in time for UN Summit in Paris

    Read more: http://www.climatedepot.com/#ixzz3qd2R1IDL

    THAT IS THE REALITY EVERYONE!!!!

  42. Shelama says:

    Gavin is a lame, uninformed, global warming activist blogger?

  43. Shelama says:

    Gavin is a lame, uninformed, global warming activist blogger??

  44. Jan P Perlwitz says:

    Hi Jan P Perlwitz,

    You absurdly claim:

    “As for what is “the truthâ€. There is no scientific truth without evidence. All what you have to offer regarding what you claim was “the truth†are mere assertions without any evidence. Your “skepticismâ€, like the “skepticism†of the “skeptics†in general, is a religion. It is a religion because it’s purely faith based. It’s not based on scientific evidence.”

    Tell me Jan since you claim to seek evidence what EVIDENCE do you have that the ~< .5 deg centigrade warming apparently measured by satellites since 1979 has caused more harm than if the temperature had not risen at all? What EVIDENCE do you have as to what the global temperature average is since the satellite, ground and other measures conflict and since the terrestrial surface area measured isn't complete? What EVIDENCE do you have that CO2 caused any of the apparent warming instead of say a change in Albedo which apparently has been observed especially during the 1998 peak? What EVIDENCE do you have that yourself, NOAA, the IPCC and any other collection of self proclaimed climate saviors can do anything at all to alter the climate temperature a hundredth of a degree centigrade? So many more evidence seeking questions could be asked. We await with serenely snickering at the very idea you any one else has a clue regarding any of the aforementioned questions. It's like watching paint dry.

    Have a great day!

    • JohnKl says:

      Hi Jan P Perlwitz and everyone,

      You are correct Jan it was not from you! I wrote it and did not intend to discredit you. I thought I had place it under my own moniker and it didn’t come out that away. Again, I apologize.

      Have a great day anyways!

      • JohnKl says:

        Hi Jan,

        Their does seem to be some weird writing in the post which I had nothing to do with. The post did not appear at first when I posted it. It later came up garbled and with your moniker. It was not my intention.

        Have a great day!

  45. How pathetic and reprehensible is that, trying to discredit me by writing pure garbage and using my name as alias for it.

    To avoid any confusion, that comment was not by the real Jan P Perlwitz.

    I really must have hit the nerve of some science rejectionist.

  46. Gordon Robertson says:

    Roy…you are your own worst enemy. Why you insist on paying homage to modelers by dabbling in their black art is beyond me. And why you even mention a baseline of 1979 – 1983 seems incredible to me.

    I have always associated UAH data with the 1980 – 2010 baseline. Why would you get sucked into discussing a 1979 – 1983 baseline to accommodate modelers?

    • JohnKl says:

      Hi Gordon Robertson,

      Great post. You state:

      “Why you insist on paying homage to modelers by dabbling in their black art is beyond me.”

      In past threads, I’ve noted that climate models of temperature and the like especially historical data re-constructions relying on proxy data are often simply a creative fantasy wall art production of imaginary data. This is likely indulged and/or engaged in by either the extremely gullible, not-so-bright or the very deceptive. Hmmh!

      Have a great day!

      • Gordon Robertson says:

        @JohnKL “I’ve noted that climate models of temperature and the like especially historical data re-constructions relying on proxy data are often simply a creative fantasy…”

        John…the 1998 re-construction by Mann, Bradley, et al (hockey stick) illustrates your point. They allegedly gathered 1000 years of tree ring proxy data to demonstrate that the current speculated anthropogenic warming was unprecedented. In one instance, they had one tree as a proxy for 100 years.

        In the 20th century, they noticed the proxy temps were declining while real temperatures were increasing. Mann et all ‘hid the decline’ by snipping off the offending data and replacing it with real data.

        That became known as Mike’s trick, and the keeper of the IPCC temperature data, Phil Jones of climategate fame, bragged about using his trick.

        As far as I’m concerned, modern climate science is largely corrupt and that’s why I am antsy about Roy getting caught up in the climate model corruption, even though his intentions are honourable. It doesn’t seem smart to knock model output on the one hand then use model reconstructions to debate with the modelers.

        With regard to tree ring proxies a la the Mann hockey stick, the late John Daly offered clarification. He pointed out there are no trees in the oceans, in the deserts, above certain altitudes on mountains, in taiga/tundra areas, and on the prairies, in general.

        Daly reckoned tree ring proxies could cover no more than 15% of the planet, yet the IPCC jumped at Mann’s hockey stick as proof of unprecedented warming in the 3rd review. By the time of the 4th review on 2007, they were running around with bags over their heads trying to dissociate themselves with the hockey stick.

  47. Dan Pangburn says:

    Jan – If you had the engineering science skill to grasp the analysis at http://agwunveiled.blogspot.com you might understand what causes climate change (97% match since before 1900) and the evidence (for the last 500 million years) that CO2, in spite of being a ghg, has nothing to do with it.

    • Well, I guess, I don’t have the needed professional qualification that a “licensed mechanical engineer” has, which I would need to be able to keep up with your “engineering science skills” that make you know everything better than all the scientists together, who do actual research and publish in the field, and that enable you to refute with some blog post in the Internet a whole body of decades-long research that has been published in many thousands of papers in actual, peer-reviewed science journals.

      Carry on!

      • Dan Pangburn says:

        Jan, Your statement “all the scientists together” discloses that you have not been paying attention.

        A discussion of some of the mistakes made by the ‘consensus’ is at http://consensusmistakes.blogspot.com

        The on-going long-term downtrend in average global temperature has been temporarily slowed by short term up-trends in ENSO and AMO which are about to end if they have not already ended (reported data has been up to more than a month after the event). The short term up-trends are about to end with the long term downtrend steepening within the next few months.

        • I really don’t know what you want from me. I didn’t say anything about “consensus”. I referred to “all the scientists together, who do actual research and publish in the field” with respect to the scientific qualification of this group of people. In your previous comment, you claimed your superior qualification that you had with your “engineering science skill” as “licensed mechanical engineer” (according to your website), compared to my qualification. I acknowledge that I cannot keep up with that, like none of the scientists can, who belong to the group mentioned by me. And I admire how you refute in a simple blog post a whole body of decade-long scientific research published in the peer-reviewed science literature. What else do you want me to say?

          Carry on!

  48. john byatt says:

    [Response: Happy to! The use of single year (1979) or four year (1979-1983) baselines is wrong and misleading. The use of the ensemble means as the sole comparison to the satellite data is wrong and misleading. The absence of a proper acknowledgement of the structural uncertainty in the satellite data is wrong and misleading. The absence of NOAA STAR or the Po-Chedley et al reprocessing of satellite data is… curious. The averaging of the different balloon datasets, again without showing the structural uncertainty is wrong and misleading. The refusal to acknowledge that the model simulations are affected by the (partially overestimated) forcing in CMIP5 as well as model responses is a telling omission. The pretence that they are just interested in trends when they don’t show the actual trend histogram and the uncertainties is also curious, don’t you think? Just a few of the reasons that their figures never seem to make their way into an actual peer-reviewed publication perhaps… – gavin] – See more at: http://www.realclimate.org/index.php/archives/2015/11/unforced-variations-nov-2015/#sthash.ovAAZMy6.dpuf

    • mpainter says:

      So do the GCMs project a flat trend such as we have seen throughout this century? Oh, they don’t ? What do they project?

      Oh, a trend of 0.2° to 0.4° per decade…Oh.

      • “Oh, a trend of 0.2° to 0.4° per decade…Oh.”

        This range is totally made up by you and not a fact.

        The model ensemble as a whole projects a distribution of trends for a given (transitional) climate state. This distribution can be expressed by a median or mean trend and by the variance of the trends. For short time periods, even if there is a robust long-term warming, this distribution of trends is very wide, and it also includes “flat” and negative trends. The distribution gets narrower with increasing length of the time periods over which the trends are estimated.

        Nature provides only a single realization of all possible statistical realizations for a given climate state (we can’t re-run Nature over and over again).

        Among the whole distribution of model simulated trends, there are some that are also “flat” and similar to the one observed in Nature.

        It’s like having two dice. Each throw with a die is a realization of a chance event. 100 throws (model simulations) are done with one die. Only 1 throw (Nature) is done with the other die. Even if the two dice are identical, the one throw with the second die will give you anything between 1 and 6, but not the average value of 3.5 of the 100 throws with the first die.

        To expect that the one trend that is seen in Nature should be reproduced by the model ensemble mean would be foolish. Or to expect that individual model simulations predict the trend observed in Nature. Such an agreement would be purely coincidental. One cannot reasonably expect that the models predict the exact trajectory, i.e, the exact chronological succession of events of a system that is governed by chaotic dynamics (within physical bounds). Expecting from the models that they did would mean to expect the objectively impossible.

      • mpainter says:

        It is indeed a fact. Look at the spaghetti above.

        Model ensemble = composite of egregiousness

        Which composite I see very much impresses you, Jan. Does not impress me a whit.

        By the way, the step-up at 2000-2002, the one you say is insignificant, is at the rate of 10-12°C/ century.

        • “It is indeed a fact. Look at the spaghetti above.”

          From the spaghetti above, one can’t see that the individual model simulated trends for the period between the year 2000 and today were lying between 0.2-0.4 Celsius per decade. This is something you just fantasize into the figure.

          “By the way, the step-up at 2000-2002, the one you say is insignificant, is at the rate of 10-12°C/ century.”

          So what? Using a unit of C/century for a change in an anomaly over merely three years doesn’t make it statistically significant. Statistical significance is determined by relating the change to the variability in the sampled data over this time period. The standard deviation of the sample around the mean change for these three years would have the unit C/century too, then.

          You are fooling yourself by drawing conclusions from something that is just noise.

          • mpainter says:

            The step-up is no blip, but a transitional feature that connects two flat trends of about .25-.3°C difference. No doubt this is the manifestation of the diminishing global cloud albedo discussed by John McLean in his 2014 study Late Twentieth Century Temperatures and Variations in Cloud Cover.
            Probably the effects of this reduced albedo was obscured by first, the Pinatubo event and next, by the ’98-’99 Nino-Nina event.

          • john byatt says:

            Gavin agrees Jan

            Any specific year temperature has both a forced component and a ‘weather’ component (which includes the ENSO state etc). The CMIP5 models are free running which means that the ‘weather’ component is uncorrelated between each model simulation and the observations. If you are looking to see how the forced components line up, aligning on short time periods effectively increases the spread elsewhere by the magnitude of the weather component. More specifically, if you pick a year or short period where the real world was warm due to an El Niño it will shift the models up relative to the observations giving a false impression of divergence. – gavin] – See more at: http://www.realclimate.org/index.php/archives/2015/11/unforced-variations-nov-2015/#sthash.FMKuIlAt.dpuf

          • mpainter says:

            John Bhatt, you say “Any specific year temperature has both a forced component and a ‘weather’ component (which includes the ENSO state etc).”
            ###
            A spurious distinction given in climate scientist newspeak and of no consideration insofar as the temperature record is concerned.

            The ENSO cycle is in fact due to variable meridional ocean overturning circulation. The GCMs are ignorant of this important process, another egregious fault of the models.

          • mpainter says:

            Correction: Byatt, not Bhatt.

  49. tonyM says:

    To paraphrase Feynman, the basis of science is the ability to predict the outcome of an experiment which has never been done. If the predictions fail the conjecture is wrong. If it can’t predict it is not science.

    All climate model predictions on T have failed and failed miserably. That is the experiment!

    That has nothing to do with objections to starting point in the above graphs. What is also clear is that all the model predictions fail on one side. In probability terms this means they incorporate a bias much like a football team never scoring but always kicking the ball out of play on one side of the goal posts; sack the trainer.

    Seems to me that all the models could be improved substantially by judicious use of soothsayers, clairvoyants, witch doctors and the like. From some excuses and rationalizations being propounded here by some I suggest the ancient Oracle of Delphi is chief advisor to most climate model exponents.

    To demand from the world the likes of US$89 trillion (World Bank), tithes on taxes/CO2 trading for the UN and compromised economies with CO2 reductions is indeed elevating this to the holiest religion the world has ever seen based on models which have never been validated. That is indeed an achievement!

  50. richard verney says:

    Jan

    Please explain in simple terms the justification for keeping the models that are running warmer than the ensemble mean?

    As I understand the plot, the dotted black line is the ensemble mean. Given that UAH has continued to track flat since 2013 (the date of the plot), we can already see the very wide gap between the ensemble mean and UAH.

    The discrepancy between the ensemble mean and UAH is already of serious concern, but of even greater concern is the even wider discrepancy with the models that are running warmer than the ensemble mean.

    A re view of all models should be undertaken, and all those models that are running warm outside their 95% confidence bounds should be removed from the model ensemble. A new ensemble mean could then be assessed with the remaining models. That would mean that the ensemble mean would be better at tracking reality.

    Of course, the ensemble mean is a floored concept, for reasons that Dr Brown has expressed many times, and with which comments you are no doubt familiar. But leaving that issue aside, it is about time that the models that are running so obviously wrong are chopped.

    • Richard,

      The model ensemble mean is derived from all simulations. By design, about half of the simulated data will always be above the ensemble mean, and the other half will below the ensemble mean. Considering this, I’m not clear how not “keeping” the half of the models that is above the mean would be a meaningful request.

      And what exactly would mean to not keep them? Not keeping them where?

      Similarly, the 95% range is derived from the distribution of all simulation data. If you have a 95% range, 5% of the simulation data outside of the range still belong to the distribution. If you do not consider them, you would get a smaller 95% range, and 5% of the simulation data would lie again outside of the new range.

      You say,

      “The discrepancy between the ensemble mean and UAH is already of serious concern, but of even greater concern is the even wider discrepancy with the models that are running warmer than the ensemble mean.”

      I infer from your statement that you seem to believe the ensemble mean should ideally follow the observed data? Is this correct?

      If this is correct then this is not a reasonable expectation that you have. The simulation ensemble mean is not comparable to the observation data in this way. The ensemble mean in the figure above is the mean of more than 100 model simulations. Since each data point is a running average over 5 years, that is like averaging the observed data over 500 years in time. The simulation ensemble mean is extremely low-pass filtered data. All the unforced variability up to a time scales of hundreds of years has been removed from the simulation ensemble mean, since the unforced variability is not correlated between the model simulations. The variability in the ensemble mean seen in the figure is de-facto solely the variability in the response to external forcings, which is correlated between the simulations. In contrast, the observed data time series still shows also the contributions from unforced variability, which is still substantial for five-year averages.

      The observed data time series is like any individual model simulation. Each simulation is one realization. Nature only provides a single realization. The variability in time is a combination of both the response to the various external forcings and unforced variability. The unforced contribution to the variability can lead to substantial deviations of the observations from the ensemble mean at times. Even a wandering outside of the 95% range isn’t necessarily a contradiction to the model projected range. 5% (2.5% at each side) of the data points that are outside of the 95% range still belong to the same distribution.

      Surely, if the observed data permanently stay below the simulation ensemble mean then this indicates a warm bias in the simulations (assuming here that the observation data aren’t the one that are biased). I think it’s too early to tell. And even then one still would have to separate first whether this bias was due to the models themselves or due to a difference in the forcings used for the simulations and the ones that are found in the real world, before any conclusions can be drawn about the models.

      • richard verney says:

        Thanks your response.

        You enquire, “I infer from your statement that you seem to believe the ensemble mean should ideally follow the observed data? Is this correct?” The answer is NO. But I do consider that it should more closely follow observation.

        You state: “Nature only provides a single realization” and I agree, and that is why we know as fact that some 89 of the 90 models in the above ensemble must be wrong. The question is, (i) is any one of the 90 models right? and (ii) if so, can we identify the right one? The answer to these questions is (i) probably none of the models is right, (ii) NO, we can’t identify the correct one.

        Talking about a possible warm bias, you state “I think it’s too early to tell”. I disagree. Whilst I accept what you say about the 5 year filtering, I consider that we can already confidently state that the assumptions underpinning the warmest running models is wrong, and that including these models in the ensemble is providing a disservice.

        Some of the models are already some 0.8 to even 1 deg C warmer than observation. This is well outside 2 standard deviations. Unfortunately, the plot contains too much information to be able to easily identify the models by colour coding etc, but I would suggest that all models running outside 2 standard deviations from observation be disposed of.

        Observation (say an average between UAH and HADCRUT) is running at about 0.2degc. Any of the models running at over about 0.6degC are for one reason or another wildly out. It would be interesting to look at those models and ascertain what assumptions are being made with respect to Climate Sensitivity, aerosols etc, so as to form some view as to why they are so grossly devoid from reality, and it appears to me that there is no good case in keeping those models in the ensemble, and they should be disregarded.

        Even if one does not go down the 2 standard deviation route which in my opinion has disconfirmed the model, it is clear from the plot that at least a dozen models are so divorced from reality that they should be binned.

        If the worse dozen or so models were ditched, that would at least bring the ensemble mean somewhat closer to reality, and would be a step in the right direction.

        If this was a clinical trial on the effectiveness of drugs and cancer treatment, the high outliers would have been taken out of use and the trial with respect to those drugs halted. the same approach should be applied to these models.

  51. richard verney says:

    Each model should be investigated as to why it makes the projection that it makes.

    Unfortunately, Dr Spencer’s plot includes too many models to easily identify the model and their respective projection. But if one looks at the too coolest models, (yellow dotted line, & purply brown colur dotted line) which are presently tracking below UAH, one will note that by 2018, they project a significant increase in temperatures. The purply brown model very significant warming post 2018.

    These models are said to be based on basic physics and on the Earth ocean/atmosphere dynamic, so what process causes these models to project significant warming post 2018?

    The yellow dotted model projects reasonably steady warming through to 2008, and then projects a fairly flat trend, ie., a ‘pause’ through to about 2018 whereafter warming recommences. So why did it project a ‘pause’ between about 2008 & 2018. What is the cause of this ‘pause’?

    As I say, we should try and understand the output of each model, and why it produces the projection it does. we may then learn something not only about the model itself, bur also about the real world. Hey, perhaps the yellow dotted model can tell us the reason for the ‘pause’. the warmists have so far produced over 50 possible explanations, but perhaps the answer lies in the yellow dotted model, if only they would look. I doubt it does since I do not consider the models to properly model the real world, but some people claim the models to be useful, so let us see whether they have some real use by examining the projection of each and every model and ascertaining why it has made the projection that it has made.

  52. Thanks, Dr. Spencer.
    I show one of your “Climate Models vs. Observations” graphs in ARVAL’s climate pages, it’s good to have a more detailed explanation on it.

Leave a Reply