
 Home/Blog
NOTE: This is the seventh monthly update with our new Version 6.0 dataset. Differences versus the old Version 5.6 dataset are discussed here.
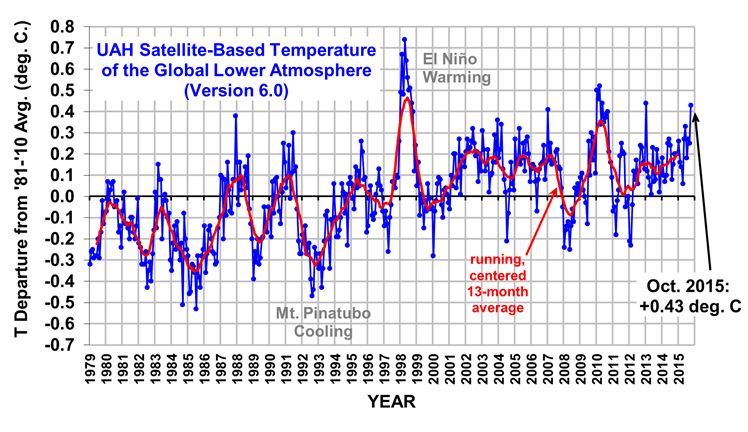
The Version 6.0 global average lower tropospheric temperature (LT) anomaly for October, 2015 is +0.43 deg. C, up from the September, 2015 value of +0.25 deg. C (click for full size version):
The global, hemispheric, and tropical LT anomalies from the 30-year (1981-2010) average for the last 10 months are:
YR MO GLOBE NH SH TROPICS
2015 01 +0.28 +0.40 +0.16 +0.13
2015 02 +0.17 +0.30 +0.05 -0.06
2015 03 +0.16 +0.26 +0.07 +0.05
2015 04 +0.08 +0.18 -0.01 +0.09
2015 05 +0.28 +0.36 +0.21 +0.27
2015 06 +0.33 +0.41 +0.25 +0.46
2015 07 +0.18 +0.33 +0.03 +0.47
2015 08 +0.27 +0.25 +0.30 +0.51
2015 09 +0.25 +0.34 +0.17 +0.55
2015 10 +0.43 +0.64 +0.21 +0.53
As can be seen, there was a rather large jump in the global average anomaly, but instead of it being due to the tropics being warmer (as El Nino continues), it was due to a very warm (but not record warm) month in the Northern Hemisphere extratropics.
(NOTE: Due to a typo on my part, the Sept. 2015 anomaly for the Northern Hemisphere was misreported as +0.14 C last month, when it should have been +0.34 C).
The global image for October, 2015 should be available in the next several days here.
The new Version 6 files (use the ones labeled “beta3”) should be updated soon, and are located here:
Lower Troposphere: http://vortex.nsstc.uah.edu/data/msu/v6.0beta/tlt
Mid-Troposphere: http://vortex.nsstc.uah.edu/data/msu/v6.0beta/tmt
Tropopause: http://vortex.nsstc.uah.edu/data/msu/v6.0beta/ttp
Lower Stratosphere: http://vortex.nsstc.uah.edu/data/msu/v6.0beta/tls


