UAH V6.0 Global Temperature Update for October 2015: +0.43 deg. C

November 2nd, 2015 by Roy W. Spencer, Ph. D.

NOTE: This is the seventh monthly update with our new Version 6.0 dataset. Differences versus the old Version 5.6 dataset are discussed here.

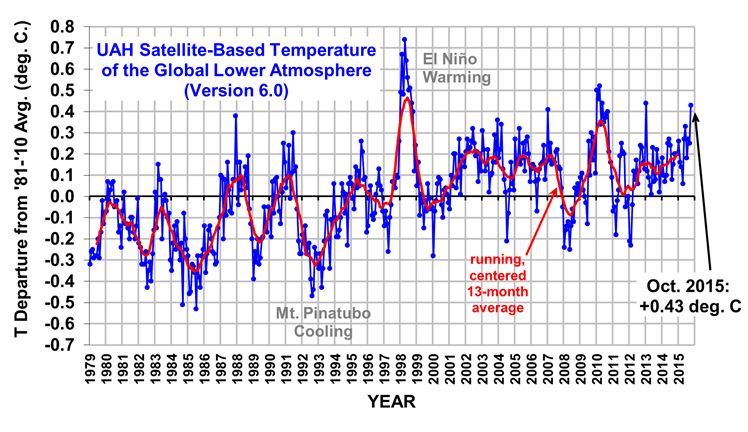
The Version 6.0 global average lower tropospheric temperature (LT) anomaly for October, 2015 is +0.43 deg. C, up from the September, 2015 value of +0.25 deg. C (click for full size version):

UAH_LT_1979_thru_October_2015_v6

The global, hemispheric, and tropical LT anomalies from the 30-year (1981-2010) average for the last 10 months are:

YR MO GLOBE NH SH TROPICS
2015 01 +0.28 +0.40 +0.16 +0.13
2015 02 +0.17 +0.30 +0.05 -0.06
2015 03 +0.16 +0.26 +0.07 +0.05
2015 04 +0.08 +0.18 -0.01 +0.09
2015 05 +0.28 +0.36 +0.21 +0.27
2015 06 +0.33 +0.41 +0.25 +0.46
2015 07 +0.18 +0.33 +0.03 +0.47
2015 08 +0.27 +0.25 +0.30 +0.51
2015 09 +0.25 +0.34 +0.17 +0.55
2015 10 +0.43 +0.64 +0.21 +0.53

As can be seen, there was a rather large jump in the global average anomaly, but instead of it being due to the tropics being warmer (as El Nino continues), it was due to a very warm (but not record warm) month in the Northern Hemisphere extratropics.

(NOTE: Due to a typo on my part, the Sept. 2015 anomaly for the Northern Hemisphere was misreported as +0.14 C last month, when it should have been +0.34 C).

The global image for October, 2015 should be available in the next several days here.

The new Version 6 files (use the ones labeled “beta3”) should be updated soon, and are located here:

Lower Troposphere: http://vortex.nsstc.uah.edu/data/msu/v6.0beta/tlt
Mid-Troposphere: http://vortex.nsstc.uah.edu/data/msu/v6.0beta/tmt
Tropopause: http://vortex.nsstc.uah.edu/data/msu/v6.0beta/ttp
Lower Stratosphere: http://vortex.nsstc.uah.edu/data/msu/v6.0beta/tls


172 Responses to “UAH V6.0 Global Temperature Update for October 2015: +0.43 deg. C”

Toggle Trackbacks

  1. Hi Dr Spencer,

    Thank you for your work and your efforts.

    I have one question on the old 5.6 Version. Are the data still published? On woodfortrees it seems to be still the old version.

    Is it because 6.0 is a Beta Version?

    • yes, we still post the v5.6 data, which we are contractually obligated to provide to NCDC every month. For instance, here:

      http://www.nsstc.uah.edu/data/msu/t2lt/uahncdc_lt_5.6.txt

      I don’t know why woodfortrees is still using the old data.

      • Christian says:

        Spencer,

        Why should anyone use UAH 6.0? Its not published with review and only for now your view on the data, for me no problem, but you cant accept that other people or institutes use a not reviewed Dataset.

        E.g the Bias correction in NCDC, first was reviewed and then the new data was published

        • mpainter says:

          UAH is confirmed by radio sonde data and RSS. It does not seem that you have much basis for complaint.

          In fact, satellite temperature data is much superior to the faulty, much fiddled and tampered with thermometer datasets. Superior, that is, if you like accurate and reliable data. If you like the other kind, then you are entitled to complain, I suppose.

          • Christian says:

            Thats not the point, the point is, its not scientifically to correct biases and not to publish in a scientifically way (e.g a Journal). RSS in past also correct data, but they publish in a scientifically way.

            So i could understand People who wont use UAH6.0

          • mpainter says:

            Say that to the data fiddlers, the GISS, BEST, CRU, NOAA, and all those. Get them to mend their ways. Then you might have a basis to complain here. Otherwise you are not credible.

          • JCH says:

            Wood for Trees is some sort of private endeavor. He is providing a free service that does not appear to be affiliated with any organization. So it would be great if he had time to add UAH Version 6.0, or updates for BEST, which, the last time I checked, has not been updated since it first appeared… years ago.

            Maybe if everybody offered a small tip, he would set aside some of his own time to add some things and do some maintenance.

          • Christian says:

            mpainter,

            They did, NCDC do correct their SST-Data by first publish in a journal and then publish the new data.

            So whats the Problem?

          • JohnKl says:

            Hi Jan P Perlwitz,

            You stated:

            “Alternatively, this could also be an indication that Lamar Smith and Co. are just incompetent to use the actually needed data and the published methodology. What are they going to do with the data anyway? Tell me. Are they going to redo the research done at NOAA? the many man-years of research? How would Lamar Smith do that?”

            The first part of your question is mere speculation. As to your questions, why do you ask participants on a website? If you really wanted to know ask Lamar Smith. As incompetent as he is we have no reason you would be more competent. Ask and you will get an answer of one sort or another, but panicking over what they might find makes you seem scared they may find something. To further reinforce this impression you go on:

            “And what are the emails needed for?”

            Why not? If you work for any organization the overseers will undoubtedly ask to see the fruits of your labor whatever it might be.

            “This has nothing to do with investigating the validity of the science behind the study. Again, firstly, Lamar Smith and Co. are not qualified, and, secondly, I’ve never heard that any scientists who want to reproduce the scientific research done by the authors of a study demand the deliverance of all, or any email conversation between the authors of the study, in the name of scientific reproducibility.”

            Since you admittedly know nothing about the reason for the investigation why do you assume there exists no reason for it. Your first couple of sentences are speculative.

            “Demanding this would be absurd. So what is Lamar Smith looking for in the emails?”

            We may never know unless someone asks. Go for it Jan, but you have not provided any reason why they shouldn’t be fully investigated.

            Have a great day!

        • mpainter says:

          The problem is your credibility. The US House of Representatives Committee on Science and Technology is looking into the methods of the NOAA and they will make a complete report on the “problem”. Be patient.

          • And how exactly are they going to do that? What again is the competence of a political committee to evaluate the methodology that has been applied for a peer-reviewed study in science?

            Starting an investigation of scientists and their email communication for the only reason that a Lamar Smith doesn’t like the results of a scientific study that has been published by the scientists, i.e., for no valid reason whatsoever, is giving a good taste where things would be going, if the Republicans had all the power in the country. Bye, bye, freedom of science. And Lysenko says “Hello!”.

          • JohnKl says:

            Hi Jan P Perlwitz,

            You ask:

            “And how exactly are they going to do that? What again is the competence of a political committee to evaluate the methodology that has been applied for a peer-reviewed study in science?”

            Not much credibility as far as I can see. Which begs the question, then why are these admitted incompetents allowed to regulate human action especially in regards to hydrocarbons at all?

            You go on:

            “Starting an investigation of scientists and their email communication for the only reason that a Lamar Smith doesn’t like the results of a scientific study that has been published by the scientists, i.e., for no valid reason whatsoever, is giving a good taste where things would be going, if the Republicans had all the power in the country. Bye, bye, freedom of science. And Lysenko says “Hello!”.”

            If freedom of science truly exists in this land why are members of the public willingly or not taxed to fund climate research endeavors? Do you suffer from cognitive dissonance? If the Federal government funds their activities why wouldn’t they investigate apparent data tampering and other supposed problems with agencies under their over-funded, under-supervised enormously incompetent theoretical control?

            Have a great day!

          • mpainter says:

            Jan, I’ll wager that the committee has sources inside the NOAA that have informed the chair exactly where to find the data cooking and the disreputable science. Do not you imagine that is so? Or do you imagine that the NOAA is all global warmer and no skeptics? They are going after the emails because they already have a good idea of what is to be found in them, I imagine. I also imagine that they have plenty of these types of leads to choose from and that they must pick the most promising because of time limitations.

            Regarding peer review in climate science, I am skeptical.

          • JohnKl,

            “Which begs the question, then why are these admitted incompetents allowed to regulate human action especially in regards to hydrocarbons at all?”

            Because these are decisions concerning the realm of economy and politics, not the one of scientific truth. Legislating these things is for what they have been elected. They can do this informed by science or ignoring science.

            What scientific truth is can’t be legislated by Congress, though. Nor can the validity of the methodology applied in a scientific study decided by majority vote of the US House of Representatives Committee on Science and Technology.

            You are just constructing a strawman with your question.

            “If freedom of science truly exists in this land why are members of the public willingly or not taxed to fund climate research endeavors?”

            There is no logic in your question. I’m talking about freedom of science, not about your freedom to personally decide that none of your tax money goes to science fields whose results you don’t like.

            Freedom of science is about the free pursuit of scientific research and discourse w/o political meddling into the scientific process or harassment or punishment of the scientists by someone with political power, because this someone dislikes what the results from the scientific research are.

            “Do you suffer from cognitive dissonance?”

            No, I don’t. I think.

            “If the Federal government funds their activities why wouldn’t they investigate apparent data tampering”

            Has Lamar Smith and the US House of Representatives Committee on Science and Technology the targeted scientists or NOAA accused of “apparent data tampering” and presented initial evidence, which would justify to make the scientists a target of an investigation? No, they haven’t. Or show me where.

            The “apparent data tampering” is something you have just made up. I guess you like that scientists who publish things you don’t like are being harassed.

          • mpainter,

            “Do not you imagine that is so?”

            No, I don’t. You obviously have the need to imagine all these things that you write about inside “sources” and “data cooking and the disreputable science” to justify Lamar Smith’s and Co’s actions. You are cooking fantasies. It’s not based on an actual knowledge of these things.

            I, in contrast, don’t need to imagine anything. No initial evidence for any wrongdoing that would justify an investigation of Karl et al. has been presented by Lamar Smith and the majority of the US House of Representatives Committee on Science and Technology. There hasn’t even been any accusation of wrongdoing leveled by Smith against Thomas Karl et al.

            All that can be seen is that the scientists are being harassed by Smith for publishing a scientific study whose results Smith dislikes.

          • mpainter says:

            Jan, you say “There hasn’t even been any accusation of wrongdoing leveled against Thomas Karl et al.”
            ##
            So what. None is necessary. Congress performs its oversight responsibilities without making accusations. The emails are public property, government property. Any citizen is entitled to them via FOI. Lamar Smith only needs to demand them; he need not justify his demand. To not comply is illegal.

            The fact that the emails are (illegally) withheld indicates paydirt has been hit.
            You want to see “evidence of wrongdoing”? Stick around Jan, I’ve got a feeling that’s coming and that it will be worse than climategate, Jan. Remember climategate?

          • Bart says:

            “Freedom of science is about the free pursuit of scientific research and discourse w/o political meddling into the scientific process or harassment or punishment of the scientists by someone with political power, because this someone dislikes what the results from the scientific research are.”

            Nice try, but sorry, you don’t get special privileges. Especially not after Climategate revealed that “scientists” engaged in this area of research have been more than willing to subvert the scientific method to advance a “cause”.

            I’m paying the bills. I want to see your work. Either fork it over, or I assume you have something to hide.

          • mpainter,

            “So what. None is necessary.

            So, that means that it is only a fishing expedition by Lamar Smith, targeting scientists who have published a scientific study with results he dislikes. A fishing expedition done with the hope to find something incriminating against the scientists. Right? Like Cuccinelli tried it against Michael Mann by subpoena, also. An approach that was ruled unlawful by Virginia’s Supreme Court.

            “Congress performs its oversight responsibilities without making accusations.”

            According to the rules of the Committee of Science, Space, and Technology, its oversight authority covers “the application, administration, execution, and effectiveness of those laws, or parts of laws, the subject matter of which is within its jurisdiction”.
            (https://science.house.gov/sites/republicans.science.house.gov/files/documents/hearings/Committee%20on%20Science%2C%20Space%2C%20and%20Technology%20Rules%20114th%20Congress%20v2_0.pdf)

            I very much doubt that an evaluation whether the science behind a published, peer-reviewed study has been done properly by the scientists is covered by this oversight authority, as it is laid out in the rules. I also very much doubt that sniffing in the personal email communication between scientists is covered by this authority according to the rules.

            How would Lamar Smith even evaluate the science behind the study? He doesn’t have any qualification for that.

            And what information is supposed to be in the emails? They are not needed for scientific reproducibility.

            “The emails are public property, government property. Any citizen is entitled to them via FOI.”

            This is so not correct. There are exemptions and exclusions. You don’t have the right of disclosure to you of everything via FOIA request. The FOIA covers official agency documents, as long as they don’t fall under these exemptions and exclusions. For instance, you don’t have the right that the personal opinion of agency members in emails is going to be disclosed to you, just because you are a citizen.

            “The fact that the emails are (illegally) withheld indicates paydirt has been hit.”

            All what it indicates is that the agency protects its employees against outside intrusions into their communication. Whether that is illegal remains to be seen. If scientists can’t exchange freely their thoughts anymore, when they communicate by email with each other, without having to fear that the content of those emails is used against them by people like you afterward, in case the scientists says something preliminary or wrong in the process, or that the emails are quote-mined and (deliberately) misinterpreted, it will impede scientific research.

            If this kind of intrusion becomes the norm, the scientists just will use other means of communication. The tyranny of the right-wing authoritarians who, for political and ideological motives, want to suppress a free scientific discourse will be subverted.

            My personal consequence has already been that I use the government email address that I also have as little as possible for communicating with others, since I don’t see the communication using this address sufficiently protected anymore.

            “Remember climategate?”

            No, I don’t. I only remember fake climategate, based on stolen personal communications between scientists, which is certainly a common talking point used as propaganda by science rejectionists. With respect to actual evidence for scientific misconduct that is being alleged, it was a dud, though.

          • mpainter says:

            Enough of this nesting. See below

          • JohnKl says:

            Hi Jan P Perlwitz,

            Thank you for responding to my post. You assert:

            “Because these are decisions concerning the realm of economy and politics, not the one of scientific truth.”

            Since when should economics and politics be separated from scientific truth? All phenomenon may be subject to scientific analysis, just ask a political scientist even if they most likely have little knowledge of science. You continue:

            “Legislating these things is for what they have been elected. They can do this informed by science or ignoring science.”

            Apparently you prefer them uninformed by science especially any that questions your dogma and external to peer review and control. You further rant:

            “What scientific truth is can’t be legislated by Congress, though. Nor can the validity of the methodology applied in a scientific study decided by majority vote of the US House of Representatives Committee on Science and Technology.”

            True! However, a few lines up you suggested they were elected to do precisely that! What does “legislating these things” mean Jan? NOAA AND SUCH AGENCIES ARE POLITICAL ENTITIES CREATED BY AND SUBJECT TO LEGISLATION! THE LEGISLATURE COERCES FUNDING TOWARD SOME SCIENTIFIC METHODOLOGIES OVER OTHERS THUS DETERMINING SOME METHODOLOGIES MORE VALID THAN OTHERS! You appear to need help Jan. You further assert:

            “You are just constructing a strawman with your question.”

            Questions don’t create straw-men they simply seek answers. Your’s seems inadequate. You absurdly stated:

            “There is no logic in your question. I’m talking about freedom of science, not about your freedom to personally decide that none of your tax money goes to science fields whose results you don’t like.”

            The lack of logic resides in your answer. Science is a methodology. To freely practice the methodology means to freely use one’s mind, talent and resources to pursue an objective. To constrain resources from some scientific pursuit in favor of another by definition retards scientific freedom, especially when directed toward pseudo-science quackery like CAGW. You state:

            “Freedom of science is about the free pursuit of scientific research and discourse w/o political meddling into the scientific process or harassment or punishment of the scientists by someone with political power, because this someone dislikes what the results from the scientific research are.”

            How do scientists freely pursue research when their research funding is diverted to CAGW pseudo-science? Since you have no clue about economics, how much research was squelched because funds that would have been available were otherwise diverted to fund NOAA careerists? How much private researched was re-dircted and/or coerced by Fed bureaus? You go on:

            “I think.”

            Debatable, that awaits empirical evidence.

            You state:

            “Has Lamar Smith and the US House of Representatives Committee on Science and Technology the targeted scientists or NOAA accused of “apparent data tampering” and presented initial evidence, which would justify to make the scientists a target of an investigation? No, they haven’t. Or show me where.”

            That’s merely an assertion that Lamar Smith hasn’t provided evidence not evidence of any kind itself. Apparently according to you Lamar Smith and Jan P Perlwitz have a lot in common. Evidence is not needed to pursue an investigation. No criminal charges have been made as far as I am aware. Why shouldn’t the legislative branch that funds the organization conduct routine investigations into all aspects of that agencies activities? All action conducted by NOAA or any such agency should always be open to full investigation at all time. They are after all a public charge. The Public (they’re employer) has a right to all information. Every action taken by members of the agencies in their professional endeavors should be fully transparent, shouldn’t it Jan? Or do you seek to hide something? If so what?

            Btw, people claimed to have evidence of NOAA data tampering such as:

            http://www.climatedepot.com/2015/10/26/us-congress-to-investigate-noaas-temperature-adjustments/

            Have a great day!

          • JohnKl,

            “Since when should economics and politics be separated from scientific truth? All phenomenon may be subject to scientific analysis, just ask a political scientist even if they most likely have little knowledge of science.”

            Phenomena in economy and politics may be subject to scientific research, and, hence, to the seeking of scientific truth, but they aren’t the science. Like phenomena in Nature are not the science that researches them.

            “Apparently you prefer them uninformed by science”

            Non sequitur. Nothing of what I wrote implies that I would prefer that.

            “especially any that questions your dogma and external to peer review and control.”

            Where do I find science outside of peer-reviewed science, that could inform politicians? What makes that “science” science?

            “What scientific truth is can’t be legislated by Congress, though. Nor can the validity of the methodology applied in a scientific study decided by majority vote of the US House of Representatives Committee on Science and Technology.”

            True! However, a few lines up you suggested they were elected to do precisely that! What does “legislating these things” mean Jan?”

            It means creating a framework of laws within someone operates.

            “NOAA AND SUCH AGENCIES ARE POLITICAL ENTITIES CREATED BY AND SUBJECT TO LEGISLATION! THE LEGISLATURE COERCES FUNDING TOWARD SOME SCIENTIFIC METHODOLOGIES OVER OTHERS THUS DETERMINING SOME METHODOLOGIES MORE VALID THAN OTHERS!”

            Show me where the legislation coerces the application of specific methodologies and non-application of others in a given field of science.

            ““You are just constructing a strawman with your question.”

            Questions don’t create straw-men they simply seek answers.”

            This assertions is incorrect in this generality. For instance, there are also rhetorical question, where specific answers are already assumed as given. Or there are loaded questions, which are questions with a false premise.

            “There is no logic in your question. I’m talking about freedom of science, not about your freedom to personally decide that none of your tax money goes to science fields whose results you don’t like.”

            The lack of logic resides in your answer. Science is a methodology. To freely practice the methodology means to freely use one’s mind, talent and resources to pursue an objective. To constrain resources from some scientific pursuit in favor of another by definition retards scientific freedom,

            This is an extremely wide definition of freedom of science, if it is defined as the availability of unlimited resources for the pursuit of scientific research in every thinkable field of science. I don’t think this is how “freedom of science” is generally defined.

            “especially when directed toward pseudo-science quackery like CAGW.”

            “CAGW”? I don’t know what that is. I don’t know of any scientific field that uses this term.

            “How do scientists freely pursue research when their research funding is diverted to CAGW pseudo-science?”

            Loaded question.

            “Since you have no clue about economics,”

            How would you know that?

            “Has Lamar Smith and the US House of Representatives Committee on Science and Technology the targeted scientists or NOAA accused of “apparent data tampering” and presented initial evidence, which would justify to make the scientists a target of an investigation? No, they haven’t. Or show me where.”

            That’s merely an assertion that Lamar Smith hasn’t provided evidence not evidence of any kind itself.”

            This is as much an assertion as the statement that no evidence has been provided for the non-existence of invisible pink unicorns. It’s objectively not possible to provide such evidence, i.e., proving the non-existence of it.

            “Apparently according to you Lamar Smith and Jan P Perlwitz have a lot in common.

            Apparently not. I’m not aware that I demand to investigate someone for no stated reason and without any evidence of wrongdoing.

            “Evidence is not needed to pursue an investigation.”

            So, it’s a pure fishing expedition, isn’t it?

            “No criminal charges have been made as far as I am aware. Why shouldn’t the legislative branch that funds the organization conduct routine investigations into all aspects of that agencies activities?”

            So, tell me. What exactly is being investigated here with respect to the peer-reviewed study by Karl et al. “Routine” implies that this was something done regularly. That’s news to me. Or what scientific studies have been investigated before in this way and the emails of what authors of what scientific studiesm, “routinely”?

            “All action conducted by NOAA or any such agency should always be open to full investigation at all time.”

            Again. What exactly is being investigated?

            “They are after all a public charge. The Public (they’re employer) has a right to all information.”

            According to what law? “The public” doesn’t have the right to all information.

            “Every action taken by members of the agencies in their professional endeavors should be fully transparent, shouldn’t it Jan?”

            What exactly does “fully transparent” supposed to mean here? That you demand that all communication between scientists in a government agency must be open to the public? To be consequent, shouldn’t surveillance equipment be installed in every office so that you and Lamar Smith can monitor the scientists all the time, and listen to all their uttered words and gas releases?

            Or do you seek to hide something? If so what?”

            According to the logic of this inquisitorial question, anyone who values privacy must have “something” “to hide”. Or anyone who thinks that being able to exchange thoughts freely, without having to fear that something said, if it is preliminary or false is being used against one by someone with political power afterward, or quote-mined and misinterpreted out of malicious reason.

            “Btw, people claimed to have evidence of NOAA data tampering such as:

            One can find claims by people about everything and its opposite in the garbage pile Internet. This fact doesn’t make these claims true.

          • James Bond says:

            Hi Jan P Perlwitz,

            You state:

            “Phenomena in economy and politics may be subject to scientific research, and, hence, to the seeking of scientific truth, but they aren’t the science. Like phenomena in Nature are not the science that researches them.”

            Obviously Jan as I’ve stated earlier “science is a methodology” but scientific knowledge consists of the facts and laws of nature. BY DEFINITION FACTS COMPRISE OBSERVED PHENOMENON AND AS SUCH ARE SCIENTIFIC KNOWLEDGE! You go on:

            “Non sequitur. Nothing of what I wrote implies that I would prefer that.”

            No, observed fact. Your unwillingness for Congress or anyone else apparently to observe and thus scientifically examine internal NOAA operations is not scientific. You continue with complete pablum:

            “Where do I find science outside of peer-reviewed science, that could inform politicians? What makes that “science” science?”

            The Mayans first invented a solar calendar thus illustrating knowledge only later discovered by Copernicus. Did the Mayans have PEER REVIEW? Politicians should be informed by the FACTS AND LAWS OF NATURE that by definition comprises scientific knowledge. Last I checked PEER REVIEW was never required for men and women over the centuries to OPEN THEIR EYES! You might try it Jan. You correctly state:

            “It means creating a framework of laws within someone operates.”

            Exactly, including what scientific methodology is VALIED and employed by people under it’s umbrella. This really shouldn’t be difficult. You state:

            “Show me where the legislation coerces the application of specific methodologies and non-application of others in a given field of science.”

            It coerces funding to support specific funding. It would be impossible to list the many scientists, climate or otherwise, who may have received funding had it not been directed toward any given agency like NOAA. The full opportunity cost may be immense and I seriously doubt you’ve considered it. You state:

            “This assertions is incorrect in this generality. For instance, there are also rhetorical question, where specific answers are already assumed as given. Or there are loaded questions, which are questions with a false premise.”

            That’s a claim not evidence. However, if the questioned is loaded please specify how and if it is I apologize. You then state:

            “This is an extremely wide definition of freedom of science, if it is defined as the availability of unlimited resources for the pursuit of scientific research in every thinkable field of science. I don’t think this is how “freedom of science” is generally defined.”

            That’s ok I’m not terribly interested in arbitrarily restricted definitions. You state:

            “Loaded question.”

            Not really. You go on:

            “How would you know that?”

            There exists opportunity costs for everything Jan. Your apparent dismissal of this fact appears obvious. You go on:

            “This is as much an assertion as the statement that no evidence has been provided for the non-existence of invisible pink unicorns. It’s objectively not possible to provide such evidence, i.e., proving the non-existence of it.”

            You made the assertion that Lamar Smith failed to act in a certain capacity but provided not evidence to support it. How precisely do you know hat he has or has not done? I didn’t make the assertion. You did. You state:

            “Apparently not. I’m not aware that I demand to investigate someone for no stated reason and without any evidence of wrongdoing.

            “Evidence is not needed to pursue an investigation.”

            So, it’s a pure fishing expedition, isn’t it?”

            Then how do you explain your statement regarding Lamar Smith? All investigations involve FISHING FOR FACTS, otherwise it’s not an investigation but an echo chamber. Congress has authority to investigate it’s own agencies til the cows come home. Btw, why do you seem to believe that government employees have a presumption of privacy in the conduct of their jobs? Thanks for your response I’ll have more to state later when I have time.

            Have a great day!

          • James Bond aka JohnKL says:

            Correction, my statement should have read:

            It coerces funding to support specific research and research modalities.

            Have a great day!

        • JustAnotherPerson says:

          It is not just Dr. Spencer’s, the revision was also prepared by Dr. John Christy and William Braswell (http://www.drroyspencer.com/wp-content/uploads/Version-61.pdf_). The reason one should use 6.0 is because it helps correct errors in the data, simple as that. Just because it hasn’t been published in the peer-reviewed literature yet doesn’t mean you should not use it. If we assume Karl et al.’s changes are benign, then we should treat Dr. Spencer et al.’s the same way.

          • What about scientific reproducibility? As long as it hasn’t been published with a detailed description of the methodology in the peer-reviewed literature it hasn’t been open to the evaluation by the scientific community. And as long as this is the case, it shouldn’t really be used for other peer-reviewed scientific studies.

            There is a very big difference to the Karl et al. study here. It’s not just an assumption that latter was “benign”. The methodology has been published. The data are publicly available. Thus, other scientists can take those, if they are inclined so, and reproduce the results (or falsify, if that is the outcome). It’s all what other scientists need to have to do that.

          • mpainter says:

            If you don’t like UAH then use RSS. Small difference, though. Hard to understand your complaint.

          • JohnKl says:

            Hi Jan P Perlwitz,

            You stated:

            “The methodology has been published. The data are publicly available.”

            Obviously not all the data Jan, or there would be no documentation for the committee to obtain that they did not all ready have and it would have ended a long time ago.

            Have a great day!

          • JohnKl,

            “The methodology has been published. The data are publicly available.”

            “Obviously not all the data Jan, or there would be no documentation for the committee to obtain that they did not all ready have and it would have ended a long time ago.”

            Alternatively, this could also be an indication that Lamar Smith and Co. are just incompetent to use the actually needed data and the published methodology. What are they going to do with the data anyway? Tell me. Are they going to redo the research done at NOAA? the many man-years of research? How would Lamar Smith do that?

            And what are the emails needed for? This has nothing to do with investigating the validity of the science behind the study. Again, firstly, Lamar Smith and Co. are not qualified, and, secondly, I’ve never heard that any scientists who want to reproduce the scientific research done by the authors of a study demand the deliverance of all, or any email conversation between the authors of the study, in the name of scientific reproducibility. Demanding this would be absurd. So what is Lamar Smith looking for in the emails?

          • JustAnotherPerson says:

            It has been published with a detailed description, as publicly as possible, just not in the peer-reviewed literature-yet. Any scientist could visit this page (http://www.drroyspencer.com/wp-content/uploads/Version-61.pdf) and see the details of the changes, and, if they took umbrage with any of them, post comments here. I am not exactly sure why Dr. Spencer et al. chose to put out the beta without publication in the peer-reviewed literature first, but something that should help to reassure is that with the Version 6.0 changes, UAH matches much better with RSS. If anyone had a problem with Dr. Spencer et al.’s methodology, they could visit that page and then post a comment here on the topic of the issues in the documentation of the changes.

      • David says:

        It’s a good thing that spurious warming trend in v5.6 has been corrected because we’d be putting up some seriously scary numbers if we get that typical El Nino boost in the winter and spring. October’s +0.57C global anomaly on the old data set would have tied March 2010 for the 3rd warmest of any month, behind only the +0.65C in February 1998 and +0.66C in April 1998. With a typical El Nino response, that data set could be up near +1.0C by March/April. Yikes.

      • barry says:

        I emailed the compiler at woodfortrees (it was using a previous version to 5.6), to inform of V5.6 and the beta6. He opted to go with 5.6 until 6.0 stops being beta. That was some months ago.

  2. Aaron S says:

    Thanks for the update. There is still no major jump in measured global temp like during the 1997 1998 event. Anyone have any thoughts how long until the jump in global temperature is considered late relative to the 2015 El Nino pattern of ocean temperature that is often compared in scale to the 97 98 event? It is a fascinating excercise of patience to wait in anticipation… for monthly updates!

  3. The test with this El Nino is how high will the global average temperature anomaly be in relation to recent past El Nino events, and more importantly how low will global average temperatures get post this El Nino.

    I say the global average temperatures will not be as high during this El Nino event in contrast to earlier recent ones , and after this El Nino event global average temperatures will be lower in contrast to previous post El Nino events.

    • ehak says:

      Well. So far your predictions are failing. Highest October temperature. Even for this Spencerized dataset v6betasomething.

      • mpainter says:

        Screech while the screeching is good, ehak. If your much longed-for El Nino spikes, it will be followed by the lowest temperatures of this century, called La Nina. Look it up and learn something.

      • Bart says:

        Nonsense. Look at the top graph. It spiked near 0.8 in 1998, nearer 0.4 now. It is not the name of the month that matters, it is the peak wherever it occurs.

  4. Solar parameters still to high to have the desired cooling I have called for , but I think those solar parameters will be reached and once reached if duration is long enough will impact the average global temperatures.

    Keep in mind ENSO,VOLCANIC ACTIVITY are a refinement to the underlying global temperature trend and must be viewed in that manner.

    • Solar Parameters too high. Still I wonder if there is a delay between Sunspot number and solar activity reaching the earth, as Dr Evans stated. If this is the case of a 10-14years delay, then the signals of the “hotter” solar cycle 23 are still ruling our weather/climate. Others talk about a delay of about 3 years through heat storage through land and ocean masses.

  5. mpainter says:

    No real change in the tropical anomaly since June. By the UAH dataset, El Nino appears stalled. This is getting interesting- a spikeless El Nino? That’s a non-Nino, a real no-no.

    • Christian says:

      Its because, you dont know how El-Nino works and why the global temperatur is laged to the ENSO.

      If you dont belive me, just wait untill early spring 2016

      • mpainter says:

        Well, why don’t you explain to us how El Nino works, and maybe the rest of us can learn something. Maybe.
        But maybe you just another ill-informed global warmer with nothing but high hopes for a temperature spike so your screeches can spike. We shall see if Ma Nature grants your wish or whether she toys with the Paris confab, grinning impishly at the consternation of the global warmers.

        • ehak says:

          In case you missed ti mpainter. This October in this new TMLT dataset was a record. Well above 1997.

          But of course. Deny it. Easiest.

          • mpainter says:

            Atmospheric plant food is entirely beneficial, ehak.

            But of course. Deny it. Easiest.

          • ehak says:

            mpainter goes for something else. Desperation looms.

          • mpainter says:

            Climatologists refer to the last part of the Holocene as the neo-glacial. Who wants another ice age? Not me. Warming is beneficial; cooling is a killer. Is this what you call denial? Ehak?

          • ehak says:

            mpainter really does not want to admit the hottest October.

            Desperation indeed.

          • mpainter says:

            Satisfaction, ehak. I take especial satisfaction that the highest October temperature ever was due to unusual NH extratropical warmth. I like warm Octobers because this extends the growing season. The world’s burgeoning population needs food and a longer growing season will help feed us. Also, there is the increased plant food and higher humidity, the, bounty of a beneficent Creator, who gave us fossil fuels.Don’t forget, Thanksgiving in a few weeks. Show some gratitude.

          • Bart says:

            There’s nothing magic about October, guys. The question is, where is the peak, and when did/will it occur? So far, running below last two. We’ll see what happens.

          • mpainter says:

            “guys”..? please, don’t point your finger at me, thanks.

          • JustAnotherPerson says:

            It was the second warmest in RSS, by the way, ehak.

            A possible cause of the record in temps was that the AMO was much higher in 2015 (.319) than in 1997 (.125) and experienced a large jump from September (.197 to .319), which may have caused at least part of the NH and global record warmth. (http://woodfortrees.org/data/esrl-amo/from:1997)
            Another contributing factor may be the NAO, which was up from -1.34 in 1997 and was 0.99 in 2015.

    • Bryan says:

      I noticed that too. Have their been other el nino years with rather flat tropical numbers but that subsequently took off?

      • mpainter says:

        Good question. I checked the archives for the 2010 El Nino and the tropics warmed very considerably from June to July, 2009 and then temperatures for the tropics sort of plateaued til January, 2010 when it peaked. So it can be said that El Nino is on track, but the tropics are running a bit cooler than in the fall of 2009.

        • ehak says:

          More like 1997-1998 then mpainter. Lower tropical temperatures in october 1997 than september 1997. Bigger drop in 1997. For this new TMLT index.

        • mpainter says:

          “but the tropics are running a bit cooler than in the fall of 2009.”

          Allow me to amend that:
          More properly, the last half of the year, compared to 2009.

          Past El Ninos peaked after Dec. This one could fizzle, though. Sad to think of how all those hopes that now swell the breasts of the alarmists could be dashed to pieces by cruel Ma Nature! She has been so unkind to the true believers this century, with her mocking flat lines.

          • ehak says:

            Aha. mpainter has a model that predict that this nino will be nothing. Because the temperature in the tropics were higher in 2009…

            These numbers prove mpainter’s point:

            September 2009: 0.51
            October 2009: 0.34

            September 2015: 0.55
            October 2015 0.53

            mpaintering analysis.

            Or was it the last half of the year?

            Ok:
            Mean July – October 2009: 0.395
            Mean July – October 2015: 0.515

            I am convinced. This nino is a real fizzler. Good to ya alarmists!

          • mpainter says:

            I mentioned the fizzle as only a possibility, as in last year’s fizzled El Nino. I am hoping for a milder winter, myself. El Ninos cause milder winters, you see. But it could fizzle again.

            When the next ice age comes, the whole Arctic ocean will be covered with ice so thick that there will be no breathing holes for the poor seals. What will become of them and the other sea mammals? And the polar bears? They will all perish miserably. There is a slight chance that AGW can save us from that, if only CO2 will get off its butt and start warming like it’s supposed to. What say you ehak, will CO2 save us? Or will it stay on its rear?

          • Nate says:

            Sorry mpaint, but this El Nino is too big to fail. All the lumbering machinery of a super El Nino, both under and over the ocean surface, has already banked strong warmth in the ocean until at least January.

          • ehak says:

            Well. Your fizzling data analysis sure does not save your model that predicts no nino this fall and winter mpainter.

          • mpainter says:

            Read again ehak, this time more carefully. What’s your name?

          • mpainter says:

            Lumbering machinery? Super El Nino? Then super La Nina, right? Ma Nature gives and then takes it back. Roll your lumbering machinery over Ma Nature; maybe that will help.

  6. Geoff Wood says:

    Dr Spencer, slightly tangential, sir. Would you please express your confidence in AMSU channel 6. I am currently asking this through GHRC. Is channel 6 valid sir? NCEP shows 10deg difference at 400mb. What is your confidence in its accuracy and what are the projected errors at this level? Is this channel the ‘best estimate’ of temperature at this level (I believe ‘it is’ compared with other ‘more interpolated’ data) and what order is the precedence in its detail, is it as listed, 25,000ft as prioritised by order?

    Sorry to persist with this.

    Regards.

  7. Stephen Richards says:

    That figure looks close to the NCEP real time data 0.495

  8. Nigel Harris says:

    The running centered moving average line appears to stop around the end of 2014. By my calculation, the average of the last 13 months of TLT is +0.24.

  9. MikeR says:

    Dr Spencer,

    Apologies for repeating this from last months comments regarding the September UAH data. As it was the last comment it was easy to miss but it would be great if you could address the following at it severely impacts upon the credibility of your regional data.

    I notice that your revision version 6 has data for Australia that currently gives a trend of 0.24 degrees per decade. This is a factor of 1.6 times larger than the value of 0.15 degree per decade of version 5.6. This is a substantial revision upwards to say the least.

    These numbers in turn, are much larger than the Australia Bureau of Meteorology trend value of about 0.12 degrees per decade (1979-present) for the homogenized temperature data.
    The Bureau has been criticized extensively by those who have a tendency to indulge in conspiracy theory (we have have a large and diverse range who think like this in Australia), for homogenizing the trend of the data upwards by 0.3 of a degree per decade from 1910 until the present.

    In light of these massive discrepancies that UAH v6 introduces for the Australian data, do you present this data for entertainment purposes only or do you think it can serve some useful purpose? Maybe you should consider providing a caveat that it should not be taken too seriously as some appear to be doing. For an example of this see https://kenskingdom.wordpress.com/2015/10/16/the-pause-september-update/.

  10. Thanks, Dr. Spencer.
    I have update your graphic in my pages.

  11. TheFinalNail says:

    Dr Spencer,

    If I am not mistaken then this update makes October 2015 the warmest October in the UAH record, both globally and in the NH.

    As you say, it’s not quite the warmest ‘month’ on record in terms variation from average – only the 3rd warmest.

    Even so, some might ponder as to why a new record warmest October is considered unworthy of mention in your intro… The series stretches back 37 years, after all.

    TFN

    • mpainter says:

      The Oct. LT tropics anomaly is a so-what. Fodder for the alarmists, otherwise of no particular importance.

      • ehak says:

        The highest October LT tropics anomaly in this Spencerized dataset is a so-what….

        Records are so-what. Fodder for who?

        • mpainter says:

          Fodder for the alarmists. Is that you ehak? Do you have a name?
          Sorry about upsetting you on the fizzle pizzle.:-)

          • ehak says:

            Seems more like mpainter cannot understand numbers. Perhaps mpainter is too alarmist? Ice age and all.

  12. Noisy says:

    It looks like the 13-month running average has not been updated for awhile – please fix.

    • mpainter says:

      Look again, suitably-named person. This time, try squinting.

      • Nigel Harris says:

        I think it is you, mpainter, that needs new spectacles. Dr Spencer’s moving average line is missing at least three datapoints, and the latest value should be more like +0.24 not around +0.20 as shown.

        • mpainter says:

          Right, Nigel, but why the complaining if you have computed it yourself? All this eager anticipation is amusing.

          • Simon says:

            mpainter
            “Right, Nigel, but why the complaining if you have computed it yourself? ” because for people who look at graphs carefully and are concerned quite rightly with detail, the detail is important. For people like you who draw graphs with crayons, I guess close enough is good enough.

            Funny thing how you accuse scientists of manipulating data when you can’t even be bothered looking at it.

  13. Vincent says:

    It seems to me, from a non-specialist and completley unbiased perspective, that these very small, fractional changes in temperature are not at all alarming, taken in the context of the El Nino/La Nina cycle of weather patterns, which are a regular occurrence.

    However, because I’m such a compassionate person, I would like to accommodate the concerns of all those fearful people who think our CO2 emissions will result in a disaster for mankind.

    The main obstacle to a rapid transformaion to a renewable, non-carbon-emitting energy supply is purely the economic cost. The cost is huge. It involves the dismantling of CO2-producing power plants which otherwise would have many years of productive life. In other words, it involves the consruction of new systems of energy production, despite the fact the existing power plants could still be functional, which would unavoidably add significantly to the cost of energy.

    Since the efficiency with which we produce energy is the foundation of our prosperity and standard of living, we should consider alternative and more efficient methods of tackling the rises in atmospheric CO2.

    Rather than spending trillions of dollars, world-wide, in a quick transformation to renewable energy, with an almost certain impact on the existing poor, why not be sensible in accordance with Vincent’s following recommendation.

    Carbon Dioxide is an asset. Plants thrive on it. Let’s exploit that asset.

    I’m partly tongue-in-cheek with my following suggestion because I believe it’s politically unrealistic, but this is my proposal.

    We should start a project, “Greening of Australia”. This would involve the construction of long water pipes stretching from excessively wet regions to excessively dry regions. We would need cheap power to accomplish this.

    With a thought for the future, we could also lay HVDC power lines along the water pipes, which could transmit electricity from the solar farms constructed in the dry regions, to the cities reliant upon fossil-fuel-generated electricity.

    Eventually, as the Australian deserts green, the weather patterns would change, and the presence of forests and crops would encourage rain fall which had never occurred before in those regions.

    The total global agricultural production would increase, thus ameliorating the concerns of those who are worried about inadequate world food production, and the numerous solar farms with HVDC power transmission lines following the path of the water pipes, would reduce reliance upon fossil fuels.

    That’s a win for everyone. You can nominate me for a Nobel Prize.

  14. The case for AGW gets weaker as reach month passes by.

    In spite of a strong El Nino, increasing amounts of CO2, moderate to high solar activity past 3 years as measured by the solar flux, no substancial major volcanic eruptions for this current century, Arctic Ice Coverage below average, the response of the global average temperature is, it is still stuck in a trend that has hit a plateau since 1998.

    Just wait till solar weakens which is just around the corner and this El NINO ends, and more major volcanic activity starts to take place. The global average temperature trend will then be down and it is not if but when and I say the when will be long before this current decade ends.

    • Entropic man says:

      GISS gives a global average anomaly for 1998 of 0.64C. 2014 was 0.75C and the year-to date figure for 2015 is 0.81C.

      I find it difficult to reconcile these figures with your “plateau”

      • Daniel Kirk-Davidoff says:

        Roy has strong views about climate dynamics that aren’t representative of the field as a whole, but this temperature time series is not terribly different from other interpretations of the satellite record. In fact, it’s not really that different from the surface station record- much of the difference has to do with the relatively large response to ENSO variability of the satellite record. If you take the GISS time series and this one and plot them on the same axis, you’ll see that the main difference is that the GISS record is longer. Here’s an example: http://www.climate4you.com/images/AverageSurfaceTempVersusAverageSattelliteTemp%20GlobalMonthlyTempSince1979_WithFloatingBars.gif

        • nate says:

          That is very interesting. Explains a lot. Certainly the 98 and 2010 El Ninos are enhanced in the troposphere record. You can also see that with the strong La Ninas of 2008-9 and 2011-12, that the drops in temp are larger in the troposphere. So the last 7 years are overall suppressed in the satellite record relative to the surface record. Would expect the opposite this coming year.

      • And 2014 was an ENSO neutral year. Nowadays, it doesn’t even need a strong El Nino anymore to reach or exceed the annually and globally averaged temperature anomaly of the strong El Nino year 1998. In a couple of decades or so the temperature anomaly of even the La Nina years will likely regularly exceed the anomaly of the year 1998.

  15. GISS temperatures I do not consider valid because they are manipulated.

  16. As the graph shows the temperature trend since the Holocene Optimum is down and that trend is still intact as of today.

  17. Werner Brozek says:

    RSS just came out for October at 0.440. This is only 0.067 above its September value of 0.373. That contrasts with an increase of 0.18 for UAH. October 1998 beat the 0.440 at 0.461, so for RSS, this is the second warmest October. For UAH, it is the warmest October.
    RSS has a 10 month average of 0.33, tying it for third with 2005. There is also no way it will get above third place in 2015, just like UAH. As for 2016? Who knows?

    • ehah says:

      Perhaps we will see a higher anomaly in v6betasomething during this nino than RSS. Because v6betasomething will get a bigger boost from the tropics. Different weighting.

  18. Dr No says:

    It is fascinating to watch deniers clutching at straws.

    “The data has been corrupted and should not be trusted”

    “The data shows temperatures have not risen”

    “Temperatures have only risen by a small amount”

    “The temperature rise is not uniform”

    “The rate of temperature rise is slowing”

    “The rate of the rate of temperature rise is slowing…. etc etc

    “The temperature rise only because of El Nino”

    “El Nino has peaked and La Nina is around the corner”

    “I have a gut feeling everything will soon be back to normal, just you wait and see.”

    “Even if a new record is set over the coming months, my gut feeling will not go away.”

    “I don’t care what the data says, it is all a conspiracy”

    “One day, somewhere, sometime, I will be proved right.”

    As Spike Milligan’s headstone says:
    “I told you I was ill!”

    • mpainter says:

      “Why not not hide the decine like in Mike’s Nature trick?”…Phil Jones

    • mpainter says:

      “The truth is that the warming has stopped and it’s a travesty that it has”… Kevin Trenberth.”

      “I was awarded the Nobel Prize”…Michael Mann.

      “The oceans will boil”…James Hansen

      • Toneb says:

        mpainter

        ““Why not not hide the decine like in Mike’s Nature trick?”…Phil Jones”

        In a conversation re a graph (in a presentation NOT a peer-reviewed paper) that has the well known problem of the disconnect of tree-ring growth vs temp in northern forests …. so they replaced the proxy WITH REAL DATA.

        https://www.youtube.com/watch?v=7nnVQ2fROOg

        ““The truth is that the warming has stopped and it’s a travesty that it has”… Kevin Trenberth.”

        Full quote “The fact is that we can’t account for the lack of warming at the moment and it is a travesty that we can’t.”

        VERY different.

        “”[2:04] [The runaway greenhouse effect] means once the planet gets warmer and warmer the oceans begin to evaporate, and water vapor is a very strong greenhouse gas – even more powerful than carbon dioxide. So you can get to a situation where it just … the oceans will begin to boil and the planet becomes so hot that the ocean ends up in the atmosphere.”

        From: https://www.youtube.com/watch?feature=player_embedded&v=1uxfiuKB_R8#!

        Again very different.

        • mpainter says:

          Thanks for the whole Hansen quote. I forgot “the oceans end up in the atmosphere” part. This is the head guru of the global warmers. Nothing else need be said.

          • Toneb says:

            Yes, they very well may do in a “run-away” GHE.
            But not for Earth. Yet.
            Which is what Hansen was saying.

            And not as your mis-quote was implying that we are on that path now.

          • mpainter says:

            Hansen could only have meant the earth. Such a scenario as he described is impossible. Such a statement is rank alarmism. Thus James Hansen, your guru?

          • mpainter says:

            Also, the scientific phrauds committed by the hockey stick manufacturers are notorious. So much so, that these are today seen as positive proof of junk science.

    • James Bond says:

      Dr. NO,

      Are these quotes autobiographical or did you make them yourself? Since they’re not sourced it seems a safe bet they are! This one really appears to be yours:

      “One day, somewhere, sometime, I will be proved right.”

      How’s that mechanical hand working?

      Have a great day!

    • James Bond says:

      To Dr No and CAGW paranoids,

      The following Mark Twain quote seems appropriate for factually destitute alarmist gibberish:

      “That is the way of the scientist. He will spend thirty years in building up a mountain range of facts with the intent to prove a certain theory; then he is so happy with his achievement that as a rule he overlooks the main chief fact of all—that all his accumulation proves an entirely different thing.”
      — Mark Twain
      ‘The Bee’. In What is Man? and Other Essays? (1917), 283.

      Have a great day!

      • Dr No says:

        To James Bond and other deniers, I think you should dwell on this quote by Mark Twain:

        “It is better to keep your mouth closed and let people think you are a fool than to open it and remove all doubt.”

        It has been a great day thanks.

        • James Bond says:

          Hi Dr No,

          You hilariously stated:

          “To James Bond and other deniers, I think you should dwell on this quote by Mark Twain…”

          Was James Bond a denier? I’ll have to ask Ian Fleming. Pray tell deny what? If you mean that the Earth has warmed I don’t deny that at all. In fact, on numerous occasions I’ve stated that the Earth has warmed considerably since the onset of the ICE AGE which we are still in. By the way, the quote actually states:

          Better to remain silent and be thought a fool than to speak and to remove all doubt.
          — ABRAHAM LINCOLN.

          A site on the internet claimed Ken Burns ran a special on what Twain didn’t say and that quote was one of them.

          In any case, the quote appears to be true. Thank you, your last post appears to bear it out.

          Have a great day!

        • James Bond says:

          Hi Dr No,

          One other point. A statement appears in the Bible:

          “Here is a biblical proverb that expresses a similar idea, namely Proverbs 17:28. Here is the New International Version followed by the King James Version of this verse: 1

          Even a fool is thought wise if he keeps silent, and discerning if he holds his tongue.

          Even a fool, when he holdeth his peace, is counted wise: and he that shutteth his lips is esteemed a man of understanding.”

          Have a great day!

        • mpainter says:

          En boca serra no entran moscas. Good advice Dr. No follow his own words of wisdom.

          • Dr No says:

            Thank you both. Ian Fleming once said:

            “It was the short men that caused all the trouble in the world.”

            and, more to the point:

            “A horse is dangerous at both ends and uncomfortable in the middle.”

            I think that settles the argument.

  19. Werner Brozek says:

    Despite the RSS jump, its pause extends by one month to 18 years and 9 months. It goes from February 1997 to October 2015.

    • A “pause” from what? And what is the definition for “pause”? What scientific/statistical criteria are being used to determine that there was some “pause”?

      • mpainter says:

        To explain, Jan denies the “pause”.

          • mpainter says:

            The “pause” that everyone was talking about before the rabid global warmers decided that it was necessary to do away with it. The one that started in the previous century. Yep, that one.

          • ehak says:

            As you see mpainter. Many pauses started in the last century. Which pause are you referring to?

          • mpainter says:

            You can’t peddle your wretched sks junk science here. It won’t sell.

          • ehak says:

            “You can’t peddle your wretched sks junk science here. It won’t sell”

            mpainter shows himself as a true pause denier.

        • “To explain, Jan denies the “pause”.”

          I would appreciate, if anyone of the “skeptics” who assert a “pause”, would actually answer the questions some day, which I’ve asked (not for the first time), instead of resorting to the same lame evasion tactics over and over again.

          The questions for a clear scientific definition of “pause”, for a reproducible metric to detect such a “pause”, and for empirical-statistical evidence that the alleged “pause” has been real are legitimate ones. It’s lack of scientific rigor to simply assume that the alleged existence of a “pause” was a fait-accompli fact, for which no evidence needed to be provided.

          • Werner Brozek says:

            As far as I know, there are three different definitions of the pause so different people may mean different things when mentioning a pause. Here they are in my own words:
            1. A slow down in warming over the last 15 years as compared to the previous 15 years;
            2. A discrepancy between what the models say should be happening to the temperatures versus what is actually happening to temperatures over the last 15 years or more; and
            3. A flat slope line for an extended period such as 15 years or more.

            When I talked about a pause, I used #3 and said the slope over the last 18 years and 9 months was 0 for RSS (actually slightly negative).

          • “3. A flat slope line for an extended period such as 15 years or more.”

            So, you are deliberately searching in the data until you find a time period with a “flat” trend estimate. And why do you call this a “pause”? What is this supposed to be a “pause” from?

          • Werner Brozek says:

            It is a pause from the previous rise before that. And NOAA talked about the significance of a 15 year flat period here:
            http://www1.ncdc.noaa.gov/pub/data/cmb/bams-sotc/climate-assessment-2008-lo-rez.pdf

            PDF document @NOAA.gov. For anyone else who wants it, the exact quote from pg 23 is:
            ”The simulations rule out (at the 95% level) zero trends for intervals of 15 yr or more, suggesting that an observed absence of warming of this duration is needed to create a discrepancy with the expected present-day warming rate.”

          • “It is a pause from the previous rise before that.”

            The “rise before that” in the RSS data, i.e., from 1979 to 1996 (inclusive) is 0.066 deg. Celius per decade. The two-sigma interval of the trend estimate for that period is +/-0.19 deg. Celcius per decade. The two-sigma interval of the trend estimate since 1997 is +/-0.168 deg. Celcius per decade.
            (http://skepticalscience.com/trend.php)

            Obviously, the trend estimates for the two periods aren’t statistically distinguishable. Your assertions that there was a “pause” compared to the the “rise before that” fails the test for statistical significance. Thus, your assertion cannot be considered as backed up by scientific evidence.

            “PDF document @NOAA.gov. For anyone else who wants it, the exact quote from pg 23 is:”

            The “exact quote”? It is not, especially since the quote leaves out essential information.

            The quote including the two sentences that precede the quote provided by you, which you have omitted:

            “ENSO-adjusted warming in the three surface temperature datasets
            over the last 2–25 yr continually lies within the 90% range of all similar-length ENSO-adjusted temperature changes in these simulations (Fig. 2.8b). Near-zero and even negative trends are common for intervals of a decade or less in the simulations, due to the model’s internal climate variability. The simulations rule out (at the 95% level) zero trends for intervals of 15 yr or more, suggesting that an observed absence of warming of this duration is needed to create a discrepancy with the expected present-day warming rate.”

            The statement for ruling out of Zero-trends for intervals of 15 years or more is valid for the the studied simulations in the reportafter adjusting the data for variability by ENSO”.

            Obviously, your intention for bringing this quote from the NOAA report was to insinuate that the observed lower troposphere temperature change was in contradiction to what was said about what models simulate. However, the RSS data are not adjusted for ENSO. All the ENSO-related variability is still in there.

            Omitting essential information from a quote to give the quote a different meaning compared to the original one is also a form of falsification.

            Additionally, the use of this NOAA-report quote by you is also deceptive with respect to a second aspect. The statement in the report refers to surface temperature data, as one can also see from the quote with the preceding sentences. It doesn’t refer to lower troposphere data. It is known that the amplitude of temperature variability in the lower troposphere is larger than for the surface temperature.

            You haven’t been told this the first time, have you? This is why I don’t believe in some honest mistake by you.

          • Werner Brozek says:

            “The statement for ruling out of Zero-trends for intervals of 15 years or more is valid for the the studied simulations in the report after adjusting the data for variability by ENSO”.”

            From my post here, it is my opinion that ENSO effects cancel out:
            http://wattsupwiththat.com/2015/10/01/is-there-evidence-of-frantic-researchers-adjusting-unsuitable-data-now-includes-july-data/

            Professor Brown has this to say regarding divergences between ground and troposphere measures:
            “The two data sets should not be diverging, period, unless everything we understand about atmospheric thermal dynamics is wrong. That is, I will add my “opinion” to Werner’s and point out that it is based on simple atmospheric physics taught in any relevant textbook.”
            See:
            http://wattsupwiththat.com/2015/08/14/problematic-adjustments-and-divergences-now-includes-june-data/

            So yes, I have been told certain things before, but I do not consider them as valid arguments.

          • mpainter says:

            Werner, you and Brown are right, of course, as everyone understands. So what is going on?

            The satellite data are claimed by the global warmers to give exaggerated ENSO effects, but the present El Nino registers lower in the satellite data than in the thermometer data.Gives one pause for thought, does it not?

          • Werner Brozek,

            Whatever your personal opinion about the canceling out of ENSO effects is, this doesn’t justify at all your falsifying of the quote from the NOAA report to give it another meaning than it originally has had, just because it suits your purpose. The statement about the 95% statistical significance after 15 years with respect to a Zero trend in the original quote from the NOAA report is about a comparison between the trends in simulations and observation data for the globally averaged surface temperature and after adjusting for variability due to ENSO. Period.

            If you want to assert that the observed temperature variability for the recent 15 or more years are in contradiction to the model simulations to which the NOAA report report refers then you have to show it for the surface temperature and after adjusting for variability due to ENSO as well.

            As for the assertion about the “divergence between ground and troposphere measures” of the temperature.

            You are comparing the RSS data with the GISS data to assert a divergence between the two. However, the two-sigma interval of the RSS data since 1997 is +/-0.168 deg. Celsius per decade (http://skepticalscience.com/trend.php. The two-sigma range of your “flat” trend covers a trend range from plus 0.169 deg. Celsius per decade to minus 0.167 deg. Celsius per decade. The trend of the GISS data since 1997 is 0.128 deg. Celsius per decade. That is, the GISS surface temperature trend lies well within the two-sigma range of the RSS trend estimate for the time period since 1997.

            Since statistical significance of the difference between the trend estimates from RSS data and GISS data is lacking, one can’t really conclude that there was a “divergence” between the two data sets, based on the data that you are showing. The two-sigma range wouldn’t even mark the 95% statistical significance range in this case, since the trend is cherry-picked. The two trends are not random picks anymore in such a case.

            And the large two-sigma range for the RSS data is only the uncertainty due to interannual variability in the RSS data for the released data. It doesn’t even cover the structural uncertainty due to data processing and assumptions on the underlying model and parameters for the satellite retrievals. But anyone who is interested can read for him/herself what the ones who provide the RSS data say themselves about this uncertainty and that this uncertainty should be taken into consideration before drawing any conclusions from analyses based on these data:
            http://www.remss.com/measurements/upper-air-temperature#Uncertainty

            You obviously don’t bother about these things.

            Btw: All those issues mentioned there are equally valid for the UAH atmospheric temperature data sets retrieved from the satellite measurements.

            I don’t know who “Prof. Brown” is and what his expertise is supposed to be. But he doesn’t seem to be very knowledgeable about these matters. Instead he believes to see evidence for the validity of some fantasy about how all the groups who do the surface temperature analyses were part of some conspiracy to illicitly manipulate the surface temperature data sets.

            It’s curious that “skeptics” are all about lack of statistical significance when it comes to the difference between a positive trend seen in the data sets and the Zero trend (like in your own post at WUWT). But then, structural uncertainty and lack of statistical significance suddenly doesn’t matter anymore when it comes to the satellite data and to assertions like the one above about the “divergence”. It seems like to be a matter of convenience for them.

            I also wonder what’s with the obsession, like in your posts at WUWT, to find the time period from some point in the past to present, for which the warming was not statistically significant. For any of the given time series, which are composed of trend and overlaid fluctuations due to unforced variability, the trend is always not statistically significant, if ones only chooses the time period short enough, even if there is an unchanged robust, statistically significant warming over multiple decades. Failure to achieve statistical significance when one tries to reject a null-hypothesis doesn’t falsify the alternative hypothesis in statistics.

            I would write these comments also directly under your post at WUWT, but I’m not going to do that, because I’m banned from writing over there.

          • Werner Brozek says:

            Professor Brown works for the Duke University Physics Department.

            As for the obsession with statistical warming, since the warming is not statistically significant for over 22 years in both satellite records, then it would appear that we should not spend hundreds of billions of dollars to prevent warming since it is not occurring anyway. At least the little warming that is happening cannot be viewed as catastrophic in the future.

          • barry says:

            “The satellite data are claimed by the global warmers to give exaggerated ENSO effects, but the present El Nino registers lower in the satellite data than in the thermometer data.Gives one pause for thought, does it not?”

            No, with the current October anomaly, the satellite data are on track with current el Nino, as historically satellite data lag el Nino indices by many months.

            The 97/98 el Nino began around March 1997, was evident in the surface records by Jun/July, and was present in the satellite record from about December 1997. A lag of 9 months or so.

            This recent el Nino began about a month earlier, and we currently have the warmest October in the satellite record (whichever version you use).

            If the satellite temps do not continue to spike (higher) in the proceeding months, then there would be a strong question mark about the reliability of the satellite records. However, I am fairly confident we will see continued high temps for UAH/RSS in the coming months. The current el Nino is strong enough to make its presence in lower troposphere temperature data.

    • Dr No says:

      I can beat that:

      It extends the warming by 1 month to 36 years and 9 months. It goes from Jan 1979 to October 2015.

    • Toneb says:

      No pause my friend … twas a “step-up” in temp.

      See…
      http://woodfortrees.org/plot/rss/from:1978/to:1997/trend/plot/rss/plot/rss/from:1997/to:2015.8/trend/plot/rss/trend

      Now if you want to argue that the last 18yrs on RSS is meaningful (it isn’t)- then you also have to agree that the first 18yrs are. Right?

      So then extend the trend line from that period (red) to the end of the graph.
      If you want the last 18yrs to have been *just* a pause – then the red line should have crossed the blue one by now. Right?
      Err – doesn’t until ~2020.
      All nonsense then as the unnatural 97/98 Nino spike has distorted the data.
      The mean trend (purple) is the only sensible trend to take.

      • mpainter says:

        Look closely. The only significant temperature increase in the last 35 years occurred circa 2000-2002. There is your stepup. On either side of that step-up is a flat trend. But that does not serve the alarmist meme, does it? No sir, it will have to be ignored, lest the faithful become perplexed and ask the wrong questions.

        • Toneb says:

          You cannot defend the indefensible my friend.
          You look at the graph.
          It clearly shows a disconnect in trends from the first half of the data to the second.
          Do NOT call the last 18yrs a legitimate trend if you wont accept the first 18 as legitimate.
          Oh, and a trend *step* does NOT occur over a period of 2 years either (that’s curve fitting) – 18 years isn’t long enough, never mind 2, to illuminate a the general GW trend
          The data is a complete mess because of the inherent inability of Sat sensor data/algorithms such as RSS to depict a realist response to an El Nino event.

          The data is statically invalid as a result. For there to have been a “pause” then the trend taken from the first 18yrs should have crossed the trend from the last 18 yrs well before now. (arguably at the start!!)
          That fact that it doesn’t until ~2020 to anyone with the slightest grasp of statistics shows that it is a data glitch phantom.

          • mpainter says:

            Actually, satellite data is more dependable, being more complete and lacking the tampering of the thermometer datasets. The step-up is real and divides two flat trends. There has been no long term warming trend of any significance in the latter 20th century, merely data tampering to make it appear so. These observations do not go down with the global warmers, I fully understand.

            Speaking of data tampering, this has become a subject of investigation by the House of Representatives Committee on Science and Technology which has subpoenaed documents from the NOAA.

          • “Actually, satellite data is more dependable, being more complete and lacking the tampering of the thermometer datasets.”

            So, when Roy Spencer does adjustments to the satellite retrieved data, it is all fine. When others do adjustments to the data, as they have explained in detail why and published in the peer-reviewed literature, it’s illicit “data tampering”.

            “There has been no long term warming trend of any significance in the latter 20th century, merely data tampering to make it appear so.”

            Wrong.

            The TLT warming since 1979 in the RSS analysis is 0.121 K per decade and highly statistically significant with more than three standard deviations.

            The TLT warming since 1979 in Roy Spencer’s UAH data version 5.6 is 0.129 K per decade and statistically significant with more than four standard deviations.

            Are you accusing Roy Spencer to have committed illicit “data tampering” to make it falsely appear that there had been a multi-decadal warming?

            “Speaking of data tampering, this has become a subject of investigation by the House of Representatives Committee on Science and Technology which has subpoenaed documents from the NOAA.”

            So, just to clarify. You are saying that things like removing the urban island heat effect, a non-climatic influence on the measured temperatures, from the temperature analysis was illicit “data tampering” that needs to be investigated by Congress (You have tried to defend this investigation in this thread here). Right?

            Haven’t “skeptics” been regularly claiming that the global surface warming wasn’t real because of the urban island heat effect in the data, causing the measured temperature increase to a large degree? And if the climate scientists claimed global warming w/o accounting for that effect, even though they knew it was in there, wouldn’t that be also a proper justification for an investigation by Congress?

            Doomed if we do, doomed if we don’t.

          • mpainter says:

            The only significant warming of the past 3 1/2 decades is the step-up at 2000-2002, as shown clearly on the UAH data plot. This step-up divides two flat trends separated by approximately 0.3°C. The claim of a long term trend is refuted by the data. Any trend line purporting to show steady decadal temperature increase is spurious. The real temperature phenomenon is this step-up, but it has been ignored by the Perlwitz types because it does not conform to the CO2 “control knob” meme.

        • ehak says:

          The mpaintering analysis keeps on giving.

          This time the only temperature increase the last 35 years occured 2000 – 2002.

          http://www.woodfortrees.org/graph/rss/mean:12/plot/rss/to:2000/trend

          Thanks mpainter.

          • mpainter says:

            Your paraphrase of my comment is wrong. Read again, this time more carefully. Then address my comment. You could avoid these errors if you quoted me precisely, but perhaps you do not wish to.

        • “The only significant temperature increase in the last 35 years occurred circa 2000-2002.”

          Wrong. The trend from 2002-2002 is not statistically significant at all. According to the (un)logic of the common “skeptic” that means no global (tropospheric) warming was present in this period.

          • mpainter says:

            A step-up at 2000-2002, Jan, not a trend. There’s a difference.

          • What’s the relevant difference? The temperature change is still not statistically significant. “Reasoning” of “skeptics” that I’ve read over and over again: “No statistically significant temperature change, therefore no global warming”.

          • mpainter says:

            See my response above at 10:08 am.

  20. mpainter says:

    Hi Jan. You did not read your referred link did you? Let me help:

    Rule vi Subcommittees.
    (a) Committee Jurisdiction. The Committee shall have jurisdiction over such matters as determined by the chair.

    (5) Subcommittee on Oversight shall have general and investigative authority on all matters within the jurisdiction of the Committee.

    So,if you object to these all-embracing powers, you should contact Lamar Smith. And Jan, Smith will get those emails.

  21. ehak says:

    A question that should be adressed is why RSS and UAH v4betasomething (not so much v5.6) diverge form other satellite measurements. Like the RSS total water vapor measurements.

    In addition to divergence from surface and radiosonde of course.

  22. dave says:

    RSS’s analysis of global anomalies for lower troposphere temperatures in October 2015, shows a rise of 0.07 C from September.

  23. Jan, is in denial and also does not look at the historical climatic data which shows no correlation between increasing CO2 concentrations and temperature because CO2 concentrations have always and will continue going forward to follow the temperature.

    Some think a new era has commenced because of man’s contribution to CO2 and that perhaps CO2 may lead the temperature this time.

    Thus far the data shows no evidence of this happening. CO2 concentrations up substancially and temperatures flat since 1998 and probably will be falling going forward and this fall IS very likely to start before this decade ends.

  24. David Overton says:

    If I understand the anomaly data you have provided for 2015, it indicates a warming trend consistent with what many climate scientists have identified – about .1 degree C per decade.

    Here is the math as I understand it:
    – these anomalies are relative to a baseline of 1980 – 2010 (i.e. relatively recent)
    – the mid-point of that baseline period is 1995, 20 years ago.
    – so on average, 2015 temperatures are being compared to the level that existed 20 years ago.
    – the average anomaly for the months of 2015 so far is .24 C.
    – .24C divided by 2 decades = .12 C/ decade of warming.

    Please let me know if there is something wrong in how I am looking at this. Thanks.

    • Dr. Mark H. Shapiro says:

      Mr. Overton,

      Your analysis is spot on.

      Dr. S.

      • mpainter says:

        His analysis is spot on the rug, where the puppy squatted.

        • David Overton says:

          Could you please expand on that, in terms of what is incorrect in my interpretation of the data? I located a graph of the temperature data he is using, and the 1980 – 2010 period is a relatively flat upward trend, so the period around 1995 appears to be an appropriate mid-point for that range. In other words, the rate of about .12 degree C per decade would hold, whether we use the beginning, end or middle of the base period time frame.

          The warming that he reports above seems inconsistent with his expectation that warming is not due to CO2, and that as a result we should be entering a cooling period. That appears to be the opposite of what is happening. I am just trying to understand this. Thanks.

          • mpainter says:

            David,decadal warming trends are spurious. These are an artefact of data misinterpretations.The only warming of significance occurred in the step-up in the temperature at 2000-2002. This event is the conjunction of two flat trends separated by about .3°C temperature anomaly. This step-up becomes clear if you carefully study the UAH plot above.

            To put another way, the purported decadal warming trends do not exist in that data, and such trends do not reflect what is actually seen in the data. A step-up is not a trend.

            The correct interpretation of the UAH plot is 36 years without warming except for the interval at about 2000-2002.

            The step-up is important because it cannot be accounted for by the AGW hypothesis.

            You have misstated Dr. Spencer’s views.

          • David Overton says:

            For some reason I can’t reply to your interpretation of the data that you provided below, so am replying to your earlier comment. There are many increases and decreases, which is common with any data series that displays significant variability. The most reliable descriptions of the trend in the data are those based on the longest timeframes. I was not looking at the rate of change by decade. .1C/decade represents the average rate of change to the present, relative to the base period that Dr. Spencer chose to use. If Dr. Spencer used a less recent timeframe, he would show an even greater anomaly.

            This is because there is a clear upward trend in the data. In other words, his data shows what all climate scientists have concluded – we are warming the planet. The increase in temperature relative to the increase in CO2 levels is right in line with estimated climate sensitivity.

          • mpainter says:

            David Overton,You incomprehensible parrot the alarmist line. One can conclude by your comments that you cannot understand the UAH chart of the global temperature anomaly posted above.

      • David Overton says:

        Thanks for the reply. But doesn’t this run counter to Dr. Spencer’s expectation that we should now be entering a cooling period? (from his explanation of the PDO: “if the PDO has recently entered into a new, negative phase, then we can expect that global average temperatures, which haven’t risen for at least seven years now, could actually start to fall in the coming years.” Just trying to understand this. Thanks.

        • dave says:

          David Overton says :

          “Dr Spencer’s [sic]…explanation…”

          You are responding to a COMMENT, by Salvatore del Prete.

          Dr Spencer is not responsible for what people write here.

          Dr Spencer has made it clear, with various statements on this blog, that he thinks there is a slight on-going rise in temperatures, which might be partly caused by human action.

          • David Overton says:

            I was not responding to a comment. I was looking at the data. It shows an average increase of .1C, which is about what the IPCC predicted in 1990. At this rate, we will have increased temperatures by about 2 degrees C by around 2100. I would not consider .1 C/decade “slight”.

  25. Dr. Mark H. Shapiro says:

    I agree with Mr. Overton. Dr. Spencer’s data is quite consistent with the trend in the much longer records of global surface temperatures. See, for example, the Japan Meteorological Agency data: http://ds.data.jma.go.jp/tcc/tcc/products/gwp/temp/ann_wld.html

    I find it interesting that Dr. Spencer continues to be a skeptic when it comes to global warming in light of the fact that his own data confirms a warming trend.

    • agreed. It is interesting that the trend (from his data) is upwards, and although currently on the lower side of predictions it is still glaringly obvious. But as usual, Dr. Spencer looks for discrepancies to prove the rule. Climate is a complex and often paradoxical science, but underlying trends over long time periods demand an explanation. CO2 and other greenhouse gasses are the explanation of best fit. Looking for anomalies is unhelpful if a new theory is not provided that satisfies the statistics. And please, no more talk of a “pause”as it doesn’t exist.

  26. John Parsons says:

    I come here once each month for the sole purpose of seeing whether or not Dr. Spencer has finally accepted the obvious conclusion of his own data.

Leave a Reply