UAH V6 Global Temperature Update for November 2015: +0.33 deg. C

December 1st, 2015 by Roy W. Spencer, Ph. D.

NOTE: This is the eighth monthly update with our new Version 6.0 dataset. Differences versus the old Version 5.6 dataset are discussed here. Note we are now at “beta4” for Version 6, due to our accidental omission of lower stratospheric data from NOAA-9 post-Feb. 1987.

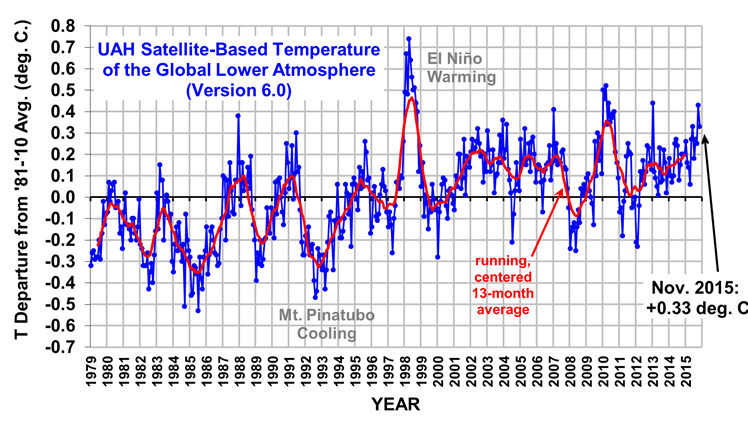
The Version 6.0 global average lower tropospheric temperature (LT) anomaly for November, 2015 is +0.33 deg. C, down from the October, 2015 value of +0.43 deg. C (click for full size version):

UAH_LT_1979_thru_November_2015_v6

The global, hemispheric, and tropical LT anomalies from the 30-year (1981-2010) average for the last 11 months are:

YR MO GLOBE NH SH TROPICS
2015 01 +0.28 +0.40 +0.16 +0.13
2015 02 +0.17 +0.30 +0.05 -0.06
2015 03 +0.16 +0.26 +0.07 +0.05
2015 04 +0.08 +0.18 -0.01 +0.09
2015 05 +0.28 +0.36 +0.21 +0.27
2015 06 +0.33 +0.41 +0.25 +0.46
2015 07 +0.18 +0.33 +0.03 +0.47
2015 08 +0.27 +0.25 +0.30 +0.51
2015 09 +0.25 +0.34 +0.17 +0.55
2015 10 +0.43 +0.64 +0.21 +0.53
2015 11 +0.33 +0.43 +0.23 +0.53

The tropics continue warm due to El Nino conditions, but the temperature in recent months seems to have plateaued despite the climatological expectation of increasing temperature as we approach peak El Nino warmth in the next few months. This plateau, of course, could end at any time.

The global image for November, 2015 should be available in the next several days here.

The new Version 6 files (use the ones labeled “beta4”) should be updated soon, and are located here:

Lower Troposphere: http://vortex.nsstc.uah.edu/data/msu/v6.0beta/tlt
Mid-Troposphere: http://vortex.nsstc.uah.edu/data/msu/v6.0beta/tmt
Tropopause: http://vortex.nsstc.uah.edu/data/msu/v6.0beta/ttp
Lower Stratosphere: http://vortex.nsstc.uah.edu/data/msu/v6.0beta/tls


418 Responses to “UAH V6 Global Temperature Update for November 2015: +0.33 deg. C”

Toggle Trackbacks

  1. Carl says:

    The pause continues..

    • Doug~Cotton says:

      Yes but the pause will only continue until about 2028, then there could be a repeat of the 30 years up to 1998, so out will come the champagne in AGW circles. Most will be dead by the time we see 500 years of cooling due to start later this century. It’s all natural of course, because 168W/m^2 of direct solar radiation reaching the surface does no better at heating the oceans than would an iceberg at -40C. That’s physics! Something they are not qualified in but think they know better than me.

      Is there anyone else here with at least three years of tertiary physics? Speak now or forever hold your peace.

      • mpainter says:

        i pronounce you man and wife. You may kiss the bride.

      • Tim Folkerts says:

        Doug, your physics is wrong in so many ways it is tough to know where to start.

        1) An iceberg @ -40C cannot heat the oceans at all. The oceans, being salt water, will never be more than a few C below zero, ie the water is warmer than the iceberg. Hence heat can only ever go FROM the ocean TO the iceberg. Sunlight, on the other hand, can only ever have heat TO the ocean FROM the sun. Sunlight provides heat TO the oceans; the iceberg absorbs heat FROM the ocean! Since only one can provide heat, its pretty clear which is more effective.

        2) If you are looking specifically at radiation, then your claim is a little closer to correct. Both a -40C object completely covering the sky and a ~6000C sun covering a teeeeny, ~ 0.001% patch of the sky provide a similar 168 W/m^2 of power.

        3) However, you are comparing apples and oranges. Earth is already receiving diffuse IR 24/7 from the atmosphere. Adding your “168 W/m^2 of -40 C icebeg radiation” would REPLACE the atmosphere’s radiation with the “iceberg radiation”. However, adding 168 W/m^2 of sunlight” would ADD to the atmosphere’s radiation. Hence sunlight is WAY better than your ‘iceberg’ at warming the surface.

        • D-C says:

          I’m not here to teach you physics, Tim – I get paid to do that. Go and search Google “Stefan Boltzmann calculator” and select the one at tutorvista.com. There you can confirm that 168W/m^2 can only raise the temperature to about 233K if the surface were a blackbody (which it isn’t) and if the flux were uniform striking a flat Earth day and night. You need about 460W/m^2 of variable flux to obtain a mean temperature of 288K in a blackbody. Nothing gets warmer than a blackbody for any given flux. The Earth’s surface needs more because there are energy losses to regions above and below. You can’t add backradiation according to valid physics, because it gets scattered as 21st century physics explains. Besides, it does not penetrate the ocean surface, so how could backradiation warm 70% of the globe? You don’t have anywhere near sufficient radiation entering the oceans to explain their mean temperature.

          Most of the required thermal energy does not get to the surface of Earth or Venus, or to the base of the 350Km high nominal troposphere of Uranus (where it’s hotter than Earth) by way of ANY radiation. Do you get it yet, Tim, Roy?

        • D-C says:

          What happens is in my paper.

          Elsewhere you can read what persons with appropriate experience and understanding of physics have said about my book that was based on the paper – which paper you now can read free without needing to buy the book.

          There’s a AU $10,000 reward for the first to prove the physics in the paper to be substantially wrong. In nearly two years no person who has read the paper has even attempted to prove it wrong. To get the $10,000 you also have to produce a study of real world data (similar to mine) showing water vapor warms to the extend implied by the IPCC – contrary to my study which proves it cools, as the hypothesis explains it would. Make your submissions on my blog and, Tim Folkerts, go and get some qualifications in physics, as I have, and perhaps you will learn that radiation from a cold atmosphere does not transfer any thermal energy to a warmer surface, because every independent one-way pencil of radiation obeys the Second Law. Entropy never decreases in any such process.

          This is the radiation balance at the Earth’s surface:

          Input:

          Solar radiation ……………………….. 168W/m^2

          Output:

          By radiation to the atmosphere & space …… 66W/m^2

          By other non-radiative processes ………. 102W/m^2

          Total output …………………………. 168W/m^2

          Because of the T^4 relationship, estimated required mean radiation input required to “explain” 288K mean temperature would by about 460W/m^2 PLUS simultaneous energy losses by non-radiative processes. Radiation output from an iceberg at -40C is also about 168W/m^2 – the same as the Earth’s surface receives by direct solar radiation. The Venus surface receives about 20W/m^2. The base of the Uransu troposphere receives zero direct solar radiation. It gets ALL the required thermal energy by downward natural (not forced) convective heat transfer which, in physics, includes diffusion by molecular collision. Such transfers are increasing entropy and restoring thermodynamic equilibrium, just as the Second Law of Thermodynamics says will happen. You can study recent findings about the Second Law (since the 1980’s) at this guy’s site: http://entropylaw.com

          That will be $80 in tuition fees, thanks Tim

          • Tim Folkerts says:

            I can always count on Doug to add his $0.02 worth to a discussion … and that is about all I would pay for this. There is perhaps $40 worth of good advice, but -$39.98 of bad advice.

            It’s not worth going into all details, but for a quick example, you said:
            “Nothing gets warmer than a blackbody for any given flux.”
            In fact this is rather backwards. A blackbody is the best possible emitter of thermal radiation, and hence will be COOLER than any other surface radiating a given amount of power. A blackbody radiating at a given flux of 168 W/m^2 would be ~ 233K. However, a surface with emissivity = 0.5 would be significantly warmer — about 277 K to emit 168 W/m^2.

            I suspect you were thinking about albedo & absorptivity of incoming solar radiation. Then you DO want the surface as “black” as possible for wavelengths in the range of 0.1-4 um to absorb as much incoming sunlight as possible. But the absorption for incoming sunlight from 0.1-4 um can be and often is rather different from the emissivity from 4-100 um for outgoing thermal IR.

            You need to get beyond using simple calculators as crutches and beyond appeals to authority (no matter how successful they were at managing a tutoring company). You seem to have the smarts to figure this out, but you seem blinded by your own preconceptions.

          • DJC says:

            Tim Folkerts, who has no qualification in physics, would imagine that a polished silver spoon (emissivity 0.02) sitting out in the Sun would get warmed to over 100C. This brain-washed ex-pupil of climatology does not realize that the 168W/m^2 entering Earth’s surface is determined after allowing for absorption of 6%, in other words, we don’t apply 0.94 emissivity in S-B calculations. All his calculations are for uniform flux, not variable flux, and so they are totally irrelevant for Earth because of the T^4 relationship in S-B. Furthermore, he made the biggest mistake of all in assuming that the surface temperature is what it is because it emits a certain amount. Talk about putting the cart before the horse. I suppose my kettle just boils because, at boiling point it emits what we observe – doesn’t need electricity. Likewise his magical Earth surface doesn’t need input of thermal energy to warm each morning. Tim is the absolute epitome of the new breed of arrogant (mostly American) “scientists” who rattle off equations and formulas and use them completely incorrectly because they simply don’t understand the physical world, entropy, thermodynamics or the like. Tim of course can’t explain how the Venus surface gets the required thermal energy to warm each morning either, whereas I have. What I have explained works for all planets and even the core of our Moon. Experiments with centrifugal force also prove Josef Loschmidt, Dr Hans Jelbring and others were right, so there’s no warming left to be done by SoD’s “amazing” backradiation.

            I said no body gets hotter than a blackbody for any given level of incident radiation. I stand by that statement, as do people who understand physics.

          • DJC says:

            I suggest you read Mathematical Physics of BlackBody Radiation from which I quote the good professor …

            “A greybody at a given temperature may have a radiation spectrum of a blackbody of lower temperature …”

            BUT, what it radiates does NOT tell you how much thermal energy is being lost in that process, or how much it took to raise it to the temperature. For example, your silver spoon will reflect 98% of the solar radiation and only get warmed with SOME of the remaining 2% IF its temperature is low enough for that radiation to be above its “cut off” frequency.

            Again I quote the good professor …

            “Radiative heating of a blackbody is an irreversible process, because the heating results from dissipation with coherent high frequency energy above cut-off being transformed into internal heat energy. We assume that the dissipation is only active above cut-off, while the radiation is active over the whole spectrum. Below cut-off radiation is a reversible process since the same spectrum is emitted as absorbed. Formally, the radiation term is dissipative and thus would be expected to transform the spectrum, and the fact that it does not is a remarkable effect to the resonance.”

          • DJC says:

            And, Timmy Boy, you put your foot right in it. You admit that emissivity would have to be as low as 0.05 to get (incorrectly, anyway) temperatures similar to actual surface temperatures. But the Earth’s surface emissivity is more like 0.94. It also has to emit thermal energy by non-radiative processes and, in general, it would need input from a source that delivers variable flux with a mean of about 460W/m^2 to explain a 288K mean. So good luck with your turning 168W/m^2 into 460W/m^2.

            If you then do the exercise for Venus you’ll need to turn about 20W/m^2 of direct solar radiation reaching its surface into variable flux with a mean of over 20,000W/m^2 to explain the warming of the Venus surface from 732K to 737K over 4-months of sunlight. So just explain the last one, Tim, because I have – but you can’t without cribbing the answer from my writings.

          • DJC says:

            Correction: “after allowing for absorption of 6%” should read “after allowing for reflection of 6%”

          • Tim Folkerts says:

            “[A long explanation full of red herrings and occasionally correct statemetns, followed by the conclusion] I said no body gets hotter than a blackbody for any given level of incident radiation. I stand by that statement, as do people who understand physics.”

            That is simply incorrect. Still. For the same reasons already explained.

            The “blacker” a surface is for incoming radiation, the hotter it will be.
            The “blacker” a surface is for outgoing radiation, the cooler it will be.
            (and go back to red herrings about conduction or convection, since the question at hand is radiation balance)

            So, if you are talking the amount of incident radiation that is actually absorbed (and subsequently emitted as thermal radiation), any real surface is HOTTER than a blackbody.

            If you are talking the amount of incident radiation that is simply heading toward a surface (which seems to be the case based on your most recent discussion), then any object that is “blacker” for incoming radiation than for outgoing thermal radiation will be HOTTER than a true blackbody.

            These are sometimes called “selective surfaces” and are use in solar collectors to get hotter than traditional black paints.

            No matter how you slice it, it is both trivial and common to have objects that are hotter than blackbodies for a given incident radiation level.

            PS. Most people intuitively know that polished metal can get quite hot in sunlight, often hotter than black surfaces.
            PPS The “good professor” is wrong about graybodies. A greybody at a given temperature may have a radiation spectrum of a blackbody emit the same energy of lower temperature. However, the peak of the graybody spectrum will be at a higher frequency (a la Wein’s Law). Only some very specific “reddish-gray” body would have the same spectrum.

          • DJC says:

            I am NOT talking about what a body radiates. I am talking about HOW it got to the temperature it has. The Earth’s surface (and that of Venus, and the base of the Uranus troposphere etc) got to the temperatures they are at by the process of maximization of entropy which governs ALL natural processes in accord with the Second Law of Thermodynamics.

            Your polished silver spoon in the sun does not get hotter than the black asphalt road. Physics tells us (courtesy of Nobel Prize winner Max Planck) that a black body radiating towards another body cannot make the target hotter than itself. On a day when your bare feet nearly get burnt on a hot asphalt road, hold a polished silver spoon and get your fingers burnt, TF.

          • DJC says:

            TF, like climatologists in general, completely ignores the Second Law, thinking that radiation from a relatively cold body can transfer thermal energy to a hotter body and make it hotter still. Because he does not understand the limitations of Stefan-Boltzmann calculations, he would get these absurd results on a day when the incident solar radiation was 550W/m^2 – that being equivalent to the radiation from a nearby blackbody at 40C. Readers can Google “Stefan Boltzmann calculator” and select the one at tutorvista.com. Now, insert emissivity 1.0 (for a black body) and area 1 and temperature x and flux 550. You get about 313K or 40C – quite realistic for a hot black asphalt road surface in the Sun. Then change the emissivity to that of a polished silver spoon (0.02) and you get about 834K. Need I say more about climatology fictitious, fiddled physics with which our friend Tim Folkerts has been brain-washed?

            In any event, TF, the emissivity of Earth’s surface is above 0.9 and the mean flux of 168W/m^2 reaching the surface does not explain the observed mean ocean surface temperature, now does it? Remember that back radiation does not penetrate below the ocean surface, so you can’t count it.

          • DJC says:

            To TF, Roy and ANYONE:

            Let’s see your S-B calculations “explaining” Earth’s surface temperature. The solar flux reaching the surface has a mean of about 168W/m^2, but there is very variable flux contributing to that mean. Do NOT use the 168W/m^2 figure as if the Earth is a flat disc receiving uniform flux day and night. Instead do a very rough (but more indicative) calculation assuming five equal zones receiving 20%, 60%, 100%, 140% and 180% of the mean flux, so the mean of the variable flux will still be 168W/m^2. Use the on-line Stefan Boltzmann calculator (referred to in my last comment) and calculate the average of your temperatures, which you will find to be well below freezing point. And you haven’t even deducted the simultaneous heat losses by evaporation and conduction. Oh, you want to add backradiation do you, and get a mean of 390W/m^2 net – forgetting to deduct the outward radiation? Well go ahead with your 390 figure, using the same percentages (20% to 180%) and see what you get. I’m waiting.

          • Tim Folkerts says:

            ” Now, insert emissivity 1.0 (for a black body) and area 1 and temperature x and flux 550. You get about 313K or 40C quite realistic for a hot black asphalt road surface in the Sun. Then change the emissivity to that of a polished silver spoon (0.02) and you get about 834K. Need I say more about climatology fictitious, fiddled physics with which our friend Tim Folkerts has been brain-washed?”

            Every “rebuttal” of yours merely multiples the number of errors, making it impossible to keep up. For example, in the above example, you changed the emissivity, but not the absorptivity. Not only would polished silver only emit ~2% as well as a blackbody, it would only ABSORB about 2% as well as a blackbody, ie absorb about 0.02*550 = 11 W/m^2 absorbed energy. Then the temperature would be identical to the asphalt. If the absorption was even slightly better than the emission (0.03 vs 0.02) then the temperature jumps about 35 C warmer, which seems quite plausible.

            The fact that you are blindly using some calculator without even considering that the sunlight is absorbed differently shows you are not thinking nearly deeply enough about ANY of this.

            I could give many more examples just from this thread, but there is hardly any point when you continue to ignore comments and you continue to attack strawmen. But at least some others may be better able to sort through your posts.

          • DJC says:

            I have explained, Tim Folkerts, why the Earth’s surface temperature cannot be calculated from radiation flux in this comment.

            I have been first in the world to explain how the required thermal energy DOES get into the surfaces of Earth and Venus raising their temperatures each morning by a process involving maximization of entropy in accord with the Second Law of Thermodynamics.

            I have also explained, using the Second Law of Thermodynamics, just precisely why the density gradient forms and becomes stable when thermodynamic equilibrium is attained, that being (in physics) the state of maximum entropy.

            I have explained (directly from the Second Law) why that stable state also has a stable temperature gradient, because there can only be one state of maximum entropy – obviously. No it’s NOT hydrostatic equilibrium.

            You have not produced any calculations showing that the surface temperatures on these planets can be calculated from radiation, nor have you faulted my calculations in that comment linked above.

            Nor can you, Tim Folkerts, explain the temperature at the core of our Moon, or 10Km below the surface in Germany – whereas I can, including an explanation of the necessary energy flows.

            What I have explained will be common knowledge in about 15 to 20 years from now, and the initial worldwide-publicity is planned for 2017. Perhaps you’d better get another job, because it must be boring just re-iterating the fictitious, fiddled physics of climatology which I know as much about as you, having studied Pierrehumbert’s book and pinpointed errors therein which blow the whole conjecture to smithereens.

          • DJC says:

            And Tim, “for a body of any arbitrary material, emitting and absorbing thermal electromagnetic radiation at every wavelength in thermodynamic equilibrium, the ratio of its emissive power to its dimensionless coefficient of absorption is equal to a universal function only of radiative wavelength and temperature.” [source]

            In other words, if your polished silver spoon has higher absorptivity than emissivity then it would not be in a state of thermodynamic equilibrium, and thus not at maximum entropy or at the maximum temperature achievable in the circumstances. Keep it in the Sun as long as the asphalt road has been.

            You didn’t try the experiment, did you? You didn’t find a polished silver spoon that got hotter than a black asphalt road surface that had been in the same solar radiation for the same period, now did you?

            There’s nothing like experiments and studies of real temperature data to confirm or refute an hypothesis. My hypothesis stands up to such testing. The radiative forcing GH conjecture does not, because there is no evidence of water vapor raising surface temperatures by most of “33 degrees” (that is, about 20 degrees for each 1% of WV) which raising has already been done by gravity anyway.

          • Tim Folkerts says:

            Doug say: “And Tim, for a body of any arbitrary material, emitting and absorbing thermal electromagnetic radiation at every wavelength in thermodynamic equilibrium, the ratio of its emissive power to its dimensionless coefficient of absorption is equal to a universal function only of radiative wavelength and temperature. “

            Another post, another misunderstanding. Anyone else seeing the pattern? 🙂

            If you understood what you were cutting and pasting, you would know that the words “at every wavelength” nullifies the interpretation you want to use. At any given wavelength, absorption and emission must be the same. So, for example, if emissivity at 7.83 um IR is 0.9, then the surface also absorbs 90$ of incoming radiation at 7.83 um. But the emissivity and absorption at some other wavelength — say 0.632 um red light — can and generally is different.

            For this law of physios to support your rebuttal, all objects would have to be some shade of gray. For this law of physios to support your rebuttal, all objects would have to reach the same temperature in sunlight.

            And yes, I HAVE done experiments where different surfaces reach different temperatures in sunlight. 🙂

        • D-C says:

          PS For over 20 years I was Principal and owner of one of the largest private tuition services which operated in several states of Australia and employed hundreds of teachers part-time. I handled most tertiary tuition in physics and maths myself in Sydney, and helped many, many students to understand and do well in physics, a subject in which I majored under Prof Harry Messel and his associates who taught correct physics at Sydney University in the 1960’s before all the crap fissics started in climatology circles in the 1980’s, ignoring what the brilliant physicists Josef Loschmidt had explained in the 19th century, and which has now been confirmed in the 21st century by experiments with centrifugal force. BigWaveDave also told you about the radial temperature gradient formed by gravity here over 3 years ago. As he said, “It obviates the need for concern over GH gases.”

        • D-C says:

          Now please read this comment.

  2. geran says:

    I would have happily bet $10 that November global would be at least +0.50.

    Another bet that I’m glad I didn’t make!

  3. I had sent this yesterday wanted to send it again.

    The test time is now and if prolonged minimum solar conditions become established (which I think is happening now) the climate test will be in play, and the fools at the climate summit knowing a prolonged minimum solar condition was likely should have taken the wait and see approach instead.

    Then again it is agenda driven not science driven.

    Below are the thoughts I conveyed to Joe Bastardi about how I view the situation.

    The climate summit is stupidity to its highest degree the blind leading the blind. I wish I could address the fools and show them why they are out if it and are clueless when it comes to the climate.

    WHAT A WASTE OF TIME !!

    Some points I would bring out and hammer if I were there.

    The way I see it the Test is on and those who think AGW IS real are going to be very disappointed and this disappointment will be realized before this decade is out IF my low average value solar parameters are achieved and have some staying power. I think they will be achieved and then we will see which side is correct once and for all.

    In the end it will depend on the degree of magnitude change of solar parameters and the duration of that change.

    I think if certain low average value solar parameters are met they will bring a cooling to climate due to weakening solar conditions but more importantly the associated secondary effects associated with a prolonged minimum condition.

    If for example intense volcanic eruptions occur in response to prolonged solar minimum conditions which they have in the past according to the data global temperatures will decline, despite the ocean heat content which will by the way eventually decline.

    We may have more EL Ninos when the sun is quiet? That is only when the sun is in a steady rhythmic cycle and does not apply to prolonged minimum solar conditions. Even so if El Ninos are to occur they will be superimposed upon sea surface temperatures in general which will be on the decline.

    Another factor which I think has to be watched is what is happening with Antarctica. The S. Ocean is way below normal in temperature and that could be one of those factors which is dismissed to create a climate impact. It is always the factors that are dismissed that I focus on.

    Then the atmospheric circulation pattern as we know can change the distribution of global temperatures in way that does not necessarily bring the global world wide temperatures down as a whole but effects the distribution of where the cold global temperatures are, which could create global cooling where it counts, the mid to high latitudes while leaving lower latitudes not much changed which would result in your point of view about the oceans holding up temperatures and the global cooling point of view that prolonged minimum solar conditions create a trend toward Ice Age conditions if not by cooling the globe all that much as a whole but rather on a regional basis for phase 1. This later progresses if prolonged minimum solar conditions persist.

    I think these are some of the things that have to be watched.

    In addition the globe has been in a cooling trend since the Holocene Optimum some 8000 years ago punctuated by spikes of warmth and I think Milankovitch Cycles , the Geo Magnetic Field with solar activity superimposed upon those two factors explain it quite well. This current warm spell is just one of those spikes in temperature in an overall cooling trend in my opinion post the Holocene Optimum.

    I want to see how high the temperatures spikes are with this El Nino and as you said how low it gets post this El Nino. My feeling is the spike will not be as high and the cooling post this El Nino will be greater. I think the cooling trend will be established before this decade ends and the unknown is climatic thresholds which are and must be out there because if one looks at the historical climatic record often times the climate goes along changing gradually then all of a sudden it changes in a step like fashion into another climate regime. That aspect seems to be being overlooked everyone seems to keep assuming the climate changes in a gradual fashion when past history shows us this is not the case and I think if the proper phasing of items that control the climate are achieved and the duration of time is long enough along with the degree of magnitude change that thresholds could be reached once again. I am not saying that will happen but if prolonged minimum solar conditions are achieve and are severe enough in magnitude and duration of time that possibility has to be considered.

    • Salvatore, you write more words on my blog than I do.

      If you are so passionate about the sun being the cause of everything, why not start your own blog?

    • DJC says:

      I agree, Salvo, with your general implication that the figures are fudged. It’s ironic that they want to see warming, despite the human cost, and they’ll be celebrating when warming starts again after the year 2028. Strange how no-one celebrates the current 30-year stretch of slight cooling from 1999 to 2028.

      They can rave all they like, and fiddle the temperatures all they like, but that won’t prove the Second Law of Thermodynamics fails as they assume it has. They completely ignore the fact that there is an equilibrium state with an autonomous radial temperature gradient due to gravity, because of that law, just as there is an autonomous radial temperature gradient due to centrifugal force in the experiments I have cited.

      So there’s no need for warming by back radiation. We need back radiation from water vapor to cool the surface (as it does) because gravity oversteps the mark and would make surface temperatures have a mean of over 300K but for water vapor and clouds.

    • Brian Jones says:

      In the graph there appears to be two pauses, one prior to the 1998
      spike and the one after the spike. It would be nice to see a median
      line (or whatever you think is relevant) for each period. That way we could clearly see that a change has occurred since the 1998 spike. Does anybody have any idea why this gap up has occurred or is it just cherry picking by me.

  4. mpainter says:

    If there is a peak, it should come in Jan/Feb.

  5. dave says:

    “If there is a peak…”

    As Dr Spencer indicates by “this plateau, of course, could end at any time,” and as Dr Christy suggested eighteen months ago, it would not be surprising to see a spike in the brightness temperature, similar to those of 1998 and 2010, even while the El Nino starts to weaken. Or perhaps the temperature will simply fall again without a spike.

  6. Threepwood says:

    Here in N. Michigan at least this is the nicest start to winter we’ve had in years.

    Energy usage is low, energy prices are low, people are enjoying the outdoors, every year I appreciate the progress of the rebounding forests, helped by an extra molecule of CO2 in 10000 of air

    No computer program is needed to simulate the obvious benefits of slightly added CO2 and slightly warmer weather.

    So even as a skeptic I’d like to see that chart go higher.

    Because it would make no difference if it showed a new ice age dawning, nobody would admit they were wrong, the ‘problem’ would just morph again while the ‘solutions’ would be exactly the same, they certainly were during the last ‘global cooling’ scare

    So I’m optimistic, but it’s early days, still got the snow blower ready!

    • Slipstick says:

      “obvious benefits” unless, of course, you live in a coastal area subject to the increasing storm surge from a rising sea level, or live in a region flooded by record precipitation events, or are dependent on glaciers as your source of water, or live in a subtropical region being invaded by tropical pathogens, or are a farmer wiped out by drought unprecedented in recent history, or are a fisherman whose catch is migrating away or simply dying out, or a taxpayer or insurance customer whose rates increase to pay to mitigate the “obvious benefits”.

      • mpainter says:

        Slipstick, sea level is not rising. I took you through this in detail months ago. You are a backslider. Cant stay off that handwringer juice, can you?

        • Slipstick says:

          mpainter,
          Yeah, I remember that. In your universe of half-truths and selective data sampling, the TOPEX/Poseidon, Jason, ERS, et al satellite data, the Argo network, tidal gauges (unless they show a decline) and a myriad of other data sources are all wrong. It’s not that sea level is rising, it is that all the coastlines around the globe are subsiding.

          • mpainter says:

            Well, slapstick, so much for your integrity.

            I showed you that satellite altimetry has an error margin of +/- 33 mm, as given by NASA. You disputed that and declared NASA to be wrong.

            You insisted that ARGO floats took sea level readings. When I showed that they did not, you yet insisted that they did.

            I referred to NOAA tidal gauge mean sea level trends for the various coasts, took you step by step through those and showed which coasts were subsiding, and why, and which coasts were stable. I did this because you expressed interest in the issue. When I referred you to tidal gauges on stable coasts, where gauge after gauge showed no SL rise for the past several decades, you declared that the data was wrong and accused me of misrepresentation, and terminated the discussion.
            That discussion took place here some months ago. Had I known what sort you actually were, I would never have wasted my efforts.

            I wish I remembered the particular post so that I could link to it.

          • AndyG55 says:

            The “Battery NY” reference point used for the satellite sea level data has been shown to be sinking at approximately 2.2mm/year 3.6 minus 2.2 = 1.4mm/year.. almost exactly the same as the tide gauges.

          • AndyG55 says:

            The most stable places in the world show a ‘horrific” sea level rise of around 0.7mm/year to 2mm/year. averaging somewhere between 1 and 1.5mm/year..

            Be very, very afraid.

            Gees, even at the mythical 3.6mm/year.. be very, very afraid. 🙂

          • mpainter says:

            AndyG55
            I referred to NOAA gauges on the west coast which, in stable locales, showed mean sea level trends with no SL rise for 30 years or more. These were some dozen gauges from Vancouver southward, and yes, the NOAA operates a gauge in Vancouver. See individual gauges.

            The NE US shows a sea level rise, but this is in fact regional subsidence, believed to be isostatic adjustment. Thus the subsidence at the battery. The Gulf coast gauges show no sea level rise, except where there is local subsidence. Grande Isle, La. shows a sea level rise of 9 mm/yr, but this sediment compaction/slump of the delta deposits.
            In summary, the NOAA tidal gauges cannot be rigged, and these tell a very different tale from what the alarmists, and the NOAA itself, tell (the NOAA studiously ignoring its own tidal gauges).

          • Slipstick says:

            mpainter,
            Rather than engage in a urine projection competition regarding your misrepresentation of my positions or your apparently purposeful misunderstanding of instrumentation interpretation and trend analysis, I pose a single question: Where did all the ice that’s disappeared from the Arctic ice pack and glaciers around the world in the last 30 years go?

          • mpainter says:

            No thanks, Mr no name. You are unclean.

          • Slipstick says:

            I note you avoided the simple question.

          • bit chilly says:

            i think mpainter just avoided the simple.

          • geran says:

            Slip, I see you have given up on your confusion with physics and have now moved into confusion with Earth sciences. Here are some things for you to think about:

            What is Earth’s sea level SUPPOSED to be? Where is this level to be measured, and how? Does this level ever change naturally, and if so, how much? And, importantly, if there were NO melting at the poles, or of any glaciers, would sea level still be rising due to natural impacts?

            Please show all work.

          • Slipstick says:

            geran,
            The implication of your questions is irrelevant. I quote from my earlier reply to JohnKL:
            “Taking your argument to its conclusion: It happened in the past, therefore the current warming and its effects are a natural event. Logically, this is the same as saying that because forest fires, prior to the discovery of fire making by humans, were caused by vulcanism, comets, meteors, and lightning, all forest fires are of a natural origin.”

          • geran says:

            Slip, you choose to call the questions “irrelevant” because they destroy your biased opinions.

            But, your talent for humor is a little off today. I was expecting you to claim to know all the answers!

          • David Appell says:

            geran says:
            “What is Earths sea level SUPPOSED to be?”

            There is no “supposed to be” level. There is only the level we have adapted to. Changes to that level require further adaptations (which are likely to be expensive).

          • Slipstick says:

            Your questions in no way “destroy” anything. One thing about my opinions, they are based on facts, as best as I can ascertain them, while your opinions are based on belief. An example: You believe that a photon emitted by a warmer molecule cannot be absorbed by a cooler molecule. I challenge you to provide any reference to a reproducible physical experiment demonstrating that conjecture; something this fundamental and important would certainly be well documented. Good luck!

          • Slipstick says:

            geran,
            My apologies, I miswrote the above. Your belief is that a warmer molecule cannot absorb a photon emitted by a cooler molecule.

          • Chic Bowdrie says:

            Slipstick,

            You’ve asked for proof of a negative. Do you have any evidence of a reproducible physical experiment demonstrating a photon emitted by a colder molecule can be absorbed by a warmer molecule?

            My understanding is that individual molecules don’t have temperature.

          • geran says:

            Slip writes: “My apologies, I miswrote the above.”

            Slip, never apologize for your confusion. It takes away from the humor.

            We want more humor!

          • geran says:

            Davie, the sea level in the Florida Keys was half a meter higher 1000 years ago.

            (Hilarious.)

      • JohnKl says:

        Hi Slipstick,

        You state:

        “or are a farmer wiped out by drought unprecedented in recent history”

        In other words today’s climate is so benign that you have to delve into well into the past to find extreme droughts! You go on:

        “coastal area subject to the increasing storm surge from a rising sea level,…”

        An increasing storm surge cannot happen without rising sea levels? Any reason to believe they’ve not occurred before? I’ll write more later.

        Have a great day!

        • Slipstick says:

          Greetings JohnKL,
          Taking your argument to its conclusion: “It happened in the past, therefore the current warming and its effects are a natural event.” Logically, this is the same as saying that because forest fires, prior to the discovery of fire making by humans, were caused by vulcanism, comets, meteors, and lightning, all forest fires are of a natural origin.

          If the current climatic state is strictly natural, what natural mechanism reduced the Arctic ice pack ~1 million sq. km in less than a decade and accelerated melting of more than 90% of the Earth’s glaciers? Keep in mind that we now have instrumentation measuring nearly every conceivable component of the climate and, to my knowledge, the only component which correlates with these effects is the ratio of atmospheric gases.

          I would be most interested if someone could identify some other component of the climate with a similar correlation. (Sorry, Salvatore, et al, the solar models have failed repeatedly, and Doug, go work on your crank operated perpetual motion machine or something.)

          • AndyG55 says:

            The current Arctic sea ice is probably a bit high for the current position of the AMO.

            The AMO has only just started to drop from its peak, yet the sea ice level is bordering on one standard deviation below the 1979-2000 mean.

            http://s19.postimg.org/eteoqkhpv/Amomeandmi.jpg

          • Slipstick says:

            AndyG55,
            How does the AMO influence glacial loss in the Andes or Himalayas?

          • JohnKl says:

            Hi Slipstick (apparently handy with a slide-rule),

            Thank you for responding. You noted:

            “If the current climatic state is strictly natural, what natural mechanism reduced the Arctic ice pack ~1 million sq. km in less than a decade and accelerated melting of more than 90% of the Earths glaciers?”

            Good point except that much more rapid climate change has occurred in the past. Note the current permafrost likely formed within a few hours, let alone 10 years. Russian permafrost contains millions of Mastadons, Mammoths, Dyre Wolves, etc. flash frozen almost completely intact, except for being dead. Explorers seeking ivory have fed the fleshy Mammoth remains to their dogs who ate them without harm. Moreover, the Mammoths were frequently found with various intact frozen floral remains in their mouths. Just saying you seem to have been lulled to sleep, under the delusion that nature acts slowly and gently. Since when?

            Have a great day!

          • Slipstick says:

            Hi JohnKL,
            Indeed, more rapid transitions have occurred in the past, but these were most likely triggered by some catastrophic event or series of events, which, to my knowledge, is not the case at the present. Also, the central question remains: Given all the climate data we have, what component is responsible for the observed effects?

          • JohnKl says:

            Hi Slipstick,

            You note:

            “Keep in mind that we now have instrumentation measuring nearly every conceivable component of the climate and, to my knowledge, the only component which correlates with these effects is the ratio of atmospheric gases.”

            Keep in mind, this argument works against you as well. Those instruments have only existed a few decades, a mere blip in climate history. Which means rapid climate mutations could have occurred frequently without having been recorded. How did glaciers fare in the 19th and 20th century? Given the much weaker technology through most of the period we really don’t know. You asked:

            “Given all the climate data we have, what component is responsible for the observed effects?”

            Evidence exists of climate albedo changes resulting in higher temps including the 1997-8 peak. In any case, absorption and utilization of solar energy play key roles. The problem remains that if GHG’s caused the supposed warming, why isn’t the Southern Hemisphere showing the same results? The Southern Hemisphere likewise experiences increased in CO2 and has much greater quantities of H20. Why do glaciers grow in the Antarctic? Why as Massimo PORZIO’s link indicated up-thread have Southern hemisphere regions like Mozambique, Zimbabwe etc. experienced significant 2-3 deg cooling not to long ago?

            Humans like to flatter themselves that by merely going to work and using some silly appliance they will destroy the planet! The common man becomes superman ( the pleb thinks he’s superman – Nietszche would not be pleased ) without even having to think about it. Imo, God is still in control.

            Have a great day!

          • D-C says:

            Slipstick: Perpetual motion machines are an impossibility and nothing what-so-ever to do with anything I have written. What I write is based on and developed from the Second Law of Thermodynamics, and you’d be hard pressed to prove that law wrong, or prove my use of it wrong. If you were referring to Robert Brown’s pathetic article, I refuted it long ago here.

            My reply to TF should also be read by yourself in this comment and the following ones.

          • Slipstick says:

            Mr. Cotton,
            Until your model can explain what happens to the photon released by an ultra-cold atom as it is “coaxed” into its lowest energy state, the physics is in violation of conservation and, therefore, invalid, so we have nothing to discuss.

            Be well.

          • DC says:

            I’m not interested in your assertive statements, Slipstick.

            Radiation is not relevant anyway. How about you explain what happens here.

          • Slipstick says:

            Mr. Cotton,
            As I said previously, given that your physical model does not reflect reality, I have no interest in wading through your nonsense once again and we have nothing to discuss. However, I must comment on your remark that radiation, the dominant form of energy transfer in the universe, is not relevant. I find that utterly hilarious and a telling demonstration of the mindset that created such a ridiculous fiction.

      • Norman says:

        Slipstick,

        To pour a bit of water on the flames of your fanatic mental state of CAGW…You state: “or are a farmer wiped out by drought unprecedented in recent history”

        You may choose to believe all the hype but reality does not support your religious zeal.

        http://www.nature.com/nature/journal/v491/n7424/full/nature11575.html?WT.ec_id=NATURE-20121115

        From the abstract: “More realistic calculations, based on the underlying physical principles8 that take into account changes in available energy, humidity and wind speed, suggest that there has been little change in drought over the past 60 years.”

        • Slipstick says:

          Norman,
          Unfortunately, the paper is behind a paywall, so I can’t really comment on the paper’s methodology or conclusions; however, I do have one comment based on the abstract. The thesis is that the PDSI model is inaccurate because of the temperature increase due to global warming and the authors’ alternative model suggests this might be the case. I’m surprised that you referenced a paper that accepts global warming is occurring and that models are a valid investigative tool.

          • D-C says:

            Slipstick: Who doesn’t accept that there is (natural) global warming? I suggest you look at this graph and read the rest of the site, and my comments to TF to which I referred you above.

          • David Appell says:

            Doug: Why aren’t you submitting your earth-shattering claims to a peer reviewed journal, where it will make a real difference if published?

            And why do you never answer this question?

          • DJC says:

            I’ve already answered that question and Dr Hans Jelbring (with a PhD in climatology) has already has published an article on the gravity effect in “Energy and Environment” in 2003 here where he wrote that it can all “be explained as mainly being a consequence of known physical laws describing the behaviour of ideal gases in a gravity field.”

      • JohnKl says:

        Hi Slipstick,

        You state:

        :…or live in a region flooded by record precipitation events, or are dependent on glaciers as your source of water”

        Seriously, glaciers have retreated over thousands of years. How do you plan to stop them?! You further state:

        “…or live in a subtropical region being invaded by tropical pathogens”

        Tropical plants are found in Arctic permafrost! Again how do you plan to stop them?! Will you get out their with a bug trap? You state:

        “…or are a fisherman whose catch is migrating away or simply dying out”

        Fisherman, often have to change fishing locations. What’s new about that? As to insurance you’ll need HEALTH INSURANCE, all that cortisol running through your veins from worrying too much.

        Have a great day!

      • Slipstick says:

        geran,
        Apologies, I miswrote the above. Your belief is that a photon emitted by a cooler molecule cannot be absorbed by a warmer molecule.

        • geran says:

          Slip, it’s called “something” physics. What is that word? Let me think.

          Oh yeah, “quantum”. Quantum physics. Look it up.

    • mpainter says:

      And 3pwood, shame on you for enjoying the horrifically blighted outdoors. As slapstick makes plain, you should be wringing your hands in righteous fashion.

      • fonzarelli says:

        “Slapstick”

        Painter, Ha! (that’s a good one that i hadn’t heard before) You were enquiring a while back, i believe, as to what the meaning of “slipstick” is. Slip once explained that it’s another name for a slide rule…

  7. dave says:

    Threepwood says:

    “…the ‘problem’ would just morph again…”

    Ay, there’s the rub!

  8. FTOP says:

    Congratulations on your accelerated release schedule. It seems you have compressed the process down to almost immediate availability.

    With November data, Karl will need to rev up his adjustment algorithms and delete some more e-mails.

  9. Werner Brozek says:

    That was fast!
    I knew that UAH could not reach second place before this. However a huge upward spike in November could have made it interesting. But with a drop, reaching second place it totally out of the question. It is stuck in third.
    So what happens to the length of the pause on UAH and RSS? I will assume that RSS will show a similar drop as UAH, but at the very least, not a huge spike. If so, based on the anomalies where their present pauses start, namely February 1997 for RSS and May 1997 for UAH, I would say the pauses will probably AT LEAST stay at the lengths they are at present, namely 18 years and 9 months for RSS and 18 years and 6 months for UAH. The only possible difference with the November data is that the pauses may start and end a month later.

    • JohnKl says:

      Hi Werner Brozek,

      You state:

      “If so, based on the anomalies where their present pauses start, namely February 1997 for RSS and May 1997 for UAH, I would say the pauses will probably AT LEAST stay at the lengths they are at present, namely 18 years and 9 months for RSS and 18 years and 6 months for UAH. The only possible difference with the November data is that the pauses may start and end a month later.”

      Of course, it’s all speculation. What if the present pause continues til century’s end? Or what if it ends next month? We will at least have more to gab about!

      Have a great day!

      • Dr No says:

        Hi JohnKL,

        “Of course, its all speculation. What if the present pause continues til centurys end? Or what if it ends next month? We will at least have more to gab about!”

        Try this for speculation:
        According to the WMO, 2015 is likely to be the hottest year on record, with ocean surface temperatures at the highest level since measurements began.

        Pause Schmause. The long-touted pause is a figment of desperate minds.

        “..to gab about!”
        definition: To talk idly or incessantly. This well describes the contributions here (myself excluded).

        What happened to your partner in intellectual crime – Doug?

        • Werner Brozek says:

          According to the WMO, 2015 is likely to be the hottest year on record

          Records will be set by Hadcrut4, GISS and Hadsst3, but not by UAH and RSS. 1998 will stay as the record and the satellites will not even reach second place which was 2010.

        • JohnKl says:

          Hi Dr. No,

          You state:

          “Try this for speculation:
          According to the WMO, 2015 is likely to be the hottest year on record, with ocean surface temperatures at the highest level since measurements began.”

          Unfortunately, satellite data conflicts and as you admit the WMO claim is speculation. You go on:

          “Pause Schmause. The long-touted pause is a figment of desperate minds.”

          Hmmh! Desperate minds? Do you refer to the belief that Ursula still hankers for you after all these years? You must mean, the kind of mind that appears to confuse the observational and theoretical like “bodies” and “black-bodies” right? You continue:

          “..to gab about!
          definition: To talk idly or incessantly. This well describes the contributions here (myself excluded).”

          Probably correct, speculation about about future climate scenarios and such babble is primarily gabbing. You on the other hand appear to waste time hankering after Ursula and dreaming up global climate warming/doom scenarios over which you’ve shown no ability to arrest perhaps more accurately may be said to prattle:

          definition: To talk at length in a foolish or inconsequential way.

          You ask:

          “What happened to your partner in intellectual crime Doug?”

          Never sought the life of intellectual crime myself. That’s supposed to be the sport of the apparently self-proclaimed evil Dr. No. As to Doug, you’ll have to ask him.

          Have a great day!

          • Dr No says:

            Hi JohnKl,

            “Unfortunately, satellite data conflicts..”
            Unfortunately, satellite data do not represent global average surface temperatures – only tropospheric temperatures.

            “Do you refer to the belief that Ursula still hankers for you after all these years?”
            How can she not? After all, she is only human.

            “You on the other hand appear to waste time hankering after Ursula and dreaming up global climate warming/doom scenarios over which youve shown no ability to arrest perhaps more accurately may be said to prattle: definition: To talk at length in a foolish or inconsequential way.”

            I have no desire to arrest global warming. In fact I have my own coal mine and burn the stuff incessantly up here in my private lair in the mountains. The more pollution and global warming I create the more chaos. Heh heh heh.
            I think you should cease your jabbering.
            jabber: talk incessantly and trivially

            “Never sought the life of intellectual crime myself.”
            However, as Shakespeare once said:
            “Some are born intellectual criminals, some achieve that status, and aren’t even aware that they are plain dumb.”

          • Massimo PORZIO says:

            Hi DrNo,

            Unfortunately, satellite data conflicts..
            Unfortunately, satellite data do not represent global average surface temperatures only tropospheric temperatures.

            I already posted the below, but I would like to know your opinion about this:

            http://climategate.nl/wp-content/uploads/2013/07/04-Rosema.pdf

            In particular about the following excerpt:

            10. CONCLUSION
            The amazing finding of the present study is that we do not observe global warming in the period 1982-2006, but significant cooling. What could be the cause? The satellite data are from a reliable origin supported by the European meteorological community. Their accurate calibration has received due attention and efforts from Eumetsat. Our processing of these data has been simple and straight forward, involving only noon and midnight image composition, averaging and a filter to eliminate cloud effects. We have created similar planetary temperature change images for the unfiltered, 10, 20 and 30 day filtered data, clearly showing convergence towards the longer filters, indicating that cloud influences were effectively removed.
            Moreover, we do observe significant temperature increase at some locations which are due to human interventions, and which are quantitatively in line with the theoretically expected effects of these interventions. Therefore we believe the observed planetary temperature decrease for most of the hemisphere to be real.
            The cloud filtered temperature change patterns, in figure 2c, indicate that the largest decrease occurs in the more cloudy regions of the hemisphere: the tropics and the temperate zones, while in the desert belt the temperature decrease is much smaller.
            This suggests that cloudiness changes could be the mechanism behind the observed global cooling since 1982: an increase in cloudiness would decrease global radiation and increase rainfall and evapotranspiration. Both effects tend to decrease the surface
            temperature.

            If I’ve not misunderstood it, those measurements come directly from the ground and they seem to contradict any global warming.
            By the point of view of a an electronic engineer (who I am), they seem to have done a good work, don’t you?
            If not, why do they fail in your opinion?

            Have a great day.

            Massimo

          • Dr No says:

            Hi Massimo,

            “If Ive not misunderstood it, those measurements come directly from the ground and they seem to contradict any global warming.”

            I am not sure why you are referring to satellite measurements as coming directly from the ground.
            In any case, you need to know if the trend is real or due to changes in the instruments or their positions over time.
            As to an apparent decrease in the measurements implying cooling, you need to specify which atmospheric levels the data represents. Greenhouse warming goes hand in hand with stratospheric cooling.

            “This suggests that cloudiness changes could be the mechanism behind the observed global cooling since 1982: an increase in cloudiness would decrease global radiation and increase rainfall..”
            Sounds like a dubious conclusion to me. There are insufficient direct cloud observations to confirm this and I haven’t heard of any reports of increased global average rainfall.
            All the direct SURFACE observations indicate surface warming over the long term – especially up to the present (as opposed to 2006).

            I hope this is useful.

          • Massimo PORZIO says:

            Hi DrNo.
            First of all thank you for reply.

            “I am not sure why you are referring to satellite measurements as coming directly from the ground.”

            My assertion about the origin of the radiation measured in that report come from the WL used by those detectors which are tailored in bands where water vapor and other GHGs dont absorb.

            In any case, you need to know if the trend is real or due to changes in the instruments or their positions over time.

            What make me think that its a real trend, it is the fact that the authors stated that data come from Meteosat satellites which are known to be geostationary and every times the new satellite substituted the previous, it seems that Eumetsat correlated the measurements of the twos working together to zeroing the offsets before turning off the older satellites.
            Supporting that, the authors highlight that they observe significant temperature increase at some locations which are due to human interventions, and which are quantitatively in line with the theoretically expected effects of these interventions. Therefore we believe the observed planetary temperature decrease for most of the hemisphere to be real.
            So IMHO, this should give a certain reliability to the measurements.

            All the direct SURFACE observations indicate surface warming over the long term especially up to the present (as opposed to 2006).

            Sorry to dont agree with you but being an engineer, I really have great problems considering reliable those ground measurements homogenized as I read they are.
            One of the big problems to me is that I read somewhere that including the UHI effect the trend goes down but including all the other human induced effects (such as irrigation) the trend goes up again. This for me just means that the measurements are not meaningful compared to the arbitrary computed corrections.
            Don’t you?

            Have a great day.

            Massimo

          • JohnKl says:

            Hi Dr. No,

            You state:

            Some are born intellectual criminals, some achieve that status, and arent even aware that they are plain dumb.

            Did it take hours of therapy for you to arrive at this potential moment of self-actualization? Of course, the actual quote from the Twelfth Night reads:

            “Some are born great, some achieve greatness, and some have greatness thrust upon ’em.”

            In your case, perhaps you possibly meant to state:

            “Some are born intellectual criminals, some achieve that status, and some are aware they are just plain dumb, but refuse to admit it anyways.”

            Of course, being in denial seems to be just part of the moniker after all your name is DR. NO!

            Have a great day!

          • Dr No says:

            Hi Massimo,

            “One of the big problems to me is that I read somewhere that including the UHI effect the trend goes down but including all the other human induced effects (such as irrigation) the trend goes up again. This for me just means that the measurements are not meaningful compared to the arbitrary computed corrections.”

            I suggest you look up Richard A. Muller and the work he did (the Berkeley Earth Surface Temperature study) as a skeptic attempting to find faults with the surface temperature record. To cut a long story short, he found no such faults and converted to a warmist. This caused great angst amongst the denialists such as Anthony Watts who were convinced he would vindicate their claims of bias, forgery, etc etc.

          • JohnKl says:

            Hi Massimo PORZIO and Dr. No,

            Thank you for the link Massimo PORZIO. Section 8 in particular interested me. Not to re-write the entire statement but this datum seemed very curious:

            “8. OBSERVATIONS
            In general, the Atlantic Ocean, Africa and Europe show a negative temperature trend, varying between zero and -2 K/decade. Remarkable, is a large area in southern Africa, mainly Zimbabwe and Mozambique, where the temperature decrease is even larger and in the range of -2 to -3 K. Also note the temperature decrease of Lake Chad and Lake Nasser, probably due to an increase in their surface areas. There are also some spots that show a substantial temperature increase, in particular in SE Iraq (figure 3a) and NW Tanzania (figure 3b).”

            You may wish to read the entire section again, Mozambique in particular is known for fairly high humidity yet shows strong cooling. Mozambique for example:

            Average Weather and Climate in Mozambique

            “The Mozambique coastline stretches for almost 2,000 km and it has a tropical ocean current running north to south along its length for the whole year. Mozambique has a warm, tropical climate. The average temperature is around 28 degrees Celsius (82 Fahrenheit), and the weather along the coast is sunny and warm even in midwinter. Summer, from October to April, is rainy, humid, and very hot. June to October is the dry and cooler season. With often perfect tropical weather this provides the most comfortable period for travel: clear skies, plenty of sun and almost no rain.”

            Zimbabwe on the other hand has significant arid regions:

            “Of the land area, 56.2% has a semi-arid/ steppe climate (BS), 43.8% has a temperate/ mesothermal climate with dry winters (Cw).
            Of the population, 39.5% live in a semi-arid/ steppe climate (BS), 60.5% live in a temperate/ mesothermal climate with dry winters (Cw).”

            Keep in mind the Southern hemisphere has a sea to land ration of 4/1 as opposed to the Northern hemisphere which has sea to land ration of 1.5/1. Hence GHG concentrations especially of water vapor will likely show much higher than the Northern Hemisphere. Water vapor is a green-house gas. Why would such a strong cooling be observed? An increase in cloudiness sure seems likely? Of course, a cool atmosphere can only slow the rate of the relatively warmer surface cooling not WARM it. Dr. No may still be in denial.

            Have a great day!

          • JohnKl says:

            Correction, my statement should have read:

            “An increase in cloudiness sure seems likely.”

            Have a great day!

          • Dr No says:

            Hi JohnKL,

            “Did it take hours of therapy for you to arrive at this potential moment of self-actualization? Of course, the actual quote from the Twelfth Night reads:
            Some are born great, some achieve greatness, and some have greatness thrust upon em.”

            I think you are confusing William Shakespeare with Norman Shakespeare.

            “In your case, perhaps you possibly meant to state:
            Some are born intellectual criminals, some achieve that status, and some are aware they are just plain dumb, but refuse to admit it anyways.”

            I like your version better. Thanks.

          • AndyG55 says:

            There is only ONE evenly spaced, untainted, pristine surface temperature data set in the world, USCRN.

            So lets compare the trends of UAH over the USA with the trend in USCRN. This is a reasonably large sample area so if the trends are similar, it will totally validate the temperature data extraction used by UAH.

            So. since 2005, USCRN has a trend of +0.0035F/year

            And over the same period, UAH gives +0.002C/year

            which converts to… wait for it….. +0.0038Fyear

            Damn that’s close. !!

            Well done UAH.. your temperature data extraction is

            VALIDATED AGAINST ACTUAL REAL MEASUREMENTS. !

            And since, you use the same algorithms for the whole world, the ONLY logical assumption is that UAH is probably the most accurate of all the global temperature data sets.

          • AndyG55 says:

            ps.. Perhaps someone with RSS data over just the USA could run a similar trend comparison to USCRN. I suspect that the result will be slight negative trend.

            It is interesting to note that ClimDiv (USA) has a slight negative trend over this period of -0.0019Fyear.

          • AndyG55 says:

            “I suggest you look up Richard A. Muller and the work he did (the Berkeley Earth Surface Temperature study) as a skeptic attempting to find faults with the surface temperature record. To cut a long story short, he found no such faults and converted to a warmist.”

            ROFLMAO..

            Muller was NEVER a skeptic.. he was a CON-MAN and Anthony fell for it.

            Muller’s work proved nothing about UHI effects, because the work was extremely sloppy and badly implemented.

          • Massimo PORZIO says:

            Hi Dr.No,
            again, thank you for your kindly reply.

            “I suggest you look up Richard A. Muller and the work he did (the Berkeley Earth Surface Temperature study) as a skeptic attempting to find faults with the surface temperature record. To cut a long story short, he found no such faults and converted to a warmist. This caused great angst amongst the denialists such as Anthony Watts who were convinced he would vindicate their claims of bias, forgery, etc etc.”

            I don’t know why I should look at that work to have any answer for my basic question which was implicit and it is: how could be reliable a collection of temperature measurements (for determining a trend), when applying some (computed) corrections the trend can change direction more times?
            It’s evident to me that the influence of the measurements on the final result is null.

            Anyway, I don’t believe Richard A. Muller was the “best” entitled to work on his 2010 B.E.S.T. project, because since 2008 his daughter was “earning money as a consultant telling governments how to implement green policies, how to reduce their carbon footprint and how to pick –the right technologies– presumably meaning the right Green technologies.”

            http://joannenova.com.au/2012/08/elizabeth-muller-director-of-best-ran-a-green-government-consultancy/

            Let me have some doubts about that work. If I was him I would refute the work, just for a question of conflict of interest.

            There are so much problem in the ground measurements that sincerely I don’t really know what’s the sign of the current temperature trend indeed (even if I believe it should be a little positive, but it’s just a believing).

            Now is late at night here i Italy I go to sleep,
            have a great day.

            Massimo

          • MarkB says:

            AndyG55:
            So. since 2005, USCRN has a trend of +0.0035F/year

            And over the same period, UAH gives +0.002C/year

            which converts to wait for it.. +0.0038Fyear
            Not that a trend over a short period means much, but UAH has a “USA 49” result which would map to USCRN coverage. The UAH USA 49 trend since 2005 inclusive is -0.024 C/decade or -0.044 F/decade.

          • Dr No says:

            Hi Massimo,

            You are entitled to your doubts.

            Buona Notte

          • Dr No says:

            Hi AndyG55,

            I see from your responses that you are one of the denialists still suffering angst about the BEST study. Classic symptoms – and I should know being a Dr. However, there is nothing I can do for you.

          • AndyG55 says:

            Poor Dr No.. Gullibility seems a strong suit with you.

            A quick check on Muller’s talks etc from just before he conned the surface station data from AW shows he was, and always has been, a rabid warmista, just like the rest of his team.. especially his daughter.

            DENY that truth all you want.

            Your meaningless, mindless rhetoric can only lead to the assumption..

            .. that being that you need a psychiatrist.. or Doctor, heal thyself , first.

          • AndyG55 says:

            No Mark B,

            Over the same period as USCRN, UAH USA49 has a trend of +0.0133C/year,

            Slightly more than USCRN.

          • JohnKl says:

            Hi Dr. No ( or possibly Norman as in Norm, as in far too normal to be a mad scientist ),

            You state:

            “I think you are confusing William Shakespeare with Norman Shakespeare.”

            NORMAN SHAKESPEARE! That’s hilarious. So Norman, if that’s you, I had a feeling you were Dr. No. You wanted me to reply to him, seemed entranced by Ursula’s bikini wear and it just fits your silent rebellious side!

            In your case however, Norman Rockwell might be a better fate. If you need to learn how to paint let me know. Whatever you do don’t become Norm from Cheers! Wouldn’t want to see you stuck to a bar-stool.

            Have a great day!

          • JohnKl says:

            Hi Dr. No,

            Of course, you could have meant this Norman Shakespeare:

            http://www.prweb.com/releases/The-Congo-Affair/Norman-Shakespeare/prweb12574534.htm

            Unfortunately, he’s not the kind of author to likely make the quote you posted! Please provide the source.

            Have a great day!

          • Dr No says:

            Hi JohnKl,

            You hit the nail on the head.
            Norman Shakespeare’s ‘The Congo Affair’ combines an armchair safari packed with magnificent wildlife, historical Africa and tenuous yet powerful human attractions.

            The quote is on page 145. Just after the steamy scene involving the evil doctor and the swedish nurse.

          • JohnKl says:

            Hi Dr. No,

            Ok! I’m really cheap! What chapter does the scene take place in? I may have located an internet version of Norman Shakespeare’s book.

            Have a great day!

          • Dr No says:

            Hi JohnKl,

            “What chapter does the scene take place in? I may have located an internet version of Norman Shakespeares book.”

            Hardback or paperback version?

      • Werner Brozek says:

        Of course, its all speculation.

        This time, that is what happened. Namely both times stayed the same, just shifted by a month at both ends.

      • JohnKl says:

        Hi Dr. No,

        You ask:

        “Hardback or paperback version?”

        Thank you for apparently wanting to help, but Chapter and verse are determined by the Author not the publisher. Iow, it should be the same for all versions.

        Have a great day!

    • Richard Barraclough says:

      Hello Werner,

      The “Pause”, as defined by various commenters on this site and Watts up with That, is still the same length as last month. In other words, the start date has moved forward by 1 month to June 1997

      The adjustments made in Version Beta4 are too small to have had any effect, when compared with Beta3.

      Sadly, the much heralded “Pause” is on its last legs if the anomalies remain at this level. There are now only 9 months (out of 440 or so)where one can start the Pause – namely from June 1997 to February 1998.In April this year there were 50 possible starting places.

      Next month there will be only 7, in January only 5, and finally February 2016 has the two remaining start-months intact, with December 1997 being the most resilient. The Pause in the UAH dataset will be gone by March – unless, of course, there is some unexpected cooling!

      • Werner Brozek says:

        Thank you!

        As for namely from June 1997 to February 1998, I do not agree with that. If November 1997 has no pause, then the next 3 months won’t either since the anomalies for December 1997 and January and February 1998 are above the zero line of about 0.13.

      • mpainter says:

        Note step-up at circa 2000-2002. This step-up connects two flat trends, separated by about .25-.3C difference. There is your warming for the past 35 years. Is that what CO2 does?
        Answer: nope

        Then what’s all of this jazz about a warming trend?
        Answer: its called climate science.

        Then why doesn’t someone explain that stepup?
        Answer: climate scientists don’t do things like that

        Why not? It’s there, right? It’s a temperature rise at the rate of 8-10C/century, right?
        Answer: yeah, but it hasn’t been peer-reviewed, so it’s not really there. Sorry.

      • fonzarelli says:

        “…unless, of course, there is some unexpected cooling!”

        The la nina that follows should bring it right back…

  10. Nigel Harris says:

    I mentioned this last month, sorry to repeat myself. But the running, centered 13-month moving average has not been updated for several months now.

  11. dave says:

    “…average…”

    It is centred at May 2015 and stands at + 0.27 C

    • JohnD says:

      “It is centred at May 2015 and stands at + 0.27 C”

      …which is not currently plotted AFAICS. The last average point showing is about +0.20C and plotted at Nov/Dec 2014 – difficult to see exact value/month on the image.

  12. barry says:

    Dr Spencer, if a spike in temperatures does not appear by, say, March, would you consider that there is a problem with the processing of the UAH data set?

    • mpainter says:

      Barry, if a spike in temperatures does not appear by, say, March, would you consider that there was no spike in temperature?

    • Alan says:

      Are you suggesting that Dr. Spencer should take a page from the NOAA playbook and make the past colder?

    • barry says:

      My question is based on the current el Nino, which everyone here seems to be aware of, and which Dr Spencer appears to have implied may soon burgeon in the MSU data set in his top post.

      The last time we saw an el Nino of such strength, the UAH record spiked (1997/98). This effect is already present in the surface data sets, and the satellite data usually lags by some months. If 1997/98 is anything to go by, we should see a spike perhaps as early as next month (which is how it panned out late 1997, when el Nino started a month later in the calendar year than current).

      The tropics are already showing high temps in the UAH data set. As a strong el Nino has a fairly obvious signal, I put my question to Dr Spencer based on what seems a pretty reasonable anticipation of that signal appearing in the MSU record in the past, and presumably shortly.

      If a model is tested on its predictive ability, I would expect to see it verified by a surge in TLT in short order. I was curious to know if Dr Spencer anticipated similarly.

      If not, why not?

      • mpainter says:

        You seem to be anticipatimg data that you intend to ignore. Thank you for this demonstration of AGW science works.

      • bit chilly says:

        the 1998 spike occurred as a result of the strength of that el nino. this el nino is not as strong. manipulated data says it is . the anchovies,surface temps in certain areas and weather patterns in others prove it is not.
        it looks to me as though the peak has already passed.

        • barry says:

          Seems to me from these indices that the 97/98 el Nino peaked around December 1997.

          http://www.cpc.ncep.noaa.gov/products/analysis_monitoring/ensostuff/ensoyears.shtml

          Peak temps in the UAH data set occurred in April 1998, about 4 months later.

          http://vortex.nsstc.uah.edu/data/msu/v6.0beta/tlt/tltglhmam_6.0beta4.txt

          The timing was similar in the 1987/88 el Nino, which peaked around August in the ENSO indices, and was followed by peak temps 3 months later in November in the UAH data set (see above links). That el Nino was slightly weaker than the current one.

          “Barry, if a spike in temperatures does not appear by, say, March, would you consider that there was no spike in temperature?”

          If UAH (and/or RSS) show no sign of the current el Nino by March, I would say that puts the question mark over the MSU processing for TLT than all the indices corroborating that a fairly strong el Nino is in progress. SOI, wind patterns, SSTs etc all demonstrate that an el Nino is underway, and may have peaked, or will have by the end of the year. Based on previous lag to el Nino, I would expect to see next month beginning a rise to a peak sometime in the next 3-5 months in TLT.

          (If there is a conspiracy amongst all the institutes globally that monitor ENSO patterns, they’re doing a pretty poor job of it – why aren’t they cooking the indices to make for a more powerful el Nino than 97/98?. No, I think the conspiracy theorizing is pablum. I am referring partly to Dr Spencer’s comments in the OP that we should see “peak El Nino warmth in the next few months.”)

        • barry says:

          We see the same pattern in the 2009/10 el Nino, when peak in the ENSO indices occurred around Dec/Jan, but peaked in the TLT global record in March 2010. That el Nino was weaker than the current one.

          Looking back through the record, basing observation on the peaks in the TLT record, the pattern is consistent – a 3 to 4 month lag in TLT data to peak el Nino. I see no reason not to expect the same in the next few months in the TLT data. Dr Spencer seems to have an interest,

          The tropics continue warm due to El Nino conditions, but the temperature in recent months seems to have plateaued despite the climatological expectation of increasing temperature as we approach peak El Nino warmth in the next few months. This plateau, of course, could end at any time.

          so I wondered if he might have some thoughts on what would occur in the next few months – whether or not he anticipates a spike in global TLT, as with previous el Ninos.

          • mpainter says:

            The climate confab in Paris will settle the issue of a spike, and then they will pronounce its decision. Be patient.

          • barry says:

            Cynicism is not what I was looking for. I guess it’s the best I’ll get.

          • mpainter says:

            You are too obvious. RSS and UAH agree very well and are confirmed by radiosonde data.
            You imagine to make a case by ignoring these facts. It is impossible to take you seriously.

          • ehak says:

            mpainter:

            Please show us how radiosondes confirm RSS TLT and UAH v6.0betasomething TMLT. Guess you never will. Here is why:

            http://i.imgur.com/cQk4Crl.png

            http://i.imgur.com/mLcLK8F.png

            UAH TLT v 5.6 is closer:

            http://i.imgur.com/kmOe7wy.png

          • mpainter says:

            No thanks, I don’t care to respond to any anonymous blogger who cuts and pastes data unattributed and unverified.

            Take it to RealClimate. There they should applaud it and proclaim you a RealScientist. But it does not meet the grade here.

          • ehak says:

            The anonymous blogger mpainter will not answer an anonymous blogger.

            In mpainter’s unknown universe he don’t even know the origin of tropospheric temperature indices.

        • David Appell says:

          This El Nino is actually just a bit bigger than the 1997-98 El Nino, if you go by the Nino3.4 index.

          http://www.cpc.ncep.noaa.gov/data/indices/wksst8110.for

  13. Walter Dnes says:

    The URL for the 3-digit data download seems to have changed. It’s still only up to October, but the new URL is…

    http://vortex.nsstc.uah.edu/data/msu/v6.0beta/tlt/tltglhmam_6.0beta4.txt

    Without the http : //

    vortex.nsstc.uah.edu/data/msu/v6.0beta/tlt/tltglhmam_6.0beta4.txt

    The change is that “beta3” is now “beta4”

  14. Walter Dnes says:

    Dr. Spencer… puhleeeease… revert your website to its previous version. I am running on a desktop PC, with a keyboard and mouse, and a 1920×1080 pixel 24 inch monitor. But the website, by default, *INSISTS* on dumping me into the “mobile mode”. The developers at Mozilla have gone off the deep end, and there have been various forks of Firefox launched that many users have fled to, including me. It seems that if the website doesn’t recognize the browser’s name, it defaults to “mobile mode”. It took me a lot of dicking around to figure out that I had to accept a cookie from the website to stay in desktop mode. That has solved the problem for now, but it was very frustrating for several days.

    “Mobile mode” may have made sense years ago with 320×240 pixel smartphone displays. But nowadays, smartphones have much higher resolution, and can pinch-to-zoom. “Mobile sites” are a laughing stock, and an outright annoyance to many users. See http://chainsawsuit.com/comic/2013/01/23/view-the-desktop-version-of-this-site/ and http://www.xkcd.com/869/

    And if you really, really need a mobile version, *THE RIGHT WAY* to do it is to serve it up under the subdomain http://m.drroyspencer.com

    • fonzarelli says:

      Walter, i actually have an iphone that i always use at this site and have always used the desktop version. I also find the automatic switches to mobil quite annoying. The comments are listed in chronological order, so i have no idea of who is answering who. (as well, i can only post a “new” comment when i find myself stuck in that mode) How did you fix it?

  15. Aaron S says:

    If you use 97 98 El Nino as an analogy the temp didnt start to really climb until jan and peak in april. This El Nino seems to be weakening relative to that one but the impact is still uncertain.

    • barry says:

      The spike began December 1997, and continued to climb even as the 97/98 el Nino weakened. There is a fairly well-known lag to ENSO events in the MSU record. It is showing in all ENSO indices, as well as the global surface records. If it doesn’t appear in the MSU record in the next few months, that would be a question mark over MSU processing to my mind. As I remarked just above, I’m curious to know if Dr Spencer has any thoughts about this heading into the next few months.

      • bit chilly says:

        no, it would be questioning the alarmist claims regarding a super duper el nino.

        • barry says:

          Maybe that’s what interests you. I’m interested in neither downplaying not elevating the el Nino, just what Dr Spencer thinks. Looks like he’s not interested in committing any thoughts on it.

  16. richard verney says:

    What is material with this current Strong El Nino is not whether it produces a blip anomaly peak at around the same level as was seen in 1998, but rather whether there is a long lasting step change in temperature coincident with it, just as there has been a long lasting step change in temperatures (of about 0.26degC) coincident with the 1997/98 Super El Nino.

    If there is no long lasting step change, then we can expect to see a following La Nina bringing down the temperature anomaly, and if following that La Nina, the long lasting temperature anomaly settles around the 2001 to 2003 level, the pause will grow as 2019 approaches and AR6 is being written.

    In this scenario (which is only an IF), the pause will by then be more than 21 years in duration and the divergence between observation and model projections will be even more embarrassing since all the models will by then be well outside their 95% confidence bounds.

    Further, in this scenario, we can expect to see several papers published in late 2017, 2018 suggesting ever lower figures for Climate sensitivity (as the pause lengthens, Climate sensitivity must fall).

    Problem times await the IPCC if there is no long lasting step change in temperature coincident with the current Strong El Nino.

    Obviously, it is premature to judge what the future may bring, but I am looking forward to the next 18 months.

    • Aaron S says:

      Agreed. It is exciting times. Unfortunately, to the public actually breaking the 97 98 record could be significant…but i agree really it is not. Whereas if this el nino does not break the record then the thorn remains in their side that 98 was the hottest temp recorded. A big La Nino and shift back to negative PDO conditions would be interesting indeed!

      • mpainter says:

        The public sees the whole issue through the hype of the media. They do not have the understanding to really evaluate the issues. The propaganda efforts of the alarmists have been successful, although not so much so in the US.

        Judith Curry has opined that the warming is over for at least fifteen years and that cooling may actually occur. In other words, natural variability as always.

        She always says things that make the alarmists howl in rage.

        • David Appell says:

          Unless Judith Curry publishes her claims in the peer reviewed literature, no scientist is going to care what she says.

          She almost never does.

          • mpainter says:

            Well, you should say then,

            “I don’t give a hoot for anyone’s opinion that does not carry the authenticity of peer review”

            Then I can respond:
            “Except your own,right? Like on QuackSoup, right? Or here on this blog, right?”

            That’s the one thing that I admire in you, David: it doesn’t bother you a bit when you make yourself look ridiculous. Water…er, soup off a duck’s back.

          • JohnKl says:

            Hi mpainter,

            You mentioned “QuackSoup” (apparently a reference to David’s Quark Soup website) and “duck’s back.” The two combine to make “Duck Soup” a very funny Marx Brother’s movie indeed and very possibly the creative inspiration for today’s intellectually unsound political movements including “climate change” paranoia and government control of hydrocarbons.

            Have a great day!

          • David Appell says:

            I don’t publish my science on my blog — I cover the science others do.

            But I do include basic calculations from well known sources that anyone should be able to do for themselves. (Although sadly that doesn’t include you, painter.)

          • AndyG55 says:

            “I dont publish my science on my blog”

            roflmao..

            You don’t publish any science anywhere. !!

      • Zipperish says:

        I don’t see why a shift to a negative phase PDO and La Nina event would be interesting. Those are, as far as we know, naturally recurring phenomena. The interesting aspect is to discover the fingerprint, or lack thereof, of rising CO2 concentrations, not to cheer during La Ninas and scowl during El Ninos, or vice versa.

        • mpainter says:

          What will be of interest is the howls and shrieks of the global warmers, as when the leopard snatches a member of the troop.

          • barry says:

            Why the fixation on ‘alarmists?’ I hoped for a straightforward answer to my question on the le Nino/TLT. Dunno why that can’t be managed.

          • mpainter says:

            It is not fixation. It is profound disgust. Strange that you should protest at the point where the leopard grabs a baboon. What’s your name?

        • David Appell says:

          Actually the PDO has flipped to its positive phase.

          What’s interesting is how this will affect global tempertures, and whether the negative PDO phase was holding temperatures down.

    • gbaikie says:

      — richard verney says:
      December 1, 2015 at 8:01 PM

      What is material with this current Strong El Nino is not whether it produces a blip anomaly peak at around the same level as was seen in 1998, but rather whether there is a long lasting step change in temperature coincident with it, just as there has been a long lasting step change in temperatures (of about 0.26degC) coincident with the 1997/98 Super El Nino. —

      I see no evidence of repeat of a 1997/98 Super El Nino and don’t think it will match the recorded height in temperature.
      But if matched 1997/98 Super El Nino temperature, because of the step change it has higher than Super El Nino to match it.

      –If there is no long lasting step change, then we can expect to see a following La Nina bringing down the temperature anomaly, and if following that La Nina, the long lasting temperature anomaly settles around the 2001 to 2003 level, the pause will grow as 2019 approaches and AR6 is being written. —

      I tend to give this about 50% chance. And less than 50% chance of something “unexpected” occurring- as example a long lasting step down that wipes out the 1997/98 Super El Nino step up and we get a pause at a lower level.

  17. Lance Wallace says:

    Dr. Spencer–

    When I compare beta 4 to beta 3 I see a maximum difference of 0.01 degree. Is it true that the change made so little difference or is there a problem with the database?

    Related to that, I had been delighted to see that beta 2 brought UAH and RSS into beautiful agreement. However, beta 3 changed this to moderate disagreement, particularly for the last decade or so. Now beta 4 seems to lock in the beta 3 results with only trivial changes.

  18. Thanks, Dr. Spencer.
    I have updated your graph in Observatorio ARVAL climate and meteorology pages.
    I’m guessing this -0,1 deg. C cooling will not make the conventional media headlines tomorrow.

  19. Chuck L says:

    I wonder if RSS will show a similar drop. Even if it does, I’m sure that GISS and NOAA will show November as the “warmest evah” and the media and press will proclaim it loudly for all to hear.

  20. TheFinalNail says:

    Dr Spencer,

    Unless I am mistaken, then, like October, I believe this November anomaly value of 0.33 C sets a new monthly record for November in UAH.

    Given that November seems to be the month with the smallest range between max and min in the UAH record, it may be premature to state that lower troposphere temperatures have levelled off just yet.

    TFN

    • mpainter says:

      See at the top of the post for UAH global temperature anomaly trend for this century. Study it carefully. This is known as data.

      • ehak says:

        Does mpainter suggest that there is something wrong with the data shown?

        Tell the US Congress that. The UAH crew has presented those data in hearings.

      • TheFinalNail says:

        mpainter

        Alas, it’s hard to identify trends in the chart at the top of the post since none are provided.

        But let’s say there is a flat trend since 2001: does this mean that October and November 2015 somehow weren’t the warmest such months in the UAH beta4 record?

        TFN

        • mpainter says:

          Provide your own trends by “eyeballing” the chart. If you can’t do that, others can. There is no trend this century. Pretending will not get you one.

          • TheFinalNail says:

            The trend in UAH – beta4 is indeed (almost) flat since Jan 2001. Just 0.01C/dec warming.

            This doesn’t alter the fact that both October and November 2015 have set new respective warmest monthly records in UAH 6 beta4.

            If we use just the past 5 years of UAH data, then it’s hard to overlook the warming trend, which currently stands at 0.58C/dec.

            Such are vagaries of reading stuff into data series shorter than 2 or more decades duration.

            TFN

          • mpainter says:

            Okay, I’ll play your game. Try March, 1983-Feb., 2012. That will give you a cooling trend of -.125/decade. Happier?
            No? How about this century? Squirm and wriggle and tickle the data, the trend for this century shows no warming.

          • David Appell says:

            Cherry pick. And not even a smart one.

          • mpainter says:

            On the contrary, it was a brilliant cherry-pick. I daresay you cannot match the level of cherry-picking that I achieve.

          • David Appell says:

            Nor do I have a desire to, since cherry picks aren’t chosen for their climatological signifiance.

  21. ehak says:

    A new month. A new beta.

    A new monthly record high.

    A new month and Spencer just happens to avoid mentioning that it is a record high.

    • mpainter says:

      Looks like ENSO can’t decide what to do, whether to plateau or to fizzle. SST’s in the Eastern tropical Pacific don’t show much promise for an alarmist whoop-it-up.
      Ma Nature fools them again. Something tells me she will be flipping the PDO switch before too long. Cool.

      Then, to add to that, the agreement now is that COP21 is non-binding. In short, a total sham and laughable farce, tsk, tsk.

      Looks like a raft of heartache is heading toward the poor global warmers.Handwringing could reach record levels and we might see a surge in the number of suicides. How sad.

      • ehak says:

        So we have November record in a nino fizzler.

        Really something for those who don’t understand numbers.

      • ehak says:

        This nino is a fizzler. And we get record highs. That means the next nina will not help you mpainter.

        • mpainter says:

          So you come here to talk away the “pause”. Fat chance, wrong blog. Try sks or hothormones, there they will pat your back and tell you that you are one of them.

          • ehak says:

            Which pause mpainter? The one from 1979 to 1998 perhaps?

          • mpainter says:

            Talk away whichever pause you fancy.

          • ehak says:

            So why do you talk away earlier pauses mpainter? Why deny them?

          • mpainter says:

            In fact, there is no warming trend. There is instead a step-up at circa 2000-2002 that is the juncture of two flat trends. This can be seen by studying the UAH chart at the head of this post. This step-up is about .25-.3C and represents the difference between the two flat trends.

            Hence, any trend line purporting to show a rising temperature trend for the past 35 years is spurious, as a step-up is not a trend.

            This observation puts another nail in the coffin of the collapsed AGW hypothesis for the reason that the step-up cannot be explained by AGW.

            AGW RIP. I commiserate with the bereaved.

          • David Appell says:

            “There is instead a step-up at circa 2000-2002 that is the juncture of two flat trends. This can be seen by studying the UAH chart at the head of this post. This step-up is about .25-.3C and represents the difference between the two flat trends.”

            {giggle}

            http://www.skepticalscience.com/graphics.php?g=47

        • SkepticGoneWild says:

          Who cares about a measly 18 year pause? How about this 45 year cooling trend while CO2 increased?:

          http://woodfortrees.org/plot/hadcrut4gl/from:1937/to:1982/mean:12/plot/hadcrut4gl/from:1937/to:1982/trend

          • David Appell says:

            Stop trusting Wood For Trees — it is NOT RELIABLE.

            According to the latest HadCRUT4, the trend since 1935 is +0.08 C/decade.

          • David Appell says:

            I just noticed that your graph ends in 1982.

            You’re guilty of deception.

          • SkepticGoneWild says:

            LMAO. You are guilty of stupidity. Go to SkS and you get the same trend:

            Trend: -0.007 0.032 C/decade (2σ) 1937 to 1982 HadCRUT4

            OMG wake up. The data is what it is. I never said it was to present time. You are confused is all. During this time CO2 concentrations rapidly increased. Deal with it.

          • mpainter says:

            SGW, meet David Appell. The real David Appell.

          • David Appell says:

            What good is a trend up to 1982? We’re now in 2015…. You’re still guilty of deception.

          • SkepticGoneWild says:

            I am simply pointing out a long cooling period of the past. It is NOT deception. Quit being so obtuse.

          • David Appell says:

            It is deception, especially for that period, because CO2 is not the only factor that influences climate.

            For example, SO2…..

            “Historical Sulfur Dioxide Emissions 1850-2000: Methods and Results”
            PNNL 2004
            http://www.scscertified.com/lcs/docs/SO2%20Emissions.pdf

            See Figure 1 (p. 10), which shows global SO2 emissions ramping up strongly after WW2 and peaking around 1980.

          • SkepticGoneWild says:

            David,

            Did you READ the study. They did not actually MEASURE SO2 during the period in question. Now YOU are being deceptive.

            Furthermore, the IPCC indicates that any aerosol effect is completely overwhelmed by CO2 and other anthropogenic forcings. [IPCC AR5 Technical Summary, p 54.

            This is what the Technical Summary states:

            “substantial uncertainties remain in assessments of long-term trends of global aerosol optical depth and other global properties of aerosols due to difficulties in measurement and lack of observations of some relevant parameters, high spatial and temporal variability and the relatively short observational records that exist” [TS.3.3]

            And from Hansen et al 2011:

            “First, although climate forcing by human-made greenhouse
            gases (GHGs) is known accurately, climate forcing
            caused by changing human-made aerosols is practically unmeasured…….It is remarkable and untenable
            that the second largest forcing that drives global climate
            change remains unmeasured. We refer to the direct and indirect
            effects of human-made aerosols”

            Back to the drawing board for you, David.

          • David Appell says:

            Nobody measures atmospheric aerosols. So modeling is all that is available.

            Hansen tried for years to get a satellite instrument up to measure aerosols. He never succeeded.

  22. ehak says:

    For those who claim the MSU/AMSU records are the most reliable (including Lamar Lysenko), take a look at the difference between November temperature from UAH v5.6 TLT and UAH v6.0beta4 TMLT:

    http://i.imgur.com/vObGv3n.png

    Phew. Just imagine surface records come up with something like that.

    • mpainter says:

      There can be no question that satellite temperature data has the most integrity. There is no question that the surface data sets are undergoing continual adjustment/alteration to achieve the data trends that best support the cAGW meme.

      • ehak says:

        According to mpainter this is a sign of integrity. And that the satellite data is not undergoing continuing alteration:

        https://i.imgur.com/vObGv3n.png

        The integrity grows as a function of the size of the change. Bigger change means more integrity.

        • mpainter says:

          Judy Curry gives her reasons why we can expect no warming before 2030, or later, and that we perhaps could experience cooling. Has to do mostly with climate sensitivity, which up-to-date studies put at 1.6-1.2, with the consensus tending toward the lower end.

          The aerosol uncertainties have been resolved and the fat tails of previous estimates have been docked by better resolution of this issue.

          In shortly, natural variability will continue to determine climate, as climate sensitivity is too slight to matter. This means probably the beginning of a cooling trend before this decade is out.

      • David Appell says:

        Why can’t there be no questions? UAH uses a complicated model to calculate their temperatures — one they won’t share with anyone.

  23. Doug~Cotton says:

    The reason why there’s no “33 degrees of warming” that needs to be done by any GH gas is summarized in this excerpt.

    • Dan Pangburn says:

      DC says “how thermal energy is transferred from cooler to warmer regions,”

      Clausius said in 1850 about the 2nd law “It is impossible for a self-acting machine unaided by external agency to move heat from one body to another at a higher temperature.”

      • D-C says:

        What Clausius said (with limited understanding at the time) amounts to just a corollary of the Second Law which only applies in a horizontal plane where there are obviously no changes in gravitational potential energy which would affect entropy.

        Modern day experiments with centrifugal force demonstrate thermal energy transferring from cooler to warmer regions provided that entropy is increasing, which is possible when themodynamic equilibrium has been disturbed. That is the breakthrough science that I’ve been first in the world to explain. The gravitationally-induced temperature gradient has been well recognized since the days of Loschmidt (19th century) but just how it enables such heat transfers has not been previously explained. Read the linked excerpts (see comment above) or preferably the full paper which explains the mechanism which determines all temperatures in tropospheres, surfaces, crusts, mantles and cores of all planets and satellite moons.

        Because gravity ensures that the surface temperature is what it is, there is no need to “explain” it with incorrect physics pertaining to backradiation. Hansen never studied the correct physics and nor do climatologists with the exception of Dr Hans Jelbring.

        • David Appell says:

          “That is the breakthrough science that Ive been first in the world to explain.”

          Sure. What a shame you’re afraid to submit your work to a peer reviewed journal. I guess the world will never know what a genius you are.

          • geran says:

            Doug has some flaws in his physics. Those flaws have been identified on this blog. I think he plans to publish the corrections in his next book.

            🙂

            Now, about the flaws in your IPCC/CO2/AGW/back-radiation pseudoscience….

          • David Appell says:

            Back-radiation obviously exists — one can measure it. It’s just radiation from the atmosphere.

            Or do you think the atmosphere doesn’t radiate?

          • geran says:

            Davie, “back-radiation” exists, but that does not prove it can heat your basement apartment. Can an ice cube heat your cup of cold coffee?

        • Dan Pangburn says:

          If ‘heat creep’ existed, it would be possible to construct a machine which would produce power without any energy input. Such a concept would be called a perpetual motion machine of the 2nd kind, so named because it violates the 2nd law of thermodynamics.

          • David Appell says:

            Atmospheric warming or stratospheric cooling does not violate the 2nd law of thermodynamics, because the atmosphere is not an adiabatic system.

            Physics 101.

          • Dan Pangburn says:

            David A – You should have paid attention in ‘Physics 101″. Your statement is not relevant.

          • David Appell says:

            Dan: I went far far beyond Physics 101. And nothing about the 2nd Law changed along the way.

            Do you deny what the 2nd law actually says?

          • AndyG55 says:

            “I went far far beyond Physics 101”

            They why are you currently unemployed living in your grandma’s basement ?
            (the only way you could swamp threads the way you do)

            No real job prospects, obviously. !

            tell you what.. why not create you own forum.. see how many people want to listen to your moronic rantings..

            Oh wait.. you did.. EMPTY !!!!!!!

          • Dan Pangburn says:

            David A – I quoted the 2nd law. It is revealing that you apparently did not recognize it.

          • geran says:

            Dan, never quote actual science to Davie. He will never recognize it.

    • David Appell says:

      You still haven’t published this, Doug? What’s the holdup?

      • AndyG55 says:

        neither have you. !

        Just nonsense propaganda BS. !

        Oh. just realised….. you would have a good chance of getting through climate science peer-review. !

      • DJC says:

        Dr Hans Jelbring (with a PhD in climatology) published* about the effect of gravity way back in 2003. Given that you haven’t caught up with reading that, why should I waste any more of my time trying to teach you about entropy and the Second Law? Besides, what I’m spending time on now will make world headlines by 2017 – much more effective than a paper tucked away in no-man’s-land.

        * http://ruby.fgcu.edu/courses/twimberley/EnviroPhilo/FunctionOfMass.pdf

  24. OneNemesis says:

    Well, after almost 20 years of “pause” and the temp records for the last century or so, may be we should stop calling it the “pause” and call it something fancy like “NORMAL” or the “NORM”

    • David Appell says:

      But why isn’t the lower tropospheric “pause” getting longer? It’s been stuck at 18+ years for a long time now….

      • AndyG55 says:

        DOH ! You seriously an ignorant twerp, aren’t you. !!!

        Its the current, seemingly not very effective, El Nino.

        Bet you were hoping for the normal spike so you could crow for a short while?

        OOPS.. nothing yet !!

        Again.. your obvious LACK of statistical understanding displayed for all to see.

  25. Werner Brozek says:

    If I am not mistaken, this is the warmest November on the UAH6.0beta4 record. However it seems as if the El Ninos just miss November. For example, the first 10 months of 1998 all beat 0.33. As well, the first 9 months of 2010 beat or tied 0.33.
    By the way, woodfortrees only uses the old UAH5.6. If you want to verify that the pause for UAH6.0beta4 starts in 1997, you can use:
    http://moyhu.blogspot.com.au/p/temperature-trend-viewer.html

    • TheFinalNail says:

      Werner,

      According to NOAA’s ENSO index, the 1982-83, 1986-87, 1991-92, 1997-98, 2002-03, 2009-10 and now 2015 – (presumably 2016) El Nino’s *all* spanned both October and November periods: http://www.cpc.ncep.noaa.gov/products/analysis_monitoring/ensostuff/ensoyears.shtml

      In fact, the 1982-83 and 1997-98 El Nino events were both of greater intensity over the October-November periods than is the current El Nino, according to that same source.

      Given this, it’s hard to see how this consecutive record warmest October and November in 2015 can be explained by El Nino conditions alone.

      TFN

      • Werner Brozek says:

        Good point! But spanning both October and November periods is different from saying that the all time maximum temperatures are shown in November. I apologize as I should have been clearer in what I meant.

        • TheFinalNail says:

          Thanks for clearing that up Werner.

          The fact remains that UAH just recorded consecutive warmest October and November monthly temperature records during a period affected by El Nino, but not *as* affected by El Nino as prior periods at the same time of year.

          Hence, we can’t use El Nino as the sole explanation for the record warming observed. There must be some other factor at work. Whatever might that be?

          TFN

          • mpainter says:

            Did you know that CO2 has nothing to do with ENSO? It’s true, but all the alarmists pretend that it does. Is that you?

          • Werner Brozek says:

            There must be some other factor at work. Whatever might that be?

            You may wish to check out:
            http://wattsupwiththat.com/reference-pages/research-pages/potential-climatic-variables/

          • David Appell says:

            What’s interesting is that surface temperatures for this El Nino are 0.2-0.25 C warmer than the 1997-98 El Nino.

          • Werner Brozek says:

            Whats interesting is that surface temperatures for this El Nino are 0.2-0.25 C warmer than the 1997-98 El Nino.

            So why are the satellites so different?

          • David Appell says:

            I don’t know. Why?

          • Werner Brozek says:

            I dont know. Why?
            See:
            http://wattsupwiththat.com/2015/10/01/is-there-evidence-of-frantic-researchers-adjusting-unsuitable-data-now-includes-july-data/

            Professor Brown:

            Up until the latest SST correction I was managing to convince myself of the general good faith of the keepers of the major anomalies. This correction, right before the November meeting, right when The Pause was becoming a majorpoliticalembarrassment, was the straw that broke the p-values back. I no longer consider it remotely possible to accept the null hypothesis that the climate record has not been tampered with to increase the warming of the present and cooling of the past and thereby exaggerate warming into adeliberate better fit with the theoryinstead of letting thedata speak for itself and hence be of some use tocheckthe theory.

          • David Appell says:

            Werner: What do you think of the recent UAH changes, where some monthly regions had their temperaure change by up to 1.3 C?

          • Werner Brozek says:

            What do you think of the recent UAH changes, where some monthly regions had their temperature change by up to 1.3 C?

            I cannot comment on specific things, but since RSS and UAH5.6 were far apart, but RSS and UAH6.0beta4 are now much closer, I am led to believe 5.6 had errors that have now been fixed, especially by the fourth beta!

          • David Appell says:

            Werner: I don’t think you have a clue if v6beta* fixed anything. I think you’re just a numerologist who merely feeds numbers into black boxes and communicates them without any understanding of what they mean.

          • AndyG55 says:

            Does UAH V6 fix everything?

            No.. it still has a slight warming bias.

            But its very, very close to the ONLY un-tampered, evenly-spaced temperature data on the whole planet.

          • Werner Brozek says:

            I dont think you have a clue if v6beta* fixed anything.

            At some point, we all come to the limits of what we understand and have to trust others. If you do not trust Dr. Spencer to give the best he has at this point in time, that is your prerogative. And there may well be a beta5!

      • bit chilly says:

        indeed, data manipulation is the explanation. the paris effect if you like.

        • ehak says:

          Do you call this manipulation?

          https://i.imgur.com/vObGv3n.png

          • Toneb says:

            ehak says:
            December 2, 2015 at 2:44 PM
            “Do you call this manipulation?

            https://i.imgur.com/vObGv3n.png

            No, of course not.
            It’s cooled the record, silly!

            It only counts as manipulation if you warm it.

            Never mind that the homegenisaton of buoy vs ship data warms the past to make the warming of record less steep. It’s still warming for f**s sake.

        • bit chilly says:

          nope , just another chart with squiggly lines that is intended to represnt some physical part of the atmosphere. all the data gathering devices are subject to interpretation, some more than others .
          the fortunate thing with the satellite data is there are other methods such as radiosondes than can be used to verify a general trend. as for the out and out accuracy of them all in regard to actual numbers. i remain unconvinced.

          they do all beat the hell out of the various smearing techniques used by noaa, best, etc.

    • David Appell says:

      Maybe WFT is waiting for version 6 to be properly published in a peer reviewed jounal. Maybe we all should.

  26. David Appell says:

    Dr. Spencer: Is it true you won’t share your algorithm or computer code, as some sites have been saying?

    http://rabett.blogspot.com/2015/12/uah-tlt-series-not-trustworthy.html

    • mpainter says:

      Here David shows his indecision in choosing between UAH and RSS, fastidious fellow that he is. He is wondering if the slightly negative trend of RSS might not be a truer indication, as compared to the flat UAH trend. Well, no hurry. The pause is expected to end before long…when the PDO changes and it starts cooling.

      • Werner Brozek says:

        The pause is expected to end before longwhen the PDO changes and it starts cooling.

        A cooling will not end the pause. It will merely extend the length of the present pause which is 18 years and 9 months for RSS; 18 years and 6 months for UAH6.0beta4; and 18 years and 7 months for a combination of the two.

        • mpainter says:

          If we see a cooling trend for a decade or two, this will extend the pause backward in time. For example, .3C of cooling would extend the beginning of the pause back to 1980…whoops! 🙂

        • David Appell says:

          Werner: Is your pause length statistically significant, say, at the 95% confidence level?

          • AndyG55 says:

            David, did you know that in RSS the ZERO trend is statistically supportable at the 2sd level, back 26 years. 🙂

          • David Appell says:

            That’s not what I find, which is that the RSS LT linear trend since 11/1989 is +0.11 C/decade, with a rank-1 autocorrelation 95% confidence interval of +/- 0.08 C/decade.

          • mpainter says:

            Yeah, but David, go get that peer reviewed so that we can take it seriously.

          • Werner Brozek says:

            Is your pause length statistically significant, say, at the 95% confidence level?

            I do not know. What I do know is that according to Nick Stokes here:
            http://moyhu.blogspot.com.au/p/temperature-trend-viewer.html
            Temperature Anomaly trend
            Feb 1997 to Oct 2015
            Rate: -0.001C/Century;
            CI from -1.023 to 1.022;
            t-statistic -0.001;
            Temp range 0.242C to 0.242C

            Also, since April 1993:
            Temperature Anomaly trend
            Apr 1993 to Oct 2015
            Rate: 0.766C/Century;
            CI from -0.033 to 1.566;
            t-statistic 1.878;
            Temp range 0.122C to 0.295C

            That is 22 years and 7 months.
            November is not up yet so that could change things a bit.

            About a year and a half ago, Dr. McKitrick calculated that it was 26 years for no statistically significant warming for RSS, so his time was a bit longer than that of Nick Stokes.

          • AndyG55 says:

            SkS trend calculator (goto for the alarmista cultist) for RSS gives 0.109 0.109/decade at 2sd for date 1989.91

            A ZERO trend is statistically supportable at the 2sd level for approximately 26 years.

          • David Appell says:

            Werner: You never know when I ask you this question.

            Don’t you think it’s past time for you to learn how to calculate statistical significance?

          • David Appell says:

            “Yeah, but David, go get that peer reviewed so that we can take it seriously.”

            Anyone who comments on the data should be able to download the data and calculate these things for themselves. Anyone.

          • David Appell says:

            “SkS trend calculator (goto for the alarmista cultist) for RSS gives 0.109 0.109/decade at 2sd for date 1989.91 A ZERO trend is statistically supportable at the 2sd level for approximately 26 years.”

            What a poor understanding of statistics.

            In fact, these numbers mean there is only a 5% chance of a zero trend, and a 95% chance the trend is greater than zero.

          • mpainter says:

            Why would I go to so much trouble when I don’t take it seriously, David. It’s not peer-reviewed. When the peers give it their blessing, maybe then.

          • David Appell says:

            Why do you take UAH v6 seriously? It has never been peer reviewed.

          • Werner Brozek says:

            In fact, these numbers mean there is only a 5% chance of a zero trend, and a 95% chance the trend is greater than zero.

            That may be the case, but climate scientists have decided on this benchmark, so whom am I to say they are wrong?

            As for me learning new things, why reinvent the wheel?

          • David Appell says:

            Werner: So a 5% chance is much smaller than a 95% chance, right?

            You need to learn how to do statistics. Until then you’re just doing numerology.

          • AndyG55 says:

            Yes David.. your poor understanding of statistics has been noted… MANY times. 🙂

          • AndyG55 says:

            Poor David.

            Read the statement as I have made it. I am correct.

            Just a simpler method of getting the same result as Ross McKitrick.

            And he has more knowledge of statistics in his little toe than you will ever have in your empty rotten brain.

          • David Appell says:

            Andy: You are interpreting the statistics incorrectly. .

          • AndyG55 says:

            David, you are not understanding the statistics at all.

          • David Appell says:

            I understand the math far better than you do, Andy.

            There is a 5% chance the trend is 0.

            I know where I’d put my money.

          • David Appell says:

            Werner wrote:
            “About a year and a half ago, Dr. McKitrick calculated that it was 26 years for no statistically significant warming for RSS, so his time was a bit longer than that of Nick Stokes.”

            And how did he do this, Werner?

            By including autocorrelation when calculating the confidence level.

            Why aren’t you doing the same, Werner?

            Do you ever understand what this means, Werner? I’ve seen no evidence at all that you do understand it.

          • AndyG55 says:

            Your responses tells us your statistical understanding is that of a junior high student.

    • David Appell says:

      Asking again: Dr. Spencer: Is it true you wont share your algorithm or computer code, as some sites have been saying?

      Why not?

  27. Werner Brozek says:

    RSS Update for November

    RSS for November came in at 0.426, a slight drop from the October value of 0.447. While it is the warmest November on record for RSS, the anomaly of 0.426 was beaten in the first 10 months of 1998 and the first 9 months of 2010. 2015 is in third place now and there is no way it can even reach second in 2015.
    The pause remains at 18 years and 9 months, however it is shifted by one month. So it is no longer from February 1997 to October 2015, but rather from March 1997 to November 2015.

    • ehak says:

      Which shows that there is greater variability in MSU/AMSU TLT.

      And that there is something obviously wrong in RSS TLT and the new UAH v6.0betasomething. Divergence from surface and radiosondes. And divergence from RSS water vapor. Not good at all.

      • AndyG55 says:

        No.. UAH over the USA is almost an exact trend match to the ONLY untainted, even-spaced, pristine temperature data USCRN

        Nothing wrong with UAH. !

        ClimDiv with all the radiosonde data over USA actually has a slight negative trend, and is very close to RSS trend..

        Its the totally F**KED-UP and corrupted from Gavin et al surface data that is the real problem.

      • Werner Brozek says:

        And that there is something obviously wrong in RSS TLT and the new UAH v6.0betasomething. Divergence from surface

        Since both satellites now agree, perhaps GISS and Hadcrut4 are wrong.

        • David Appell says:

          Why should GISS and HadCRUT4 agree with UAH and RSS? They are measuring different things.

          Duh.

          • Werner Brozek says:

            Why should GISS and HadCRUT4 agree with UAH and RSS? They are measuring different things.
            Duh.

            See:
            http://wattsupwiththat.com/2015/08/14/problematic-adjustments-and-divergences-now-includes-june-data/

            From Professor Brown:
            The two data sets should not be diverging, period, unless everything we understand about atmospheric thermal dynamics is wrong. That is, I will add my opinion to Werners and point out that it is based on simple atmospheric physics taught in any relevant textbook.

          • David Appell says:

            Just an opinion, on a site known for spreading manure.

            Again, why should surface trends be the same as LT trends?

          • AndyG55 says:

            The only manure spread here is by a guy called Appell who keep linking to his own sewer of a web site.

          • AndyG55 says:

            Rotten Appell’s total lack of knowledge of anything to do with climate and the atmosphere, continues to shine through. 🙂

            Let’s repeat that first bit of statement from Professor Brown, because the rotten Appell didn’t seem to understand it.

            “The two data sets should not be diverging, period, unless everything we understand about atmospheric thermal dynamics is wrong.”

          • David Appell says:

            Why should surface trends be the same as LT trends?

          • AndyG55 says:

            Your lack of understanding of atmospheric dynamics keeps shining through.

            I’m not wasting my time explaining it to you, because I know you are incapable of learning.

          • David Appell says:

            Andy: Again you avoid answering: Why should surface trends be the same as LT trends?

            You’re trying to bluff your way out of this. Won’t work.

          • AndyG55 says:

            Explain how the trends could be significantly different.

            Again.. rotten Appell hiding from the truth.

          • AndyG55 says:

            Let’s repeat , because you seem to be avoiding, yet again

            The two data sets should not be diverging, period, unless everything we understand about atmospheric thermal dynamics is wrong.

            Do try to catch up, some day…. you are an embarrassment to yourself.

          • AndyG55 says:

            What David is actually telling us, is that as the surface warms up, it no longer warms the troposphere as much.

            Interesting concept, hey !

            I would love to see the peer-reviewed paper that proves that one. 😉

          • AndyG55 says:

            Come on rotten Appell.. Please explain the mechanism, with peer reviewed literature, whereby the lower troposphere warms at a LOWER rate than the surface temperature.

            This is actually against all CO2 warming physics, no matter how bizarrely wrong that is.

            Await your coherent response. 🙂

          • bit chilly says:

            andy, maybe that is the missing heat that dives into the deep ocean, neatly avoiding measurement on the way down. one day, if david is lucky it will spring out and create the tropospheric hotspot that is required as a basic tenet to the alarmist hypothesis.

    • AndyG55 says:

      Werner.. On a “year to end of November” basis in RSS , I get the following (C degrees)

      1998 0.572
      2010 0.492
      2005 0.346
      2015 0.341

      Since the end of year anomaly for 1998 was 0.550 that means that December needs an anomaly of +2.85C to beat 1998

      (UAH requires +3.01C in December to beat 1998)

      Empty bottle of red next to me, so please confirm) 😉

      ps. as I add each months data is added I assume the previous years haven’t changed.

      Can’t do that with GISS/NOAA et al, because past temperatures keep getting colder. 😉

      • barry says:

        UAH has undergone about 10 revisions, I think, with some quite large changes. You’re probably aware that the latest (Beta) revision has changed the long-term trend.

        All data sets are revised. If you think it’s a problem for any, be consistent and apply the same standard to all.

        • David Appell says:

          Few datasets are ever revised as much as UAH’s going from v5.6 to v6beta.

          Some regional monthly temperatures in this version changed by as much as 1.3 C:

          http://davidappell.blogspot.com/2015/04/some-big-adjustments-to-uahs-dataset.html

          UAH’s alterations were about 3 times larger than the Karl et al changes of this summer:

          http://davidappell.blogspot.com/2015/06/noaas-data-changes-actually-smaller.html

          Think Lamar Smith will be calling Spencer and Christy onto the carpet?

          • AndyG55 says:

            Let’s look at the trends in the one place and period that has an UN-TAMPERED, EVENLY DISTRIBUTED surface record (All converted to F/year.)

            USCRN — +0.0035 F/yr
            ClimDiv — -0.0199 F/yr
            UAH USA48 — +0.0038 F/yr
            UAH USA49 — +0.0239 F/yr

            It appears that UAH STILL has a very slight WARMING BIAS against reality.

          • David Appell says:

            Andy55g: You are confused.

            This is about the changes from UAH v5.6 to UAH v6beta.

            These changes are huge. Suspiciously huge.

            Yet the gullible here, like you, have swallowed then without any questions whatsoever.

          • AndyG55 says:

            Yes, UAH STILL has a very slight warming bias.

          • AndyG55 says:

            Gees, they found an error in the way it had been processed.. and corrected it.. That’s what scientists do.

            GISS etc know they have massive errors, and keep repeating and enhancing those errors…. over and over and over again to meet their target. That’s what propagandists and activists do.

            It won’t be long until they are making up more than half of their data…. all of it to push the trend even further into truly fantasy, fairy tale realms..

          • David Appell says:

            What “massive errors” does GISS have?

            In your expert opinion, of course.

          • AndyG55 says:

            Come on rotten Appell.. Please explain the mechanism, with peer reviewed literature, whereby the lower troposphere warms at a LOWER rate than the surface temperature.

            This is actually against all CO2 warming physics, no matter how bizarrely wrong that is.

            Await your coherent response. 🙂

      • Werner Brozek says:

        please confirm

        I confirm! ☺

    • David Appell says:

      Werner wrote:
      “The pause remains at 18 years and 9 months.”

      What is the statistical significance of this claim?

      • Werner Brozek says:

        What is the statistical significance of this claim?

        There is 0% chance that the pause is exactly 18 years and 9.000000 months. However there is a 50% chance it is larger and a 50% chance it is smaller. Sorry! That is the best I can do!

        • David Appell says:

          Werner: Not nearly good enough.

          You like to go around the Web spouting your numbers, but they are utterly meaningless without some measure of their statistical significance.

          Time to go study some textbooks, Werner, and stop pushing mere numerology.

          • AndyG55 says:

            “and stop pushing mere numerology.”

            From you, that is really funny ……

            …. seeing as its all you ever do. !

          • Werner Brozek says:

            Werner: Not nearly good enough.

            Feel free to ignore everything I say. I was asked to do certain things a few years ago for WUWT and they have not told me to stop yet, despite not knowing statistics like Dr. McKitrick.

          • David Appell says:

            Werner: You’re doing what WUWT says?!?!?!?

            Up you standards, man. Learn to do proper statistics. Don’t stop at the least common denominator.

            Why do numerology when it’s possible to do real statistics?

          • AndyG55 says:

            “Up you standards, man. Learn to do proper statistics.”

            And the rotten Appell plays mirror, mirror !

            How introspective of him.!

    • David Appell says:

      Werner: Are these differences statistically significant? At what p value?

  28. AndyG55 says:

    Let’s look at the trends in the one place and period that has an UN-TAMPERED, EVENLY DISTRIBUTED surface record (All converted to F/year.)

    USCRN — +0.0035 F/yr
    ClimDiv — -0.0199 F/yr
    UAH USA48 — +0.0038 F/yr
    UAH USA49 — +0.0239 F/yr

    It appears that UAH still has a very slight WARMING BIAS against reality.

    • David Appell says:

      There is no reason to expect these numbers to be the same, since they are not all measuring the same thing.

      • AndyG55 says:

        So, you reckon USCRN, ClimDiv , and USHCN (when it was available) should not be a very close match……

        Is that what you are saying ?

        • David Appell says:

          Why, in terms of physics, should surface trends be the same at LT trends?

          • AndyG55 says:

            What David is actually trying to tell us, is that as the surface warms up, it no longer warms the troposphere as much.

            Interesting concept, hey !

            I would love to see the peer-reviewed paper that proves that one. 😉

          • AndyG55 says:

            Come on rotten Appell.. Please explain the mechanism, with peer reviewed literature, whereby the lower troposphere warms at a LOWER rate than the surface temperature.

            This is actually against all CO2 warming physics, no matter how bizarrely wrong that is.

            Await your coherent response. 🙂

        • AndyG55 says:

          Answer the question..

          So, you reckon USCRN, ClimDiv , and USHCN (when it was available) should NOT be a very close match

          Yes or No. !!

          • David Appell says:

            Why, in terms of physics, should surface trends be the same as LT trends?

          • AndyG55 says:

            Refusal to answer a simple question as usual.

            Your post is again, a waste of space.

          • AndyG55 says:

            What David is actually telling us, is that as the surface warms up, it no longer warms the troposphere as much.

            Interesting concept, hey !

            I would love to see the peer-reviewed paper that proves that one. 😉

          • AndyG55 says:

            Come on, worm-ridden appell…

            Where is this paper showing how surface temperatures over time can warm faster than the lower troposphere ?

            Surely you must have published one by now !!!

          • Massimo PORZIO says:

            David,
            “Why, in terms of physics, should surface trends be the same at LT trends?”

            Because the source of heat is the ground surface (which is far more dense than the air a LT), the air at LT should relatively quickly follows the surface temperature because of its low density.

            I can’t imagine an air above the surface with very different temperature except when winds blow, which is a transitory state that should be easily removed integrating the temperature along times greater than the winds duration.

            Have a great day.

            Massimo

          • DJC says:

            And how, MP, does the ground (or the ocean surface) get as warm as it does in the first place? Where are your calculations? What physics are you using?

          • Massimo PORZIO says:

            Hi Doug,
            no I didn’t mean what you wrote.
            I was writing about temperature trends not absolute temperature values.

            Have a great day.

            Massimo

  29. AndyG55 says:

    So… no counter argument at all

    Poor little rotten Appell,

    Fighting for a rotten cores.

  30. Massimo PORZIO says:

    Hi DrNo,
    above you wrote “You are entitled to your doubts.”

    Thank you, this denotes that you are in good faith.
    Even if we have different opinions about what CO2 effectively does on climate, it is important to me read that there is people like you that keep their mind open and recognize the right of the others to have doubts.
    By the way, in the past I already wrote somewhere in this blog that (I agree with you here) the satellites aren’t the best tools to determine the temperature at ground. I think they are the very right instrument to get the effective incoming and outgoing energy at TOA, but IMHO we should learn how to do that the right way, that we don’t do until today indeed (I don’t want to bore you, maybe you already read my dissertation about the opportunity of using an integrating sphere to get the whole outgoing LWIR radiation).
    Anyway, I hate to see that climatologist used to statistically adjust the ground measured temperatures to fix instruments biases or worse de-integrating (homogenizing) the few temperature measurement on bidimensional spaces to re-integrating them after and get the so called “average” temperature. That’s a very bad habit, because a measurement shouldn’t never be adjusted to be precise (at least at the very tiny levels we suppose to estimate to get the current global temperature trend).

    Have a great day.

    Massimo

  31. Dan Pangburn says:

    It might be an entertaining exercise to speculate about which agency reports the most accurate temperatures or what statistical procedure is best, but prediction of future average global temperature (AGT) trend is done reliably from what explains previous climate change and what does not.

    Equation (ii) in the analysis at http://agwunveiled.blogspot.com calculates the AGT trajectory since 1895. When compared to a 5-year moving average of reported AGT (before the frenzy of changing data to corroborate an agenda) the Coefficient of Determination, R^2, is 0.97. Whether the influence of CO2 is included or not makes no significant difference in the correlation.

    The method allows calibration of the equation using data up to any date. The predicted temperature anomaly trend in 2013 calculated using data to 1990 and actual sunspot numbers through 2013 is within 0.012 K of the trend calculated using data through 2013.

    The analysis also describes how the evolution of life on land as we know it with no sustained temperature trend is compelling evidence CO2 has no effect on climate.

  32. michael blazewicz says:

    As I have stated before, despite the peaks in Dr Spencer’s graph, the trend is still freaking obvious….you can spin it however you like, but your graph indicates a slow, gradual rise. Why am I the only one who can see this (without any placebo) ?

  33. geran says:

    David Appell is annoyed by UAH results. Hilarious.

  34. David Overton says:

    Great to see the interest this data is generating, and the intense discussion. I have a much more basic question than many of the issues discussed on these posts. If I understand the data, it shows that for the first 11 months of 2015, the anomaly relative to the baseline has averaged .25 C (with 11 months in, the year will probably be close to this).

    The baseline is 1981 – 2010. Temperatures during that baseline period increased overall, with roughly equal increases in the first and second half, so that it appears that 1995 is a good midpoint for the base period, in terms of both time and temperature trend. So the midpoint of the base period is 20 years ago, indicating about .12 degrees C of warming per decade over the past two decades. That rate also appears to be about the rate of warming during the base period as well.

    I would like to use this fact from Dr. Spencer’s data in letters to my representatives in Congress, and want to make sure I have it right – “satellite data indicates about .12 degrees C warming per decade over the past two decades”. Any guidance on making that more accurate? Thanks.

  35. Eli Rabett says:

    Moyhu has an interesting comparison of v6.0 and v5.6
    http://moyhu.blogspot.com/2015/12/big-uah-adjustments.html

    Very interesting

    • Kristian says:

      It’s not interesting at all. It’s only speculative and biased.

      This graph, however, is interesting:
      https://okulaer.files.wordpress.com/2015/12/giss-hadcrut3-rss.png

      Quite revealing, I would say. Before 2001, global temps went up and so the AGW protagonists felt no need to adjust. After 2001, however, global temps didnt go up anymore and so their anthropogenic global warming narrative was threatened. Hence, the process of relentless revisioning started …

      Note how the old HadCRUt version 3 agrees much more with RSS than with GISS post 1998*, while all three sets agree quite impressively up to that point.

      HadCRUt3 didnt show enough warming post 1998 and so they had no choice, they had to upgrade it.

      *I’ve adjusted the H3 series down from Jan’98 to correct the obvious spurious upward shift of ~0.09K in the HadSST2 dataset going from 1997 to 1998 (this was the time when the UKMO switched between data sources for their global SST product, and so an error in the calibration across the seam is very likely what caused the artificial shift).

      The satellites agree very well now after the latest UAH upgrade:
      https://okulaer.files.wordpress.com/2015/12/rss-vs-uah-tlt-gl.png

      Which was sorely needed; the land portion in UAH version 5.6 saw a massive steplike warming in 2005-2006 which clearly has no natural explanation; it is nowhere to be seen in the sea portion (or in any surface records for that matter).

      What I find most reassuring in all this is how well the tropospheric temps correlate with the global all-sky OLR at the ToA (according to CERES EBAF ToA Ed2.8):
      https://okulaer.files.wordpress.com/2015/12/olr-vs-tlt.png

      Since OLR at the ToA is primarily a radiative effect simply of tropospheric temperatures, this plot in my mind gives a lot of credence to the satellite version of the global temperature evolution of our planet post 2000.

      • Kristian says:

        If you wonder about that spurious upward shift in the HadSST2 dataset. It’s not just a claim. Here it is:

        https://okulaer.files.wordpress.com/2014/09/hadsst-vs-the-others.gif

        Note how the UKMO didn’t touch the obvious error even when revisioning their data, creating version 3. If the shift went the other way, a spurious downward step of nearly a tenth of a degree across the seam, do you think likewise they would’ve ignored (or tried to cover up) that …?

        Also, the massive steplike warming in the land portion of the UAH v5.6 product is discussed here:
        https://okulaer.wordpress.com/2015/03/08/uah-need-to-adjust-their-tlt-product/

      • Nick Stokes says:

        “Its only speculative and biased.”
        How so? It is simply a graph of published UAH 6.0, UAH 5.6, GISS now, and GISS 2011 vintage. And GISS 2005 is little different, as the subsequent difference plot shows. The difference between UAH versions is much greater than the differences with GISS.

        • Kristian says:

          Difference is, Nick, UAH change their trend both down AND up over time. When they discover problems, they correct them. Whether the correction’s going up or down. Much more honest that way. v5.6, after all, steepened the trend over that of the previous version, v5.5. And before that, most of the earlier adjustments to the series were also upward. Because it was most likely needed. However, now they’ve finally taken the step to (justifiably) correct some of the later adjustments, concerning the post-2000 section of the curve.

          GISS do something else entirely. They just keep squeezing the trend ever upward; incrementally, of course, but it adds up over time:
          http://www.climate4you.com/images/GISS%20MaturityDiagramSince20080517.gif

          “Global warming” from 1910 to the 2000s in the GISTEMP record increased by ~0.25 degrees from 2008 to 2015, simply from tiny-step adjustments adding on slowly over time. There is never an overall drop in the trend to be seen, is there …? If they cool some parts, it is only so that, when warming other parts, the net effect ends up being a steeper overall rise – more “global warming”; more in line with the models.

          • Nick Stokes says:

            “GISS do something else entirely. They just keep squeezing the trend ever upward”
            Well, if you look at the difference plot that I posted, there is no obvious uptrend since 1979. The UAH difference, however, is definitely down.

          • ehak says:

            More in line with models?

            The opposite is true. To get the series more in line with models they should have increased earlier temperature.

            http://1.bp.blogspot.com/-QeaTQmAMg4U/UvkqSuq418I/AAAAAAAAFFg/pNhjKF2P_pQ/s1600/CMIPGisTemp.png

            And of course there will be differences when using different SST-indices. HadIsst vs Ersst.

          • Kristian says:

            Nick, you say: “The UAH difference, however, is definitely down.”

            Yeah, for that ONE ugrade.

            For GISS 2015-2011, there’s a clear uptrend since 1995. Up to 2005, there is no “Pause” yet to be discerned, and so there is no real need for adjustments (apart from around the 1997/98 El Nio, which is seen to be lowered relative to the preceding and succeeding periods, to water down its visual impact).

    • ehak says:

      Here is Spencer’s version of the difference plot:

      http://www.drroyspencer.com/wp-content/uploads/V6-vs-v5.6-LT-1979-Mar2015.gif

      Also interesting. Note the y-axis. Put the Giss 2015 – 2005 into that plot.

  36. Norm Kalmanovitch says:

    The IPCC 2013 AR5 confirms a 15 year pause placing the end of global warming at 1998 (2013 – 15 = 1998)
    Under the heading Box 9.2: Climate Models and the Hiatus in Global-Mean Surface Warming of the Past 15 Years is the sentence Nevertheless, the occurrence of the hiatus in GMST trend during the past 15 years raises the two related questions of what has caused it and whether climate models are able to reproduce it.
    http://www.climatechange2013.org/images/uploads/WGIAR5_WGI-12Doc2b_FinalDraft_Chapter09.pdf

    This latest UAH MSU data confirms that the pause is still in place which means that according to the IPCC 2013 AR5, GHG emissions have not caused any global warming for 17 years and 6 months and that it is really dumb for 25,000 delegates to attend the IPCC Paris COP21 climate summit and agree to reducing GHG emissions to stop global warming which the IPCC has confirmed already stopped 17 years and 6 months ago!
    We wouldn’t be in this mess if PBS had aired the 1990 documentary “The greenhouse conspiracy” https://www.youtube.com/watch?v=C-x4YbXZtIA and listened to what Roy said 25 years ago!

  37. Bob Weber says:

    I think you misunderstood me Dan.

    ‘Got some data? ;)’ was in reference to your assertion of

    “also is a proxy for cloud changes which account for the other 95%”

    Got some data on cloud changes vs TSI? is my question.

    I ask that because of all the data I’ve retrieved over the years, that particular data has eluded me.

    • Dan Pangburn says:

      TSI is, at most, a 5% factor. The time-integral of sunspot number anomalies accounts for TSI and also is a proxy for cloud changes which account for the other 95%. This, combined with a simple approximation of the effect of ocean cycles, results in a 97% match to measured average global temperatures since before 1900. The analysis showing this is at the agwunveiled analysis.

  38. Pena says:

    How come the moving average is still broken?

    • Tim Folkerts says:

      In what way do you think it is broken???

      It is a “13 month centered average” which means it is the average of the given month, the 6 months before and the six months yet to come. As such, it must always run 7 months behind.

      For example, what that we have data for the 11th month, the centered average for the 4th month can be calculated.

  39. Peba says:

    How come the running average still stops way too early – is someone attempting a cover-up?

  40. D'J'C says:

    Please see this comment and, if you have any genuine questions, I will answer them on my blog which is linked from that comment.

  41. Eli Rabett says:

    Is the set of sonde sites and data you use to calibrate UAH available anywhere?

  42. ʽ says:

    ̳,Щ̳Է棿̳Էѹ棬һԷĹר̳ӭλҵվseoerǰҵSEOŻϢ http://www.zuiailuntan.com/

  43. ٹ says:

    ̳,Щ̳Է棿̳Էѹ棬һԷĹר̳ӭλҵվseoerǰҵSEOŻϢ http://www.zuiailuntan.com/

  44. Ľƽ̨ says:

    1ķӶô㣿
    źҪĹؼʻӣɽ롰ԱġѡӦĶڡҪ޸ġֱڱҳн°µҪзϵͳὫйʣֱתС
    2ٶӶſ֣
    ƽ̨ӶһԪ
    3ֺܵˣ
    ֺ24СʱὫӶֵ˺С
    4ַʽļ֣
    Ŀǰƽֻ̨֧֧Ƹͨ֡
    http://www.pugongcao.com/?t=1421

  45. ëȯ says:

    ׬̫ˣ֪ȺͳŶҲܸߣע5000ң2Ԫܶ֡Ҹ2Ԫϵˣ2Ԫ֣ҿעԣעַ:http://www.youzhuan.com/tg/?u=73356ee510

  46. سð says:

    ̳,Щ̳Է棿̳Էѹ棬һԷĹר̳ӭλҵվseoerǰҵSEOŻϢ http://www.zuiailuntan.com/

  47. ڴ˵ says:

    ̳,Щ̳Է棿̳Էѹ棬һԷĹר̳ӭλҵվseoerǰҵSEOŻϢ http://www.zuiailuntan.com/

  48. ½ƿ˸ says:

    ׬̫ˣ֪ȺͳŶҲܸߣע5000ң2Ԫܶ֡Ҹ2Ԫϵˣ2Ԫ֣ҿעԣעַ:http://www.youzhuan.com/tg/?u=73356ee510

Leave a Reply