
 Home/Blog
NOTE: This is the eighth monthly update with our new Version 6.0 dataset. Differences versus the old Version 5.6 dataset are discussed here. Note we are now at “beta4” for Version 6, due to our accidental omission of lower stratospheric data from NOAA-9 post-Feb. 1987.
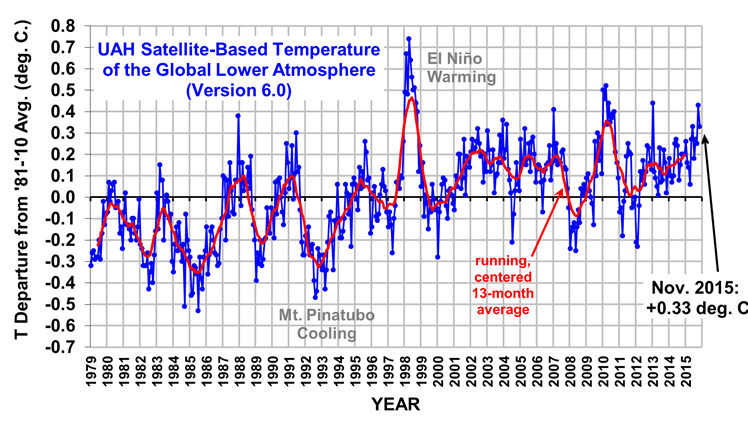
The Version 6.0 global average lower tropospheric temperature (LT) anomaly for November, 2015 is +0.33 deg. C, down from the October, 2015 value of +0.43 deg. C (click for full size version):
The global, hemispheric, and tropical LT anomalies from the 30-year (1981-2010) average for the last 11 months are:
YR MO GLOBE NH SH TROPICS
2015 01 +0.28 +0.40 +0.16 +0.13
2015 02 +0.17 +0.30 +0.05 -0.06
2015 03 +0.16 +0.26 +0.07 +0.05
2015 04 +0.08 +0.18 -0.01 +0.09
2015 05 +0.28 +0.36 +0.21 +0.27
2015 06 +0.33 +0.41 +0.25 +0.46
2015 07 +0.18 +0.33 +0.03 +0.47
2015 08 +0.27 +0.25 +0.30 +0.51
2015 09 +0.25 +0.34 +0.17 +0.55
2015 10 +0.43 +0.64 +0.21 +0.53
2015 11 +0.33 +0.43 +0.23 +0.53
The tropics continue warm due to El Nino conditions, but the temperature in recent months seems to have plateaued despite the climatological expectation of increasing temperature as we approach peak El Nino warmth in the next few months. This plateau, of course, could end at any time.
The global image for November, 2015 should be available in the next several days here.
The new Version 6 files (use the ones labeled “beta4”) should be updated soon, and are located here:
Lower Troposphere: http://vortex.nsstc.uah.edu/data/msu/v6.0beta/tlt
Mid-Troposphere: http://vortex.nsstc.uah.edu/data/msu/v6.0beta/tmt
Tropopause: http://vortex.nsstc.uah.edu/data/msu/v6.0beta/ttp
Lower Stratosphere: http://vortex.nsstc.uah.edu/data/msu/v6.0beta/tls


