
 Home/Blog
The snowstorm expected to begin in earnest on Friday is still looking like one for the record books, especially in the DC area up through Philadelphia and New York City.
The heavily-populated I-95 corridor from the Mid-Atlantic to New England will see the heaviest snowfalls, starting Friday and spreading northeastward on Saturday.
By Sunday morning, nearly one-quarter of the U.S. population (about 75 million people) could get 6 inches or more of snow. Consistent with the weather model forecasts for the last several of days, the latest GFS model forecast continues to indicate the area around Washington D.C. would be hardest hit, with about 2 feet of snow expected (graphic courtesy of Weatherbell.com, click image for full-size):
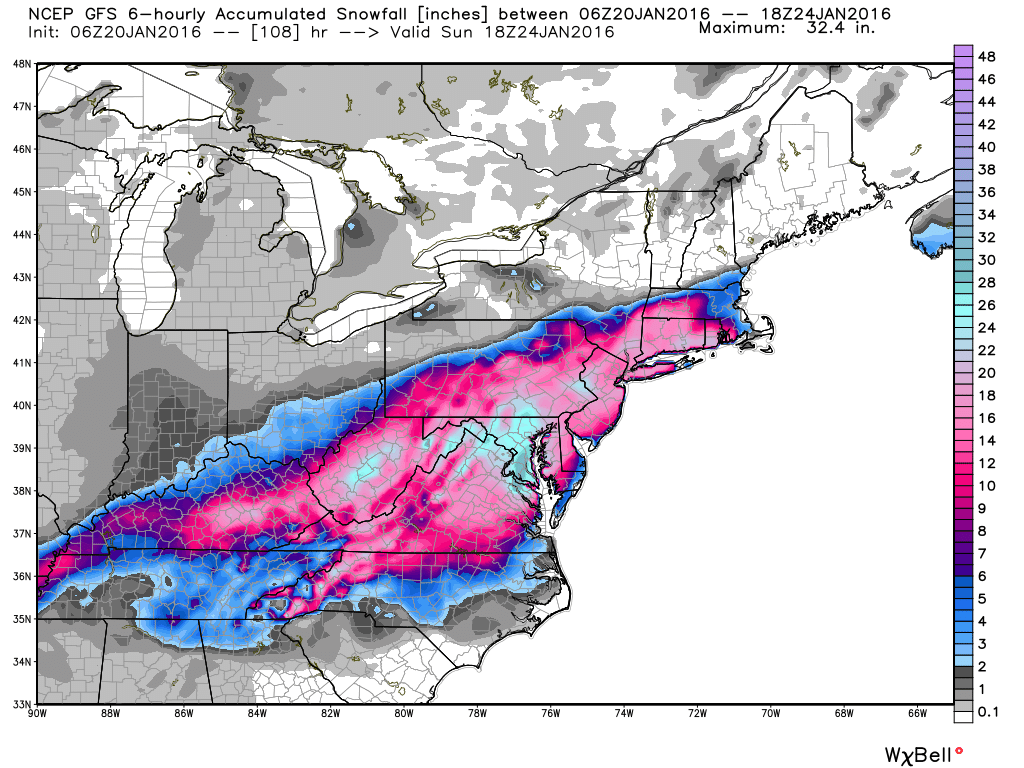
Total forecast snowfall by midday Sunday, Jan. 24, 2016.
New York City could see 16 to 20 inches, and nor’easter type conditions are expected for coastal areas from the Delmarva peninsula northward, with winds gusting over 50 mph.


