UAH V6 Global Temperature Update for Dec. 2015: +0.44 deg. C

January 5th, 2016 by Roy W. Spencer, Ph. D.

NOTE: This is the ninth monthly update with our new Version 6.0 dataset. Differences versus the old Version 5.6 dataset are discussed here. Note we are now at “beta4” for Version 6, due to our accidental omission of lower stratospheric data from NOAA-9 post-Feb. 1987.

The Version 6.0 global average lower tropospheric temperature (LT) anomaly for December, 2015 is +0.44 deg. C, up from the November, 2015 value of +0.33 deg. C (click for full size version):

UAH_LT_1979_thru_December_2015_v6

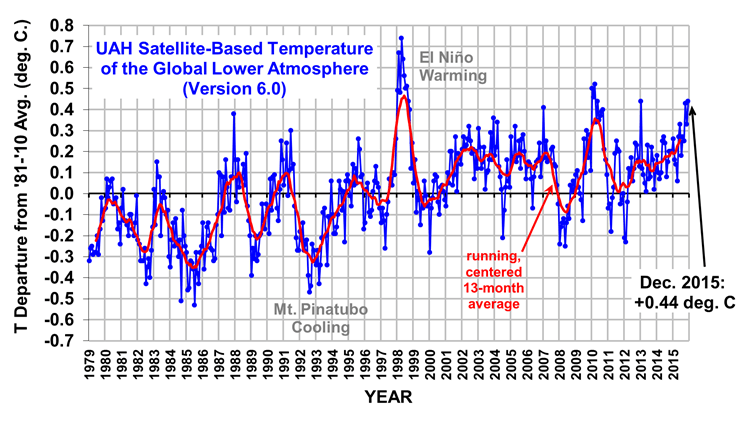
This makes 2015 the third warmest year globally (+0.27 deg C) in the satellite record (since 1979), behind 1998 (+0.48 deg C) and 2010 (+0.34 deg. C). Since 2016 should be warmer than 2015 with the current El Nino, there is a good chance 2016 will end up as a record warm year…it all depends upon how quickly El Nino wanes later in the year.

The global, hemispheric, and tropical LT anomalies from the 30-year (1981-2010) average for the last 12 months are:

YR MO GLOBE NH SH TROPICS
2015 01 +0.28 +0.40 +0.16 +0.13
2015 02 +0.17 +0.30 +0.05 -0.06
2015 03 +0.16 +0.26 +0.07 +0.05
2015 04 +0.08 +0.18 -0.01 +0.09
2015 05 +0.28 +0.36 +0.21 +0.27
2015 06 +0.33 +0.41 +0.25 +0.46
2015 07 +0.18 +0.33 +0.03 +0.47
2015 08 +0.27 +0.25 +0.30 +0.51
2015 09 +0.25 +0.34 +0.17 +0.55
2015 10 +0.43 +0.64 +0.21 +0.53
2015 11 +0.33 +0.43 +0.23 +0.53
2015 12 +0.44 +0.51 +0.37 +0.61

The tropics continue warm due to El Nino conditions, with December unsurprisingly the warmest month yet during the El Nino event.

The global image for December, 2015 should be available in the next several days here.

The new Version 6 files (use the ones labeled “beta4”) should be updated soon, and are located here:

Lower Troposphere: http://vortex.nsstc.uah.edu/data/msu/v6.0beta/tlt
Mid-Troposphere: http://vortex.nsstc.uah.edu/data/msu/v6.0beta/tmt
Tropopause: http://vortex.nsstc.uah.edu/data/msu/v6.0beta/ttp
Lower Stratosphere: http://vortex.nsstc.uah.edu/data/msu/v6.0beta/tls


364 Responses to “UAH V6 Global Temperature Update for Dec. 2015: +0.44 deg. C”

Toggle Trackbacks

  1. Euan Mearns says:

    We have been punished by 30 days and 30 nights of rain. Serious flooding…..

    http://www.telegraph.co.uk/news/earth/flooding/12081476/Queens-neighbours-castle-overhanging-12ft-drop-to-river.html

    More here….

    http://euanmearns.com/uk-winter-storms-2015/

    Temperatures climbed well into the teens on Mon 9th and eventually peaked at just under 20 centigrade in many areas on Fri 13th.

    …… that was February 1998

    • Bill Laurune says:

      Where did all that water come from, and why so much of it relative to the past? Given the prevailing jet stream, I assume it mostly evaporated from the western Atlantic, from the Caribbean northward, in which the sea surface temperature anomaly is currently quite high, resulting in higher evaporation rates.

      When the warm moist air meets Arctic air over England, the vapor condenses as rain, and in doing so releases the latent heat it picked up from the ocean. The ocean cooled off, but the atmosphere warmed.

      So the global average temperature didn’t really spike from November to December. It’s just that heat was transferred from the ocean, where these satellites don’t detect it, to the atmosphere, where they do.

      • Euan Mearns says:

        Storm Frank, that did the damage was a huge depression the size of the Atlantic centred on Iceland. I live in Aberdeen, beside the River Dee and while it was certainly wet and windy, nothing out of the ordinary for winter storms.

        There was not a lot of snow in the mountains, but one possibility is that a rapid rise in temperature accompanied by rain accounts for the deluge that happened very quickly. We’ve had one storm after another and so all rivers were already high and ground saturated. Another possibility is an event in a loch in one of the high valleys that displaced water.

        I’ve sent a request for the river flow data since I’m curious to understand the exact cause. Standard form here will simply be to blame this on climate change. The castle is still standing but another front tomorrow may well see it end up in the river. The river Dee has simply changed course at a number of localities. That’s what rivers do.

      • Frank says:

        Bill Laurune asked: “Where did all that water come from, and why so much of it relative to the past? Given the prevailing jet stream, I assume it mostly evaporated from the western Atlantic, from the Caribbean northward, in which the sea surface temperature anomaly is currently quite high, resulting in higher evaporation rates.”

        The saturation water vapor pressure or 100% relative humidity – the amount of water vapor present at equilibrium – rises 6-7% per degC of warming. The actual relative humidity is usually 20-80% of saturation – 80% over the ocean. If this were the controlling factor in rainfall, global warming in general has sent about 7% more water vapor towards your home. If the SST anomaly in the Atlantic were 2 degC higher, the increase it would provide would be 13%.

        In contrast to the equilibrium AMOUNT of water vapor, the RATE of evaporation varies with three factors: the “undersaturation” of the atmosphere over the ocean, wind speed and temperature. As above, a rising temperature will increase the rate of evaporation by 6-7% per degC – if the other factors remained the same. If wind speed and undersaturation remained constant, the upward flux of heat from the surface for increase about 6 W/m2 per degC of surface warming: 5 W/m2/K from the increase in latent heat/evaporation and 1 W/m2/K from net upward radiation (OLR-DLR). If ECS were 3.7 W/m2, the increased net flux of radiation (TOA OLR – post albedo SWR) from the top of the atmosphere would only increases 1 W/m2 per degC of surface warming. It is impossible for the surface flux to increase at a rate of 6 W/m2/K and the TOA flux to increase at 1 W/m2/K indefinitely. The more precipitation increases from global warming, the lower climate sensitivity must be.

        According to Isaac Held, AOGCMs predict that the undersaturation of the air over the ocean will decrease by 5% per degK of surface warming (relative humidity rising from 80% to 81%, undersaturation decreases from 20%, suppressing the increase in the evaporation rate to only 1-2% per degC of surface warming. That is the main mechanism by which they make the increase in surface upward flux on a warming world equal to the increasing TOA flux.

        Conclusion: GHGs, global warming, and SST anomalies have nothing to do with increasing the rate of evaporation and therefore the rate of precipitation. (The average water molecule remains in the atmosphere after evaporation for only 9 days.)

        All that rainfall came from the natural variability in weather. Doubling the mean wind speed will double the evaporation rate (to 160 W/m2), but the loss of an extra 80 W/m2 of latent heat will cool the ocean (about 1.3 K/month for a 50 m mixed layer).

      • Joel says:

        I guess if you layer assumption upon assumption and throw in a bit of statistics and fudging you get this….http://news.yahoo.com/global-warming-strikes-deep-oceans-study-170229128.html

  2. richard verney says:

    Thanks the update. So 2015 is quite some way off the warmest year in the satellite data set.

    Much if the NH has been unseasonally warm, as the satellite data confirms.

    I expect to see the next 4 to 5 months responding to the current strong El Nino, but then it is likely that temperatures will drop back with a La Nina in late 2016/early 2017.

    the question being will there be a long lasting step change in temperature coincident with this year’s strong El Nino (just as there was with the Super El Nino of 1997/98), or will it result in just a short term spike like the 2010 El Nino?

    Time will tell.

    • Slipstick says:

      richard verney,
      I’m not sure about your characterization of the effects of the 2010 El Nino as “a short term spike”. Subsequent to the 2010-2012 La Nina events, the LT temperature may have begun rising, as it did after the 98-2001 La Nina, but the current El Nino kicked in before a sufficient interval elapsed to judge any stabilization.

      As to the future, while I am generally reluctant to make predictions for a system as chaotic as the climate, I’m here for fun and can’t resist. Based on the somewhat short dataset in the graph above and the ONI history, my “eyeball and gut” estimation is that, following the next La Nina interval, the LT will stabilize somewhere in the neighborhood of 0.3 deg. above the ’81-’10 average in the early 2020’s and monthly readings below the ’81-’10 0 line will be rare, if not non-existent. I’ll have a better feel for this after we see the monthly temperatures in the next few months. Of course, if another significant El Nino occurs during the next five or six years, all bets are off and we are likely well and truly in trouble.

      • Martin says:

        According to most mainstream climatologists, El Nino and La Nina events can not influence the trend in the long run, only create outliers such as 1998. Therefore, we won’t be in bigger trouble than we are in, just because of another El Nino (according to those who support this theory). Of course, I am not talking about damages a strong El Nino is causing.

        • richard verney says:

          Unfortunately, prior to the satellite data, we do not possess any reliable global temperature records with which to test that claim.

          The satellite data provides some evidence that a Super El Nino can, at any rate on a multidecadel basis, impact on climate. The satellite data suggests that almost the entire warming seen in the record occurred as a one off and isolated step change (of about 0.27degC) in and around the 1997/98 Super El Nino. Whether El Ninos/La Ninas are neutral on larger time scales such as centennial scales could be the case, but it is something which still needs to be established by good quality data.

          • Martin says:

            Richard, those measurements are strongly influenced by volcanic eruptions, which had the strongest impact on those early measurements. I suppose that jump during 1998 El Nino wouldn’t be so sharp, if it wasn’t influenced by cooling effect of volcanic ash.

        • Slipstick says:

          I agree that El Nino does not affect the long term trend but I believe the intensity is an indication of the background climate state.

        • Kristian says:

          Martin says, January 5, 2016 at 12:59 PM:

          “According to most mainstream climatologists, El Nino and La Nina events can not influence the trend in the long run, only create outliers such as 1998.”

          Funny. Because according to the DATA, they most certainly can, and do.

      • fonzarelli says:

        Slip, tis also the moment of truth for all us “solar warmists”. (if we don’t see some cooling soon, it looks like we might be wiping egg off our faces) One thing we can or should all agree on is that the next few years will be very telling…

        • Martin says:

          Solar influence on the latest warming is very questionable. Solar activity has been quite steady in the 80′ and 90’s. Unless some unknown indirect effect is involved, then there is only one option, and that is lagged effect.

        • Slipstick says:

          fonzarelli,
          Indeed, I also consider the next few years crucial to evaluation of all the models, including my “hobbyist’s gut” model. Regarding cooling, my suspicion is that the cooling predicted by the solar and ocean oscillation models actually did occur during the last decade, but was negated by the stronger and more persistent CO2 warming signal, resulting in the “pause”. One factor that I consider important in this regard is that sea temperatures rose during this period, even if the atmospheric temperatures did not.

        • JohnKl says:

          Hi fonzarelli and Martin,

          Not long ago you claimed that the rate of CO2 increase rose following temperature increases and that it was the temperature increase that caused CO2 outgassing and subsequent increase. In fact, evidence exists to support that conclusion. You now state:

          “(if we dont see some cooling soon, it looks like we might be wiping egg off our faces) One thing we can or should all agree on is that the next few years will be very telling”

          Observation will always tell us something. What in particular do you expect to learn? CO2 and other gasses do absorb and emit infrared radiation. Some of which redounds back to the surface. Since atmospheric gas molecules appear for the most part cooler than the surface mass they will likely merely slow the rate of cooling and not warm the surface directly. However, the sun can subsequently raise the temperature. Since more energy remains in the system average temperatures will likely be somewhat higher. What do you fear will happen that you didn’t consider in the past?

          Martin you state:

          “Solar influence on the latest warming is very questionable. Solar activity has been quite steady in the 80′ and 90s.”

          Solar influence during the period may have been steady but albedo changes all the time. As in so much in life it’s not what merely what you obtain but what you keep that counts. A lower albedo in 1997-8 likely contributed to a temperature increase at the time.

          Have a great day!

          • DouglasECotton says:

            Re solar influences, see
            http://www.skepticalscience.com/graphics.php?g=5

            It is obvious that the “solar warmists” must admit defeat.
            It is also obvious that an “albedo warming” theory must be rubbish.

          • JohnKl aka James Bond says:

            Hi DoulasECotton aka Dr. No aka Alfred E Newman,

            You claimed:

            “It is obvious that the solar warmists must admit defeat.
            It is also obvious that an albedo warming theory must be rubbish.”

            You do realize an internet link doesn’t in and of itself constitute evidence and since your link concerns solar activity and apparently not albedo it appears largely irrelevant. You may wish to inspect a more relevant link at so called skeptical science:

            https://www.skepticalscience.com/earth-albedo-effect-intermediate.htm

            Apparently your ginseng is no good. Try M’s stuff. I’m telling you it will do wonders for your cognition.

            Have a great day!

          • David Appell says:

            John wrote:
            “Since atmospheric gas molecules appear for the most part cooler than the surface mass they will likely merely slow the rate of cooling and not warm the surface directly.”

            We have a word for slowing the rate of cooling: “warming.”

          • Dr No says:

            Dear JohnKl aka James Bond,

            Greetings. We meet again. I have been busy for a few weeks and have not been keeping up with the misinformation you spread. However, I see you are crossing swords with Douglas E Cotton who sounds less of a cretin than the usual bloggers here.

            Did you know that the state of Wisconsin produces nearly 95% of American ginseng. The herb is also widely grown in the province of Ontario, Canada.

          • DouglasECotton says:

            “..with Douglas E Cotton who sounds less of a cretin than the usual bloggers here.”

            Thanks for that glowing endorsement you sanctimonious git.

          • Gordon Robertson says:

            @the pantomime doug…”Re solar influences, see…”

            I knew you were a representative from the discredited skepticalscience circus. SS has excelled at impersonating people, like physicist Lubos Motl.

            Are you sure you want to cite skepticalscience?

            SS has taken it into another realm that gives a different meaning to the initials SS.

            http://wattsupwiththat.com/2013/08/06/skeptcial-science-takes-creepy-to-a-whole-new-level/

            Although the photos indicated in the WUWT article have been removed from SS, this page seems to have captured them before removal.

            https://suyts.wordpress.com/2013/08/06/ewww-creepy-maniacs-at-ss-true-deniers/

          • JohnKl says:

            Hi DouglasECotton, Dr. No and/or Alfred E Newman,

            You may have me all wrong. If the planet warms we may be better off. It might be great to take a Princess Cruise ship through the North Pole. John Parsons can tag along to provide any politically correct teeth grinding should he find the revelers too indifferent to an above freezing point arctic. Not that I would know having never taken a Princess Cruise, but wasn’t it about a year ago that some climatologists were stuck frozen fast in the Antarctic ice sheet? The Chinese had to save the sorry crew from becoming frozen Corpsicles. Not to fear! There was alcohol aplenty.

            In any case, do you guys ever plan to leave the ICE AGE?!!!

            Have a great day!

        • geran says:

          All the ocean heat loss due to the Nino, coupled with next three years entering solar cycle minimum, should make for a rather cold “Nina”.

          (Testing if tilde is working yet—-EL Nio—-Test out.)

        • John Parsons says:

          There will be gnashing of teeth, renting of garments and yes indeed, a lot of egg wiping.

        • JohnKl says:

          fonzarelli,

          Why do you expect there to be cooling?

    • Gordon Robertson says:

      @richard verney…”Much if the NH has been unseasonally warm, as the satellite data confirms”.

      Not all of NH. I live near Vancouver, Canada and we normally get mild winters. This late fall and early winter has produced some miserable conditions in the area.

      I was thinking the other day with the feel of the cold air on my face, that we are in for a spell of cooling. Not scientific but sometimes the body can tell you something the intellect can’t.

      • Mick says:

        The Province has reported that winter would be warmer and dryer than normal. These goofballs aren’t sure what’s happening from one day to the next, let alone predicting the season ahead based on their EC pseudoscience reports and forcasts. EC is fudging data as well.

      • richard verney says:

        That is why I said much. It has not been uniform, but then again that is not surprising since climate is regional, not global, nor hemispherical (albeit the hemispheres respond somewhat differently due to their different proportion of land and oceans).

    • barry says:

      “the question being will there be a long lasting step change in temperature coincident with this years strong El Nino (just as there was with the Super El Nino of 1997/98)”

      I would question whether it’s a step-change at all. Many pairs of adjacent short periods can look like a step-change for the entire surface record, and can easily be assigned to ENSO events simply because the spikes are superimposed on long-term warming. If el Ninos cause warming step-changes and la Ninas cooling ones, we’d see no trend. If step-changes are associated with el Ninos and not el Ninas, extrapolate backwards a few hundred years and temps should be several degrees cooler back then, and tens of degrees cooler a few thousand years ago (which is nonsense).

      I never found the step-change argument convincing; statistical mathturbation with no physical explanation, certainly not to explain longer-term trends.

      Has there been any robust statistical testing of this idea, or is it all based on plotting a trends either side of ENSO events and then assuming a bunch of unexplained physics must have taken place to retain the extra warmth?

      (Multi-decadal ocean atmos systems [PDO/AMO] also fail to explain when the longest time series are examined – these are all cyclical over the long term, shifting heat around the system rather than retaining more at the surface/lower trop. Their physics at best explain variation over interannual [ENSO] or multidecadal [PDO/AMO etc] scales, but not centennial scale warming)

      • Kristian says:

        Sorry, Barry, but the data unequivocally SHOWS that global temperature anomalies progress in a distinctly stepwise manner. In fact, from 1970 to ~2013/14, the ENTIRE average rise in global temps is contained within THREE abrupt upward shifts, in 1979, in 1988 and in 1998.

        Whether these three specific steps can be ‘explained’ or not doesn’t make them go away. They’re there:
        https://okulaer.wordpress.com/2014/07/30/modern-global-warming-in-three-steps-the-fairly-short-version/

        Noise+trend, you say? Not so:
        https://okulaer.wordpress.com/2014/08/30/noise-trend/

      • barry says:

        I see no statistical testing in your posts for whether the temp rise is a step function or a linear trend plus noise. You just assume the step function based on the fact of ENSO events leading global temps, which is well-known and not surprising. And absent a physical explanation for why quasi-periodic oscillating systems would continually ADD energy to to the lower atmosphere (in steps), rather than move energy around from the lower atmos to the oceans with no trend (except for some other forcing, such as GHGs), there’s no there there.

        A question: do you posit that el Ninos always add energy to the lower atmosphere, and that they will continue to do so? Because if so, extrapolating backwards makes nonsense of that notion. Same goes for PDO AMO on the longest time scales. Ultimately, these are in–system oscillations, and cannot account for long-term (eg, centennial) temp change at the surface/lower atmos.

        So, no statistical testing, just graph eye-balling, and no physical explanation for the temp rise since 1900, which encompasses enough time for intradecadal (ENSO)and multidecadal (PDO/AMO etc) oscillations to cancel out.

        Still far from convinced of step changes. What’s your prediction, based on your model, for the coming decade (2016-2025) compared to the previous? Warmer or cooler?

  3. Slipstick says:

    After a quick scan of the V6 table, it appears this is the warmest December in the satellite record.

  4. ehak says:

    A new month.

    A new warmest evah month.

    A new month and Spencer won’t mention that.

    And a new month where Spencer has not updated the running mean. Still stuck like in May 2015.

    Btw, the second warmest December in this series is December 1987… Which of course makes much sense. Or perhaps not.

    Another btw: Spencer calls this LT. It is not. Not the same as the old LT. Therefore it is better to call this MLT.

    • 1) I don’t usually mention the warmest (or coolest) month ever type statistic in my blog…that is covered in our UAH press release each month.

      2) you are correct about the trailing average not being updated, I’ll fix it.

      3) we like “new LT” better. But, a rose by any other name….

    • The UM CCI CFSR preliminary data show December 2015 as the third warmest December back to 1979, although the uncertainty in these estimates is probably at least plus or minus 0.3C and likely more. Consequently, I’m not sure we can really determine if there is much difference between the 10 highest Decembers. Thus December global surface temperatures really look pretty flat for the 21st Century so far. No sign of major warming or cooling.

      CFSR December Global Average Surface Temperature (degC)
      Top ten back to 1979:
      2006 13.21
      2003 13.19
      2015 13.16
      2005 13.13
      2001 13.01
      2009 12.97
      2002 12.94
      2014 12.91
      2004 12.90
      2008 12.88

    • Alberto Zaragoza Comendador says:

      Have you convinced many people with your cordial tone?

    • Gordon Robertson says:

      @ehak…”And a new month where Spencer has not updated the running mean”.

      Can you not look at it and see where it is going? Look at the red curve of 2010 with all the data points above 0.4C, then look at 2015.

      And where do you get the warmest ever month? Look at the data points in 1998 that represent months. Most of them are nearly double 2015.

      You have seriously fallen for the scientific misconduct being perpetrated by NOAA.

      • ehak says:

        December 1998 v6betasomething: 0.24. December 2015: 0.44

        Easy really.

      • Ric Werme says:

        Gordon, you say “warmest [anomaly] ever month”. The subject is “warmest ever month of December.” (Anomaly or actual.)

        • Gordon Robertson says:

          @Rick Werme..”Gordon, you say warmest [anomaly] ever month. The subject is warmest ever month of December. (Anomaly or actual.)”

          Rick…anomalies, as you know, are just deviations from a mean temperature. On the UAH graph the mean is the 1980 – 2010 average. Obviously the warmest month will be the one with the greatest deviation from the mean. In that case, 1998 has deviations twice that of 2015.

          I think it highly unlikely that December 2015 would exceed any of the months during the 1998 EN as an absolute temp or as an anomaly.

          I wish absolute temps were posted since I’d like to see an actual graph based on the fictitious global average of about 15C. However, if they graphed that, the warming we have seen on the UAH graph, all of it following the 1998 EN, would appear as a somewhat squiggly, straight line.

          The surface anomalies are based on the 1950 – 1990 global average and since the 50s and 60s were periods of cooling that tends to accentuate warming in the graph.

    • David Appell says:

      “And a new month where Spencer has not updated the running mean. Still stuck like in May 2015.”

      It’s a 13-month centered mean, so the last point is always going to be six months behind the present.

  5. mpainter says:

    Hold off on the handwringing, slapstick, January is the critical month. Euan Mearns links to an interesting comparison of the a 98 El Nino with the current, comparing December data. I don’t want to be a party pooper, but it doesn’t look too hopeful for much of a peak on this El Nino. Note particularly the conditions offshore NW South America, where it’s looks rather pale, compared to the 98 El Nino. It might not fizzle, but Ma Nature loves to torment the global warmers, as we have seen time and again.
    Happy New Year.:-)

    • Slipstick says:

      What handwringing? I just stated a fact. Set up your strawman somewhere else.

      By the way, you didn’t answer the question that if more than 90% of the Earth’s glaciers are receding, how is it possible the mean sea level is not rising? Where is the water going?

      • mpainter says:

        Hold off on the handwringing, anyway, for the reasons which I gave above.

        Concerning glacier melt, it goes back on the glaciers. It’s called mass balance. For example, Antarctica gains about 100 gt/year of ice, according to the latest NASA study. This despite the fact that it loses several times that figure, annually, through ice loss (melt).

        And there you have it, slapstick, facts that heretofore have not found their way past the shutters on your skull. More reasons not to wring your hands. Pesky Ma Nature, doggone her.

        • Slipstick says:

          I would be most interested if you could provide a citation for this latest “NASA study”, since everything I’ve seen indicates a mass balance on the order of -tens of gt/yr for Antarctica.

          Also, I find it fascinating that the majority of the water from the receding glaciers around the globe disappeared via sublimation and then precipitated over the Antarctic. I guess water flowing from glaciers is an optical illusion.

          • mpainter says:

            Zwally, 2015. Steve McIntyre posted a survey of studies on Antarctic mass balance a month or so ago. Very informative. You, too, can be informed…if you really desire to.

            Every glacier has its mass balance metrics, not just Antarctica. FYI, Grace satellite data shows no change in Antarctic mass this century. Mass balance there is determined by isostatic computations, which are largely guesswork. Greenland mass balance too, is computed via glacial isostatic adjustments (GIA). You will be surprised to learn that mass accumulation in Greenland exceeds melt. You will also be surprised to learn that melt/disintegration of the Antarctic ice shelves make no contribution to sea level. You will be surprised at your ignorance of the matter.

          • DouglasECotton says:

            Slipstick,
            You are correct. An authoritative study is Seo et al. (2015):
            http://onlinelibrary.wiley.com/doi/10.1002/2014JB011755/full

            and
            satellite-based observation of global sea level indicate an average increase of +3.3 mm per year since 1992.
            http://sealevel.colorado.edu

            You have hit a raw nerve with deniers in mentioning these facts. Watch them try and discredit the observations. My favourite denier response was one in which it was claimed that the apparent sea level rise was nothing to do with an increase in water volume but was due to the land masses sinking !

          • geran says:

            The climate clowns love their (non-existent) ASLR. (ASLR = Anthropogenic Sea Level Rise for the climate clowns.)

            The question, to always pose to them, is what would be the SLR if there were no melting off any polar land-ice or glaciers?

            (Let the hilarity begin.)

          • DouglasECotton says:

            What would be the SLR if there were no melting off any polar land-ice or glaciers? Here is your answer:

            observed thermal ocean expansion due to warming (1.1 [0.8 to 1.4] mm per year);
            glaciers (0.76 [0.39 to 1.13] mm per year) ;
            the Greenland ice sheet (0.33 [0.25 to 0.41] mm per year);
            the Antarctic ice sheet (0.27 [0.16 to 0.38] mm per year); and
            changes to land water storage (0.38 [0.26 to 0.49] mm per year)

            How is that hilarious?

          • mpainter says:

            It’s the old pull the figures out of a hat trick. Still good for amusement.

            Tell us, what do tide gauges on stable coasts show, I pray you. Or perhaps it never occurred to you to check the tidal gauges.

          • geran says:

            How do the ice sheets and glaciers cause SLR if they are not melting?

            Hilarious.

          • DouglasECotton says:

            As expected, disbelieve the data, discredit the experts, yadda yadda yadda.

            Glaciers around the world have not been retreating? Is that what you believe?
            Hilarious.

          • mpainter says:

            NOAA Mean Sea Level Trends for tidal gauges on stable coasts show little or no SLR for thirty years. Go look, Mr. Yadayada.

          • geran says:

            As usual, the clowns cannot even understand the question: “The question, to always pose to them, is what would be the SLR if there were no melting off any polar land-ice or glaciers?”

            The point is, they do not know what the natural SLR is. So, any SLR they find is, in their beliefs, only due to AGW.

            Hilarious.

          • David Appell says:

            The Zwally 2015 is an outlier — it won’t be the last word. Many scientists disagreed with it when it came out, and Zwally was a co-author on a paper just three years ago that found an overall negative mass balance in Antarctica.

            Shepherd, A., E. Ivins, G. A, et al. 2012. “A Reconciled Estimate of Ice-Sheet Mass Balance.” Science, 338 (6111): 1183-1189 http://www.sciencemag.org/content/338/6111/1183

          • David Appell says:

            geran wrote:
            “The question, to always pose to them, is what would be the SLR if there were no melting off any polar land-ice or glaciers?”

            How is that relevant, let alone hilarious? It’s like asking how fast would your car go if it had no gas pedal.

          • geran says:

            Hi Davie!

            So what is your answer? What is the natural SLR, without any melting of glaciers, or polar ice sheets?

          • David Appell says:

            It’s a silly question, because you can’t have thermal expansion due to higher temperatures without also melting of glaciers.

            “Global sea level is currently rising as a result of both ocean thermal expansion and glacier melt, with each accounting for about half of the observed sea level rise, and each caused by recent increases in global mean temperature.”

            https://nsidc.org/cryosphere/sotc/sea_level.html

          • DouglasECotton says:

            “What would be the SLR if there were no melting off any polar land-ice or glaciers?”

            Using the numbers I quoted, you would have:
            -observed thermal ocean expansion due to warming (1.1 [0.8 to 1.4] mm per year);
            – changes to land water storage (0.38 [0.26 to 0.49] mm per year)

            i.e. an average value for the total of +1.48 mm per year.

            How hard was that?
            And so what?
            Some people are obtuse.

          • mpainter says:

            For those who are interested, Climate Audit posted on Antarctic Ice Mass Controversies, December 2. Steve McIntyre surveys the specialist literature on the subject and shows that the critical metric in calculating Antarctic ice mass balance is GIA, glacial isostatic adjustments. He also gives a thorough review of the Zwally study. A very informative post on a topic that is the purview of “specialists”.

          • geran says:

            Hilarious!

            Note the clowns cannot answer the simple question.

            Sea levels are constantly rising due to natural causes. Thousands of rivers and streams bring thousands and thousands of tons of sediment into the ocean basins. The ocean bottoms are filled with tons and tons of bones from dead animals. Dust storms bring tons into the oceans. Dust from space continually falls into the oceans. Ocean floors have thousands of volcanic lava vents, spewing tons and tons of material.

            As more mass gets added to the oceans, sea levels rise. It’s called “Archimedes’ Principle”.

            The clowns want to declare these basic facts “irrelevant”.

            Hilarious!

          • DouglasECotton says:

            Ha ha ha ha ha ha ha..

            This is now my favourite denier explanation (courtesy of geran) for the observed sea level rise:
            “Sea levels are constantly rising due to natural causes. Thousands of rivers and streams bring thousands and thousands of tons of sediment into the ocean basins. The ocean bottoms are filled with tons and tons of bones from dead animals.”

            !!!!!!

          • David Appell says:

            geran wrote:
            “Sea levels are constantly rising due to natural causes.”

            And why is the rate of sea level rise accelerating?

            Why did it average 0.2 mm/yr for 5000 years before the industrial era, but is now 16 times greater?

          • geran says:

            3.2 mm/year = 32 cm/century = 12.6″/century

            Hilarious!

          • David Appell says:

            “A 20th century acceleration in global sea-level rise,” John A. Church and Neil J. White, Geophysical Research Letters, v. 33, L01602, doi:10.1029/2005GL024826, 2006GRL (2006).
            http://onlinelibrary.wiley.com/doi/10.1029/2005GL024826

            “Global and regional sea level change during the 20th century,” Manfred Wenzel and Jens Schrter, JGR-Oceans, (7 Nov 2014) doi:10.1002/2014JC009900.
            http://onlinelibrary.wiley.com/doi/10.1002/2014JC009900/abstract?campaign=woletoc

            Sea-Level Rise from the Late 19th to the Early 21st Century, John A. Church and Neil J. White, Surveys in Geophysics, September 2011, Volume 32, Issue 4-5, pp 585-602, doi: 10.1007/s10712-011-9119-1.
            http://link.springer.com/article/10.1007%2Fs10712-011-9119-1

          • Slipstick says:

            mpainter,
            Thank you for the citation. A most interesting paper, although I’m surprised you referred to it since the analysis relies so heavily on satellite altimetry, which you have repeatedly dismissed as too inaccurate to be useful.

            I would be surprised to find the Greenland mass is increasing since, in fact, it is losing, on average, in excess of 200 Gt/yr. I can not find a single reference that indicates otherwise; I would be pleased if you could provide one.

            Even if Antarctica is still gaining the 82+/-25 Gt/yr reported for 2003-2008 in Zwally, 2015, that still leaves more than 100 Gt/yr of Greenland water mass that is not accumulating in Antarctica, not to mention the mass of all the other glaciers receding globally. So the question remains, where did all the water go?

          • mpainter says:

            Icesat used laser altimetry, and you do not seen to grasp the difference between a stable ice sheet and and the bounding main. You still have lots to learn, slapstick. Jason is a different satellite. Your obtuseness is tiresome.

            Did you never check on what the NASA Jason website says about Jason’s accuracy? Apparently not.

            Yes, accumulation exceeds melt in Greenland. See DMI for details. Mass loss is due to glacial calving at tidewater. The squawks about Greenland melting are just more shrill, baseless alarmism. Accumulation in the interior is up because precipitation is up. Calving rates depend on glacier velocity, largely.

            The ocean basins are, in effect, expanding because of GIA at continental margins. The referred post, and commentary, at ClimateAudit will help your understanding on this. Go read up, and educate yourself, why not.

            The take home lesson is that for both Greenland and Antarctica the final determinant is glacial isostatic adjustments which are applied to the satellite data and these are poorly constrained. It is naive, imo, to put any stock in mass balance figures for icecaps.

          • geran says:

            Finally, Davie parades out his pseudoscience papers!

            I mean, at 12″/century, we’re talking almost 2 feet since Ellis Island was the drop off for European immigrants. Maybe that’s why Ellis Island is now underwater! (sarc)

            Davie, your pseudoscience is just plain psilly!

          • Gordon Robertson says:

            @the impersonator DougECotton… “Glaciers around the world have not been retreating?”

            The glaciers in the Himalaya are apparently not retreating. The Khumbu ice fall, the end of the glacier breaking off the Western Cwm on Everest, is about where it was in 1953 when Hillary climbed Everest.

            I see you alarmists are taking a cue from your favourite website, skepticalscience, and impersonating other people. The owner was caught impersonating physicist Lubos Motl.

            Are you dressing up in Nazi uniforms as well?

          • Slipstick says:

            mpainter,
            Your confirmation bias is a wonder behold. Half truths and badly rationalized rejection of any data that conflicts with your beliefs with simultaneous acceptance of data obtained through similar means that agrees with your beliefs do not constitute a valid argument.

            Regarding radar altimetry, there is a secret mathematical technique that allows measurements to have a precision significantly better than an instrument’s error; it’s called “averaging”. Also, this bit of magic, along with others, allows you to perform trend analysis on time varying signals, such as the “bounding main”.

            You failed to provide any reference for an increase in Greenland ice mass. What has increased in Greenland is the SURFACE Mass Balance (SMB), the input of precipitation along with surface melting and refreezing, not the total mass balance, which is grossly negative; to represent otherwise demonstrates either ignorance or intellectual dishonesty. You cited DMI; here is a quote from their page on SMB:
            “If climate changes, the surface mass balance may change such that it no longer matches the calving and the ice sheet can start to gain or lose mass. This is important to keep track of, since such a mass loss will lead to global sea level rise. As mentioned, satellites measuring the [Greenland] ice sheet mass have observed a loss of around 200 Gt/year over the last decade.”

            The fact is that many teratons of water have flowed, and continue to flow at a quickening pace, into the oceans over the last quarter century, from Greenland and all over the planet, and that, combined with thermal expansion of the oceans due to rising temperatures, make it physically impossible that the MSL is not rising.

            Your contention that isolated tidal gauges covering one segment a fraction of a percent of the Earth’s coastlines is somehow representative of the global MSL is simply ludicrous. But, even if that was valid, the gauges on the west coast of the U.S., in aggregate, show a clear positive trend, although your bias may be preventing you from seeing it.

            What is truly tiresome is your constant flow of unnecessary and childish insults to me and others, no doubt necessary to assuage the cognitive dissonance that your ill-supported beliefs engender.

          • geran says:

            Slippery says: “The fact is that many teratons of water have flowed, and continue to flow at a quickening pace, into the oceans over the last quarter century, from Greenland and all over the planet, and that, combined with thermal expansion of the oceans due to rising temperatures, make it physically impossible that the MSL is not rising.”

            Slip, when all of that water boils away, as implied by alarmist pseudoscience, sea levels will then drop.

            There, now you can sleep well…

          • David Appell says:

            geran wrote:
            “I mean, at 12″/century, were talking almost 2 feet since Ellis Island was the drop off for European immigrants.”

            What makes you think future sea level rise will be linear in time?

        • ehak says:

          So the Antarctic is gaining mass. Well, that means more of the sealevel rise is because of thermal expansion. More heat accumulation.

          http://www.cmar.csiro.au/sealevel/images/CSIRO_GMSL_figure.png

          • mpainter says:

            You sound confused, Kyle Hilburn, by translating the removal of circa 100 cubic km from the ocean, as ice, into a rise in SL.

            Sea Level gauges on stable coasts show no SLR. Your link is a joke. Jason altimetry is accurate to within 33 mm, as given by NASA. Do you call yourself a scientist or a propagandist?

          • ehak says:

            Your assumptions on the Antarctic mass balance does not negate the sealevel measurements. You cannot measure sealevel rice with estimates of mass balance in Antartic. But if your assumptions are correct, more of the sealevel rise is because of thermal expansion.

          • mpainter says:

            Well Kyle, the gain of ice mass in Antarctica represents ocean volume reduction and explains the lack of SLR, as evinced by tidal gauges on stable coasts.

            Satellite altimetry is simply not accurate enough to yield reliable SL data within “several millimeters”. Tidal gauges on stable coasts yield reliable SL data and show a flat trend. See NOAA Mean Sea Level Trend for US west coast gauges.

            As I explained to “slapstick” above, for glaciers and icecaps, it is a matter of mass balance. Warmer SST >>>> greater rates of accumulation. This explains why there has been no SLR this century.

          • ehak says:

            According to mpainter this shows no SLR:

            http://www.cmar.csiro.au/sealevel/images/CSIRO_GMSL_figure.png

            Really something. All those gauges have been corrected for land sinking og rising. According to the gauges on the US West coast SLR is happening there as well.

            http://i.imgur.com/donmgQa.png

            Ps: Stop using the name Kyle Hilburn. I don’t know the guy so for my part it does not matter much. But it might be more troublesome for him that his name is used by the anonymous mpainter.

          • mpainter says:

            Prove that you are not Kyle Hilburn, until August this year employee of RSS.

            Your link is egregious and uses spurious data to achieve a spurious SLR. You ignore my comments above because you cannot refute them.

            I am willing to wager that you have never examined NOAA Mean Sea Level Trends, nor visited the NASA Jason website to get their stated accuracy of Jason altimetry. I am also willing to bet that you have no idea how Jason is calibrated to what NASA calls “ground truth”.

          • ehak says:

            I have of course no obligation to prove that I am not a person mpainter deludes me to be. I have worked long enough in psychiatric health care to know that paranoid delusional persons will believe such an effort is nothing else than proof that their delusions are true.

            mpainter’s ignorance is just staggering. Law of big numbers mpainter. And if you are concerned about accuracy of measurements why not ask Spencer about the accuracy of the MSU/AMSU measurements.

            I did check the numbers for the SLR on the west coast. The image is lifted from the page you promoted. They confirm the satellite altimetry for the same area.

            Just as a check of your knowledge: What is the rate of subsidence for the east coast of USA? Take New York.

          • mpainter says:

            Kyle Hilburn says: ” I have of course no obligation to prove that “###
            Yeah you do.

            NOAA Mean Sea Level Trends. Ignore the trend line superimposed over 100 years of data. Eyeball the last thirty years, and you will see a flat trend. You seem like a dull boy.

          • Gordon Robertson says:

            @ehak…”why not ask Spencer about the accuracy of the MSU/AMSU measurements”.

            No need to, any errors were fixed back in 2006 and the errors were within the stated error margin.

          • ehak says:

            mpainter is truly delusional. .. “Yes you do”.

            Which tide gauges are you referring to mpainter? You do not even have the balls to give that tiny bit of information. Another bit of information mpainter will never dare to give is the rate of subsidence of the east coast. mpainter is a true coward.

            mpainter could of course also tell us what is the accuracy of laser altimetry used by Zwally. In addition to the radar altimetry Zwally combined with the laser altimetry. First half radar, second laser. The accuracy is a big problem for sealevel altimetry. But not for the icesheet altimetry.

            Amusing one might say.

          • mpainter says:

            Hilburn: start with Vancouver, work south. Pay close attention: the last thirty years;ignore the trend line superimposed over that; Mean Sea Level Trends, got that? These are data plots, here, I’ll repeat for your benefit: Mean Sea Level Trends.

            Some sites show local subsidence. Neah Bay shows uplift. But Vancouver, Seattle, San Francisco, Monterey, San Diego, and other sites show a flat trend for thirty years, more or less. Let’s see if you are as stupid as slapstick.

            East coast subsidence. Do you know the difference? It varies locally. I explained it above. South of Chesapeake Bay Mean Sea Level Trends are flat: Wilmington, Charleston, others.

            You want a SLR? Check out Grande Isle, La. There the SL rises 9 mm/year, Hot Dog! But down the coast at Sabine Pass, the trend has been flat for over twenty years. Intelligence test for you, Hilburn: which do you believe?

          • mpainter says:

            You are garbled on altimetry. Besides, the critical metric is GIA. Do you need it explained? Probably.

          • ehak says:

            Those adjustments of UAH have very little implications for the accuracy of the measurements. The biggest contributor for the change was correction for diurnal drift. A drift correction they argued strongly against only a year ago.

          • mpainter says:

            Now Hilburn desperately tries to shift the thread to a subject he knows.

          • ehak says:

            mpainter says:

            “start with Vancouver”

            As I said, excellent agreement with satellite altimetry:

            http://sealevel.colorado.edu/content/map-sea-level-trends

            Big ditch by now mpainter?

          • mpainter says:

            Well, Kyle, you have linked to heaven knows what for who knows why. I rest my case.

          • David Appell says:

            Painter: ehak wins handily on this one. He presented data — global, even — and you did not. You lose, ehak wins:

            http://www.cmar.csiro.au/sealevel/images/CSIRO_GMSL_figure.png

          • mpainter says:

            Comrade Hilburn, shake hands with comrade Appell. Comrade Appell is a stalwart for the Cause. He will support your every comment, no matter how stupid it is. You may embrace.

          • David Appell says:

            Painter: try to retain your dignity even in defeat. You will need it for a later battle.

          • mpainter says:

            David, no need to pucker your poor, unhappy forehead over my ability to present solid science to the likes of global warmers, nine of whom show any grasp of basic truths of science.

          • mpainter says:

            Correction: none of whom

            And you can guess whom is included in that.

          • ehak says:

            Just to expand on the west coast tidal gauges. According to mpainter those are the only stable gauges in the world.

            Big irony there. Church & White have used those gauges as well when producing this:

            http://www.cmar.csiro.au/sealevel/images/CSIRO_GMSL_figure.png

            But they have of course checked for subsidence or uplift. The land where those gauges are in areas where the land is SINKING!! So the sea level rise measured from those gauges are LOWER than what you get when using those measurements without a correction. Like from this page:

            http://tidesandcurrents.noaa.gov/sltrends/sltrends.html

            mpainter is using data that show too much increase because the data is not corrected for subsidence. The problem with this:

            http://www.cmar.csiro.au/sealevel/images/CSIRO_GMSL_figure.png

            must be too small sea level rise.

            Hilarious. Poor mpainter.

          • mpainter says:

            Kyle A. Hilburn (aka ehak, the hak being initials reversed) says:

            “Hilarious. Poor mpainter.”

            Yes, hilarious, although not for the reason Hilburn imagines.

            He says that after demonstrating that he cannot figure out that a subsiding tidal gauge registers a RISING sea level, albeit spurious if used for determining a general SLR, worldwide. He garbled a lot, but he indicated that a subsiding gauge needed to be corrected downwards, thus doubling the error. “Poor mpainter” he says. 🙂

            Hilburn reportedly left RSS last year as a disgruntled employee. We now have some insight into the cause of his disgruntlement.

          • mpainter says:

            I should clarify: those west coast gauges that show a flat sea level trend for the past 30 years or so are located on stable coasts, not subsiding coasts, as Hilburn claims, hence no correction is required. For those who miss the point, these gauges reliably reflect actual sea level trends in a general, worldwide, sense.

            The sea level data of a gauge on a subsiding coast should be disregarded when determining a general, worldwide sea level trend. In fact, only one tidal gauge is needed for that, IF that gauge is located on a stable coast.

          • Toneb says:

            “He says that after demonstrating that he cannot figure out that a subsiding tidal gauge registers a RISING sea level, albeit spurious if used for determining a general SLR, worldwide. He garbled a lot, but he indicated that a subsiding gauge needed to be corrected downwards, thus doubling the error. Poor mpainter he says.”

            Oh dear Painter I fear your D-K is getting the better of you again (I assume you do have a better? as it’s not visible in your nasty responses here).

            Reading comprehension my friend seems to be another failing of yours.

            I demonstrate ….

            Ehak says….

            “So the sea level rise measured from those gauges are LOWER than what you get when using those measurements without a correction”

            The operative word in the above is “WITHOUT”.
            Clue: it’s a double negative.

            ie: WITHOUT a correction tide gauges on sinking land are (say) 10
            Land sinking (say) 2 so 10-2
            THEN WITH a correction = 8

            So indeed “..are LOWER (corrected value = 8) than what you get when using those measurements without a correction (=10)”.

            Do try to keep up and, as they say, “when in a hole – stop digging”.

            But then if you did, you wouldn’t get anywhere … mind it does seem that you only require to do so to inflate you own self aggrandizing ego.

            “So prove me wrong”
            We do it all the time my friend … it’s called science.
            Your hand-waving doesn’t count, sorry.
            At least to people other than the converted.

            But as I’ve told you before – talking with you is to enter an alternative universe that Mr twain warned us of.
            Now you know the rules, eh?
            From here on you just have to keep digging to save face in front of the converted, as I’ll be calling out your bollocks in the next thread.
            Ta Ta for now my DK friend.

          • mpainter says:

            Toneb says that he is confused too, although he is not sure just exactly how. But there is one thing he’s sure of: mpainter is a miscreant denier.

          • ehak says:

            mpainter goes on:

            “I should clarify: those west coast gauges that show a flat sea level trend for the past 30 years or so are located on stable coasts, not subsiding coasts, as Hilburn [I don’t correct that; mpainter is after all delusional] claims, hence no correction is required. For those who miss the point, these gauges reliably reflect actual sea level trends in a general, worldwide, sense.”

            Well. Those gauges have been corrected so the show LESS increase when used in this:

            http://www.cmar.csiro.au/sealevel/images/CSIRO_GMSL_figure.png

            So now mpainter must be saying that those estimates of sea level rise are biased LOW. SLR must be higher.

            Of course there is more:

            “The sea level data of a gauge on a subsiding coast should be disregarded when determining a general, worldwide sea level trend. In fact, only one tidal gauge is needed for that, IF that gauge is located on a stable coast.”

            That presupposes of course that SLR is uniform over the whole world. Which of course is impossible. Ex. nino/nina. And if mpainter want to use one of the most stable coasts (more stable than the US west coast) he can pick this:

            http://tidesandcurrents.noaa.gov/sltrends/sltrends_station.shtml?stnid=9759110

            Watch the acceleration.

          • mpainter says:

            No, mpainter says refer to the NOAA Mean Sea Level Trends for individual tidal gauges located on stable coasts, which show no SLR for the past thirty years or so.

            I have been referring to the general, worldwide sea level trend over decades, Hilburn, not to local, temporary variation as El Nino. You are rather thick. I repeat, one tidal gauge suffices for the long term trend, if that gauge is located on stable coasts.

            Looks like the boy child done fizzled. How about that.

        • mpainter says:

          For the benefit of those who are not stupid, from the NASA website:

          From its vantage point 1336 kilometers (830 miles) above the Earth, the US/European Jason-1 and OSTM/Jason-2 ocean altimeter satellites measure the height of the ocean surface directly underneath the satellite with an accuracy of 4-5 centimeters (better than 2 inches). Traveling in excess of 7 kilometers (4 miles) every second as they trace out an orbit, the spacecraft cover the global oceans every 10 days (the “repeat period” of the satellite orbit).

          TOPEX/Poseidon Measurement System The accurate determination of the ocean height is made by first characterizing the precise height of the spacecraft above the center of the Earth. This is achieved through a technique called “precise orbit determination” (POD), of which satellite-tracking information is the most important ingredient. The baseline tracking system for these satellites is the onboard NASA retroreflector array, which serves as a target for 10 to 20 satellite laser ranging (SLR) stations that dot the Earth’s surface. The CNES DORIS (Doppler Orbitography and Radiopositioning Integrated by Satellite) system provides an important additional set of tracking data. Anchored by about 60 ground stations, the DORIS receiver measures the Doppler shift of microwave signals to support POD. NASA’s experimental GPS receiver systems onboard the spacecraft provide precise, continuous tracking of the position by monitoring range and timing signals from up to 12 GPS satellites at the same time. In order to produce accurate estimates of the satellite orbital height, POD combines the satellite tracking information with accurate models of the forces (e.g., gravity, aerodynamic drag) that govern the satellite motion. For these missions, this process supports the determination of the satellite orbital height with an accuracy of about 1 centimeters (0.5 inches).

          animated gif showing sea surface measurement The second component of the ocean height measurement is the range from the satellite to the ocean surface. Each spacecraft carries a radar altimeter that provides this information: the CNES Poseidon-3 instrument, the latest model on OSTM/Jason-2, emits microwave pulses at frequencies of 13.6 and 5.3 GHz.. To take a measurement, the onboard altimeter bounces these pulses off the ocean surface and measures the time it takes the pulses to return to the spacecraft. This measurement, multiplied by the speed of light, gives the range from the satellite to the ocean surface. After correction for atmospheric and instrumental effects, the range measurements are accurate to less than 3 centimeters. The range measurements are subtracted from POD-derived estimates of the satellite orbital height, resulting in ocean height measurements that are good to 3 centimeters (just over 1 inch) relative to the center of the Earth.

          This accuracy figure pertains to a few-kilometer spot on the ocean surface directly beneath the satellite. By averaging the few-hundred thousand measurements collected by the satellite in the time it takes to cover the global oceans (10 days), global mean sea level can be determined with a precision of several millimeters.

          To verify the accuracy of measurements independently, CNES and NASA each established a verification site along the ground track of the satellite. The CNES verification site is on the French island of Corsica in the Mediterranean Sea; the NASA site is on the Harvest, an offshore oil rig at the eastern entrance to the Santa Barbara Channel, off the coast of central California. Each site is equipped with tracking systems (e.g., GPS, SLR) that enable accurate surveying of the stations into the reference frame that underlies the satellite orbit computations (POD). This survey information is combined with local measurements of the water level (from tide gauges) to derive an independent estimate of the ocean height relative to the center of the Earth. Every 10 days the Jason-1 and OSTM/Jason-2 satellites fly directly overhead, and the two independently derived measurements of the instantaneous sea level (satellite vs. “ground truth”) are compared in an analysis called “closure.” With sufficiently redundant instrumentation at the experiment site, along with careful monitoring of potential systematic errors, any unexpected mismatch between the satellite and “ground truth” measurements can be attributed to an error in the satellite measurements. The “closure” data from Corsica and Harvest, along with similar information from other verification sites and observing programs, are used to continuously monitor the performance of these ocean altimeter satellite measurement systems

          • mpainter says:

            Slapstick is too stupid to understand that NASA knows what it is talking about. The computed SLR within one tenth mm that one sees, through the purported use of Jason data, is nothing but a joke. Slapstick is a brainless child to believe that such measurements are to be taken seriously.

            Slapstick is too stupid to realize that one tidal gauge is all one needs to determine a general, worldwide rise in sea level, IF that gauge is situated on a stable coast. From slapstick above: ” Your contention that isolated tidal gauges covering one segment a fraction of a percent of the Earths coastlines is somehow representative of the global MSL is simply ludicrous.” Slapstick is too stupid to read NOAA Mean Sea Level Trends for west coast gauges, which show a flat SL trend for thirty years, more or less, at Vancouver, Seattle, San Francisco, Monterey, San Diego, and other sites.

            Slapstick is stupid. He lacks comprehension and cannot understand my comments, misrepresentation is all he is capable of.

          • mpainter says:

            This slapstick is a stupid fellow. On a previous thread, several months ago, he insisted that ARGO floats provided sea level data. When I explained to him that this was not so, and referred him to the ARGO site which gave explicit information on ARGO floats and their data, slapstick insisted.that.ARGO.gave.sea.level.data.

          • mpainter says:

            Slapstick does not understand the difference between radar altimetry, used by Jason, and laser altimetry, used by IceSat. I tried to clue him on this, but he remains clueless as to the difference and likewise to the considerably greater accuracy of the IceSat laser altimetry. He never attempts to inform himself on subjects that he makes public comments on. Stupid.

          • mpainter says:

            Grace satellite gravimetric determination of mass balance of the Antarctic and Greenland ice sheets is tricky, as the satellite data is factored by a GIA, and this step is the actual determinant of mass balance for those ice sheets. VERY tricky, because the GIA (glacial isostatic adjustments) are largely guesswork which yields doubtful results.

            Bottom line: Greenland and Antarctic ice sheet mass balance figures are doubtful, and good only for propaganda purposes. But try explaining to Slapstick how doubtful glacial isostatic adjustments are when these lack constraints. He has a fit, and accuses you of nefarious confirmation bias. Poor, dumb fellow.

          • mpainter says:

            Here slapstick gives the sum total of his grasp of satellite altimetry:

            “Regarding radar altimetry, there is a secret mathematical technique that allows measurements to have a precision significantly better than an instruments error; its called averaging. Also, this bit of magic, along with others, allows you to perform trend analysis on time varying signals, such as the bounding main.

            Compare this drivel with the NASA copy above:
            “…the US/European Jason-1 and OSTM/Jason-2 ocean altimeter satellites measure the height of the ocean surface directly underneath the satellite with an accuracy of 4-5 centimeters..”

            Note “4-5 centimeters” reflecting the uncertainty that the scientists feel about even quantifying the error of Jason data. This makes no impression on slapstick, poor, dumb fellow.

          • ehak says:

            So they use stable gauges to monitor the satellite altimetry. Looks like mpainter likes to contradict himself. And again: mpainter heralded Zwally who used radar altimetry. Another contradiction.

            If mpainter still do not have a grasp of the effect of averaging on accuracy, have a look here.

            http://moyhu.blogspot.nl/2015/02/surface-temperature-global-average-is.html

            That is an example of what happens when reducing daily temperature measurements to +-1 deg/C monthly or +-5(!) deg/C daily.

            If mpainter somehow suddenly got the intellectual capacity he could do this experiment for himself. He could produce his own series with different levels of measurement accuracy and check the effect of averaging. This is very basic statistics.

          • mpainter says:

            Hilburn is still confused. Zwally used IceSat data.

            Hilburn says NASA is wrong about Jason accuracy. He says he knows better than NASA scientists because he does statistics. But flunks intelligence tests.

            Yep, Jason is keyed to a tidal gauge on Harvest Platform. NASA calls it “ground truth”…oops. Where is Harvest, Hilburn? Offshore California?…ooops.
            And what is the Mean Sea Level Trend for that NASA operated tidal gauge?…oooops

            I know that I’ll have to spell it out for you, so: the NASA operated tidal gauge on Harvest Platform has the same Mean Sea Level Trend as the west coast NOAA gauges on stable coasts….ooooops.

            SLR RIP

          • ehak says:

            mpainter:

            Of course Zwally use laser altimetry. Already said so. And radar alitmetry:

            “We use radar-altimeter measurements of dH/dt by European Remote-sensing Satellites 1 and 2 (ERS-1/-2) for the period 19922001 and satellite laser-altimeter measurements by the Ice, Cloud and land Elevation Satellite (ICESat) for 200308 ”

            Continue the denial. Amusing.

            And please continue to show your complete ignorance of basic statistics. The effect of averaging.

          • mpainter says:

            I rely on NASA for the accuracy of Jason. You claim that I am mistaken to do so, while muttering about my neglect of “statistics” and “averages”. But in fact, you are attributing the neglect to NASA.

            So prove it. Prove that NASA has neglected statistical considerations in their computation of Jason accuracy.

          • mpainter says:

            And if you can’t show where NASA has neglected to employ proper statistical technique in their computation of the accuracy of Jason data, you need to think again. Of course, this doesn’t mean you will.

            How about that flat sea level trend on the Harvest Platform in Santa Barbara Channel? See what you can learn here if you only pay attention?

          • slipstick says:

            mpainter,

            You may want to investigate “averaging” and the difference between accuracy and precision before continuing.

            By the way, Zwally 2015 uses ERS, as well as ICEsat, data; ERS has a radar altimeter. Your failure to mention this while dismissing radar altimetry is yet another half-truth.

            Please provide a reference showing the ice mass gain in Greenland you claimed. Since that will be impossible, the question remains:
            Where did the water go?

          • slipstick says:

            mpainter,
            By the way, if you think I am intimidated or disheartened by your childish, ad hominemic tantrum, you are mistaken.

          • mpainter says:

            Slapstick, the water went to the tidal gauge on the Harvest Platform, off the coast of California in the Santa Barbara Channel, maintained by NASA for the purpose of
            CALIBRATING

            Jason satellites. This is what NASA calls “ground truth”, and Jason altimetry is checked every ten days when it orbits directly overhead this platform and its instruments. This is all explained in the excerpt copied above from the NASA website.

            But slapstick, I am supremely confident that you, in your infatuated stupidity, will never figure out what

            GROUND TRUTH MEANS.

          • mpainter says:

            In your stupidly, you misread my comment concerning Greenland mass balance, slapstick. Go read it again, about 40 or 50 times, or until you finally grasp its meaning.

          • Slipstick says:

            mpainter,
            If I am as stupid as you contend, obviously I will never be able to comprehend the expressions of your towering intellect, so we had best keep this simple.

            On the Earth, over the last quarter century, has there been a net transition of land ice to liquid water?

            So that I don’t become confused, please confine your answer to a simple “yes” or “no”.

          • mpainter says:

            Slapstick, if you can correctly explain the full implications of NASA’s “ground truth” for Jason altimetry, then you will have shown that you are capable of learning and commanding your intellect.

            But, I doubt you can do so; I doubt that you be able to push aside the global warming imp who operates the levers and knobs of your brain.

            So prove me wrong.

          • Slipstick says:

            You did not answer the question.

          • mpainter says:

            Yes, I answered your question upthread. You ignored my answer. I copy that answer and your response:

            mpainter says:
            January 5, 2016 at 12:32 PM
            Hold off on the handwringing, anyway, for the reasons which I gave above.

            Concerning glacier melt, it goes back on the glaciers. Its called mass balance. For example, Antarctica gains about 100 gt/year of ice, according to the latest NASA study. This despite the fact that it loses several times that figure, annually, through ice loss (melt).

            And there you have it, slapstick, facts that heretofore have not found their way past the shutters on your skull. More reasons not to wring your hands. Pesky Ma Nature, doggone her.

            Reply
            Slipstick says:
            January 5, 2016 at 1:51 PM
            I would be most interested if you could provide a citation for this latest NASA study, since everything Ive seen indicates a mass balance on the order of -tens of gt/yr for Antarctica.

            Also, I find it fascinating that the majority of the water from the receding glaciers around the globe disappeared via sublimation and then precipitated over the Antarctic. I guess water flowing from glaciers is an optical illusion.
            ###

            Slapstick,you are a wondrous display of obtuseness and reading incomprehension. My description of you as “stupid” may have seemed like a deliberate insult, but in fact it was no insult. It was a description of your dominant mental trait. I leave it to others to determine whether I have described you correctly.

            Slapstick, you might consider what I have been saying about your stupidity. If you are aware of the problem, you can attempt a remedy. If you are unaware of the problem, or ignore it, there can be no remedy.

          • Slipstick says:

            mpainter,
            That response is not an answer to the question “On the Earth, over the last quarter century, has there been a net transition of land ice to liquid water?”; it is an evasion. But I did not really expect a direct answer, as that would require you to confront the fact that if there is a net loss of global ice mass, barring massive transport of water off-planet, the global mean sea level must rise and your contention that it has not risen does not “hold water”, so to speak.

            As to the accuracy of the mean sea level measurements by satellite radar altimetry, the accuracy of 4-5 centimeters you bandy about is for a single measurement. You apparently missed the following from the JPL page you quoted upthread, “By averaging the few-hundred thousand measurements collected by the satellite in the time it takes to cover the global oceans (10 days), global mean sea level can be determined with a precision of several millimeters.” Further, this precision is improved in trend analysis and trend products from these programs are reported with an error of +/-0.4 mm. Also, you misinterpret the meaning of “ground truth”; it is used for comparison, detection of drift, and dynamic correction. The absolute calibration of the radar altimeter and MSL measurements are relative to the GPS frame of reference, not the tidal gauges at the calibration sites. Representative conference reports on the calibration are available here:
            http://www.aviso.oceanobs.com/fileadmin/documents/OSTST/2013/oral/Haines_harvest_2013.pdf
            http://www.aviso.oceanobs.com/fileadmin/documents/OSTST/2013/oral/Bonnefond_et_al-OSTST-2013.pdf
            http://www.aviso.oceanobs.com/fileadmin/documents/OSTST/2010/oral/Bonnefond.pdf
            I include the third, older report, since it shows the cross comparison from one mission to the next.

            Your conjecture that you can determine the global mean sea level from isolated tide gauges scattered along a single small segment of coastline would be valid only if the entire “container” and volume was stable and not subject to numerous local effects of temperature and forces from Coriolis to tectonic, tides at the gauges were unaffected by local conditions such as topography and currents, and volume changes propagated quickly and equally throughout the entire volume, none of which are true. To use gauges to determine mean sea level on Earth requires samples around the globe, including gauges in the open ocean.

            You asked me to prove you wrong. QED

          • Slipstick says:

            mpainter,
            Another thought, if you could determine the global mean sea level more accurately from a small sample of tide gauges, why have a satellite radar altimetry program?

          • mpainter says:

            Slapstick says Jason “ground truth” is not the Harvest tidal gauge. From the NASA excerpt above:

            This survey information is combined with local measurements of the water level (from tide gauges) to derive an independent estimate of the ocean height relative to the center of the Earth. Every 10 days the Jason-1 and OSTM/Jason-2 satellites fly directly overhead, and the two independently derived measurements of the instantaneous sea level (satellite vs. ground truth) are compared in an analysis called closure. With sufficiently redundant instrumentation at the experiment site, along with careful monitoring of potential systematic errors, any unexpected mismatch between the satellite and ground truth measurements can be attributed to an error in the satellite measurements.

            ###

            Slapstick, your stupidity is very, very tiresome. Jason is keyed to a tidal gauge on the Harvest Platform. Says NASA. Your stupidity and reading incomprehension is beyond belief, and I am weary of dealing with it.

            Once again, NASA is my authority on Jason accuracy. Your dispute is with NASA. Go explain to those who computed Jason accuracy that they are all wrong.

            Jason is “ground truthed” to a tidal gauge, says NASA. Argue with them.

            West coast tidal gauges show no sea level rise for thirty years. Argue with them.

          • Slipstick says:

            As should be clear from what I wrote above, I have no dispute at all with NASA (JPL), or its stated precision of satellite mean sea level measurements of “several millimeters”, or with its trend analysis showing a sea level rise of 3.38 mm/yr as of September 2015 ( http://climate.nasa.gov/vital-signs/sea-level/ ).

            Since you have nothing to offer than misstatements of what I, as well as JPL, wrote or repetition of points which I have already disputed, I consider this particular discussion at an end. Be well.

          • mpainter says:

            Seems that NASA argues with itself. A Jason altimetry accuracy of “several millimeters” translates into 3.68 mm/year SLR. And slapstick,the true believer, believes. Right out to the second decimal point.

            Tell us, slapstick, how many mm is “several mm”?

            Slapstick does not believe just anything. He dose not believe NOAA Mean Sea Level Trends for stable coasts.

            Nor does he believe NASA when it says Jason altimetry is keyed (NASA uses the term “ground truth”) to a tidal gauge on Harvest Platform.

          • mpainter says:

            Some may rightly wonder why I would waste my time engaging with a commenter of the caliber of slapstick.
            The answer is that he represents the AGW point of view in all its misinformed and uninformed faultiness. In other words, slapstick presents the opportunity to expose the AGW pseudoscience for what it is.

          • Slipstick says:

            mpainter,
            You are right about one thing, I don’t believe. I reason based on the evidence as presented, not misinterpreted through a filter of belief.

          • mpainter says:

            Do you believe NASA when they say Jason altimetry is keyed to the tidal gauge on Harvest? They state clearly that this is the “ground truth” used to correct Jason. Up thread, you denied this. Do still deny it?

            If you don’t,then you must accept that the Mean Sea level trend at Harvest Platform is the “ground truth” for the the whole series of Jason altimetry from its beginning. That is, if your brain can function.

          • Slipstick says:

            mpainter,
            I was not going to respond, but, once again, you misrepresent what I, and NASA, wrote.

            I cannot “fathom” your infatuation with “ground truth”.

            What you seem to fail to grasp is that the Platform Harvest “ground truth” is the sea surface height at Platform Harvest ONLY. There is another, different, “ground truth” at Corsica. These are used for cross check and dynamic correction of satellite SSH measurements. They are local measurements and have no other significance in determining global MSL, unless combined with measurements from around the globe. Also, they are corrections; the calibration standard of both the radar altimeter and the tide gauges is the GPS system.

          • mpainter says:

            Mean Sea Level Trend at Harvest is “ground truth” for Mean Sea Level Trend derived by Jason altimetry. Do you imagine that Harvest and Corsica show different SL trends these past twenty years? Bah, impossible. This is the sort of assumption that makes you look stupid.Repeat, Jason altimetry will show a Mean Sea Level Trend identical to its “ground truth” calibration. This is what you refuse to acknowledge.

            Also, you never explained how many millimeters “several millimeters” equals.

            Jason altimetry is keyed to a tidal gauge that shows a flat sea level trend. But you believe the SLR that are fudged from Jason altimetry, not the calibration.

          • Slipstick says:

            To summarize: The global mean sea level has not changed in 30 years even though upper ocean temperatures have increased and there has been a net loss of land ice mass over the same period. Also, the scientists and engineers who design and operate satellite radar altimetry systems and analyze the data are incompetent, lying, or deluding themselves, and the users of their product are stupid. Got it.

          • mpainter says:

            Tidal gauges on stable coasts show a flat trend in sea level for thirty years, more or less. See NOAA Mean Sea Level Trend charted for individual gauges on the west coast. Ignore the lengthy trend line superimposed over the last thirty years, which show no rise in sea level.

            Jason altimetry is keyed (calibrated to “ground truth”) to the Harvest Platform tidal gauge, offshore California.

            These are the sort of facts that slapstick, Hilburn, and other zealots are incapable of assimilating to their thinking, their indoctrination having rendered their thinking into rigid, inflexible dogma.

          • Slipstick says:

            One final thought: If, as you claim, Jason data is “keyed” to the “ground truth”, and Jason data shows an increasing sea level, then the “ground truth” must also show an increasing sea level.

          • mpainter says:

            The dim bulb flickers, and gets it backwards. The Harvest tidal gauge is not keyed to Jason, slapstick. Jason is keyed to the tidal gauge.You will never grasp that the Harvest Platform tidal gauge is the “ground truth”, nor the implications of that rather unyielding fact.

      • Gordon Robertson says:

        @Slipstick…”Where is the water going?”

        Has it ever occurred to you that ocean levels dropped during the Little Ice Age to feed glaciers? A glacier near Chamonix, France expanded during the LIA across a valley and wiped out a village.

        The current melt, which ended in 1998, has brought ocean levels back to normal. That’s why we have seen no coastal flooding.

        • lewis says:

          The arguments about glaciers and SLR are entertaining at best. If one takes the presumed extent of the glaciers and ice caps of 20,000 years ago and the ocean level at that time being about 250 feet lower than it is now, one can do the simple math and find that over the past 20,000 years the oceans have been rising about 1 foot per century. If the ice packs continue to melt then that is about what we would expect in the future.

          Now come the alarmists and attribute this ongoing SLR to some new fangled device of mankind.

          What if the alarmists had been around 10,000 years ago? Would they have tried to stop the glaciers from melting then?

          In all, I find their position rather trite, condescending and puerile, except that they are willing to destroy those who disagree with them.

          • David Appell says:

            Sea level rose only about a meter in the last 5000 years:

            https://en.wikipedia.org/wiki/Sea_level_rise#/media/File:Post-Glacial_Sea_Level.png

            That’s an average rate of 2 cm/century (0.07 ft/century), not a foot per century.

          • mpainter says:

            SL will fall with the next cooling trend. It is already stabilized. Subsiding coasts do nor indicate a general SLR, as the alarmists bleat.

          • David Appell says:

            Painter wrote:
            “SL will fall with the next cooling trend.”

            Probably. Unfortunately, the next cooling trend is a few millennia in the future….

          • mpainter says:

            In fact, there has been cooling since the Holocene Optimum, some 6-8,000 years ago. The last 4,000 years are known as the “Neo-Glacial” because of the return of glaciation to areas where it had been absent. In other words, this interglacial is winding down into the next ice age. We need more GHE, not less. Cooling is a killer, warming benefits all life forms.

          • mpainter says:

            East coast SLR rise is due to
            1. Local subsidence in the Chesapeake Bay area due to groundwater withdrawal.

            2. Regional subsidence of the NE US Coast due to isostatic adjustments.

            There is no sea level rise, as attested by tide gauges on stable coasts. See NOAA Mean Sea Level Trends for the west coast.

            Poor David Appell is his usual misinformed self, relying on his usual sources.

          • David Appell says:

            Of course coastal flooding is going to first show up where land is subsiding.

            But it’s showing up now, not 30-50 years ago, because sea levels are also rising.

            How much is Miami subsiding?

          • mpainter says:

            See my above comments regarding sea level, NOAA Mean Sea Level Trends, and Jason altimetry.

          • David Appell says:

            I saw your comments earlier. You presented no global data. They are irrelevant. ehak owned you.

          • mpainter says:

            No, Kyle Hilburn aka ehak read the individual Mean Sea Level Trend charts plotted for the tidal gauges at Vancouver, Seattle, San Francisco, Monterey, San Diego, and other NOAA gauge stations on the west coast. And he saw that for the past thirty years SL trends on the west coast have been flat, notwithstanding the century long trend line superimposed upon the last thirty years.

            Neah Bay shows a falling SL, but this is local uplift. A few west coast sites show subsidence, hence a falling sea level.

  6. Hunter Paalman says:

    I am always fascinated by the saw tooth nature of these averaged temperature records.

    Was 2010 really an El Nino kind of an event ? Are we really bouncing between trade wind oscillations that slosh warm surface waters from the west Pacific to the east and volcanic (or other) atmospheric cooling events ?

    ‘Tis a puzzlement !

  7. Werner Brozek says:

    RSS for December has come in at 0.543. This is the hottest December on record, however 0.543 was beaten in the first 8 months of 1998 and for 4 months in 2010. The 2015 average is 0.358, putting 2015 in third place behind 0.550 from 1998 and 0.468 from 2010.
    The pause has decreased by one month to 18 years and 8 months on RSS. Now, the pause goes from May 1997 to December 2015.

    As mentioned, UAH also came in third for 2015. The 0.44 was the hottest December on record, however 0.44 was beaten in the first 8 months of 1998 and for 2 or 3 months in 2010.

    • Gordon Robertson says:

      @Werner Brozek “RSS for December has come in at 0.543.”

      I don’t trust RSS as far as I could throw them. Anyone who colours their warming charts with bright oranges and yellows to emphasize warming is far from objective.

    • David Appell says:

      Werner, what are the statistical uncertainties for your trends?

      • Werner Brozek says:

        Werner, what are the statistical uncertainties for your trends?

        Temperature Anomaly trend
        May 1997 to Dec 2015
        Rate: -0.038C/Century;
        CI from -1.064 to 0.988;
        t-statistic -0.073;
        Temp range 0.252C to 0.244C

        If you require further information, write to Nick Stokes or see:
        http://moyhu.blogspot.com.au/p/temperature-trend-viewer.html

        • David Appell says:

          Those are some pretty bad statistics. And I find the trend over that time to be +0.01 C/decade. (The UAH data only have two significant digits.)

          The 1997-98 El Nino created a spike that was, according to the UAH data, about 0.6 C. All your calculations of “no warming for 18 years” rely on that big El Nino to force the trend downward. If you started calculating just a couple of years before or after, you’d get different (positive) results.

          In other words, you are mostly measuring natural variability — and cherry picking your starting date as well, because your choice of starting point is explicitedly chosen to give the result you want — a zero trend — whether it’s indicative of climate change or not.

          You can keep calculating the noise in the data if you want. But most of us are interested in the signal.

          • John Finn says:

            ” The 1997-98 El Nino created a spike that was, according to the UAH data, about 0.6 C. All your calculations of no warming for 18 years rely on that big El Nino to force the trend downward. ”

            That argument is now starting to wear a bit thin. On short term trends, it’s true that a spike near the start or end point of the data will strongly influence the trend but as the period lengthens the effect reduces. That’s pretty much the point of “Least Squares” regression.

            Using SKS trend calculator on RSS data:

            The trend from 1998 is -0.016 deg per decade
            The trend from 2000 is 0.025 deg per decade

            There was a big El Nino in 1998 and a deep La Nina in 2000 yet both trends are indistinguishable from ZERO. Neither is anywhere near statistically significant. The trend from 1998 is, essentially, the same as the the trend from 2000.

          • Werner Brozek says:

            (The UAH data only have two significant digits.)

            If you want UAH to 3 digits, go here, although December is not up yet:
            http://vortex.nsstc.uah.edu/data/msu/v6.0beta/tlt/tltglhmam_6.0beta4.txt

            If you started calculating just a couple of years before or after, youd get different (positive) results.

            RSS is also negative from November 2000. From WFT:
            #Time series (rss) from 1979 to 2016
            #Selected data from 2000.8
            #Least squares trend line; slope = -0.000106345 per year
            2000.83 0.249967
            2016 0.248354
            #Data ends
            #Number of samples: 2
            #Mean: 0.24916

            And I find the trend over that time to be +0.01 C/decade.

            I assume this is UAH from May 1997? What is UAH from August 1997?

          • David Appell says:

            John Finn: Again, you’re relying on short-term trends that are heavily influenced by natural variability, not trends that represent changes to climate.

          • David Appell says:

            Werner: A trend from Nov 2000 is even shorter! It’s also heavily influenced by natural variability. It is not an interval representative of climate, which would be one where natural variability averages near zero. (The WMO suggests 30 years or more.)

            Try this exercise: suppose the 1997-98 El Nino didn’t happen. Do this by replacing UAH’s average anomaly for 1998 (0.48 C) with the annual averages of the surrounding years 1997 and 1999.

            Your “pause” disappears completely! No matter how many years you go back from 2015, the trend of the annual averages from then to now is positive.

            Your pause is nothing but an artifact of the 1997-98 El Nino, that is, of natural variability.

            All you’re doing, Werner, is numerology — it has no meaning for climate science.

          • Werner Brozek says:

            A trend from Nov 2000 is even shorter!

            True. However earlier you said:

            All your calculations of no warming for 18 years rely on that big El Nino to force the trend downward.

            So the point is that I can avoid the spike but still get a pause of 15 years in the process. Of course it will be shorter since I start after the spike.

            Try this exercise: suppose the 1997-98 El Nino didnt happen.

            Done by starting in November 2000.

            All youre doing, Werner, is numerology it has no meaning for climate science.

            Many regard 15 years as nothing to sneeze at.

          • David Appell says:

            Werner: Here is a graph that shows exactly what I mean by your LT pause being a pure artifact of the 1997-98 El Nino:

            http://davidappell.blogspot.com/2016/01/lower-troposphere-pause-purely-artifact.html

          • David Appell says:

            Werner wrote:
            “Many regard 15 years as nothing to sneeze at.”

            Not scientific people.

            15-year trends aren’t relevant. Today the UAH LT 15-year trend is close to zero. In 2006 it was a whopping 0.26 C/decade, larger than expected.

            What would you have said in 2006? That global warming was clearly happening? And it suddenly stopped by 2015? It also “stopped” around 1995, according to the 15 year trend.

            So are you going to change your mind every 10 or so years?

            The periods of large LT warming balance out the periods of little LT warming. That’s why it’s the long-term trends that matters for climate change science.

          • Werner Brozek says:

            (The blue line, with no 1997-98 El Nino, shows no pause at all at that point. In fact, it’s never negative for any starting point before 2015.)

            That is only because you used: (I used annual averages to keep this simple.)

            If you use monthly averages and start in November 2000, you would get a negative slope.

          • Werner Brozek says:

            (What would you have said in 2006?)

            I did not pay much attention to this until 2009, but this is what Phil Jones said in 2005:
            Phil Jones, July 5, 2005:
            The scientific community would come down on me in no uncertain terms if I said the world had cooled from 1998. Okay it has but it is only seven years of data and it isnt statistically significant.

            As for 15 years, that seemed to be a reasonable time until it was passed. However opinions can easily vary here and it is certainly not something we can prove as to its significance.

          • David Appell says:

            Werner Brozek says:
            “If you use monthly averages and start in November 2000, you would get a negative slope.”

            False. The trend for UAH LT v6beta4 from Nov 2000 to Dec 2015 is +0.025 C/decade.

          • David Appell says:

            Werner wrote:
            “As for 15 years, that seemed to be a reasonable time until it was passed.”

            No, it never did.

            Again: UAH shows a spike of about 0.6 C for the 1997-98 El Nino. That’s at least four times the expected slope of 0.1-0.15 C/decade.

            So to measure climate, and not variability, you need an interval where warming, as determined by the trend, is something akin to the spike. That’s at least four decades.

          • Werner Brozek says:

            (False.)

            I was very clear above that I was talking about RSS.

            RSS is also negative from November 2000. From WFT:
            #Time series (rss) from 1979 to 2016
            #Selected data from 2000.8
            #Least squares trend line; slope = -0.000106345 per year
            2000.83 0.249967
            2016 0.248354
            #Data ends
            #Number of samples: 2
            #Mean: 0.24916

          • Werner Brozek says:

            (Werner wrote:
            As for 15 years, that seemed to be a reasonable time until it was passed.
            No, it never did.)

            This is a statement that supports what I said:

            Dr. Phil Jones CRU emails 7th May,2009
            Bottom line: the no upward trend has to continue for a total of15 years before we get worried.

            Interpret it as you wish.

          • David Appell says:

            Werner: Phil Jones — you didn’t even give a source to this quote — doesn’t speak for anyone but Phil Jones.

            WMO:

            Climate normals are reference points used by climatologists to compare current climatological trends to that of the past or what is considered normal. A Normal is defined as the arithmetic average of a climate element (e.g. temperature) over a 30-year period. A 30 year period is used, as it is long enough to filter out any interannual variation or anomalies, but also short enough to be able to show longer climatic trends.

            http://www.wmo.int/pages/themes/climate/climate_data_and_products.php

          • David Appell says:

            Werner, you avoided this quesion when I asked it. Please answer.

            If you think 15 years is all that’s needed to determine climate, then what did it say in 2006 when 15yr warming was 0.26 C/decade?

          • Werner Brozek says:

            (doesnt speak for anyone but Phil Jones)

            True, but do you not consider him a scientist? You said: (Not scientific people.)

            If you do not consider him a scientist, so be it. I do.

            As for the source of the quote, it was from an email he sent:
            Dr. Phil Jones CRU emails 7th May,2009
            See:
            http://theclimatescepticsparty.blogspot.ca/2014/07/quotable-warming-hiatus-quotes.html

            (In 2006 it was a whopping 0.26 C/decade, larger than expected.
            What would you have said in 2006? That global warming was clearly happening?)
            You make a good point! But keep in mind it was Dr. Phil Jones who made the comment about the significance of 15 years at a time when the MET office predicted that half of the next 6 years would beat the 1998 record.
            So let us look at the full satellite record. The warming is 0.11/decade for UAH6.0. That does not look alarming at all!
            In 2006, I would have conceded global warming was happening, however how much of that was man-made would not have been certain at that point in time. But now, 10 years later, it appears our contribution is much less than many previously believed.

      • John Finn says:

        David Appell

        On Jan 6th at 11:30 you wrote this:

        ” John Finn: Again, youre relying on short-term trends that are heavily influenced by natural variability, not trends that represent changes to climate. ”

        Yet on Jan 5th when referring to 1998 you wrote

        ” If you started calculating just a couple of years before or after, youd get different (positive) results.”

        I provided a calculated trend from 1998 (El Nino) and another trend from 2000 (La Nina affected), i.e. 2 years after 1998 – JUST AS YOU SUGGESTED. There was no statistically significant difference between the trends. This fact also suggests that the length of the trend periods is sufficient in that the trends are not unduly affected by short-term natural variability. There is barely a cigarette paper between the trend starting at the peak of an El Nino and one starting in the depths of a La Nina.

        I don’t disagree with everything you write but, on this, I believe your argument is flawed.

  8. michael hart says:

    Well, Roy, if 2016 does turn out to be the warmest year in the satellite record then you can expect the BBC to start taking an increased interest in the satellite record. 🙂

    • won’t matter. I won’t talk to them anymore. They’ll have to talk to John Christy, who has more patience than I do for people who deceive you in interviews.

      • bit chilly says:

        glad you have taken that stance roy. the bbc have morphed into a common purpose agenda driven cult.shameful behaviour from what was once a broadcaster of news envied the world over.

  9. JohnD says:

    Could we ask again please why the red running 13m average has not been updated? If it’s a centred average then it should surely be showing up to about mid-2015?

    • I’m going to fix it….I thought for sure it was fixed before, and now the index in the spreadsheet is mysteriously changed. Geez.

        • fonzarelli says:

          Dr. S., are you (or have you…) ever going to present a detailed explanation as to why you think the land warming post 2005 of version 5.6 was spurious? Thanx and Happy New Year…

          • not exactly detailed…but (1) the satellite observation times had drifted so far through the diurnal cycle that we could no longer choose non-drifting satellites to anchor the long-term record…we now use an explicit diurnal drift corrections; and (2) we discovered that the AMSU weighting function altitude (reference beam position) must be carefully chosen to match the MSU instruments, otherwise there is a spurious warming of land and spurious cooling of the ocean.

            It turns out there is a small error in the microwave absorption theory (not surprising) that must be corrected for to fully fix the latter issue. I will be posting more on this issue in our next monthly update.

          • Doug*C says:

            No Roy, the microwaves do not warm anything, for the same reason they do not warm those special plastic bowls you use in your microwave oven. They are pseudo-scattered, as is now well documented in 21st century physics. They follow a random path with some passing through the plastic eventually, but not by way of normal transmission. If the latter happened then you have a new invention – a safer x-ray type imaging system very useful in medicine.

            So Roy, what I wrote to David Appell in this comment applies also to yourself. The correct hypothesis which is supported by empirical data throughout the Solar System is being read by over 1,000 a month at https://itsnotco2.wordpress.com and many are your own silent readers who will now start to realize just how wrong is the back radiation GH forcing conjecture. It is time you learnt about it, Roy, because you will never prove me wrong. Just try! Every Ranque-Hilsch vortex tube in the world supports what I say about maximum entropy production, and it is all based on the Second Law of Thermodynamics.

          • DouglasECotton says:

            Hello imposter.
            Is it true you lost $10,000 betting on the horses using a prediction scheme based on maximum entropy production?

          • ehak says:

            Spencer says:

            “It turns out there is a small error in the microwave absorption theory (not surprising) that must be corrected for to fully fix the latter issue.”

            Model based anyone?

          • David Appell says:

            ehak: of COURSE it’s all model based. Every number UAH gives comes from a model, and a quite complex one all the time. People are finding errors in UAH’s algorithm consistently throughout the years.

            Christy & Spencer won’t even share their code with anyone, or publish a paper about version 6. We’re supposed to accept them as oracles.

  10. According to the Icelandic Meteorological Office, the year 2015 was the coldest of this century. Average temperatures in 2015 were as much as 1c lower than the average of the past ten years…

    More:

    http://icelandmag.visir.is/article/2015-was-coldest-year-century-iceland

    • FTOP says:

      The arctic ice must be in lock step Iceland. It has rebounded dramatically.

      http://ocean.dmi.dk/arctic/old_icecover.uk.php

      • lewis says:

        According to the Rutgers snow lab, fall of 2015 had the 4th most snow cover since 1967. 2014 had the most.

      • Christian says:

        “Please notice, that the sea ice extent in this plot is calculated with the coastal zones masked out. To see the absolute extent, go to this page. ”

        http://ocean.dmi.dk/arctic/icecover.uk.php

        Sea-Ice-Extent is near new record low, also evident in Area: http://arctic.atmos.uiuc.edu/cryosphere/arctic.sea.ice.interactive.html or Extent by Un Bremen: http://www.iup.uni-bremen.de:8084/amsr2/extent_n_running_mean_amsr2_previous.png

        “It has (not) rebounded dramatically.”

      • David Appell says:

        It hasn’t rebounded according to NSIDC’s data or JAXA’s data. NSIDC has it, as of yesterday, at the lowest value for that day in their records, and 1.4% below last year’s value at this time.

        data sources:
        recent:
        ftp://sidads.colorado.edu/DATASETS/NOAA/G02135/north/daily/data/NH_seaice_extent_nrt.csv

        older:
        ftp://sidads.colorado.edu/DATASETS/NOAA/G02135/north/daily/data/

        • Doug*C says:

          Meanwhile you, David Appell, cannot even explain the Earths surface temperature, let alone that at the core of the Moon or the base of the Uranus troposphere, whereas I can. Emissivity of the atmosphere is less than 0.4. Back radiation is thus far less than the 324W/m^2 figure lied about – and it does not help the Sun to raise the surface temperature anyway. You would need a mean of over 450W/m^2 plus non-radiative losses (102W/m^2) = over 550W/m^2 of variable flux from an effectively warmer source into the surface, to get a mean temperature of 288K, but the Sun delivers only a mean of 168W/m^2 and it is like an iceberg at -40C. Bad luck, David. You are stumped because direct radiation into the surface of a planet with a significant atmosphere is not the major determinant of the surface temperature.

          • David Appell says:

            I’m positive you can’t calculate the Earth’s surface temperature, and I know you’re afraid to submit it to a real journal.

            The first accurate calculation of Earth’s mean global surface temperature was done by Manabe and Wetherald in 1967:

            “Thermal Equilibrium of the Atmosphere with a Given Distribution of Relative Humidity,” Syukuro Manabe and Richard T. Wetherald, Journal of the Atmospheric Sciences, v24 n3 (May 1967) pp 241-259.
            http://www.gfdl.noaa.gov/bibliography/related_files/sm6701.pdf

            It’s a clear and enlightening paper, as were most from Manabe. Lots to learn there.

          • Doug*C says:

            I’ve already explained the errors those clots M&W made. I have proven how the required thermal energy transfers take place in all planetary tropospheres, crusts and mantles and quantification of temperatures is possible within reasonable error limits. Far more importantly, energy transfers are correctly explained based on the laws of physics. The radiative forcing conjecture defies the laws of physics and does not have a hope of working on other planets, or on Earth. It is all explained at https://itsnotco2.wordpress.com and I only respond to those who have read and understood the hypothesis and then address relevant issues pertaining to such; I do not respond to those who regurgitate standard GH fictitious, fiddled fissics and/or cite literature like that you quote.

          • Doug*C says:

            M&W are wrong in their point (3) wherein they include forced convection as supposedly having a role in maintaining the lapse rate. There is no valid physics which could explain such. The temperature gradient (aka lapse rate) is ONLY established by natural convective heat transfer mechanism, not by forced convection which is wind of some form. This is basic Kinetic Theory used in conjunction with the Second Law of Thermodynamics .

          • Doug*C says:

            In summary, M&W come close to what I have been first in the world to explain in that they realize that the environmental lapse rate is indeed determined by a playoff between the convectively induced gradient and the reduction caused by inter-molecular radiation. However, they miss the whole point about why the convectively-induced gradient is really induced by gravity acting at the molecular level maximizing entropy, and of course they thus do not hit upon how and why the required thermal energy transfers take place. Essentially they still assume that the radiation warms the surface which then cools off by convection and radiation. They are wrong in assuming that radiation determines that surface temperature and supplies the required thermal energy: it does not and it cannot.

          • D-J-Cotton says:

            All climate change is natural and regulated by natural cycles that appear to be related to planetary orbits. See Nicola Scafetta’s work here and my website.

            The superimposed 60-year cycle had a maximum around 1998. It is not cherry-picking to note that, because that was the expected time that the maximum would be reached, we do in fact see slight cooling or near level temperatures since then, and such will continue for about 30 years before new warming. However, the underlying ~1,000 year cycle is due to reach a maximum later this century, after which 500 years of cooling can be expected. The mean rate of warming over the last 120 years is less than 0.06 C degree/decade, that being due to the long-term ~1,000 year cycle rising since the LIA.

            There is no valid physics that can be used to explain any reason what-so-ever as to why carbon dioxide should warm the surface. If any reader thinks there is, then have a go at explaining it in your own words and I’ll show all readers precisely where and why you are mistaken.

          • David Appell says:

            DC, Manabe & Wetherald were wrong?! Here’s your chance to get famous — publish a peer reviewed paper in a real journal and inform the world. You’ll get all the attention you can handle, and more, and won’t have to beg and taunt for it here.

            Of course, that risks rejection, like anyone seeking to publish. Maybe you can’t handle that.

          • Doug*C says:

            Dr Hans Jelbring (with a PhD in climatology) has already published such a paper* to which I have referred you before David Appell. Next time read my responses before regurgitating your monotonous comments.

            * http://ruby.fgcu.edu/courses/twimberley/EnviroPhilo/FunctionOfMass.pdf

          • David Appell says:

            Jelbring published in a fake journal — Energy & Environment, the last refuge of “skeptics” with no credibility at all — not a real journal.

          • DougCotton says:

            Jelbring (with a PhD in climatology) knows a darn sight more about how and why Loschmidt was right, and I have shown why directly from the Second Law of thermodynamics which you don’t understand.

        • John Finn says:

          D-J-Cotton

          ” If any reader thinks there is, then have a go at explaining it in your own words and Ill show all readers precisely where and why you are mistaken. ”

          Ok – but, first, do you accept that CO2 absorbs (and emits) LWIR terrestrial radiation. We don’t need to go into the actual wavelengths.

          • Doug*C says:

            Of course CO2 absorbs and emits in such bands, as do other IR-active gases like water vapor. It also absorbs incident solar radiation in the 2.1 micron band, where each downwelling photon has about five times the energy of the 10 micron upwelling photons from Earth’s surface. Indeed, water vapor, CO2 and CH4 store nearly 1.5% of all the thermal energy in the atmosphere.

            And of course the radiation properties explain why inter-molecular radiation between CO2 molecules reduces the magnitude of the gravitationally-induced temperature gradient, so that the state of maximum entropy (in conjunction with inevitable radiative balance with the insolation) causes the tropospheric thermal plot to rotate downwards at the surface end, just as happens with water vapor that also cools the surface, as my study of 30 years of records from three continents confirms.

            I suggest that you read first what is explained at https://itsnotco2.wordpress.com and by all means attempt to fault the breakthrough 21st century physics outlined there and in my papers, videos and book that I have been first to explain. There’s a AU $10,000 reward for the first to do so and also to produce a similar study with opposite results.

          • John Finn says:

            Doug*C

            The initial challenge was for any reader to explain in their own words the GHG effect and you (I think it’s you) would show where they’d gone wrong.

            I’ve simply started to agree some common ground – yet you’ve responded with a tirade of irrelevant twaddle (I said we didn’t need to discuss wavelengths) though I think we have managed to establish that you agree that CO2 absorbs and emits LWIR energy.

            Ok – would you also agree that as more CO2 accumulates in the atmosphere the average height at which ‘final’ emission to space occurs is increased. Bear in mind that CO2 is more relevant in the higher, drier layers of the troposphere.

          • Doug*C says:

            No I don’t agree the average height increases. There is no reason for the weighted distribution of carbon dioxide over the height of the atmosphere to vary on a percentage basis. If you double the concentration above the original height, you also double that below that height, and so the average height does not change. However, the inter-molecular radiation causes the temperature gradient to level out (and so the thermal plot to rotate downwards at the surface end) and I have calculated the net effect of all the carbon dioxide to be cooling, but by less than 0.1 degree.

            PS: I am quite aware of all the arguments from the “standard literature” and am not here just to hear you regurgitate them. The “heat creep” hypothesis and the radiative forcing GH conjecture are mutually exclusive. The “heat creep” hypothesis is supported by copious evidence: the other by none.

          • Doug*C says:

            By the way, you are very ignorant John Finn as to how energy is transferred by radiation. I suggest you read my paper on such which was published on several websites in March 2012 and is linked from the ‘Evidence’ page at http://climate-change-theory.com because you don’t understand 21st Century developments in this field pertaining to resonance. Emission from any altitude where the temperature is less than the surface below leads to that energy making its way eventually to space and not into the warmer surface. Every one-way pencil of radiation is an independent process which must thus obey the Second Law and only cause entropy to increase. The way in which nature ensures this happens is by way of resonance and is quite fascinating science that I reviewed (with citations) in that paper. You should read about it.

          • Doug*C says:

            And, John Finn, your assertive statement that CO2 is more relevant in the higher layers is utter nonsense. IR-active molecules like water vapor, CO2 and CH4 act like holes in the blanket, doing virtually all of the required radiation out of the atmosphere. They also acquire thermal energy by heat diffusion (molecular collisions) from nitrogen, oxygen and argon, for example, thus cooling these air molecules as they radiate the energy out of the atmosphere, especially at night. During the day they can also absorb some of the incident solar radiation as spectral analysis shows.

            Radiation only ever transfers thermal energy from warmer to colder regions. The IR-active molecules at lower levels emit more energy simply because they are hotter. Whether some of that radiation is subsequently re-emitted by other molecules is irrelevant: all of it makes its way only ever to cooler regions which, in the troposphere, generally means to higher altitudes and subsequently to Space. Besides all that, my study shows that increasing water vapor leads to lower surface temperatures (both maximum and minimum) and carbon dioxide acts in the same way as water vapor.

            The GH conjecture depends on water vapor doing most of “33 degrees” of warming, which is utter nonsense unsupported by any empirical evidence. Rain forests are not over 50 degrees hotter than dry deserts at similar latitude and altitude.

          • Doug*C says:

            The science of heat transfer mechanisms is physics. Are you, John Finn, qualified in such with at least three years of study at tertiary level – in my case at Distinction level? Is any climatologist so qualified? If you are thus qualified, can you, for example, explain how, when, where and why entropy is maximized? Do you understand how the Second Law of Thermodynamics can be used to explain and quantify the stable density gradient in any planet’s troposphere? And the temperature gradient? It is all in my writings. If you are not thus qualified, or if you don’t understand entropy maximization and radiative heat transfer, then who do you think you are to assess which hypothesis is correct? All you have is empirical evidence, and that certainly favors what I have explained but may not be satisfying until you understand why correct physics explains the observations.

          • Mack says:

            @ John Flynn,
            Garbage, my friend, You will never understand entropy maximisation. You will never find my hypothesis wrong and anything you say is water off a duck’s back.
            There Dougie, does that also assist you?

  11. Thanks, Dr. Spencer.
    I have updated your graph and comments in the climate and meteorology pages at Observatorio ARVAL.

  12. Doug*C says:

    No, Roy:

    I very much doubt that 2016 will be the record year. “Solar activity is expected to be very low with a chance for C-class
    flares over the next three days (05-07 Jan)”
    [source] and things are certainly getting off to a cold start here in NSW, Australia, with record rainfall for January and, in some parts, coldest January days for several decades. But we had a good one-week holiday at the end of December because I waited for 10-day forecasts before booking and picked beautiful weather every day on our trip through the ski-resorts of Gippsland, Victoria and then back up the NSW South Coast – got some great photos too. At least meteorologists do a good job with weather forecasting. Happy New Year and enjoy your seventh decade, Roy!

    • DouglasECotton says:

      Strange comment indeed.
      How does solar activity translate into weather over NSW?
      Why NSW? Why not Hawaii or Northern Ireland?

      • D-J-Cotton says:

        Go to this comment Dr No.

        • DouglasECotton says:

          That gobbledegook does not explain why you would link solar activity to a specific region on Earth and not to other regions?
          You are implying that the sun’s activity only affects NSW. That, in my book, is crazy.

          • Douglas*J*Cotton B Sc (physics) ... says:

            Interesting that you followed instructions directed to Dr No.

          • DouglasECotton says:

            Why can’t you answer a straight question with a straight answer?

            I repeat:
            “How does solar activity translate into weather over NSW?
            Why NSW? Why not Hawaii or Northern Ireland?”

            “You are implying that the suns activity only affects NSW. That, in my book, is crazy.”

          • Doug*C says:

            “You are implying that the suns activity only affects NSW”

            Nope. I said:

            I very much doubt that 2016 will be the record year. Solar activity is expected to be very low with a chance for C-class
            flares over the next three days (05-07 Jan)

          • DouglasECotton says:

            You wrote:
            “I very much doubt that 2016 will be the record year. Solar activity is expected to be very low with a chance for C-class flares over the next three days (05-07 Jan) [source] AND THINGS ARE CERTAINLY GETTING OFF TO A COLD START HERE IN NSW, AUSTRALIA, WITH RECORD RAINFALL FOR JANUARY AND, IN SOME PARTS, COLDEST JANUARY DAYS FOR SEVERAL DECADES.”

            That definitely sounds like implication to me.

            Another question, what is the relevance of “C-class flares over the next three days..” ?
            You are again implying that this activity is relevant to weather (somewhere) or global average mean temperatures. Again, thus is just crazy talk.

            What are “C-class flares” ? Are you trying to impress us with jargon?

          • Doug!C says:

            The classification of solar flares

            Solar flares are classified as A, B, C, M or X according to the peak flux (in watts per square metre, W/m2) of 1 to 8 ngstrms X-rays near Earth, as measured by XRS instrument on-board the GOES-15 satellite which is in a geostationary orbit over the Pacific Ocean. The table below shows us the different solar flare classes:

            Class W/m2 between 1 & 8 ngstrms
            A <10-7
            B ≥10-7 <10-6
            C ≥10-6 <10-5
            M ≥10-5 <10-4
            X ≥10-4

            Each X-ray class category is divided into a logarithmic scale from 1 to 9. For example: B1 to B9, C1 to C9, etc. An X2 flare is twice as powerful as an X1 flare, and is four times more powerful than an M5 flare. The X-class class category is slightly different and doesn't stop at X9 but continues on. Solar flares of X10 or stronger are sometimes also called ''Super X-class solar flares.''

          • DouglasECotton says:

            As we all knew, totally irrelevant crazy talk.

            You bring shame upon the Cotton name.

    • David Appell says:

      Cotton wrote:
      “….and things are certainly getting off to a cold start here in NSW, Australia, with record rainfall for January and, in some parts, coldest January days for several decades.”

      Fascinating. What about the temperatures in your backyard? What do they imply about the global average?

      • DougCotton says:

        Absolutely nothing. Nor do the “official” temperature records tell us anything about what causes climate change: only physics can explain atmospheric physics.

  13. numberer says:

    Re: expansion of the Ocean with temperature:

    95% of the Ocean mass is at a temperature (around 4 C) where – because water is its most dense – the coeffcient of volumetric expansion is close to ZERO.

    The other 5% – near the surface, at low latitudes – is at temperatures where the coefficient is about 1/5000 per degree C.

    Assuming the usual figure of the upper part of the Ocean having warmed by 0.7 degree C since 1870, the whole business equates to an expansion of the entire Ocean by one part in 140,000 during that time, i.e. (since the average depth is 3,800 meters) from that cause

    Sea Level has risen 0.028 METERS IN 145 YEARS,

    or about ONE INCH in old money.

    • Mack says:

      About one inch in 145yrs ? Nothing much to worry about. A 90+yr old pushing a Zimmer frame would out run that.

      • numberer says:

        Mack says:

        “About one inch in 145yrs?”

        Yes, from THAT* cause.

        There are other things which can change sea-level, both locally and eustatically. Sedimentary rocks show thousands of such changes.

        *thermal expansion of (mostly cold) water.

        • dave says:

          “…locally…”

          Can be very local. On a small stretch of the coast of East Sussex were seven locations on the sea in the Middle Ages:

          Old Winchelsea – disappeared beneath the waves for ever in a storm

          Camber PORT – now Camber SANDS

          Camber Castle – now two miles inland

          Rye – now two miles inland

          Hastings Castle – (mostly) fallen into the sea

          Pevensey Bay – now farmland

          Pevensey Castle – below sea-level, but protected by a shingle bar.

  14. sod says:

    I really disagree with basically everything that Roy Spencer says.

    But i have to tell him that i deeply respect how calm he reacts to the utter nonsense written by the “sceptics” who comment on his blog.

    • Gordon Robertson says:

      @sod…”I really disagree with basically everything that Roy Spencer says”.

      Do you disagree with the data collected from NOAA satellites and processed by Roy and John at UAH? If so, I suppose you disagree with NASA and the American Meteorological Society awarding them medals for excellence for their work making data sets from the NOAA data.

      That likely leads to you agreeing with the scientific misconduct of NOAA when they slashed 5000 reporting surface stations from a global pool of 6500 station and used the remaining 1500 in a climate model to synthesize the missing 5000 stations, hence finding warming where the IPCC claimed there had been none since 1998.

      If you prefer synthesized data over hard data from thermometers and value opinion over the scientific method, then I can understand why you don’t agree with Roy.

    • Doug*C says:

      Well sod, let me just say calmly that the correct physics is here and if you dispute what is said, let’s hear why – with reference to what is actually said, of course.

  15. Norm Kalmanovitch says:

    Everyone seems to have lost the plot. The issue is called climate change and climate is the long term weather patterns so whether or not one year is warmer than another has nothing to do with climate.
    If you draw a vertical line on the graph at 2002 you can make a case for net global warming up to 2002 and zero net global warming afterwards and 14 years of zero net global warming is a sufficiently long period of time for this to be called a climatic period of no warming.
    According to Hansen et al 1988 the world was supposed to have continually warmed after 2002 because CO2 emissions are still in excess of Hansen’s Scenario A “business as usual 1.5%/year exponential increase but instead we have the equivalent of Scenario C of zero rise in temperature after 2000.
    “Scenario A assumes continued exponential trace gas growth, scenario B assumes a reduced linear growth of trace gases, and scenario C assumes a rapid curtailment of trace gas emissions such that the net climate forcing ceases to increase after the year 2000.”
    http://pubs.giss.nasa.gov/abs/ha02700w.html
    Scenario C required the immediate “rapid” curtailment of CO2 emissions (trace gas emissions) but since we achieved the results of scenario C without ever reducing CO2 emissions; it is clear that the whole climate change debacle has no scientific validity.
    The one thing that el Nino conditions show is the desperation of alarmists to keep the fraud alive by claiming 2015 to be the warmest year.
    El Nino and la Nina conditions are oceanic events and need the complete coverage by satellites to be properly represented in terms of global temperature.
    Surface based data does no have sufficient ocean measurements to accurately depict the 1998 and 2010 el Nino conditions. Also unlike satellite based measurements which represent millions of data points and cannot be manually altered, surface data can easily be “corrected” (fixed) to eliminate lower values and provide higher global temperatures as was the case for the “correction” of HadCRUT3 to HadCRUT4.
    At http://www.climate4you.com plots of GISS and NCDC datasets both show changes made from lower to higher temperatures resulting in a rise in temperature since 2013 that is not seen on either the RSS or UAH MSU data, so the claim of 2015 being the warmest year has more to do with data manipulation than actual global temperature and if Roy’s prediction of 2016 being the warmest year ends up being correct it will be because UAH MSU data will show higher values for the El Nino conditions than the three surface based datasets.

    • Doug*C says:

      Well said. Carbon dioxide radiation cannot raise the maximum temperature for the day. Warming is assumed to be caused by radiation from carbon dioxide supposedly slowing surface cooling and then, because of that supposed slowing, the minimum temperature for the day is supposedly warmer. But it’s not: it may take a few minutes (or just a few seconds) longer in the night to get down to the minimum temperature, but that’s all. The minimum temperature is determined by all the thermal energy stored in the troposphere, and over 98% of that is in nitrogen, oxygen and argon molecules.

      Radiation can only slow that component of cooling which is itself by radiation, and that is only about a third of all surface cooling. Other cooling processes may well accelerate to compensate. Furthermore, the minimum temperature for the night is determined primarily by the supporting temperature in all the air molecules colliding with surface molecules, and carbon dioxide only comprises 0.04% of those. IR-active molecules lower the temperature gradient, so that the thermal plot rotates downwards at the surface end. That is why more moist regions in my study had lower mean daily minimum and maximum temperatures than drier regions at similar latitude and altitude. So-called greenhouse gases lower the mean surface temperature, and the reasons (based on the Second Law of Thermodynamics) are here.

    • Gordon Robertson says:

      @Norm…”If you draw a vertical line on the graph at 2002 you can make a case for net global warming up to 2002 and zero net global warming afterwards…”

      According to John Christy in the UAH 33 year report, there was little or no warming before 1998. You cannot take the apparent warming trend between 1979 and 1998 as true warming. On the graph there is an indication of volcanic aerosols that cooled the atmosphere. What you are calling a net global warming is largely a recovery from cooling.

      Even if you include the 1998 spike, the cooling dip following it is wide enough to flatten out the spike so that a flat trend can be claimed from 1998 – present.

      • Doug*C says:

        Nothing pertaining to temperature records and the fact that we are currently in a period of 500 years of global warming since the Little Ice Age (as there was since from the Dark Ages to the MWP) provides any proof that carbon dioxide was the cause. Correct physics here shows why carbon dioxide cannot warm and, until someone can prove that physics wrong, as nobody has in two years, then we have nothing to suggest CO2 warms the surface.

        • David Appell says:

          Sorry — the warming due to CO2 has been measured. (It agrees with models.):

          “Observational determination of surface radiative forcing by CO2 from 2000 to 2010,” D. R. Feldman et al, Nature 519, 339343 (19 March 2015)
          http://www.nature.com/nature/journal/v519/n7543/full/nature14240.html

          Their press release: “First Direct Observation of Carbon Dioxides Increasing Greenhouse Effect at the Earths Surface,” Berkeley Lab, 2/25/15
          http://newscenter.lbl.gov/2015/02/25/co2-greenhouse-effect-increase/

          • Douglas J Cotton B.Sc (physics) etc says:

            “2000 to 2010”? Just though I’d mention it’s 2016 now.

          • Toneb says:

            The laws of physics haven’t changed in those 6 years.
            And neither have you re-written them and gained a Nobel.

          • Doug^Cotton says:

            Nope. I certainly have not re-written the laws of physics – just used them. You can, however, read about some developments in our understanding of those laws that started in the late 1980’s with the work Swevson.

            Swenson, R. (1988). “Emergence and the principle of maximum entropy production” Proceedings of the 32nd Annual Meeting of the International Society for General Systems Research, 32.

            Swenson, R. (1989b). “Emergent evolution and the global attractor: The evolutionary epistemology of entropy production maximization.” Proceedings of the 33rd Annual Meeting of The International Society for the Systems Sciences, P. Leddington (ed)., 33(3), 46-53.

            Swenson, R. (1989d). “Emergent attractors and the law of maximum entropy production: Foundations to a theory of general evolution.” Systems Research, 6,187-1987.

          • JohnKl says:

            Hi David Appell,

            Why does .2 w/m^2/decade seem excessive to you? Seriously, what do you imagine will happen if this rate of energy redirection continues apace for another few decades? What do you believe is a reasonable cost to slow it down? and by how much?

            Have a great day!

    • tonyM says:

      Norm:
      HANSEN further said :
      Scenario ‘A’ assumes that growth rates of trace gas emissions typical of the 1970s and 1980s will continue indefinitely; the assumed annual growth averages about 1.5% of current emissions.

      A bit ambiguous as unless we have the numbers one could take it to mean that the compound growth works out as simple 1.5% average OF the 1988 emissions.

      In any case, from the IPCC’s AR5 graphs, GHG equivalent emissions did grow at about 1.5% compound from 1990 to 2010. Of this CO2 had a higher rate of growth.

      Hansen’s graph predictions goes to 2060…but only for scenario A. B stops at about 2028!! To me his graph is plugging Scenario A as the likely emissions and outcome.

      Well he got the emissions pretty much spot on! 🙂

      I don’t think much of Hansen’s exaggerations but I give him due credit. He was the only guy in this field to put down his hypothesis in a quantified, falsifiable form. No one else has had the guts to do so except in the original FAR predictions, which failed as well.

      Hypothesis falsified!

      • Gordon Robertson says:

        @TonyM…”Well he got the emissions pretty much spot on!”

        A high school science student could have done that. What Hansen missed was the current 18 year spell with no global warming trend. The lack of warming refutes the AGW theory, and Hansen.

        • David Appell says:

          Hansen was calculating surface temperatures, not LT temperatures.

          • Douglas J Cotton B.Sc (physics) etc says:

            Yes but Hansen did not use correct physics to calculate surface temperatures, as explained in my other comments. The surface temperature cannot be explained with radiation, any more than can the warmest temperature actually measured by Voyager 2 in the upper troposphere of Uranus.

          • tonyM says:

            David Appell:

            If you mean that after Karlizing, krigging, infilling, homogenizing, pasteurizing and baptizing that NOAA/GISS T changes are somehow a better guide then it is a risible proposition.

            Almost a year ago I asked you for your comments on two very very different T’s of two stations within 8km of each other in Perth (West Australia). I show you a similar divergence for yesterday, Jan 7th, 2016.

            Swanbourne (a suburb of Perth within 8km of the CBD, 16m height difference):
            http://www.bom.gov.au/products/IDW60901/IDW60901.94614.shtml
            Perth :
            http://www.bom.gov.au/products/IDW60901/IDW60901.94608.shtml

            Perth was 37.5C at 11.30am, peaked at 2pm showing 41.2C. By 11pm it showed 31.3C

            Swanbourne peaked at 11.30am recording 39.2C, was down by 2pm to 29.5C . By 11 pm it was 25.7C.

            So it diverged by more than 11C and maintained a high difference throughout the day. So what was Perth’s avg T for the day? What does it say about the credibility that GISS projections of T within 1200km is appropriate?

            Gavin Schmidt’s suggestion that GISS is accurate to 0.01C is equally laughable when he posited that 2014 was the highest T evahhhh! Between Hansen and himself it seems that the T data has been massaged up by about 0.3C increase compared to previous published data. It seems they could make pigs fly, if they tried.

            It does not help Hansen’s predictions. Hypothesis falsified!

          • tonyM says:

            David Appell:

            If you mean that after Karlizing, krigging, infilling, homogenizing, pasteurizing and baptizing that NOAA/GISS T changes are somehow a better guide then it is a risible proposition.

            Almost a year ago I asked you for your comments on two very very different T’s of two stations within 8km of each other in Perth (West Australia). I show you a similar divergence for yesterday, Jan 7th, 2016.

            Swanbourne (a suburb of Perth within 8km of the CBD, 16m height difference):
            http://www.bom.gov.au/products/IDW60901/IDW60901.94614.shtml
            Perth :
            http://www.bom.gov.au/products/IDW60901/IDW60901.94608.shtml

            Perth was 37.5C at 11.30am, peaked at 2pm showing 41.2C. By 11pm it showed 31.3C

            Swanbourne peaked at 11.30am recording 39.2C, was down by 2pm to 29.5C . By 11 pm it was 25.7C.

            So it diverged by more than 11C and maintained a high difference throughout the day. So what was Perth’s avg T for the day? What does it say about the credibility that GISS projections of T within 1200km is appropriate?

            Gavin Schmidt’s suggestion that GISS is accurate to 0.01C is equally laughable when he posited that 2014 was the highest T evahhhh! Between Hansen and Gavin it seems that the T data has been massaged up by about 0.3C increase compared to previous published data. It seems they could make pigs fly, if they tried.

            It does not help Hansen’s predictions. Hypothesis falsified!

          • tonyM says:

            Sorry for the repeat; my post remained open so thought I had not pressed the submit button.

  16. Stevek says:

    Based on graph seems this el nino fatter. 97,98 elnino more of skinny spike.

    Maybe blob is kinda a pre – el nino.

    • Gordon Robertson says:

      @Steve…”Based on graph seems this el nino fatter. 97,98 elnino more of skinny spike”.

      Either way, Steve, it’s a natural event producing natural warming.

      • David Appell says:

        And what natural forcing is producing all this warming?

        • Douglas J Cotton B.Sc (physics) etc says:

          The natural climate variations are due to …

          (1) Natural variation in cloud cover, thus altering albedo

          (2) Natural variation in effective solar intensity

          and maybe other natural factors. There are natural cycles investigated in detail by Dr Nicola Scafetta about which you can read. The main cycles of relevance are ~1,000 year and a superimposed 60 year cycle. Currently the net effect is about zero because the 60 year is going down and the 1000 year up, but it will turn to 500 years of cooling before the end of this century I predict. (In fact I predicted such in 2011.)

          PS: Note that my middle initial is J as shown in my paper which you should study some day.

  17. Douglas G Frank says:

    Don’t forget to update the figure on you temp anomaly page…
    Thanks for your work.
    Doug

  18. Gordon Robertson says:

    As most people are aware, there is an impersonator (DouglasECotton) posing as Doug. He is a representative, it appears, of the discredited site, skepticalscience. Here is some background on those pseudo-science experts:

    SS has taken pseudo-science into another realm that gives a different meaning to the initials SS.

    http://wattsupwiththat.com/2013/08/06/skeptcial-science-takes-creepy-to-a-whole-new-level/

    Although the photos indicated in the WUWT article have been removed from SS, this page seems to have captured them before removal.

    https://suyts.wordpress.com/2013/08/06/ewww-creepy-maniacs-at-ss-true-deniers/

    • David Appell says:

      How do you know this ID is fake? Evidence?

      What is the evidence this faker is from Skeptical Science?

    • DouglasECotton says:

      I am unclear why Gordon Robertson links me to skepticalscience. I sometimes look at it, but that is all.

      Douglas Cotton is the real impersonator. He is a disgrace to the Cotton name with his crazy talk about class C flares, weather and climate. He should give up and go back to improving his model for producing winners of horse races.

      • David Appell says:

        You’ve had your fun.

        Time to stop impersonating people. It isn’t amusing, or helpful, or decent.

        • DouglasECotton says:

          My apologies. You sound as if you feel sympathy for Doug C. I shall therefore refrain from further comment.

          But, you are now on your own in dealing with the RWNJs on this site.

          • JohnKl says:

            Hi DouglasECotton,

            You state:

            “But, you are now on your own in dealing with the RWNJs on this site.”

            Seriously? You use different monikers that spout nonsense to one another, ridicule others better informed than your self and supposedly all to prevent climate devastation due to a .2 w/m^2 per decade increase in redirected IR from impinging the planet surface that you yourself contribute to. You close this post with pretentious concern about other RWNJs on this site all the while forgetting what a complete ICPI you apparently have become!

            Have a great day ( you should have at least one )!

          • Doug^Cotton says:

            Well said, JohnKl

          • DouglasECotton says:

            JohnKl,
            One thing I know is that it is impossible to talk sense to some people. But that doesn’t mean you can’t have fun trying. Especially when they imagine the whole world is out to get them (think the Third Reich).
            However, I must have touched a nerve and offended your delicate sensibitlities.
            You can relax now and continue in the echo chamber unencumbered by my pearls of wisdom. You and DougC deserve one another.
            Sieg Heil !

          • JohnKl aka James Bond says:

            Hi DouglasECotton,

            Please don’t bother about my sensibilities. I may have been rash to suggest you have become an ICPI, if so I apologize. Since you claim to offer pearls of wisdom and not plastic fakes, please let us know why you believe that a .2 w/m^2 per decade increase in surface absorbed radiation enables the sun to warm the Earth beyond tolerable levels apparently not reached in decades past, what you are prepared to do to somehow make sure it doesn’t happen and how do you plan to get everyone to go along. You claim to speak sense, we’ll let us read it for ourselves.

            Have a great day!

  19. Curious from Cleathropes says:

    WIth respect to the UAH data. It is difficult to associate meaning to the data unless we have a quantative assessment of the likely errors. Have you ever addressed this in a prior post which I can look at?

  20. David says:

    Complete and utter rubbish. Your dataset ranks December 2015 4th for the CONUS, behind 1979, 1994, and 1980. None of those years are even close to last month on the surface records. And it’s not because higher elevations of the troposphere were colder – on the contrary, we were shattering records on the radiosondes. Can’t believe you would publish this nonsense. Until you do something about the spurious cooling, this goes in the garbage disposal. Garbage in, garbage out.

    • mpainter says:

      A fusilade of bald assertions. Very impressive, David, the way you splatter the wall.

    • Doug^Cotton says:

      But David whatever happens regarding temperatures (which all follow natural cycles) you cannot prove in your own words with correct physics (even for the AU $10,000 reward offered here) that the greenhouse gases water vapor, CO2 and CH4 all cause warming of Earth’s surface.

  21. Doug.C says:

    Roy

    You know full well from your temperatures charts as in this post that there has been no warming since the superimposed 60 year cycle passed its maximum somewhere in the period from 1998 to 2003. The ~1,000 year cycle is due to max out probably before 2150 at the very latest, maybe somewhat sooner. The current hiatus is the net effect of the two.

    Dr Nicola Scafetta is the expert on climate cycles. He got to the point where he considered 80% was natural, but he couldn’t explain the last 20% and assumed it was due to CO2. But now we know the land temperatures were fiddled, basically ignoring urban crawl, so the fiddling easily accounts for that 20%, leaving it all 100% natural. Obviously carbon dioxide is having zero effect.

    So why do you cling to your “Luke” position Roy? Because the temperature of Earth’s surface cannot be shown with correct physics to be determined by radiative balance, nobody can deduce anything from radiation calculations about the effect of varying the radiation from greenhouse gases.

    At the surface the Sun’s radiation (about 168W/m^2) is like that from an iceberg at -40C, whilst the radiation from the atmosphere (having emissivity less than 0.3) is also like that from an iceberg at sub-zero temperatures. If you placed an object (representing the Earth’s surface) between those two icebergs and you warmed the object by another process (such as by using electricity) to a steady 15C, then altering the temperature of the second iceberg (the atmosphere) even by 10 degrees will not alter the temperature of the object (the surface) even by a fraction of a degree, because it is not radiation from the icebergs which is determining the temperature of the object. The Earth’s surface is indeed warmed by another process – it has to be, because radiation cannot warm it to the current mean temperature. I have been first-in-the-world to explain that other process, all based on the laws of physics and confirmed by Solar System data plus experiments and a study here on Earth.

    http://climate-change-theory.com

    http://itsnotco2.wordpress.com

  22. Doug^C says:

    Roy regarding the “Luke position” David Evans (husband of Joanne Nova) posted a series of articles (his “thesis”) on her Australian climate blog in which he tried to establish by how much carbon dioxide warms, but his basic assumptions were wrong, and that invalidates his whole argument.

    You see Roy, because nobody (including David) can explain the Earth’s surface temperature as if it were based on radiative balance, David cannot go on to assume that any changes in radiative balance caused by carbon dioxide will alter the surface temperature. As I told you about two or three years ago, radiation reaching Earth’s surface is not the primary determinant of the temperature.

    Whilst it is in my clipboard, I’ll paste below a copy of my latest email to David …

    David

    To clarify, the “heat creep” process (fully explained in my website, video, blog and book) supplies thermal energy to the surface mostly in daylight hours, especially when there is cloud cover, so that there is no excess warming by the Sun’s direct radiation to the surface.

    Hansen was not advanced enough in his understanding of thermodynamics to realise why this heat creep happens, so he wrongly guessed that back radiation was supplying the needed energy. You have not yet understood this critically important point.

    There is absolutely no other explanation than that in my “heat creep” hypothesis. Downward natural convective heat transfers (which in physics include thermal diffusion) are obviously happening on Venus, Uranus, Neptune etc and they must also happen on Earth, because radiation does not supply sufficient thermal energy into the surface to explain the temperature.

    If you had read my explanation of the hypothesis you would know what I meant by rotation of the thermal profile: sketch a plot of temperature against altitude, then, pick a point around 4Km altitude and reduce the gradient of the plot by rotating it anticlockwise about that pivoting altitude. This must happen in order to keep radiative balance with the Sun, because the area under the plot is approximately related to the outward flux. That is why water vapour cools, and carbon dioxide does also because of inter-molecular radiation having a temperature-leveling effect and thus working against the gravitationally-induced temperature gradient.

    You have still not correctly comprehended my main point that blows your hypothesis out of the window. You previous response about the models was irrelevant.

    Because you cannot explain how or why the surface temperature is related to radiation reaching that surface (in other words, it has nothing to do with radiative balance) you cannot assume that altering radiative balance will affect surface temperature. That’s basic logic. You have no valid physics supporting the conjecture that carbon dioxide warms. The IPCC most certainly also claims water vapour warms, doing most of “33 degrees” of warming in fact.

    The planet Uranus sorts the sheep from the goats, because it has close to an ideal troposphere with no solar radiation reaching the lower troposphere, and no convincing evidence of net energy loss at TOA, so no long-term cooling of the 5,000K core. You cannot explain how the required thermal energy gets down to the base of the nominal troposphere of Uranus, whereas I can.

    In that I have no grounds for believing the assumptions which you make (that are fundamental to your hypothesis) and you are not willing to provide any grounds with an explanation as to why you think surface temperatures depend on radiative balance, thus explaining the surface temperature, I am only henceforth willing to spend time answering any questions that you may have if and when you ever wish to read my explanation of the “heat creep” hypothesis, which I have very carefully and specifically developed from the Second Law of Thermodynamics.

    In summary your hypothesis is incorrect because of unsubstantiated assumptions, and the fact that, despite several requests, you cannot explain the surface temperature with valid radiation calculations. My hypothesis is the more likely to be correct because there is no empirical evidence anywhere in the Solar System that can be used to refute it, and the estimates of temperatures that it can be used to make agree well with observations. Most importantly, it explains the necessary transfers of thermal energy needed to support the observed temperatures.

    QED

    Doug

  23. Doug^C says:

    Roy

    I hope you don’t mind my recording here for the public record this email correspondence I have had with Jo Nova’s husband. You will find it instructive yourself when you read it, perhaps by late 2017 when I hope to have underway (and in worldwide news) the class action by many large companies against the Australian Government.

    Anyway, David Evans replied with a two-liner claiming he had not made the assumption I stated, even though I had quoted him when he wrote:

    “It is assumed that the surface warming caused by increasing CO2 is proportional to the radiation imbalance caused by the increasing CO2”

    Then I replied …

    I asked you to defend your false assumption that altering radiative balance would change the surface temperature. To do so you had to prove first that the surface temperature occurs in conjunction with and as a result of radiation balance with the insolation. Solar radiation (being 168W/m^2) would not even get the mean surface temperature up to -40C. Radiation from the atmosphere does not penetrate warmer water by more than a few nanometers, and cannot be thermalised in anything that is warmer than the source of spontaneous emission. Because the surface temperature is in fact determined mostly by non-radiative heat transfer (and ALL by such on Venus) radiative balance is never attained and totally irrelevant, and such surfaces are not black bodies or even grey bodies by definition.

    I’m really not interested in “last resort” comments as in your previous email. You have no idea how many hundreds of arrogant Yanks I’ve debated these matters with on blogs – when their knowledge of the relevant physics is obviously deficient they virtually always resort to smears etc as a last resort.

    Nobody has proved me wrong anywhere, and you cannot link me to any such proof on any climate blog. That in fact is actually why I prefer public debate rather than private emails, preferably in a neutral domain where my comments stand for the record, year after year. Hence my last email to you has been on Roy Spencer’s thread,* but don’t bother replying there unless you discuss physics, wherein I can detect (from 50 years of helping undergraduates understand such) you don’t understand the process of maximum entropy production, and you don’t even know why it is so relevant to climate. Nobody can prove wrong what is correct physics, based on the laws of physics, supported by experiments with centrifugal force and by evidence throughout the Solar System.

    Reply there on Roy’s thread, or submit your claim for the AU $10,000 reward to my blog https://itsnotco2.wordpress.com

    Cheers

    Doug

    * http://www.drroyspencer.com/2016/01/uah-v6-global-temperature-update-for-dec-2015-0-44-deg-c/#comment-206303

  24. Doug*C says:

    For the record, my next reply to David Evans, husband of climate blog owner Joanne Nova read …

    David

    This is not about my communication methods: it is about 21st century understandings of entropy, thermodynamics and radiative heat transfer. I struggle to find a single phrase of valid physics in your emails.

    Your hypothesis is based on the false conjecture that radiation to a planet’s surface determines its temperature. That is not correct for a planet with a significant atmosphere like Earth and Venus. Instead the gravito-thermal effect totally dominates any effect of radiation, which is too weak anyway.

    You ignore the gravito-thermal effect (a direct corollary of the Second Law of Thermodynamics, as I have explained) and so you are in the wrong ball park altogether – the wrong paradigm.

    Were you awarded a scholarship by the Physics Dept of a major university as I was? Have you specialised in post-graduate study of thermodynamics and radiative heat transfer for several years, as I have? Has Joanne? You could start with Mathematical Physics of BlackBody Radiation by this brilliant professor which shows why your “thesis” is in the wrong ball park altogether. If one bar radiator makes an object 350K, then do 16 radiators make it 700K? Can you add solar radiation and back radiation and get a much hotter result?

    You are still a believer in Hansen’s fictitious, fiddled “radiative forcing” physics because you ignore the findings about (and experimental evidence for) the gravito-thermal effect.

    Read what “BigWaveDave” had to say about the gravito-thermal effect …

    “I have been earning a living as an engineer specializing in cutting edge technology for very large scale thermal energy transfer processes and power systems for close to 40 years. My credentials include BS, JD and PE, and I have four patents.

    “As for my qualifications to engage in argument with PhDs, I have many times been part of and have led teams with PhD team mates. I was also married to a PhD for 20 years.

    “Because the import of the consequence of the radial temperature gradient created by pressurizing a spherical body of gas by gravity, from the inside only, is that it obviates the need for concern over GHGs. And, because this is based on long established fundamental principles that were apparently forgotten or never learned by many PhDs, it is not something that can be left as an acceptable disagreement.”

    Read the following review of my book by someone who understands entropy and thermodynamics, regarding how I show… “… simple thermodynamic physics implies that the gravitational field of a planet will establish a thermal gradient in its atmosphere. The thermal gradient, a basic property of a planet, can be used to determine the temperatures of its atmosphere, surface and sub-surface regions. The interesting concept of “heat creep” applied to diagrams of the thermal gradient is used to explain the effect of solar radiation on the temperature of a planet. The thermal gradient shows that the observed temperatures of the Earth are determined by natural processes and not by back radiation warming from greenhouse gases. Evidence is presented to show that greenhouse gases cool the Earth and do not warm it.”

    Attempts to refute the gravito-thermal effect are flawed, as explained here.

  25. DougCotton says:

    David

    We both agree that changes in ASR causes changes in surface temperatures. My hypothesis says the whole thermal plot (temperature against altitude) in the troposphere rises to a parallel position (ie with same lapse rate) in accord with blackbody calculations for the ASR. For example, using the very approximate result based on homogeneous solar flux night and day just for this exercise, we get Pierrehumbert’s 255K figure for 30% albedo as follows …

    Let’s use 1361 for solar constant in 1998:

    ASR = (0.7/4)*1361 = 238.175W/m^2

    Increase 1984 to 1998: 2.2W/m^2 gives 235.975 in 1984

    These figures give blackbody temperatures of 253.99K in 1984 and 254.58K for 1998, a difference of 0.59 C degree which is in the ball park – all natural. Likewise their changes in ASR since 1998 give a realistic indication of observed slight net cooling as per Roy Spencer’s data.

    Regarding variations in global % water vapor …

    Results* of my study indicate a small cooling effect of the order of 2 degrees for a 1% increase in water vapor. Of course mean global water vapor concentration (just over 1%) is highly unlikely to vary by more than 0.1% causing 0.2 degree, but probably somewhat less anyway, and tending to average out because any warming produces more evaporation with a subsequent cooling to compensate.

    So I say it’s pretty much all to do with natural variations in ASR, which, by the way, appear to correlate compellingly well with the inverted plot of the scalar sum of the angular momentum of the Sun and all the planets, as here: http://climate-change-theory.com

    *Means of Adjusted Daily Maximum and Daily Minimum Temperatures

    Wet (01-05): 30.8C 20.1C

    Medium (06-10): 33.0C 21.2C

    Dry (11-15): 35.7C 21.9C

  26. Doug*C says:

    Eventually our Dr David Evans, who has only done First Year in Physics at Sydney University, predictably wrote a typical final email attempting to smear me I guess (I didn’t read much) so I replied …

    I have not read all of your obvious “last resort” email as it has no physics.

    The mean surface temperature is NOT a function of ANY radiation because it’s not a black or grey body and no radiation (solar or atmospheric) is strong enough on average to explain the global mean temperature.

    Least of all is surface temperature a function of the radiation from CO2 which is nothing like full spectrum, and virtually always colder than the surface.

    To prove your conjecture that the surface temperature is a function of solar and back radiation (incorrectly combined) you would have to confirm at least one point on the graph, calculating the surface temperature from such radiation. You can’t.

  27. Doug*C says:

    These questions stump all Lukes and Warmists:

    (1) You claimed an incremental rise in surface temperature can be expressed as a function of an incremental increase in carbon dioxide radiation which would normally come from a colder region of the atmosphere. Is that a reasonable summation of a key element of the greenhouse hypothesis?

    (2) Assuming “yes” then I say that (to convince me of that hypothesis) I need empirical evidence that the surface temperature is a function of such radiation, because if it is not, then neither is the derivative of the Temperature. Is that correct?

    (3) Assuming “yes” then please explain at least one point on the graph, which does not prove the function is correct, but at least supports it and does not disprove it. If you can’t do so with correct physics then I am not convinced in any way, shape or form. Is that reasonable?

    (4) Assuming “yes” then please explain a typical surface temperature of, say, 15C by demonstrating (using any relevant data about any flux) how you calculate 15C from such typical radiative flux alone.

    I would appreciate discussion of the physics only.

  28. Doug*C says:

    (continued)

    When they claim that a mean flux of 390W/m^2 explains 15C (because that is the blackbody temperature) ask them if they understand that temperature is only proportional to the fourth root of the flux. Then, get them to agree that the flux varies a lot, and ask for calculations for five equal regions having 20%, 60%, 100%, 140% and 180% of the mean flux. (They will get a lower temperature around 2C.) Finally, ask them why they think they can add together solar radiation and back radiation in their Stefan-Boltzmann calculations. Suggest that, if an electric bar radiator is raising the temperature of an object to 350K, then, if there were sixteen such radiators and we add all the flux, Stefan Boltzmann calculations would give a temperature of 700K. Ask if they think that would happen. Assuming “no” then ask why they think they can add solar radiation and back radiation. They cannot claim to be able to do so because they have just agreed that adding the flux from all the radiators does not give a realistic temperature. Any one such example disproves their conjecture that radiative fluxes can be compounded in that way.

  29. Doug*C says:

    David (Evans) and Jo (Nova)

    I have studied the climatology fictitious fiddled physics extensively and pinpointed errors in the “gold standard” text by Pierrehumbert, and in the IPCC documentation. If you were to give me an exam in the stuff climatologists are brain-washed with in their brief course on such, I would know the “right answers” and probably top the year, knowing that I was lying through my teeth.

    You have no idea about the extent to which I have studied such, and that’s why I could anticipate what you were going to say, David, as I read your posts. It’s all wrong David because it is not supported by empirical evidence and it disregards the entropy maximization process that the Second Law is all about. It also has false concepts about photons, which do not all have their energy converted to thermal energy in a target, unless the target is at oK.

    It is because you know nothing about Mathematical Physics of BlackBody Radiation that you have believed this garbage from Hansen, Pierrehumbert, the IPCC et al. In contrast, Prof Johnson told me I was one of only a few to correctly understand his work, which I then extended in my 2012 paper.

    You know what to read if ever you want to find out the truth. Meanwhile I shall continue exposing the false AGW physics wherever I see it. Lukes are just as wrong as warmists, and they help the warmists by agreeing when they should not.

  30. Doug*C says:

    In summary I am not meaning that David (Evans) believes the sensitivity calculations and maybe some minor details, but he DOES believe the paradigm that back radiation can be added to solar radiation and the total used in Stefan Boltzmann calculations to get the surface temperature. Radiation cannot be thus compounded, yet that is a key assumption of the radiative forcing GH conjecture. It was refuted in my 2012 paper which you also have not studied in nearly 4 years.

    The other wrong assumption that David believes (and I quoted him) is that if carbon dioxide alters the radiative balance then the surface temperature will vary in proportion with (in his words) the slope of the Stefan-Boltzmann curve – presumably he means the S-B expression with T as subject on the LHS and a fourth root of flux on the RHS.

    An increase in carbon dioxide does not cause warming of the surface because radiation is not setting the surface temperature in the first place.

  31. thefordprefect says:

    DC perhaps you need to talk to these people:
    How to get that old-fashioned light bulb glow without wasting so much energy

    http://www.sciencemag.org/news/2016/01/how-get-old-fashioned-light-bulb-glow-without-wasting-so-much-energy


    The team flanked the sheetlike tungsten emitter with two sheets of the glass-coated photonic crystals and turned on the power. As they report today in Nature Nanotechnology, the crystals allowed virtually all the visible light to pass through but reflected the majority of IR photons back to the emitter, where they were reabsorbed. The energy recycling ultimately improved the efficiency of the bulb to 6.6%, triple that of conventional light bulbs.

    • Doug*Cotton says:

      You’re on the wrong thread. The reflected photons weren’t actually thermalized again in the source, as that is impossible with reflected radiation, but they slowed the rate of radiative cooling, which is well known physics. For more detail see my 2012 paper on radiated energy that is linked from the ‘Evidence’ page at http://climate-change-theory.com

    • Doug*Cotton says:

      Please read this comment of mine and feel free to continue the discussion tomorrow on that thread which is about these globes.

    • Norman says:

      thefordperfect,

      Good luck with the Cotton. He only accepts experiments that confirm his own belief system (ask Ball4 who had tried to open his mind to actual evidence for quite some time now and multiple threads). He rejects all physics unless it agrees with him. It is pointless to reason with him or respond to his posts. It is the constant replies he thrives on. The best way to get rid of this tortured spirit is to quit communicating with him (you can try but it is totally pointless he has been spewing vomit on many blogs for several years and it never changes and he never learns).

      • Doug*C says:

        Everything I say is based on what the fundamental long-established laws of physics confirm. Norman, of course, is not qualified in physics.

        • Norman says:

          Doug*C

          Nothing you say is based upon any physics and I am far more qualified in physics than you. I did take one semester of college physics and got a B which is considerably more physics than you have taken by reading Wikipedia pages and not understanding the content.

          Prove to me with experiment that IR radiation is not absorbed by the tungsten in “thefordprefect” link. I think you need to wretch some more to spew chunks of disconnected physics all over the blog.

          • Doug*C says:

            Norman, and others, I studied a full B.Sc degree course in physics at Distinction level under Prof Harry Messel and his team. I was also awarded a scholarship by them in the Physics Dept of Sydney University. Get your facts right, my friend. The qualifications I have from 9 years of university education at Sydney and Macquarie Universities are shown on the title page of each of my papers that are linked form the ‘Evidence’ page at http://climate-change-theory.com and it’s a weak act of yours to defame me whilst hiding behind an anonymous name: otherwise I’d sue you. You need to stop writing your childish comments.

          • Doug*C says:

            The proof regarding tungsten, Norman, is in Mathematical Physics of BlackBody Radiation which is way over your head. My 2012 paper (based on the work of that professor) may make it easier for you to understand. It is linked from the ‘Evidence’ page on my website.

          • Doug*C says:

            And, Norman, I have previously provided an experiment with 16 radiators not producing a temperature of 700K when one produces 350K (so radiation cannot be compounded, by multiple reflections in this case) and that experiment is also mentioned on my blog. Fuirthermore, my 2012 paper is about radiated energy and answers you question in detail, as you would know if you had studied it.

            Stop wasting my time, Norman. In future I will just refer you to my websites, papers, videos, blogs or book for answers already written year ago, but not yet read by you who is too lazy to do so.

          • Doug*C says:

            Joanne Nova’s statement is incorrect: the infrared wavelengths get reflected as if from a mirror. They then travel back to the filament, adding more heat that then gets converted to more light.

            Radiation such as the radiation which comes back to the filament is not thermalised (as you claim it is) and the energy in that radiation only temporarily becomes electron energy (raising an electron through some quantum step) and then is re-emitted with an identical photon that cannot thus convert IR into visible radiation as the electron returns to exactly its original state.

            Thats is why they incorrectly think they could achieve 40% efficiency, but I guess even <10% will be good for Christmas colored light shows and small special purpose incandescent light globes.

          • Norman says:

            Doug*C

            IR does not move electrons up and down energy levels. That is the radiation of visible and UV light. IR energy is generated by the motions of atoms within a molecule, bends, twists an vibrations. Because it does not manifest as much electromagnetic change as an electron moving from a lower to higher energy state or visa versa, the energy released in IR is less. IR is an ensemble of bending and twisting of atoms that emit electromagentic energy. Nothing to do with electrons moving up and down an electric potential.

          • DougCotton says:

            Do please link me to your source Norman, as I ignore your assertive interpretations gleaned in the lunch hour from your mates in climatology courses.

  32. Norman says:

    pDoug*C

    You have ignored the question I had asked you. Why do you set some arbitrary anchor point in the atmosphere as the temperature that sets the surface and core temperatures of planets? Much more logical is that the surface temperature is what sets the temperature of the atmosphere. Enough of your backward logic and thinking. It is wrong. In reverse thought process wrong is right and incorrect is correct. That is why no one can reason with you except for another backward thinker.

    • Doug*C says:

      Good question for once, Norman, but not your assumption about the (solid) surface temperature. Uranus has no solid surface at the base of its 350Km high nominal troposphere, and no solar radiation reaching down there. The Venus surface could not be heated to 735K by radiation that is about a tenth of what Earth receives at its surface. It is yours that is “backward logic and thinking” because things would never work out correctly with the right temperature gradient getting down to the right level at just the right altitude, as happens in all planets with atmospheres.

      If you repeat that imagined “coincidence” of yours for all planets, then the probability that you’re right is less than 1 in a million.

      So, regarding the anchoring layer (your only good point) …

      (1) For Uranus it is clearly defined as being the methane layer near TOA which does nearly all the absorbing and re-emitting to space of the very weak solar radiation, and Stefan-Boltzmann calculations yield a temperature of about 60K which agrees with measurements by spacecraft.

      (2) For Venus it is broadly the weighted mean effect of the absorption of solar radiation from the stratosphere down to the upper troposphere regions that are still below about 400K, because the solar radiation cannot raise the temperature in the lower troposphere where temperatures get up to about 730K.

      (3) For Earth it’s similar to Venus. For example, for the majority of Earth’s surface and the surface layer of the atmosphere the solar radiation is already too weak to raise the temperature. So it’s all the rest above that.

      So, the “anchor layer” is an imaginary weighted mean layer based on all layers that can actually be warmed by solar radiation because their existing temperature is below that achievable by the solar radiation they receive.

      For Earth, on average, I consider the anchor layer could be at a mean height of about 6Km and the mean temperature about 240K to 245K because the radiation is variable and so the 255K figure is overstated. For an average temperature gradient of about 6.5 to 7C/Km that would make the minimum daily temperature (the “supported” temperature) around 280K to 285K. The mean daily maximum would be about 10 degrees hotter.

      • Norman says:

        Doug*C

        You make the assertions “because the solar radiation cannot raise the temperature in the lower troposphere where temperatures get up to about 730K.”

        Why can’t it? Because you claim it can’t? I have easily and logically explained how it can but you reject it. It is the NET ENERGY equation. It is not how much energy a surface absorbs but what is the net radiation (IN/OUT) that determines equilibrium temperature.

        I explained it in terms you can understand. Boiling water. If you have 10 pots of water with the same energy input what is the boiling point of each? This is the equilibrium temperature of water, it is the point where the energy in equals the energy out. You cannot determine the boiling point based upon just the energy input (as you seem to want to do with planetary surfaces). I am not sure why you need to do this or why you continue to claim it is valid physics. The amount of incoming radiation to a surface cannot alone determine its equilibrium temperature. Other factors play into it. Primarily how much energy is leaving at the same time as energy entering. With boiling water it depends upon the external pressure. Lower pressure leads to a lower boiling point (equilibrium state) and higher pressure leads to a higher boiling point even if the input energy is the same in all cases. Do you get this?

        With Uranus it is not magic but the temperature of the surface you talk about can be explained in forward logic as heat coming out from the interior and you can draw your line starting from there, the source of heat from the planetary formation.

        • Doug*C says:

          “Why can’t it?” Norman asks.

          By Stefan-Boltzmann, the flux required to raise a temperature of 730K in a blackbody is 16,101W/m^2.

          If one electric bar radiator suspended outside a Space Station in the shadow of Earth raises a black sphere (emissivity 0.95) to 350K it needs to deliver a flux of 808.312W/m^2.

          Suppose we have 16 such radiators. Will they achieve double the temperature. A flux of 16 x 808.312 = 12,933W/m^2 will, at least by S-B, produce a temperature of 700K – well it would if we could add two or more fluxes (like solar radiation and atmospheric radiation) and use the total in S-B calculations, as the IPCC does in those energy budget diagrams that imply there is a net total of 390W/m^2 producing 288K. Garbage!

          There is no convincing evidence that there is any significant net energy loss at TOA on Uranus. Certainly not within orders of magnitude of what a core at over 5,000K would produce. So it’s not cooling off as you assume without doing an experiment or finding supporting evidence. Besides all that, the “coincidences” exercise makes the chance of my be wrong infinitesimal.

          • Norman says:

            Doug*C

            On your blog and here you post this one electric bar vs 16 example to prove radiation fluxes cannot add to make a surface hotter.

            You: “If one electric bar radiator suspended outside a Space Station in the shadow of Earth raises a black sphere (emissivity 0.95) to 350K it needs to deliver a flux of 808.312W/m^2.

            Suppose we have 16 such radiators. Will they achieve double the temperature. A flux of 16 x 808.312 = 12,933W/m^2 will, at least by S-B, produce a temperature of 700K well it would if we could add two or more fluxes (like solar radiation and atmospheric radiation) and use the total in S-B calculations, as the IPCC does in those energy budget diagrams that imply there is a net total of 390W/m^2 producing 288K. Garbage!”

            Why wouldn’t the flux add to increase the temperature of the surface? Do you have any supporting evidence it would not add? I think you may have information somewhere to support your conclusion but I can’t find it. I have searched thermodynamic equations and have not found a multi-radiation example yet. All are just two surfaces interacting so I can’t find evidence to support or reject your claim.

            This book may reject your claim but I am not sure and will keep an open mind on this one.
            http://mtixtl.com/machineflyer/Handbook.pdf

            Their ovens use multiple electric heating elements to achieve high furnace temperatures. Why do you need multiple elements if they have no greater effect? It would seem quite wasteful to build these furnaces with multiple heating elements if the energy from one raised the temperature to the same level as multiple. I still believe radiation flux is additive and as long as your source is hotter than the target the more sources you have the hotter the target will get.

          • DougCotton says:

            Norman: Is there something you don’t understand about the “coincidences” issue (in a previous comment) that shows why the probability that the greenhouse radiative forcing conjecture is right must be less than one in a million? I will start each future response to you with this question.

            Go and do your experiment with 16 radiators, Norman, to support your case. I have suggested that you won’t get a temperature of 700K. You might even get an idea with three or four, because not much extra temperature will be achieved anyway. Do you have any evidence that radiative flux compounds? Do you understand that the 16 radiator experiment would prove that it does not? Do you realize that you would need solar flux from a Sun only half the distance away to explain the surface temperature? I’ve also explained that in a previous comment, so stop wasting my time.

            I’ve also already referred you to the good professor’s paper Mathematical Physics of BlackBody Radiation.”

            I suggest you stick to your chemistry Norman, as your one year of physics does not make you a professor of applied mathematics like him, and I’d guess that I’ve done about 10 to 20 times as much study in physics as you.

          • DougCotton says:

            Sorry the link is http://www.csc.kth.se/~cgjoh/ambsblack.pdf and I quote the good professor from page 24 …

            “We shall find that the answer is resonance in a system of resonators (oscillating molecules):

            incoming radiation is absorbed by resonance,

            absorbed incoming radiation is emitted as outgoing radiation, or is stored as internal/heat energy,

            incoming frequencies below cut-off are emitted,

            incoming frequencies above cut-off are stored as internal heat energy.”

          • DougCotton says:

            So, Norman, once the temperature of the object reaches the temperature of the (hottest of) 16 radiators (which is nowhere near 700K) there can be no further heat transfers now can there? Your furnaces have multiple heaters so they get to the maximum temperature quicker. The maximum may be a little hotter because of the rate of cooling, but not hotter in accord with adding flux and bunging the total into S-B calculations – but that’s what is implied in the energy diagrams.

            All that the radiation going on between the Earth’s surface and the lower troposphere is doing is transferring thermal energy out of the surface, thus cooling the surface.

            The net mean energy balance we deduce from a typical energy diagram amounts to …

            Radiated energy from surface to atmosphere: 66W/m^2

            + Non-radiative energy transfers (ditto): 102W/m^2

            Balanced by Solar radiation into surface: 168W/m^2

            The blackbody temperature for 168W/m^2 is about -40C. But, because the solar flux is very variable, the mean temperature it could achieve would be even colder, perhaps about -60C.

            So you see I’ve been right all along Norman, and the probability that the radiative greenhouse effect is true is less than one in a million. And there is no physics and no evidence to support it.

            When you stand outside at night with a large umbrella do you notice a difference when you protect yourself from all the back radiation which has a similar flux to the solar radiation? No, because “heat creep” has kept you (relatively) warm. Have you noticed the surface cooling under thick cloud in calm conditions in the early morning? Not usually, because “heat creep” passes right through those clouds and on down to the surface, warming it – unlike solar radiation that is blocked by the clouds.

        • Doug*C says:

          And, Norman, I have previously asked you to answer “THE QUESTIONS WHICH STUMP LUKES AND WARMISTS” which is on my blog where I also address the issues you discuss about the surface temperature.

          If radiation were the only source of input energy (like Solar radiation of 168W/m^2 reaching the Earth’s surface or a mere 20W/m^2 reaching the surface of Venus) then the maximum temperature is most certainly determined by the flux of that radiation. That’s what Stefan-Boltzmann (S-B) is all about.

          But when the temperature is maintained by non-radiative processes (as with Earth’s surface, or the wall under the water in your hot bath) then non-radiative flux is not known and doesn’t need to be. If we add radiative flux that could not (by S-B) raise the temperature to the temperature already attained by non-radiative processes, then that radiation does not raise the temperature any more whatsoever, because it is pseudo-scattered.

          • Norman says:

            Doug*c

            This statement is why I highly doubt your claims to a physics degree. You can claim it on the internet but reality tells a different story.

            You: “If radiation were the only source of input energy (like Solar radiation of 168W/m^2 reaching the Earths surface or a mere 20W/m^2 reaching the surface of Venus) then the maximum temperature is most certainly determined by the flux of that radiation. Thats what Stefan-Boltzmann (S-B) is all about.”

            The maximum temperature is not determined by the flux of that radiation. It is determined by the NET radiation. The S-B equilibrium is the lowest temperature a surface will obtain in a given radiant flux because it is radiating away energy at the maximum rate. If the loss of radiant energy is slowed way down the temperature of the surface will be much warmer.

            Read up on multilayer insulation. It is used in space to slow down radiation loss or prevent radiation from overheating items in space. It is all radiation and it is slowing down the radiation loss.
            https://en.wikipedia.org/wiki/Multi-layer_insulation

          • Norman says:

            Doug*C

            It is really tiresome you keep using pseudo-scattered with no supporting evidence (some person’s math paper is what you use) in the meaning of an actual experiment to prove that IR is pseudo-scattered and not absorbed by a surface.

            An experiment would not be hard to perform but you won’t do it because you are a very lazy scientist. Purchase an IR spectrometer with your millions (instead of wasting in on a book publication) and get a spectrum of some surface. Once you establish a baseline spectrum beam a IR lamp at the surface of mostly a certain wavelength. Now redo the spectrum. If the IR is no absorbed and just scattered the wavelengths will show up on the new spectrum. If absorbed the spectrum will not show this energy but a uniform spectrum.

          • DougCotton says:

            Norman: I have experiments that I have discussed – do the radiator one yourself, even with 5 or 6 radiators that you may be able to borrow. Then there’s the experiment on my blog also that you could try. You could even read my 2012 paper which is all about this.

          • DougCotton says:

            Norman: If you would but read an dtry to understand my 2012 paper you would understand why there is no change in the outward spectrum from the target. So the very fact that the rate of surface cooling by radiation is slowed down proves that the incident radiation is pseudo scattered and fulfills that part of the Planck “quota” for the outward radiation.

            The surface does not use its own thermal energy for that portion of the radiation spectrum, so it cools more slowly.

            Nothing changes the Planck function of the warmer surface.

            So please stop wasting my time when you have either not read or not understood my 2012 paper on radiated energy that is linked from the ‘Evidence’ page of my website.

          • DougCotton says:

            And Norman, we are not talking about artificially generated radiation from your “IR lamp” which would have far greater intensity that would lead to reflection as well. The whole point is that natural radiation from a colder source has a Planck function which is fully contained within the area under the Planck function for the warmer target. This is very clearly explained in the paper which you have obviously not understood. There I explained that resonance can thus happen for the radiation under the “cooler” Planck function which is thus common to both source and target. What cannot resonate is thermalized. Students who don’t understand physics rarely remember much for very long in their lives.

          • DougCotton says:

            When the Sun warms a near-blackbody (like a dark rock) in Space and when equilibrium is attained the “Net” flux is zero because flux in = flux out. Norman thinks the temperature would be based on this net flux, and thus be zero I suppose. Norman does not have a degree in Physics. Sydney University records for 1966 show I completed my first degree in Science that year (doing just the two subjects, Physics and Pure Mathematics in the final year) with a graduation ceremony about March the following year. I remember it well.

        • Doug*C says:

          You see, Norman, when you write “you can draw your line starting from there, the source of heat from the planetary formation” you forget that the temperature gradient all the way can be determined from the quotient of the acceleration due to the planet’s gravity and the weighted mean specific heat of the gases. (There is a small reduction due to inter-molecular radiation between IR-active “greenhouse” gases, but its only about 5% to 10% for planets like Uranus, up to about a third for Earth because of water vapour.)

          So, Norman, the huge coincidence which you require is that, at this point of time in the Solar System, the core of Uranus just happpens to be at just the right temperture such that the temperature gradient is just right all the way out to the radiating methane layer which is at just the right altitude near TOA where the temperature has got down to just the right level (about 60K) so as to be in radiative balance with the radiation from the Sun that is about 30 times further away than it is from Earth. Extend your huge coincidence, Norman, to other planets with atmospheres, and the chances that you are right are millions (if not billions) to one against.

          I am not going to have any more discussion with you Norman until you “explain” these huge coincidences (which I have mentioned before) with correct physics – which of course you can’t. The same goes for Mack and others.

          Sooner or later you will all realise, Roy included, that I have been right all along.

    • Doug*C says:

      If that still does not help your understanding of my hypothesis, then, Norman, it’s time for you to spend an hour or so studying my 2013 paper linked from http://climate-change-theory.com. Get back when, and only when, you have.

  33. Norman says:

    Doug*C

    I have read your papers and your website and it is still crap physics no matter how many times you want to repeat it. It is not valid it has no support from you and is countered by many real world experiments you are far too lazy to perform. Roy did experiments, Curt did experiments you do not experiments yet think of yourself a brilliant physicist. Based upon what? Do some experiments and post your results.

    • Doug*C says:

      I don’t respond to comments like yours, Norman, that contain no physics. What I present is correct physics, backed up by over 900 experiments this century, plus planetary data, a study and my computations which were first in the world to quantify the radial temperature gradient due to centrifugal force observed in a vortex tube. This was explained with the same gravito-thermal hypothesis that the brilliant 19th century physicist, Josef Loschmidt (who taught Maxwell) postulated way back then.

      Come back when you, Norman, can answer the questions about the greenhouse effect in the section “QUESTIONS THAT STUMP LUKES AND WARMISTS” on my blog.

    • DougCotton says:

      The fact that you think it is “crap” physics Norman is of course due entirely to your lack of qualifications in physics, your lack of even a second year tertiary course in physics and your complete lack of understanding of the relevant physics, such as entropy maximization. What is entropy, by the way?

      If you read and understood my papers, draw the heat creep diagrams from memory, labeling the axes, and tell us why they are drawn with non-orthogonal axes.

  34. Dr. Mark H. Shapiro says:

    The December 2015 global temperature data from the Japan Meteorological Agency are now available, and they show that December 2015 crushed the previous record high temperature for December by more than a factor of two!

    http://ds.data.jma.go.jp/tcc/tcc/products/gwp/temp/dec_wld.html

    Any comments Dr. Roy?

    • DougCotton says:

      But absolutely none of the warming can possibly be due to carbon dioxide, because correct physics shows us that the gravito-thermal effect is a reality, as is the resulting “heat creep” process, and this obviates the need for concern over greenhouse gases. The statistical probability of this being not the case is millions to one against, for reasons explained in the next thread.

    • Mel Famie says:

      “December 2015 crushed the previous record high temperature for December by more than a factor of two!”

      So it was 600K in December? Huh.

  35. Norman says:

    Doug*C

    As typical of your posts you never provide enough information for a reader to form a proper conclusion.

    You state in a post above: “So, Norman, once the temperature of the object reaches the temperature of the (hottest of) 16 radiators (which is nowhere near 700K) there can be no further heat transfers now can there?”

    I have not seen any post giving a temperature of any of the radiators involved. Most heating elements in electric heaters are much above 700 K (look at my link above on electric heaters). You have to be more clear with your points.

    • DougCotton says:

      No they are not effectively “much above 700K” Norman at the distance which achieves a temperature of 350K. Try boiling some water in a nearby bowl. After all, 700K is getting close to the surface Temperature of Venus.

      We are talking about small one-bar radiators (using about 800 to 1000 watts of electricity) that can only raise an object to 350K at some given distance. So you have the initial condition that the effective flux (after attenuation over some small distance) is only enough to achieve 350K. Of course I was assuming the other 15 were then placed at the same distance in a circle or sphere around the central body. So the flux from each of them (after attenuation due to distance) is that required for 350K. Work out that flux using S-B, then multiply the flux by 16, put the result back into S-B and you will of course get double the temperature (namely 700K) because 2^4=16.

    • DougCotton says:

      Nobody, not even Roy or anyone from about 100 climate blogs and social media threads has answered the QUESTIONS THAT STUMP LUKES AND WARMISTS on my blog and thus explained the surface temperature with radiation calculations.

    • DougCotton says:

      Are you going to admit your mistake Norman?

      As for the others, they never discuss thermodynamics and entropy anyway, so I’m not interested in their red herrings pertaining to radiation, which is not what determines surface temperatures. However they could learn from your mistake and the experiment in Singapore which proves pseudo scattering happens.

  36. DougCotton says:

    The “coincidences” issue proves beyond reasonably doubt that greenhouse concepts are false. See this comment.

  37. Martin Hertzberg says:

    Why all this fuss about whether the Earth’s temperature (whatever that means) is going up or down or staying the same. Whatever it does relative to the CO2 trend proves nothing. Parallel trends do not prove causation. The precedence of temperature changes before CO2 changes is enough to falsify the IPCC paradigm. So should the complete absence of a scientifically valid definition of the fictitious “greenhouse gas”. So should the recent satellite data of the global distribution of atmospheric CO2.

    • DougCotton says:

      Mostly correct, Martin. However, it is not a lack of “definition” of a GHG that is relevant. We accept water vapor, CO2 and CH4 are IR-active gases. What is lacking is any correct physics showing why IR-active gases should warm the surface. Now, with what I have been first to explain (summarized here) we know from correct physics how all planetary temperatures are supported and how the required thermal energy transfers take place in accord with the laws of physics.

      This is the major 21st century breakthrough in our understanding of atmospheric physics that nobody has proved to be incorrect since it was published about three years ago.

  38. DougCotton says:

    Now go to this comment.

  39. Mike Gale says:

    The image UAH_LT_1979_thru_December_2015_v6-1.png is not showing up. Tried several times in two browsers. In one test I get a 403 forbidden message, the message may be of use to you in identifying the problem:

    “You don’t have permission to access /wp-content/uploads/UAH_LT_1979_thru_December_2015_v6-1.png on this server.

    Additionally, a 403 Forbidden error was encountered while trying to use an ErrorDocument to handle the request.”

  40. snikda divad says:

    What happened to the graph? Can’t see on my mac.

  41. DougCotton says:

    Now go to this comment.