UAH V6 Global Temperature Update for April, 2016: +0.71 deg. C

May 2nd, 2016 by Roy W. Spencer, Ph. D.

NOTE: This is the thirteenth monthly update with our new Version 6.0 dataset. Differences versus the old Version 5.6 dataset are discussed here. Note we are now at “beta5” for Version 6, and the paper describing the methodology is in peer review.

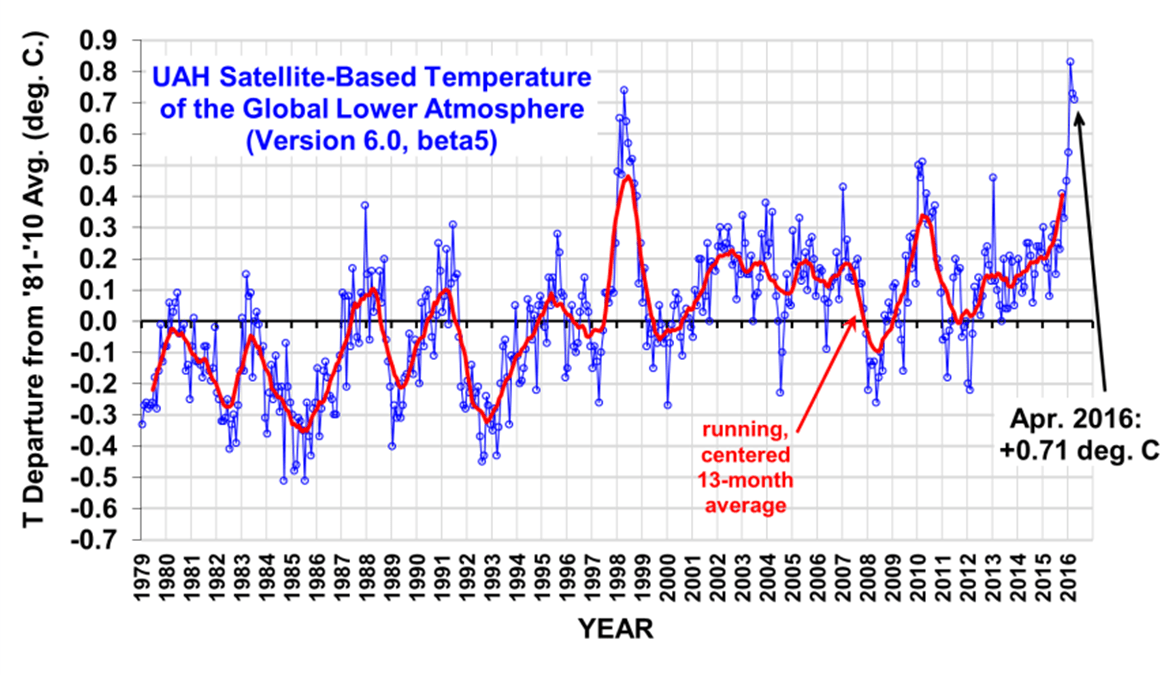
The Version 6.0 global average lower tropospheric temperature (LT) anomaly for April, 2016 is +0.71 deg. C, down slightly from the March value of +0.73 deg. C (click for full size version):

UAH_LT_1979_thru_April_2016_v6

The global, hemispheric, and tropical LT anomalies from the 30-year (1981-2010) average for the last 16 months are:

YEAR MO GLOBE NHEM. SHEM. TROPICS
2015 01 +0.30 +0.44 +0.15 +0.13
2015 02 +0.19 +0.34 +0.04 -0.07
2015 03 +0.18 +0.28 +0.07 +0.04
2015 04 +0.09 +0.19 -0.01 +0.08
2015 05 +0.27 +0.34 +0.20 +0.27
2015 06 +0.31 +0.38 +0.25 +0.46
2015 07 +0.16 +0.29 +0.03 +0.48
2015 08 +0.25 +0.20 +0.30 +0.53
2015 09 +0.23 +0.30 +0.16 +0.55
2015 10 +0.41 +0.63 +0.20 +0.53
2015 11 +0.33 +0.44 +0.22 +0.52
2015 12 +0.45 +0.53 +0.37 +0.61
2016 01 +0.54 +0.69 +0.39 +0.84
2016 02 +0.83 +1.17 +0.50 +0.99
2016 03 +0.73 +0.94 +0.52 +1.09
2016 04 +0.71 +0.85 +0.58 +0.94

I expect average cooling to continue throughout the year as El Nino weakens and is replaced with La Nina, now expected by mid-summer or early fall. Nevertheless, 2016 could still end up as a record warm year in the satellite record…it all depends upon how fast the warmth from the El Nino dissipates and La Nina sets in.

The “official” UAH global image for April, 2016 should be available in the next several days here.

The new Version 6 files (use the ones labeled “beta5”) should be updated soon, and are located here:

Lower Troposphere: http://vortex.nsstc.uah.edu/data/msu/v6.0beta/tlt/uahncdc_lt_6.0beta5.txt
Mid-Troposphere: http://vortex.nsstc.uah.edu/data/msu/v6.0beta/tmt/uahncdc_mt_6.0beta5.txt
Tropopause: http://vortex.nsstc.uah.edu/data/msu/v6.0beta/ttp/uahncdc_tp_6.0beta5.txt
Lower Stratosphere: http://vortex.nsstc.uah.edu/data/msu/v6.0beta/tls/uahncdc_ls_6.0beta5.txt


430 Responses to “UAH V6 Global Temperature Update for April, 2016: +0.71 deg. C”

Toggle Trackbacks

  1. jerry l krause says:

    Hi Roy,

    Maybe you could review why the average value of any atmospheric variable for the earth is so important when it is known that the value of such a variable at any moment of time varies over such a wide range.

    Have a good day, Jerry

    • are you saying the *global average* varies a lot over time, or the temperature at a *specific location* varies a lot over time?

      • Roy Spencer says:

        Jerry, your question seems to be a non sequitur. A time average of rapidly varying quantities are often useful to monitor the average state or average behavior of a system. So, I’m not sure what point you are attempting to make.

        If the climate system was rapidly warming, say by 10 deg. C/decade, would not monitoring that warming with monthly averages be useful?

        Similarly, if there is no warming at all, would not monthly monitoring also be useful?

        • jerry l krause says:

          Hi Roy,

          You asked: “If the climate system was rapidly warming, say by 10 deg. C/decade, would not monitoring that warming with monthly averages be useful?” And: “Similarly, if there is no warming at all, would not monthly monitoring also be useful?”

          My answer to both questions is no, this information by itself is contributes nothing to understanding how it is that the system is varying or not varying.

          One reason you, and others, average I believe (assume) is that it is well known (observed) that the weather, at a specific location, of one year can be quite different from that of the previous year and of the following year. What I consider to be very important is developing an understanding how this well observed variation occurs instead of focusing on minute changes in average values over decades or centuries or even longer periods.

          It seems there can be little doubt that the earth’s atmospheric system is capable of rapid yearly change. And if one cannot explain the cause-effect of this rapid change, how can one expect to be able explain minute average changes that occur over a decade or longer?

          Have a good day, Jerry

          • “this information by itself contributes nothing to understanding how it is that the system is varying or not varying.”

            — before determining causation, one must first observe, Jerry.

            “One reason you, and others, average I believe (assume) is that it is well known (observed) that the weather, at a specific location, of one year can be quite different from that of the previous year and of the following year. What I consider to be very important is developing an understanding how this well observed variation occurs instead of focusing on minute changes in average values over decades or centuries or even longer periods.”

            –Jerry, what you describe is *weather*. We understand why weather variations occur.

            “It seems there can be little doubt that the earths atmospheric system is capable of rapid yearly change. And if one cannot explain the cause-effect of this rapid change, how can one expect to be able explain minute average changes that occur over a decade or longer?”

            –I agree we need to have a better understanding of natural, interannual temperature variations. But, again, we can’t explain it if we can’t observe it first, right?

      • jerry l krause says:

        Hi Roy,

        I see that I did not properly define the word ‘variable’. A ‘variable’, as I intended it, is atmospheric temperature or dewpoint temperature, or atmospheric pressure as measured at a specific point in space (be it at the surface, whose elevation is also a variable, or at some elevation (relative to sea level) above the surface and at specific time.

        Since you are averaging the variable ‘temperature’, we can focus on the measurement of its value as has been and is being commonly done and reported every hour at many surface locations world-wide. Now any moment of time is based upon the GMT and not the local standard time of each of the specific locations.

        At any moment of time the value of the surface temperature at the equator is usually going to be considerably greater than that at North Pole at, say 1 am GMT on December 23. At at this time, along the equator, the value of surface temperature will likely vary because of the commonly observed diurnal temperature oscillations as well as because of other local factors (variables), that are occurring at specific locations along the equator.

        I believe it is commonly accepted that the differences in the values of these temperatures at this moment of time contribute to the horizontal circulation (another variable of the atmosphere) of the surface atmosphere that is occurring at this same moment of time.

        If one focuses upon an average temperature of all the temperatures which are being measured at that moment time, or any other moment of time, there can be no atmospheric temperature gradient because there is only one average temperature for the entire earth.

        My definition of average is that all the values of temperatures being measured world-wide at that moment of time are added together and divided by the number of measurements added together. But I must emphasis I consider any averaging process a waste of effect because it is not an actual value. And if the actual values of atmospheric variables at a given location and a given time are not important to our understanding of weather and climate, why are we making such an effort to measure them?

        You also wrote: “A time average of rapidly varying quantities are often useful to monitor the average state or average behavior of a system.” I ask: If a system is capable of rapidly varying quantities is that not an extremely important factor (property) of the system being studied?

        Have a good day, Jerry

        • we have published papers on the rapidly vaying character of temperature, including an explanation for those variations: e.g. http://www.drroyspencer.com/wp-content/uploads/Spencer_07GRL.pdf

          Our monthly global temperature updates aren’t advertised as being the sum total of what is known and published on the subject. You need to read what’s out there before claiming the knowledge doesn’t exist or the issue is being ignored.

          • wert says:

            You need to read whats out there before claiming the knowledge doesnt exist or the issue is being ignored.

            Amen to that. It is very difficult to do a well-grounded observation on something being ignored in literature. It requires you to read pretty much every abstract and plenty of boring papers you are not really interested.

            That is not a little exercise.

          • mpainter says:

            “You need to read whats out there before claiming the knowledge doesnt exist or the issue is being ignored.”
            ###

            Good advice, Jerry Krause. If you would only take it.

            Have a good day.

          • jerry l krause says:

            Hi Roy,

            Thank you for the referral to your article.

            But you wrote: “You need to read whats out there before claiming the knowledge doesnt exist or the issue is being ignored.” I have reviewed what I wrote and I do not see what I wrote that you conclude that I claim the knowledge doesn’t exist or the issue (???) is being ignored.

            You wrote: “We understand why weather variations occur.” and then you wrote: “I agree we need to have a better understanding of natural, interannual temperature variations.” Are not natural, interannual temperature variations weather?

            Thank you for responding to my comments. Since my comments seem no more popular than those of the problem, I will retire from participating on your site again. This because it seems little that is profitable has occurred.

            Have a good day, Jerry

    • geran says:

      Jerry, maybe you could review the definition of “average”…

  2. geran says:

    NHEM has dropped for the last two months, while SHEM has gone up for those same months. That’s kind of interesting.

    • dave says:

      Judging by the “global 2-meter anomaly” of Maue, the two hemispheres are now (May 13)similar. Since the beginning of March, the Northern number has dropped from just over + 1.5 C to just under + 0.5 C while the Southern has wandered around between + 0 C and + 0.5 (currently at about + 0.4 C.)

  3. Daniel Kirk-Davidoff says:

    Regressing Jan-Dec against Jan-Apr in your Lower Trop data I get a prediction of a 2016 anomaly of 0.51 +/- 0.03 C. Record is 0.48 C, so a strong chance of a record in your data. To *not* get a record, the difference between the Annual mean and Jan-Apr mean would itself have to be very close to the record low (which was itself a big outlier at 0.16 C).

  4. Daniel Kirk-Davidoff says:

    Sorry, that’s -0.16 C!

  5. RW says:

    Thanks for the report, Roy.

  6. Mike Maguire says:

    Thank you Dr. Spencer.

    What are your thoughts on the current PDO? I noted another spike higher earlier this year, and with 24 consecutive months in positive territory.

    http://research.jisao.washington.edu/pdo/PDO.latest

    The previous negative PDO regime featured a period with some positive values(late 50’s/early 60′) which was just an interruption, then stayed mostly negative for around 15 years.

    It’s impossible to know longer term but with the likely La Nino by later this year and 2017, the table “might” be set for something similar…..my wild guess.

    What’s your guess?

  7. Werner Brozek says:

    According to:
    http://www.moyhu.blogspot.com.au/p/latest-ice-and-temperature-data.html#NCAR

    The January average was 0.665 and the April average was 0.636. Yet UAH had January at 0.54 and April at 0.71. I realize that the two are not measuring the same thing, but due to the adiabatic lapse rate, I would not have thought that the difference would be that large. Does anyone have any thoughts on why the January-April difference is so large?

  8. dave says:

    “…why..?”

    Perhaps the world is a complicated place. While its owner does not care to keep things consistent to tenths of a degree.

  9. The CFSR/CFSV2 global surface temperature anomaly as reported by UM CCI also dropped a bit for April. The estimates below are preliminary in degrees C relative to 1981-2010.

    +0.57 Jan
    +0.72 Feb
    +0.67 Mar
    +0.57 Apr

    Trend graphs updated here:
    https://oz4caster.wordpress.com/monthly-trends/

  10. Neil McLachlan says:

    Hi Roy, I am struggling to see how the UAH sat temp relates to the NASA daily global temperatures. I know that the channel 5 has broken down but channel 6 is now below the temp for 2011. All higher channels temp seem to have dropped dramatically. Are these graphs now irrelevant or do they indicate further cooling to come. Cheers Neil

    • Gordon Robertson says:

      @Neil McLachlan “Hi Roy, I am struggling to see how the UAH sat temp relates to the NASA daily global temperatures”.

      NASA gets it’s data from NOAA. NOAA recently slashed 5000 reporting surface stations from a global pool of 6500 stations, claiming it was easier to process 1500 stations each month than 6500.

      NOAA applies the 1500 stations with real data to a climate model where the data is interpolated and homogenized to fill in the 5000 missing stations.

      NOAA is currently being investigated by the US Congress for such shady practices and I think NASA is under investigation as well.

      No wonder you are struggling to understand. UAH provides real data from NOAA sats that cover 95% of the surface while NASA uses fudged data from NOAA, which uses less than 25% of the available surface stations, which cover no more than 30% of the planet.

      • Neil McLachlan says:

        Thanks Gordon but I’m talking about the satellite NASA measurements found at https://ghrc.nsstc.nasa.gov/amsutemps/
        My understanding was that these were the same satellite measurements that Dr Roy uses to produce his global temperature graphs. Yet on the NASA site the temperature graphs are a lot lower than Roy’s graph. In particular it shows that we are now well below the last elnino year 2010 at an atmospheric height of 25,000 ft. I am wondering if these NASA graphs are still relevant or an indicator of more cooling to come in the short term. I’d like to hear what Roy says about this. Cheers Neil

  11. John says:

    I expect average cooling to continue

    Indeed. We are heading into the next ice-age.

    • barry says:

      … in 20,000 years time. It’s not going to have any meaningful impact on average temperatures for the next few centuries or even the next millennium.

      • mpainter says:

        It is a process of step-downs into an ice age. Thus the LIA, thus the Holocene since the thermal Optimum. There is no foreseeing when the next step-down will occur. It could happen anytime. Climatologists (real climatologists) nominate the last portion of the Holocene as the “Neo-Glacial”, signifying the return of glaciers where they had previously disappeared. The present spurt of warming is a happy reprieve from the impending cooling of the earth;the present interglacial is winding down and cannot be expected to last another 20,000 years.

      • barry says:

        Interglacial V, which appears to be the closest analog for current and future orbital dynamics, lasted 28,000 years. Possibly interglacial termination could come sooner, but, apart from a few papers, most recent ones (since 1998) posit the end of the current interglacial at 18,000 to 50,000 years from now.

        (There are quibbles with the present duration of the current interglacial. Some say it’s been going on for 10,000 years, some 17,000 years, and is already longer than the last interglacial)

        • mpainter says:

          There are no quibbles whatsoever about the length of the Holocene. It started about 11,700 years ago. This confirmed by numerous lines of evidence:ice core, carbon 14, palynological, other. No confusion among the specialists.

          Milankovitch cycles do not work. These are another modern-day climate myth. Only random matchup with interstadials. More fudged climate science. Embry showed the way for today’s climateers.
          ###

          Barry, you say
          “Interglacial V, which appears to be the closest analog for current and future orbital dynamics, lasted 28,000 years.”
          ###

          There is absolutely no basis for forecasting a length to the Holocene. Ice core data show Holocene presently at average length of previous interglacials (10-15K years) Do not believe the garbage in peer reviewed climate literature. That way, you won’t be citing it in public.

          By the way, another climate myth: closure of the “Panama Seaway” started the Pleistocene. Don’t go repeating that one, either; the isthmus has been there since the Paleocene.

          • Lewis says:

            Mpainter,
            Good to see you commenting again.
            Would you recommend something of Embry’s for the layman?

            Thank you in advance.
            Lewis Guignard

          • mpainter says:

            Thanks, Lewis. Imbrie, not Embry, my error. John Imbrie helped revive the discredited Milankovitch theory. Like so much in climate science, his work falls apart when scrutinized. But he was a vigorous proponent of the theory and so we see many today who cite the Milankovitch Cycle as the cause of the Pleistocene.

          • barry says:

            Is there a stonger theory for the pattern of the ice ages than Milankovitch cycles? if so, what?

          • mpainter says:

            There is no explanation that passes scrutiny. There is so far no theory that accounts for the temperature record of the Tertiary as revealed by d18O, or any part of it, such as the Pleistocene.

          • barry says:

            “It is unknown” is a legitimate answer. However, I think you are to opportunistic to take from ‘we are not absolutely certain’ that ‘we know nothing.’

            Milankovitch cycles are by far the best proxy for ice age transitions, and they make sense. Little else bar speculation does.

            That doesn’t mean God’s truth. It means the best available theory is…. And no competing theory gets near it, which is why you offer none, only emptiness.

          • mpainter says:

            Barry you say: ” It is unknown is a legitimate answer. However, I think you are to opportunistic to take from we are not absolutely certain that we know nothing.”
            ###

            Those are your expressions, not mine.
            We know a great deal about the temperature record of the Tertiary and the Quaternary, as revealed by d18O analysis of ice ores and benthic forams.This record is readily available, if you wish to “eyeball” it.

            We see the PETM spike, the mid-Eocene Thermal Maximum, the ice age of the Oligocene (lasting about 12 million years), the Miocene recovery to previous warm levels, and the subsequent decline to the Pleistocene. Milankovitch theory explains none of this.

            We also have other lines of evidence that inform us of past climate. For example, fossils from the mid Pliocene of Ellesmere Island tell us that deciduous forests existed at 80 N latitude circa 3.2 million ya. Also species of bear, deer, other herbivores. So the world was much warmer then than anytime during the Pleistocene, which began about one half million years later.This is unexplained. Milankovitch cycles do not serve to explain why the pole was some 6-10 C warmer at that time than it was half a million years later, or during any interglacial.

            Milankovitch cycles have big problems explaining what we observe of temperature and climate. Most obviously, it does not match observations, except only on what might be attributable to random match. The theory should be discarded on the basis of its glaring inadequacies.
            It should not be upheld on the basis that “there is no competing theory”.

            Climate science needs more scientific rigor.

          • mpainter says:

            The wretched provider did not copy through the quotations from Barry’s comment above. Nor does the wretched provider allow degree notations.

          • barry says:

            It should not be upheld on the basis that there is no competing theory.

            Indeed not, nor did I. Milankovitch is the strongest explanation for Quaternary ice age cycles. Competing theories have much poorer explanatory powers. Hence, Milankovitch theory, while not perfect, is the leading theory on progression of Quaternary ice ages.

            Do you know of any competing theories that explain the pace of ice ages as well as or better than Milankovitch cycles?

          • mpainter says:

            “Do you know of any competing theories that explain the pace of ice ages as well as or better than Milankovitch cycles?”
            ###
            I have addressed this in detail, already.See above.

            You have swallowed garbage probably because you lack the founding to properly evaluate it. I have done my best to help you, but enough.

          • fonzarelli says:

            Painter, nice to see you here (and nice to be back at Dr S’ blog…) Have you ever come across an explanation as to why milankovitch cycles only go back 800,000 years? Seems a little odd that they end so upruptly going back in the record…

          • fonzarelli says:

            “uprupt” should read “abrupt”

          • mpainter says:

            Hi fonz,
            Nope, can’t answer that. The whole of the M-Cycle theory is full of holes. It has to do with the alignment of the planets, like astrology. All the while, there is no variation in total insolation received by earth annually. But the ice age was global. Snow lines of tropical peaks were one thousand meters lower than today’s.

            I could go on and on. Lots of holes.

          • barry says:

            Me: Do you know of any competing theories that explain the pace of ice ages as well as or better than Milankovitch cycles?

            You: “I have addressed this in detail, already.See above.”

            I see only comments from you on problems with Milankovitch theory. You have mentioned no other theory that explains the timing of the ice ages. Could you clearly name a competing theory that has equal or better explanatory power than Milankovitch cycles?

            A link to the post where you named such a theory would be helpful.

          • fonzarelli says:

            If the ice ages were caused by the planets tugging on our orbit, you would think that the record would show that even beyond 800,000 years ago. (maybe the record only goes back that far and no further?) I’ve actually heard mention that it might be caused by a nemeses type object that got caught in our solar system. To begin abruptly 800,000 years ago, there would have to be something specific that happened at that time…

          • mpainter says:

            Hi fonz,
            Dating Pleistocene events gets difficult when you pass the limits of 14C and this is 44,000 years, max. Annual layers in the ice are erased through recrystallization after a few thousand years. So dating the ice becomes more and more guesswork the older your ice sample. This dating problem renders suspect any correlation of ice data with M-Cycles, and the further back your ice data, the more suspect the dating.
            You can imagine what sort of reliability glaciologists put on Ice core dates back to 800,000 years ago. Bottom line, ice core dates are to be viewed as approximations at best.

          • Aaron S says:

            Milankovitch cycles are common even when there was no ice. They dominate sedimentation patterns in the Triassic rift lakes along the east coast (Olsen wrote a science paper from Newark Basin) in the cretaceous intereor seaway. They are so periodic they are commonly detected using spectral analysis.

          • Aaron S says:

            There is overwheming evidence for milankovitch periodicity forcing climate through time. Also if the isthmus of panama was always closed why did animals evolve isolated until the pliocene. You are making this up. BS

          • mpainter says:

            Aaron,
            Not “b.s.”, but informed science. As for the Isthmus of Panama, a recent geologic survey of the canal zone identified Paleocene granite which was intruded into a crystalline basement complex and later raised to the surface. See Jaramillo et al, 2014, GSA Bulletin.

            Isthmus of Tehuantepec, also the Isthmus at Lake Manaugua, are better candidates for your faunal barriers. Read up on these, educate yourself.

            You appear to be utterly ignorant of the problems with the M-Cycles. I am not. That is the difference in our viewpoints
            You show the usual angry reaction of one who uncritically puts his faith in garbage. In fact, the match of M-Cycles and ice age events is very poor, random at best.

            Concerning periodicity in sediments, real or imagined, that is tea leaves. I say this from the point of view of a sedimentologist. In other words, more informed science.

          • Aaron S says:

            I also am a stratigrapher. You are saying:1. M-cycles dont influence climate or 2. There remains uncertainty about the timing between M cycles and glaciers? 1. Is an absurd position as orbital parameters dominate stratigraphic records globally throughout geologic time. A research group collected abundant data from both absolute dates and stratigraphic patterns to show this. Its hard to deny. Here is link. http://www.sciencedirect.com/science/article/pii/S0195667115000622
            There are many similar examples.

            Statement 2 is plausible as there do seem to be timing busts… like the 41 to 100 k transition as this ice age formed 3 to 2 Ma ago (with ice on both caps).

            Please give me a link to the paper you mention… i will have a read. On this one it has been 10yrs or so since i studied the development of C american isthmus (complex tectonics) and the coeval formation of NADW. It is complex but every tectonic model has it.

          • Aaron S says:

            http://www.nature.com/nature/journal/v386/n6623/abs/386382a0.html

            I will read the paper u suggest, but there is a mountain of data about this geologic event and the transition to stronger NADW onward.

          • mpainter says:

            Aaron S says:
            May 7, 2016 at 3:08 AM
            Milankovitch cycles are common even when there was no ice.

            ###

            So the M-Cycles cause ice ages except when they don’t. When I evaluate any theory, I focus on its inconsistencies. That way, I am not misled by seeming plausibility.

            At all times, the earth receives the same amount of TSI, annually, barring any fluctuations in that. Yet ice age cooling is worldwide and simultaneous. M-Cycle theory does not square with that fact, hence it is flawed on a theoretical basis.

            But observations kill the M-Cycle theory dead. For instance, it does not account for interstadials. Numerous other observation discrepancies can be cited. Big ones. Bang dead.

            Those who cite M-Cycles simply have not applied any critical scrutiny to it.

          • Aaron S says:

            The link i provided about the cretaceous interior seaway (above) and M Cycles shows the cycles are pervasive through time, but the outcome on climate is dependent on other variables like global mean temperature. I saw these guys collect 20 absolute age dates to establish a chronology then apply the advanced spectral analysis to virtually prove M cycles were the same frequency and forcing climate in the warm house cretaceous. In a follow up paper they showed the climate change to sedimentation had nothing to do with sea-level change but was a lithologic/ bilogic response. They even got to the resolution of seeing the ~90yr solar cycles. You can then read about the exact same M-cycles in the slightly older Niobrara here

            http://www.sciencedirect.com/science/article/pii/S0012821X08001696

            To use your logic read up! I can show you 10 more papers. M cycles are know from much of geologic time. Also… please share the paper “LINK” i am interested in reading it, but can not find it.

          • mpainter says:

            Aaron, I gave the wrong reference, please pardon. This is the one I meant:

            Evidence for Middle Eocene and younger Land Emergence in Central Panama: Implications for Isthmus Closure

            Montes et al, GSA Bulletin, 2012

            This is online but the abstract tells everything.

            This is an example of how one study can overturn about three tonnes of previous studies. If “weight” of studies was that important, there would be no skeptics.

            Your M-Cycles do not account for the events of the Pleistocene. Study the interstadials and it becomes obvious. Or don’t study, your choice. Loads of discrepancies for M-Cycle theory.

          • mpainter says:

            Aaron, here’s the abstract:

            Abstract

            The rise of the Isthmus of Panama, linked to a number of climatic, paleoceanographic, and biological events, has been studied mostly from indirect, often distal, geochemical and biotic evidence. We have upgraded existing geologic mapping in central Panama with more than 2000 field stations, over 40 petrographic analyses, and more than 30 new geochronological and thermochronological analyses. This data set suggests that the isthmus was an uninterrupted chain above sea level from late Eocene until at least late Miocene times. The basement complex of central Panama is a folded-faulted, ∼3-km-thick arc sequence, intruded by granitoid bodies and onlapped by mildly deformed upper Eocene and Oligocene strata. Six U/Pb zircon ages in the granitoidsalong with published geochronological datareveal intense late Paleocene to middle Eocene magmatism (5839 Ma), a temporary cessation of magmatic activity between 38 and 27 Ma, and renewed magmatism between 25 and 15 Ma in a position ∼75 km south of the former magmatic axis. Thermochronological analyses in zircon (eight U-Th/He ages), and in apatite crystals (four U-Th/He ages and nine fission-track ages) obtained from a subset of 5854 Ma granitoid bodies record a concordant Lutetian-age (4742 Ma) cooling from ∼200 C to ∼70 C in ∼5 m.y., and cooling below ∼40 C between 12 and 9 Ma. Cooling is linked to exhumation by an angular unconformity that separates the deformed basement complex below from mildly deformed, upper Eocene to Oligocene terrestrial to shallow-marine strata above. Exhumation and erosion of the basement complex are independently confirmed by lower Miocene strata that have a detrital zircon signature that closely follows the central Panama basement complex age distribution. These results greatly restrict the width and depth of the strait separating southern Central America from South America, and challenge the widely accepted notion that the Central American Seaway closed in late Pliocene time, when the ice age began.
            ##

            There is a lively debate over the internet concerning this. You, a stratigrapher, will recognize that the study is conclusive.

          • mpainter says:

            Aaron, please understand, I do not deny M-Cycles; rather, I doubt that they have the effect on climate that is attributed to them

          • fonzarelli says:

            So, aaron, i see that 100,000 year cycles changed to 41,000 years about a million years ago. Is there any speculation (at all) on how this might have happened? Are the 41 K cycles recorded in ice? To answer painters objections, it is known that ice ages were “dustier”, the thinking being that a weaker solar wind allows in more dust (there bye increasing insolation). Could a transition to a dustier region of the galaxy have caused the shift from 41 K to 100 K? Thanx, this is a fascinating topic…

          • Aaron S says:

            Guys we are not far off in our thinking. I agree there are some timing busts between M forcing and response and plenty of uncertainty between the glacial interglacial timing. The 41 to 100 k transition is an unknown for me and to old for ice (as far as I know).

          • fonzarelli says:

            “increasing insolation” should read “decreasing insolation”

          • mpainter says:

            fonz, the dust is terrestrial. The ice age was “dustier” (atmospheric dust) because it was drier. For example, the Gobi and the Sahara were terrific sources of dust. But precipitation doubled with the start of the Holocene and these deserts became well watered and green hence the dust was quenched. The first part of the Holocene was quite wet worldwide and this is known to climatologists (real climatologists) as the “Pluvial”, Latin for rain. But precipitation has declined since the Pluvial, and earth has dried and cooled as well. These facts of levels of dust and precipitation comes from ice cores.

            Your posit of a cloud of extra-terrestrial dust is an interesting notion. This would mean a reduction in insolation and this would explain the features of the ice age very well.

          • fonzarelli says:

            Yeah, painter, this notion of dust being a factor in the ice ages has been around a long while. (if i’m not mistaken, it predates svenmark) As the solar system travels through the galaxy it encounters areas with differing amounts of dust. The thinking goes that this is what caused the “snowball earth” episode. Your take on why the ice ages were dusty is interesting. I’ll have to go back and hit the books and see if there is a way for extra-terrestrial dust to be quantified. I’ve always thought it common knowledge that dust from space causes, at least in part, the ice ages. (i seem to remember reading up on it once in wikipedia of all places) That’s why i like these discussions. They often send me off looking for something. (will power seems lacking until challenged…) And i tell you, there’s no better place to have these discussions than Dr Spencer’s blog! That’s what i’ve learned a couple months away from here…

          • mpainter says:

            fonz,
            cosmic dust does reach earth in varying amounts throughout the ages. It’s incidence is measured by a proxy: tri-hydrogen cation: H3+. This proxy is abundant in the cosmos but rare on earth.

            There is, on the web, charts that show the incidence of H3+ in sediments, plotted as a time series of the Tertiary through the recent. I have seen one, and it is off the scale at the Pleistocene. I did not study it, because I was interested in the Eocene at the time, during my spell of interest in cosmic impacts. Go dial up H3+ cosmic dust proxy.

          • fonzarelli says:

            “Go dial up H3+ cosmic dust proxy”

            Thankyou aaron, thankyou painter; Painter, will do…

        • fonzarelli says:

          “upruptly” should read “abruptly”…

    • David Appell says:

      “Indeed. We are heading into the next ice-age.”

      No, we entered the next ice age in the 1970s, as Leonard Nimoy told us.

      Since then we’ve just been blowing off some steam…..

      https://www.youtube.com/watch?v=ei-_SXLMMfo

      • mpainter says:

        Climatologists (real climatologists) refer to the last part of the Holocene as the “Neo-Glacial”, due to the return of glaciation to places where it had disappeared. This cooling was most severely manifested in the LIA. The warming trend of the last 250 years is a welcome reprieve from the slide into the next ice age.

      • mpainter says:

        There can be no doubt that the Holocene is another Ice-Age interglacial and that earth is inexorably sliding into another 100 K period of continental ice sheets.

        This preeminent fact is what makes the AGW movement so ludicrous. Warming is entirely beneficial.

  12. barry says:

    2016 could still end up as a record warm year in the satellite record

    Averaged monthly anomalies need to be 0.38 C or more from May through Dec to beat 1998 annual average (version 6.5 Beta).

    The May to December 1998 average monthly anomaly was 0.43 C.

    …it all depends upon how fast the warmth from the El Nino dissipates and La Nina sets in.

    A following la Nina for 2016 is likely but not certain. It would need to set in more vigorously by the end of the year than it did in 1998 to keep 2016 from breaking the annual record.

    The current el Nino may last a little longer than 1997/98. It started in earlier in 2015 than 1997, but Nino values are currently a little higher now than the same time in 1998. Also, the switch from Nino to Nina in 1998 occurred with a single month’s break between them, the only time this has happened as quickly in the ONI index. Otherwise the average break between Nino/Nina conditions is 2-3 months (not counting breaks of more than 12 months), and has been as much as 6 months. Likelihood of 2016 annual average higher than 1998 record is slightly greater owing to global warming, which is seen in nearly all metrics since 1998 (global ocean heat content, global sea level, global sea ice etc).

    Odds are not clear enough to make a bet at this stage, but favour 2016 as a record year.

    Current highest 12 month average is, neatly, Jan to Dec 1998. An average monthly anomaly of 0.37 C from May through September (12 month average Oct 2015 – Sep 2016) would beat that record.

    • Barry, there are strong signs that the La Nia is already getting started now, unlike at this time in 1998, as indicated by increasingly negative SSTAs in the eastern half of the tropical Pacific. I posted May 1 maps of SSTA comparing 2016 with 1998 here:
      https://oz4caster.wordpress.com/enso/

      That page also has a graph of UAH TLT for 1997-1998 and 2015-2016 together for comparison, which I just updated to include April 2016.

      The SSTA evidence to me suggests that the La Nia may advance rapidly and might be close to full force by the end of this year or early next year. That would greatly decrease the chance for a record high global temperature for 2016, but it still depends on the speed of onset and intensity attained by the end of the year.

      • La Nia = La Nina
        Apparently this web page does not allow Spanish characters and did not take the tilde n I typed which displayed when I typed it but not when the comment was posted. Very deceiving.

      • barry says:

        Different ENSO metrics are showing slightly different results. ONI metric has last three months at 2.0, and for the same 3 month period in 1998, the value is 1.8. We’re not much in disagreement, though. The intensity of the possible la Nina (BoM rates la Nina a 50% chance of forming this year) has to be greater than the one that began in 1998, and the onset would probably have to be as quick as in 1998, the quickest onset in the record – one month gap between el Nino and la Nina.

        Why do you have different baselines for your anomaly maps? 1971-2000 vs 1979-2000? Is one of them a typo?

      • barry says:

        Ah – the ONI chart has been updated since last night. Previous 3 month period has gone down a point, and there is a new value for Feb-Mar-April. Here is the comparative progression.

        1998
        DJF 2.1
        JFM 1.8
        FMA 1.4

        2016

        DJF 2.2
        JFM 1.9
        FMA 1.6

        http://www.cpc.ncep.noaa.gov/products/analysis_monitoring/ensostuff/ensoyears.shtml

        It’s one metric among several, but seems to be most in use these days.

  13. Brad says:

    Saw climate hustle. Nice work Dr. Spencer even though short and sweet. Thanks.

  14. Geoff Sherrington says:

    Roy,
    Is there past work about anomalies (in the wider sense) like the El Ninos, where there is a 3D look over time at the spread of temperatures in the atmosphere indicating hopefully a locus, a place where heating started and spread through a defined pattern?
    It is just as interesting to know if there is no such pattern, or if there is, if 1998 is similar to 2015.
    Is there referenced work on how fast sudden T changes propagate around earth atmosphere? If they do, if they are measurable.
    Geoff

  15. dave says:

    The troll(s) are returning.

    I suggest comments be closed immediately by Dr Spencer.

    Actually, I prefer it when there ARE no comments. Just an occasional statistic or interesting picture, for one to note or ignore, as one pleases.

    • barry says:

      Stats or pics with no context are worse than with, in my opinion. Stuff like that is easily misinterpreted.

      There’s always the scroll function.

      • dave says:

        Dr Spencer is usually kind enough to provide the context.

      • barry says:

        You would prefer he provide “no comments. Just an occasional statistic or interesting picture, for one to note or ignore, as one pleases,” or were you thinking of the comments section when you posted that? I thought you meant the latter.

  16. Aaron S says:

    The post El Nino phase really defines so much for me. If part of the warming last century was related to cosmic rays or the transition from the solar minimum to a much stronger sun, then there should be mild cooling onward because the CO2 and solar activity are so far apart at this point.

    If there is more warming- then I cant see how it is the sun- except maybe a lag related to currents from 30 years ago. I think the warming provides a good sense of the climate sensitivity based on the trend.

    If there is more hiatus- then the system seems to include a mix of solar activity and CO2

    If there is moderate cooling then the sun’s magnetic field and cosmic ray intensity is hard to wish away as irrelevant.

    Alternatively, this could all be a mild random wobble in a dynamic system that is warmer and greatly out of equilibrium with the universe around it.

    My gut- we are going to see a strong La Nina, followed by minor cooling, but I will let the data talk.

  17. Tim Wells says:

    We have had a very cold spring as predicted following the warming during the winter. I am waiting for a significant period of cooling to blow the head off the man made warming scam.

    • barry says:

      Not sure where “we” are, but the beginning of Northern Hemispheric Spring has been the warmest in the record by +0.2C (Average of Mar and April).

      Anomaly rankings:

      2016 – 1st place
      March 0.94 C
      April 0.85 C
      Average = 0.895 C

      1998 – 2nd place
      March 0.49 C
      April 0.85
      Average = 0.671 C

      2010 – 3rd place
      March 0.59 C
      April 0.48 C
      Average = 0.535 C

      Never mistake local temps for hemispheric, regional or global. Where I am it’s unseasonably warm. That tells me nothing about global or hemispheric temps (it’s a coincidence that my local temps alias hemispheric/global).

      • mpainter says:

        Where I am NWS wintertime overnight lows are 2-4 F above actual temperatures.

      • bit chilly says:

        this has been the coolest may i can ever remember on the east coast of scotland. several frosts and snow . the prevailing weather for the month has come from the north and north east . according to the older local fishermen the end of may signified the end of easterly winds for the summer back in the 60’s, 70’s and early 80’s for this area. we shall see if this happens this year.

    • David Appell says:

      Tim Wells says:
      “We have had a very cold spring as predicted following the warming during the winter.”

      Sure, it’s cooling, even though UAH LT calculates the warmest March+April in their records.

      “I am waiting for a significant period of cooling to blow the head off the man made warming scam.”

      Unfortunately for you, it keeps getting warmer….

      • mpainter says:

        Unfortunately for the alarmists, the global temperature anomaly is dropping like a rock. AGW RIP.

        • RAH says:

          Yep but will take is one good hurricane to hit the US and there is enough red meat to keep the cretins talking for a lustrum. Forecasts for SSTs are beginning to look like there is some chance for Atlantic tropical activity for the 2nd half of the season in particular.

        • David Appell says:

          Dropping from a record high does not mean cooling in a climactic sense.

  18. Dr. Mark H. Shapiro says:

    Looks like April 2016 was another record warm month for the globe. When will Dr. Roy finally admit what his data show – global warming is real….

    • Aaron S says:

      So we might nudge past the 97 98 el nino with another el nino in 15 16 and that is global warming like the IPCC predicts? Come on. Something has changed with the climate this century… the hiatus is statistically real… i can show u the nature paper Doc!

    • Werner Brozek says:

      April 1998 was 0.743.
      April 2016 was 0.71.

      • Bill Laurune says:

        That’s according to the not-yet-peer-reviewed version 6.0 “beta” that systematically raises temperatures in the 90s and lowers them in the 2000s relative to the (presumably peer reviewed) 5.6.

        Given the obvious bias of the authors, why would version 6.0 numbers be taken as gospel without critical review? Especially given that the satellite sensors for the atmosphere nearest the surface have gone kaput since the 90s.

        Yet Dr Spencer puts the numbers out on the blog and reports them to the media.

        As far as I’m concerned, the whopping difference between 1998 and 2016 in the 5.6 results are more likely nearer the truth.

        • mpainter says:

          ENSO region 1-2 SST is already La Nina. Global temperature anomaly dropping like a rock. You must not let this upset you.

          UAH V6 in publication. Don’t let this upset you, either, but be brave.

        • Werner Brozek says:

          Unless you know something I do not know, 5.6 is not out yet. However RSS is out and April 2016 came in at 0.757. This is 0.1 lower than the 0.857 from 1998.

          • Bill Laurune says:

            The older records for 5.6 are available. I wrote a Java program to grab the 5.6 and 6.0 data off the websites and difference them, and 6.0 made the 90s warmer and the 2000s cooler. I’d be very surprised if April doesn’t have the same bias.

          • Bindidon says:

            This is 0.1 lower than the 0.857 from 1998.

            Nice to read, Werner! But what about having a look at RSS’ North Pole anomalies this year (wrt 1981-2010) ?

            Year M Globe NoPol

            2016 1 0,665 3,301
            2016 2 0,978 2,107
            2016 3 0,842 1,437
            2016 4 0,757 2,233

            Nice huh?

          • Werner Brozek says:

            The north pole is much warmer than global and the south pole is much colder. See an earlier post of mine here:
            http://wattsupwiththat.com/2015/10/23/polar-puzzle-now-includes-august-data/

        • Werner Brozek says:

          (As far as Im concerned, the whopping difference between 1998 and 2016 in the 5.6 results are more likely nearer the truth.)

          5.6 just came out and you are right about April 2016 being warmer than April 1998. But this contradicts RSS! So who is really right? Perhaps the UAH people realized RSS was closer to the truth and came up with 6.0.

          • barry says:

            RSS will also have a new revision of data for TLT in a few months. These are all best estimates. None are ‘right’ in any absolute sense.

      • David Appell says:

        Werner, what are the error bars on these numbers? They matter….

    • An Inquirer says:

      Dr. Shapiro, Strawman argument.
      Global warming is real. It has happened over various periods of time. Glaciers have been retreating for 200 years. That is evidence of global warming. It has been 400 years since the River Thames has frozen over; that is indication of warming–maybe local. Little doubt we are warmer now than the 70s, and Dr. Spencer’s satellite data confirms.
      The relevant questions: Is the warming due to CO2 emissions? Has the warming been beneficial or harmful? Is the warming relentlessly continuing? Also I do see some questions on whether we are warmer now than the 1930s. Discussions on that latter question could depend upon who the “we” is and the degree of temperature adjustments with which you are comfortable.
      Dr. Spencer’s data provides a useful perspective but no conclusion on the relevant questions.

    • mpainter says:

      Did you mean to say that El Nino temperature spikes are real?

      By the time this La Nina is done (2020, say), there will have been 23 years of a flat trend in the global temperature anomaly. Will Dr. Mark H. Shapiro ever admit what the data shows?

      I will wager that he never does. But global warming is finished, Dr. Mark. Better start turning the crank on ocean acidification. Or maybe the new alarmist bugaboo- ocean deoxygenation.

    • Do I deny that warming has occurred? No. Maybe Dr. Mark should find out what I really say rather than what others claim I believe.

    • barry says:

      …another record warm month for the globe. When will Dr. Roy finally admit what his data show global warming is real

      A month does not a trend make. Dr Spencer ‘admits’ that global warming is real, and that the greenhouse effect operates as advertised. Where he departs from the mainstream view, if I remember correctly, is that he is less convinced by the higher end of the range of climate sensitivity.

      • Phyte_On says:

        And any reasonable government policy cannot do anything to control, regulate, impact the climate in any measurable way. Best policy is to adapt and mitigate given that we have decades of time to respond.

    • bit chilly says:

      of course it is , be thankful it is not cooling. at some point in the future it will cool and the planet will be a far less hospitable place for life as a result.

  19. RW says:

    Dr. Mark,

    The problem is the amount of warming is so small that the entire trend could be wiped out in just a month or two of cooling.

    The amount of warming we’ve seen over the satellite record is spectacularly unspectacular.

    • David Appell says:

      RW wrote:
      “The amount of warming weve seen over the satellite record is spectacularly unspectacular”

      The trend of UAH LT since its beginning in 1979 is +0.12 C/decade.

      Do you know what the warming was coming out of the last glacial period?

      An average warming rate of +0.005 C/decade.

      We’re 25 times faster.

      • Massimo PORZIO says:

        Hi David,
        you wrote: “Do you know what the warming was coming out of the last glacial period?
        An average warming rate of +0.005 C/decade.”

        Do you really know what it was the average temperature per decade of the last glacial period?

        I don’t, and I would like to know how one could retrieve that parameter from those proxies used to get the ancient temperature trends with that awesome resolution (in temperature but in time slots too, I mean).
        IMHO we don’t really know what it was the K/decade, maybe we know what it was the K/millenium, but that a complete different parameter.

        Have a great day.

        Massimo

        • mpainter says:

          David Appell spews his usual ignorance and misinformation, Massimo. Through ice core d18O analysis,we know that temperature shot up 6-8 C in a few decades. This precipitous increase is well-known, but Appell prefers to propagate alarmist lies.

          • Massimo PORZIO says:

            Hi mpainter,

            Of course, I must admit my ignorance in the matter.

            What it wonders me is how could be retrieved a so tiny change in temperature (0.005K) in a so small time slot (as it is a decade), just using samples of ice cores that goes back at least 20 kyears ago.

            Have a great day.

            Massimo

          • mpainter says:

            Hi Massimo,
            It is error to credit David Appell with the faculty of reason. He is a vent of alarmist doctrine, and has no science but anti-science or pseudoscience.

          • David Appell says:

            Massimo PORZIO says:
            “What it wonders me is how could be retrieved a so tiny change in temperature (0.005K) in a so small time slot (as it is a decade), just using samples of ice cores that goes back at least 20 kyears ago.”

            I wrote it was the AVERAGE warming rate.

            From Shakun et al Nature 2012 Figure 2a:
            http://www.nature.com/nature/journal/v484/n7392/full/nature10915.html

            global temperature anomaly in year -18,000 is -3.4 C
            global temperature anomaly in year -11,000 is +0.0 C

            so the average temperature change is 3.4 C in 7000 years, or ~ +0.005 C/decade, compared to NOAA’s current 30-year trend of +0.17 C/decade

            So that’s a factor of about 30 now compared to then.

            http://davidappell.blogspot.com/2015/06/current-warming-30-times-faster-than.html

          • mpainter says:

            I’m glad David Appell has posted this. Good example of the sort of perversion of science that the hard-core AGW crowd practices.

          • Mathius says:

            It’s astounding that David Appell continues his run on such a simple minded statistical illusion.

            The longer your time interval, the less the rate of change when averaged linearly. I’ll repeat myself by saying a 6th grader could figure this trick out.

          • David Appell says:

            Mathius says:
            “The longer your time interval, the less the rate of change when averaged linearly.”

            Pure bullshit.

            Both the x and y coordinates matter when determining average rates of change, not just the x coordinates.

        • David Appell says:

          Massimo PORZIO says:
          “Do you really know what it was the average temperature per decade of the last glacial period?”

          See Shakun et al, Nature 2012:
          http://www.nature.com/nature/journal/v484/n7392/full/nature10915.html

          • Massimo PORZIO says:

            Hi David,
            I’m not sure what you are arguing with that document referring to my previous point.

            In a post above you also wrote:
            “global temperature anomaly in year -18,000 is -3.4 C
            global temperature anomaly in year -11,000 is +0.0 C

            so the average temperature change is 3.4 C in 7000 years, or ~ +0.005 C/decade, compared to NOAAs current 30-year trend of +0.17 C/decade”

            It seems to me that you don’t have any idea of what a gradient is.
            You can’t infer any short-time-temperature-gradient (or any other derivative parameter) using only the long-time-gradient of the time span which includes the single gradients.
            You don’t know (and no other know) what it was the maximum short-time-temperature-gradient 10000 years ago (such as the T/30 years trend).

            It would be like establishing a priori that the winner of a car race will be the one who established the fastest speed at the speed trap in that race.
            Most of times is never so.

            Have a great day.

            Massimo

          • David Appell says:

            Massimo:

            For the 3rd time now, I am not attempting to say anything about short-term gradients.

            Again, I am speaking of the AVERAGE rate of change over the period indicated.

            Really, this isn’t difficult to understand.

          • Massimo PORZIO says:

            David,
            could you please explain me what the heck is an “AVERAGE rate of change” in temperature?
            Sorry, I’m just an engineer and I usually deal with real issues having real parameters.

            IMHO You don’t have any way to know if 10000 years ago the temperature sometimes changed or not of that +0.17 C/decade as it is doing and it did in current 30-year trend. If you want, you can call that “AVERAGE rate of change” or “short-term gradient”, it doesn’t matter. Your “AVERAGE rate of change” is just a little longer “short-term gradient” compared to what you call that way.

            Anyways you can’t compare two “AVERAGE rate of change” with different (very different in this case) averaging time span, because you don’t know how the parameter changes between the two ending points of the longer time span.

            Have a great day.

            Massimo

      • Mathius says:

        Hey David Appell, using some statistical magic, I calculated the rate of temperature change in the past 10 million years to be approximately -.0001 C/decade. What magic was that? I took the start point, end point, and drew a line. Cause that’s how the climate system works, right?

        Your use of statistical manipulation to somehow “prove” the point climate is changing much faster now is embarrassing and anyone with a knowledge set above a 6th grader could figure out your propaganda. Won’t work here though. You just get laughed at instead.

  20. Slipstick says:

    Anyone else notice that there has not been a monthly average LT anomaly below the ’81-’10 average in 4 years?

    • mpainter says:

      Relax, Slapstick. The cooling has already begun. Oh, that makes you angry and aggravated?

      How about this: New NASA study shows huge increase in photosynthesis worldwide. Other studies show an increase in food production sufficient to feed a billion people.
      Oh, that only makes you feel worse?

      Well, try this: There is enough calcium in the oceans (0.04% by weight) to combine with 48.8 million gtonnes of CO2. Do you feel better, now?

      You feel even worse? Oh dear, is there no help for you?

      • Lewis says:

        Hopefully the warmista scaremongers are correct and it’s getting warmer. Great – almost. The warm spring we had in the piedmont of NC felt great until the late frost.

        Can those who are trying to be in control of the weather keep the thermostat up or at least stable? This variation with freezing and warming is very destructive to my garden.

        • David Appell says:

          Lewis: Do you think people in the tropics are looking forward to higher temperatures? Or poorer people with no electricity and no A/C?

          Did you hear about the deaths in India and Pakistan in last summer’s heat wave?

          Or is it all OK if it’s all good for you?

          • mpainter says:

            Here comes David Appell again, gleefully murdering millions.

          • An Inquirer says:

            David Appell. We are actually having fewer heat waves now than in the past. Of course there are some data bases of adjusted temperatures that in some contorted measure you could come up with a different answer, but actual temperatures do not show an increase in heat waves. And in most measures, even adjusted temperatures do not show an increase in heat waves. Measures such as daily highs, or persistent days above 90 or above 95, or droughts. I do not know what is causing moderation of heat waves, but activists for global warming action lose credibility (among non-low-information voters) by claiming increased heat waves.

          • David Appell says:

            An Inquirer says:
            “David Appell. We are actually having fewer heat waves now than in the past.”

            According to what science?

          • An Inquirer says:

            David Appell,
            According to the science of truth, and not according to the alchemy of scaremongers.

  21. Jjs says:

    Google dr mark h. shapiro if you want more knowledge on the subject. His customers don’t seem so impressed with his professional capabilities.

  22. Aeno Arrak says:

    It is incorrect to compare record high temperatures of the 21st century with anything but other 21st century high temperatures. Any comparison involving both twentieth and twenty-first century values is simply invalid. If you wish to include twentieth century temperatures in the comparison you must subtract one third of a degree Celsius from each twenty-first century datum whose value you wish to compare before you make a comparison. That is because a step warming, starting in 1999, raised all subsequent twenty-first century temperatures up by one third of a degree Celsius. So far not one “temperature expert” I know if has shown any inkling of its existence. This step warming is easy to see in Figure 15 of my book “What Warming?” that has been out since 2010. I also reprinted it in an article criticizing Karl you can find in WUWT of November 29th last year. This warming has no greenhouse origin and was caused by the huge amount of warm water carried across the ocean by the super El Nino of 1998. The step warming itself lasted only three years – from 1999 to 2002 – and then stopped. Hansen did notice that, except for the super El Nino, all record high temperatures happened to be part of the first decade pf this century. He himself thought it was his imaginary greenhouse effect at work. What this fiasco really means us that you guys who were too lazy to really learn what global temperature does now have a lot of work to do to recalculate all those phony record high temperatures you have allowed to become part of the record.

    • mpainter says:

      The step-up in temperature is real. It is best seen in the UAH dataset at 2000-2002. The trend is flat before and after that step-up. This step-up is attributable to late 20th Century changes in cloudiness, with reduced cloud albedo and increased insolation, as reported in John McLean, 2014, “Late 20 Twentieth Century Warming and Variations in Cloud Cover”.

      The step-up is evident in the unprecedented spike of the 1998 El Nino and the following La Nina, which did not “bottom” as deeply as previous lows in the record.

      Here is the essential point: this step-up is approximately 0.3C; this is the “warming” that the alarmists are screeching about. Yet it is shown to be due to changes in insolation. CO2 had nothing to do with it.

    • barry says:

      “That is because a step warming, starting in 1999, raised all subsequent twenty-first century temperatures up by one third of a degree Celsius.”

      “Step-warming” happened in ice age transitions. Does that mean holocene temperatures need to be adjusted by 5C to compare with the last ice age?

      I don’t get the logic here. “Step-warming” seems to be a handy term to say all sorts of nonsense. So how does one validate step-warming statistically or physically? Where are the confidence intervals that makes the notion of “step-warming” a statistically significant event? What makes this notion more valid than merely cutting up portions of data to get the answer you want?

      No one has yet demonstrated “step-warming” as a thing any further than selecting ranges of dots on a plot. Not remotely persuasive.

      • mpainter says:

        The step-up can be observed in the UAH plot above. You can’t see it? It’s significance is this: 1) It is co-incident with increased insolation globally; 2) it cannot be explained by increased CO2. The inference is this: none of the warming since the seventies is attributable to CO2.

        Oh course, one can ignore the step-up if he chooses.

        • dave says:

          It (mean-reverting with regime shifts) is a parsimonious description of the data. Since “a regime shift” implies a (hidden) causal variable, it is a meaningful scientific model.

          Time is an explanatory variable, not a causal variable.
          It can only be a PROXY for something else. In other words,
          “there is a slight trend” does not epitomise a meaningful scientific model. “There is a slight trend caused by increasing CO2” is a meaningful model, but stated in such bald terms it is apparent that it is not easy to prove. We would need Maxwell’s Demon’s brother to take out and put in CO2 from our atmosphere many times, and allow us to observe the results – or to allow us another apple from the Tree of Knowledge.

          • mpainter says:

            Dave, another frame of reference:

            The temperature record is an index of climate events- ENSO, seasons, Pinatubo, LIA, etc. Variability in global cloudiness is another such event. Our approach should be to analyze the composite effect of these events on the temperature record. Drawing a line from the beginning of a data series to the end and saying “trend” is simple minded. But such a simple-minded approach is necessary for maintaining the AGW meme.

            The hi-jacking of climatology by today’s generation of “climateers” means a setback for that field. It will take decades to undo the damage, and the damage has spread to the polity.

      • mpainter says:

        Also, the step-up renders the artificial trend lines spurious. A step-up is not a trend. We have two flat trends connected by a step-up, shown in the UAH chart above.

        • barry says:

          Also, the step-up renders the artificial trend lines spurious. A step-up is not a trend. We have two flat trends connected by a step-up, shown in the UAH chart above.

          If you’re basing it on insolation/cloud fraction, McLean’s paper shows a gradual trend in cloud fraqction, not a step. ENSO spike merely makes it look that way, being an oscillation after all.

      • barry says:

        “The step-up can be observed in the UAH plot above. You cant see it?”

        All I’ve aver seen is a rising trend with el Ninos making it look like there are step ups – because if you start your trend line at an el Nino, subsequent temps always look like steps – but never statsitical analysis to confirm this notion.

        Seen plenty of the eyeball speculation. Still waiting for the math. Any links to demonstrate beyond gormlessly pitting every trend on el Nino events?

        (Do la Ninas operate equally, or is it el Ninos all the way to the bottom? If so, we should have been at least 5C cooler a millennia ago.

        No, this notion is never demonstrated beyond “You cant see it?” That aint analysis.

        • mpainter says:

          I’ve seen plenty of math that does not pass the eyeball. Math depends on assumptions.
          Eyes are connected to the brain.
          Look closer.

          • barry says:

            No statistical analysis. No confidence intervals. Only selective choices and words. Still unpersuaded.

          • mpainter says:

            The mathematician who cannot/ will not examine the assumptions behind his math is no scientist, pretend though he may.

          • barry says:

            The pundit who cannot/ will not examine the math behind his assumptions is no scientist, pretend though he may.

          • mpainter says:

            There is no math behind my assumptions, but observations, and this is where you fall short.

          • barry says:

            There is no math behind my assumptions

            On this we agree.

          • mpainter says:

            Barry, no observations for you, then. Or from you.

          • barry says:

            I can find flat periods in the record as easily as you, but like you, I cannot validate that they are “step warming” intervals statistically.

            I have a couple of questions for you.

            1) Do you hold that el Ninos always bring a step-jump, raising temperatures?

            2) Do you hold that la Ninas do not counteract the warming from el Ninos over the long-term?

          • mpainter says:

            Now, Roy Spencer agrees that the satellite data show no warming before 1998 and has so stated. Does that help any? Sorry, can’t give you the post as I don’t recall it. What does that tell you.? For chrissake, is not the flatness of the trend evident to you? Compute it if you have to. The satellite era is two flat trends connected by a step-up. Or do you fail to see the second flat trend? Or do you fail to see the step connection between the two? If you cannot make such simple observations as these you are lost. Good luck.

          • barry says:

            The ‘step’ is an artefact.

            What I see is a general warming trend for the whole record that can be sliced any number of ways. One way is yours, but I don’t know why you favour it.

            Any oscillation on top of a long-term trend is going to have flattish periods after spikes. Here’s a graph of an oscillation (analog for ENSO), and the same oscillation with an upward trend. Flat periods appear, but they are a result of the oscillation. ENSO is quasi-periodic, of course, not a perfect oscillation.

            https://4.bp.blogspot.com/-5VJVahlyAfI/VsJtWLlKYeI/AAAAAAAAAZ4/Ad2xtvHeXIw/s320/ClimateWave1.png

            I don’t understand your particular focus.

            Are you trying to say that el Ninos are mainly responsible for the warming?

            Is there any statement that you could make about this ‘step jump’ that could be used as a prediction (the ultimate test of hypotheses)? If you are able to make your hypothesis falsifiable, then I might understand why you are interested in this supposed phenomenon. We’d be able to test the hypothesis.

          • mpainter says:

            Barry, you are uncomprehending. Two flat trends connected by a step-up. Keep looking, maybe some day it will come to you that a step-up is not a trend.

            As I stated in an earlier comment, the step-up coincides with late 20th Century changes in cloudiness, globally, with increased insolation.

            This is my last comment to you regarding this. Enough.

          • barry says:

            Saw your post upthread. Why not link it to help?

            You posit: Break point at 2000-2002. Cloudiness and also increased solar radiation responsible for step-jump.

            TLT is warming 1979 to 2000/2001/2002.
            Insolation is decreasing.

            Solar cause for warming doesn’t stand up for that period.

            2001-present is slight warming in TLT – call it flat.
            Solar is also flat.

            Possible correlation.

            TLT is warming for full period, statistically significant.
            Insolation clearly decreasing for whole period.

            Solar cause for warming doesn’t stand up for full period.

            That leaves clouds.

          • barry says:

            Two flat trends connected by a step-up.

            The step-up in temperature is real. It is best seen in the UAH dataset at 2000-2002

            Ran linear regression on UAH6.5 beta.

            Decadal trends

            Jan 1979 to Dec 1999 = 0.14 C
            Jan 1979 to Dec 2000 = 0.13 C
            Jan 1979 to Dec 2001 = 0.16 C
            Jan 1979 to Dec 2002 = 0.14 C

            That surely covers the the trend to a ‘jump’ in 2000-2002.

            The smallest trend of those equals the trend for the full period to present.

            Don’t see a flat trend up to the breakpoint.

            Much flatter trend from posited 2000-2002 breakpoint (slight warming).

            So not two flat trends with a jump, but rather a warming trend followed by a flattish one.

          • mpainter says:

            Here Barry, let me take you through it step by step:

            1. Reduced cloudiness, globally, means increased insolation at the end of the twentieth century. This is the warming. See referenced McLean study above.

            2. The warming coincides with the El Nino, although the spike obscured the effect. The unprecedented height of the spike hints at the increase in insolation and warming.

            3. The warming can be inferred in the following 1999 La Nina which did not reach as low as previous global anomalies.

            4. Now the record makes evident this warming in the step-up from the La Nina, from 2000-2002. This step-up reflects the warming which actually began in the late nineties, obscured as it was by the ENSO cycle.

            The satellite record prior to 1997 shows a flat trend. The satellite record after 2002 shows a flat trend. The step-up records the warming that connects the two flat trends. This step-up is about 0.25-0.3 C. And there’s your warming since the beginning of the satellite era. No need to invoke AGW to explain it.

          • barry says:

            Thanks, that was clearly put.

            The step-up in temperature is real. It is best seen in the UAH dataset at 2000-2002. The trend is flat before and after that step-up.

            Not before – it’s the same trend or greater than the full record. 0.13 C + / decade. But you later nominated a different period for flat temps since 1979.

            The satellite record prior to 1997 shows a flat trend.

            Yep, it’s flatter for that period. Also statistically non-significant, by quite a margin – the uncertainty is more than twice as great as the mean trend. So we don’t know if the trend is cooling, flat or warming for that period.

            I read the McLean paper. Then I read about it. Then I checked out the cloud data base it relies on. Then I checked the journal (it’s not familiar to me).

            The cloud index is very uncertain. Corrections are ongoing due to issues with satellites being poor at discerning clouds from angle, incomplete coverage and satellite dropout. Version 3 of the index is currently being built, with quite a few fixes.

            Assuming the index is reasonably sound, changes in low and high level clouds are about equal in opposition. Low level clouds reflect more sunlight, high level clouds absorb more upwelling radiation. This latter factor does not feature in the article. The paper only considers half the equation, it seems.

            It is concerning that paper speaks of 10-year trends as if they’re statistically significant. This time period is way too short to establish a meaningful trend.

            The journal is listed as a predatory journal. Reviewers pay to have the submissions reviewed.

            Impact: the paper is 18 months old and has 1 cite.

            All in all, I’m not persuaded by the paper, considering its contents and provenance. 10-year trends are a red flag, and failing to account for surface response to increased high level clouds seems to be a very large hole in the work.

          • mpainter says:

            Barry, of course, impugning the data is the first step in discrediting a study. No question that data needs to be reliable. The data is from the cloud data base maintained by NASA. Who is the judge of the reliability of that data? Well, the one who has better data. And who is that, pray tell. Sic semper.

            Do you claim that the McLean study has been ignored by 97% of the “climate scientists”? I can believe that claim.
            But do you claim that this refutes the study? Tsk, Tsk, such science.

            And back to your mantra of “length of trends”, etc. I cite observations and you chant trends trends trends. You can draw a line from one point to another. What else can you do? You have yet to grasp that a step-up is not a trend. The warming of the satellite era is a step-up.

            The McLean study accounts for the observed step-up. You say “what step-up, I see a trend”. I say the step-up that connects two flat trends. You say those are no trends. I am content to let others choose for themselves on this issue.

          • mpainter says:

            Also, Barry, I think that you have misread the paper. The study points out a diminishing cloud albedo with its final conclusion of an increase in insolation of “2.5 W/sq m to 5 W sq m” You fault the study for not addressing the cloud GHE saying “high level clouds absorb more upwelling radiation. This latter factor does not feature in the article. The paper only considers half the equation, it seems.” The study was not meant to address the GHE. It addressed changes in global cloud albedo.

  23. pochas94 says:

    Dr Roy,

    Glad to see you have reopened the comments section. I drop by this site anyway, but I always enjoyed the comments, well, most of them.

  24. Bindidon says:

    I sent two times a rather technical answer to

    barry says:
    May 3, 2016 at 6:27 PM

    and… the comment was dropped two times off the thread.
    Wow.

    • barry says:

      Sorry they didn’t get through, Binidon. I was enjoying the conversation.

      • Bindidon says:

        I did as well, Barry. My reply had to do with your statement

        GISS Feb was the peak monthly anomaly 1998

        to which I completely disagree. Simply because it is, like all the others you wrote in your comment, based on anomaly levels wrt the records’ own baselines.

        Indeed, if you look at GISS’ value for Feb 1998, you obtain 0.880 C. BUT… this value has to be understood wrt GISS’ baseline (1951-1980), a period somewhat cooler than that chosen as baseline for RSS (1979-1998) or even UAH (1981-2010).

        If you want to compare these anomalies alltogether, you then must normalize them to a common baseline, which of course has to be somewhere within the satellite measurement era.

        Choosing e.g. UAH’s baseline, you will have to subtract for each of the other records the record’s anomaly average value within that 1981-2010 period from all the record’s anomalies, i.e. here:
        – 0.428 C from each GISS anomaly
        – 0.083 C from each RSS anomaly
        and a corresponding value for all the other records.

        Having normalized all the data, you then see that for Feb 1998, GISS’ anomaly moves down from 0.880 C to 0.452 C, and that RSS topped in April all other records (with 0.760 C).

        Look here: http://fs5.directupload.net/images/160505/48a9sgtp.pdf

        • barry says:

          Baselines make no difference at all to when temps peaked during el Nino events for the various records. For the two very strong el Ninos post 1979 (beginning sat record), surface temps peaked 2 months earlier than satellite.

          We may be thinking about this differently – I’m speaking of when the hottest monthly anomaly occurred during very strong el Nino phases. Two months lag between sat and surf. It’s in the data, no interpretation makes it different, no baseline makes it different. The hottest anomaly in a strong el Nino period is clear from the data. This year may well be different, if you count this el Nino amongst the strongest. Let’s see what happens next month.

  25. Quietly observing says:

    I have news for Roy: the mean temperature that variable solar radiation could achieve somewhere up in the troposphere is not 255K but at least 10 degrees colder. Such radiation cannot make to surface 288K and back radiation cannot help the Sun to do so either. Radiation is not the answer.

  26. Quietly observing says:

    Roy thinks radiation from cold water vapor can raise the surface temperature whilst at the same time making the lapse rate less steep. Hence the upper troposphere would rise in temperature even more than the 25 degrees or so that water vapor supposedly raises the temperature. LOL.

  27. geran says:

    Quietly delete “Quietly observing”, please.

  28. Bart says:

    The rate of change of CO2 is still tracking temperature

    http://woodfortrees.org/plot/esrl-co2/derivative/mean:12/from:1979/plot/rss/offset:0.6/scale:0.22

    leaping upward with the El Nino. Someday, people will realize that we are not contributing significantly to the CO2 level in the atmosphere. Furthermore, the fact that CO2 responds strongly as the integral of temperature means temperature sensitivity to CO2 cannot be significant. Otherwise, there would be a positive feedback loop which could not be stabilized even by T^4 radiation, and we would have hit a runaway condition eons ago.

    It’s done. AGW is a damp squib. People still clinging to it are children jumping at monsters under the bed.

    • Bindidon says:

      The rate of change of CO2 is still tracking temperature

      Oh yes.

      I’m all but thinking that CO2 is temperature’s main driver, but to your argument there will be always a counterargument.

      And to your plot there will always exist a counterplot, e.g.

      http://fs5.directupload.net/images/160505/ecibi9p4.jpg

      where you see that over 125 years it is always possible to establish a relation between temperature anomalies (here: from JMA’s Tokio Climate Center, the “coolest” record available) and astmospheric concentration (here: a logarithm of the ratio actual value/start value).

      You can plot anything telling anything or its contrary.

      I’m sorry, but choosing, as you do here, such a short 37 years period to show any CO2 effect on global temperature (if that effect anyway exists) moreover is a somewhat simplicistic approach.

      • mpainter says:

        Your plot is garbage and your language is gobbledygook, bindion. Your honesty is suspect.

        • Bindidon says:

          As usual, you are simply unable to oppose valuable arguments, and stay just above the injury level.

          • mpainter says:

            “…valuable arguments..”?? Justify your spurious plot, please and thank you.

      • CoRev says:

        This is an alternative look at your plot using the same data minus your ?scaling? factor: http://woodfortrees.org/plot/rss/mean:12/offset:0.23/plot/esrl-co2/derivative/from:1979/mean:12

        • Bindidon says:

          Im sorry, but choosing, as you do here, such a short 37 years period to show any CO2 effect on global temperature (if that effect anyway exists) moreover is a somewhat simplicistic approach.

          • mpainter says:

            BN, you propagate the alarmist meme that the satellite era is too brief to make any determination about temperature or climate. BS button on that.

          • Mack says:

            37yrs period too short? That’s the “climate change” you’re having when you’re not having climate change. 37yrs of you idiots banging the table, bleating on about how our CO2 emissions are driving up global temperatures…but oh dear, no “climate change”… so where is it? ..maybe floating around in the vacuity of Bindidon’s brain.

          • Bindidon says:

            That’s dishonesty at is best, Mack: injury well hidden behind a nickname. There is pretty good name for that in my native tongue: ‘Feigheit’.

            On a german science site, comments like yours wouldn’t survive over submit time + 3 minutes, and be sure you would be banned off the stream forever.

            What now concerns the ‘brainless’ness you wrote about: that compliment I friendly return to the sender!

            Because if you had a brain, you would have understood that I wrote 37 years be a period too short to evaluate any relation between CO2 and warming, if that relation exists anyway.

            Moreover I didn’t mention anything ‘about how our CO2 emissions are driving up global temperatures’. That’s yours. I simply answered to a more or less meaningless plot with another more or less meaningless plot. But to grasp that, again a brain is needed…

            Finally, I did not write anything about climate; nobody told an observation of climate change within such a time interval indeed be meaningless.

            You do no more than wasting my time, Mack.

          • Mack says:

            Yeah, “meaningless plots” alright. The trouble is Bindidon, you copy Roy’s real data and come up with these “alarming”, Wood for Trees like temperature graphs…the ones you see at the Hot Whoppery, Open Mind,(very funny),Gavin Schmit’s place, etc…which show temperatures relentlessly skyrocketing. Yeah, condense down the horizontal axis and expand the vertical axis enough, and temperature will graphically stand on it’s head.
            Great optical illusions from the great deceptive AGW deluded.
            As Painter has already observed, there’s a “step-up” circa 2000 to 2002,…temperatures are below the 0.0 line prior, and above 0.0, the time after…not hard to see.
            Time to get your eyes checked,Bindidon,..ask for a new non-myopic,Schmit free, prescription.

        • Bindidon says:

          CoRev, I don’t understand your WFT plot. What in the world do you mean with ‘the same data’ ? Did RSS recently experience a mutation toward a surface record like JMA?

          Moreover: did you check that you exactly replicated the WFT link written by Bart on May 5, 2016 at 2:47 AM ?

          Concerning the ‘scaling’ factor you mentioned: it’s simply the good old Arrhenius constant modified according to the 1901/1906 revisions of his 1896 paper.

          The value I computed years ago, it’s about half the original value. I followed indications found on a web site, don’t ask me which one, and don’t ask me how ‘warmista’ the site has been 🙂

        • CoRev says:

          Bindidon, my chart was for Bart’s reference. Your comment is truly overly obtuse. When comparing different data sets, the shortest, whether 37 years or not, limits the overall length for comparison. Is that concept too simplistic for you?

        • fonzarelli says:

          CoRev, scaling the graphs alike is not going to create all the features that need be in order to make the two data sets track with one another… since one is in ppm and the other in degrees, there needs to be a scale that makes both data set comparable. Having don’t that, you can then look and see that all the features (variability and trends) are a remarkable fit. That will NOT happen by chance…

      • Bart says:

        That’s an idiotic chart. Nowhere close to the same kind of agreement. Just the happenstance of two series going vaguely in the same direction.

        • Bindidon says:

          ‘Thats an idiotic chart.’

          Like mapainter’s and Mack’s answers is yours desperately superficial, though, to be honest, at least polite… thanks for that.

          But when you look at CoRev’s post (May 5, 2016 at 6:32 AM): don’t you get some shadow of an idea about why you write:

          ‘Nowhere close to the same kind of agreement. Just the happenstance of two series going vaguely in the same direction.’ ?

          Look at the strange identity of both WFT links in CoRev’s post and yours…

          • Bart says:

            Only one of the relationships means anything – you cannot have both, as that would indicate horrifically unstable positive feedback. So, is the one that sort of vaguely goes in the same direction, or the one that matches every up and down, every twist and turn?

            Don’t be stupid, and don’t waste my time. If you’re looking for a way to avoid the obvious, I don’t have the time to waste on you.

  29. dave says:

    RSS now has an April number in its data series although they have not updated the graphs yet – it is easy to miss it. Another tenth of a degree C drop, globally, for LT.

    Maue’s ‘2-meter global anomaly’ continues to work its way, irregularly, down.

    The Australian Bureau of Meteorology (late-April update) is on “La Nina Watch.” The ensemble of different prediction algorithms has a mean prediction of La Nina threshold being passed NEXT MONTH. Of course, the numbers MIGHT simply turn neutral.

    • barry says:

      BoM says:

      “Six of eight international climate models suggest the tropical Pacific Ocean will return to neutral levels within the next month. By September, seven of eight models suggest La Nia thresholds are likely. However, individual model outlooks show a large spread between neutral and La Nia scenarios.”

      The spread pictured on the outlook page is an ensemble of BoM models (POAMA), not international. BoM’s mean outlook is somewhat of an outlier among international forecasts, giving about a 50% chance of la Nina thresholds being reached by the end of June.

  30. Climatechange4realz says:

    Co2 is increasing yet tenperatures have been steady for almost 20 years therefore One cannot rule that co2 is the main controller of the earths climate no matter how spacific or general there sources or claims are.

  31. Paul C says:

    Hey Quietly Observing…. Is that you, D.ug Cott.n??

  32. Climatechange4realz says:

    The sun is the main controller of the earths climate. Temperature has made many paused in the last 100 years that correlate with the Suns sunspot cycle. There are cycles on the order of tens of thousands of years to just 6 years each on so of them correlates with 90% accuracy. If co2 in the atmosphere is the main controller of the earths climate and its continuing to increase then the temperature should continue to go up as well. It’s common sense. But it’s not it’s been flat and not continuing to rise over the past 19 years according to dr Roy spencer and several other satellite date shows

  33. Climatechange4realz says:

    If any of you disagree with me tell me why I’m wrong and show me sources to your claims

    • Bindidon says:

      No no, that’s the simple-minded ‘mpainter’ trick!

      Tell us why you think you are right, and we will see…

      • mpainter says:

        I see that you come all the way across the ocean to call people names.

        A little science test for our visitor:

        At what approximate height above the ground is the 15 micron band completely absorbed by atmospheric CO2 at 1) 300 ppm, 2) 400 ppm, 3) 560 ppm

      • barry says:

        Saturation height would only matter if CO2 molecules only re-radiated downward. But they re-radiate in all directions, including skyward. 15 micron saturation could occur at 1 millimeter from the surface and still the re-emitted photons would run into more CO2 in the atmospheric layers above.

        CO2 absorbs wider than precisely 15 microns, and the edges of that band are not saturated. Increased atmospheric CO2 is still going to slow down heat escaping to space, raising the temperature at the surface.

        Are you of the opinion that an enhanced greenhouse effect is not possible with more CO2? I wouldn’t have picked you to have a similar mindset to the Skydragon slayers.

        • mpainter says:

          My understanding is that the absorbed 15 micron IR is thermalized before it can be radiated by a CO2 molecule. This undoubtedly means no 15 micron IR makes it past…what height, Barry? Ten meters?
          And with what implications?

          Unless you can show that atmospheric CO2 radiates 15 micron IR, you will have a problem demonstrating that the AGW hypothesis is sound. Have at.

        • Climatechange4realz says:

          Show me links to support your claims Barry

        • Bindidon says:

          Maybe this info is interesting for you, I don’t know:

          http://newscenter.lbl.gov/2015/02/25/co2-greenhouse-effect-increase/

          Is it alarmism or not? No idea! Only scientists really involved in that domain will be able to answer.

          • mpainter says:

            Old hat bindidon, and thoroughly debunked. A Keeling curve plotted with a modeled forcing at two sites which cooled over the test interim. A joke, fodder for fools. You like inflammatory press releases, I see.

            You ignored my science test above. Especially devised for you. So much for bindidon.

          • Norman says:

            Bindidon,

            I looked at your link and would have you consider this one along with yours and see the value difference between the two studies.

            http://science.sciencemag.org/content/243/4887/57

            Quote from the abstract (study is in Science): “The size of the observed net cloud forcing is about four times as large as the expected value of radiative forcing from a doubling of CO2. The shortwave and longwave components of cloud forcing are about ten times as large as those for a CO2 doubling. Hence, small changes in the cloud-radiative forcing fields can play a significant role as a climate feedback mechanism.”

        • CoRev says:

          Barry, you got this correct: “Increased atmospheric CO2 is still going to SLOW DOWN heat escaping to space, raising the temperature at the surface.” Slowing is not TRAPPING, the oft repeated claim.

          The next question becomes for how long does that slow down last?

          • Bart says:

            Slowing down a continuous flow results in a backup. Just like putting a dam across a river will cause the water to back up behind the structure. Once the water overtops the dam, you get the same flow in and out, but you’ve created a pool behind the structure. Increase the height of the dam, and once everything equilibrates again, you’ve got the same flow in and out, but the pool is deeper.

            But, that only works if the route over dam is the only outlet. If you have a spillway, the dam can only raise the level behind it so much, and then it all goes through the spillway. Increasing the height of the dam at that point has no effect.

            The greenhouse effect is predicated on radiation only transfer of heat from the surface. But, there are vast convective flows from the surface to the atmospheric heights, from whence the heat can be radiated away. Those convective flows are a spillway. And, the convective flows increase as the atmosphere heats, which is a negative feedback.

            As a result, increased resistance to surface radiation is not a sufficient condition for heating the surface, only a potential one.

          • CoRev says:

            Bart, I agree with your analogy and the attention to convection, but I am trying to get those who so strongly believe in the AGW hypothesis to explain the too often repeated “trapped” claim.

          • Tim Folkerts says:

            Bart says: “The greenhouse effect is predicated on radiation only transfer of heat from the surface.”

            Actually, the GHE is predicated on radiation only transfer FROM THE TOP OF THE ATMOSPHERE.

            To use your analogy, yes convection is a ‘massive spillway’, setting the lapse rate within the atmosphere — ie setting the SLOPE of the water flowing down the riverbed.

            But adding more GHGs raises the top of atmosphere radiating level — it creates “one more dam” downstream. This new dam causes some rise in water level at the downstream end of the river. And since convection sets a slope = lapse rate, this will cause a pile up all the way back upstream.

            Now it is possible that the other “dams and spillways” will change due to feedbacks, but that is a different, more challenging question. If you keep all the rules the same, then the the clear result is a warming at the surface.

          • geran says:

            Tim says: “This new dam causes some rise in water level at the downstream end of the river……If you keep all the rules the same, then the the clear result is a warming at the surface.”

            Tim, to make your “dam” analogy valid, the dam must have a weir. And, the weir must have an area that increases with increasing water level behind the dam. In fact, the weir area must be proportional to the 4th power of the height of the water level!

            (Maybe that’s why the IPCC\CO2\AGW nonsense fails, huh?)

          • geran says:

            CoRev says: “Bart, I agree with your analogy and the attention to convection, but I am trying to get those who so strongly believe in the AGW hypothesis to explain the too often repeated trapped claim.”

            The AGWers can NOT explain the “trapped” claim, because it is invalid. Atmospheric CO2 does NOT “trap” heat.

            Witness all of the heat moving through the troposphere, as indicated by the UAH figures above. Why can’t the atmosphere “trap” all that heat?

          • CoRev says:

            Geran, we do agree. That is why I want those who believe the consensus hypothesis to do the appropriate math. If/when the do then we can discuss the implications, but until that we just get the same thoughtless generalities.

          • Tim Folkerts says:

            Geran,

            First, this is not my analogy. I was just using a previous analogy and making it slightly better.

            Second, why are you objecting to a “fourth power weir”? For the dam, that would just me some sort of “V” shaped opening that allows more and more water to escape as the level backs up behind the dam. And in the atmosphere … well, that is jsut the way radiation works.

            Finally, a better analogy would be a set of concentric cylindrical water tanks (or air tanks) — with each ring having various small openings. Water flows into the center ring. The water in the inner tank builds up until the pressure is such that the water leaking from the holes balances the water coming in.

            But of course, the water escaping will depend on the water level in the next ring out. The deeper the water in the next ring out, the higher the water close in must be to create the balancing flow. Eventually, all the rings will achieve some steady-state condition.

            And if you restrict the flow from the outermost ring, then all the others will back up too.

          • geran says:

            Tim asks: Second, why are you objecting to a fourth power weir?

            Tim, reread my comment. “…must have…” is NOT “objecting to”!

          • barry says:

            “Trapping radiation”

            Analogies are always imperfect. As no one here is using the word ‘trapped’, I don’t know why people are asking for it to be justified.

            Here’s another imperfect analogy. Adding CO2 is like adding another garment. This slows down the heat escaping from the surface of the skin. The analogy is not perfect, of course, because this is a convective process. But it serves for conveying the general idea of atmospheric ‘greenhouse’ warming.

            Convection (and convection changes) are part of the understanding of the enhanced ‘greenhouse’ effect in the atmosphere. Do people really think they’ve stumbled on something that has not been considered?

          • mpainter says:

            Tim, please address my comment up thread. If CO2 thermalizes the 15 micron wavelength without re-emitting it, then what is this talk of back radiation from CO2?

          • barry says:

            If CO2 thermalizes the 15 micron wavelength without re-emitting it…

            Is Tim saying that? Doesn’t look like he is to me.

          • mpainter says:

            Barry, I referred to my comment above:

            mpainter says:
            May 5, 2016 at 6:33 PM
            My understanding is that the absorbed 15 micron IR is thermalized before it can be radiated by a CO2 molecule. This undoubtedly means no 15 micron IR makes it pastwhat height, Barry? Ten meters?
            And with what implications?

            Unless you can show that atmospheric CO2 radiates 15 micron IR, you will have a problem demonstrating that the AGW hypothesis is sound. Have at.
            ###

            This was a response to you, but you ignored it. Will you ignore it again?

          • Tim Folkerts says:

            mpainter says: “Tim, please address my comment up thread. If CO2 thermalizes the 15 micron wavelength without re-emitting it, then what is this talk of back radiation from CO2?”

            I think I can see where your confusion arises. The first half of what you say is good. Yes, you are right that the energy from a given IR photon that gets absorbed by a CO2 molecule will most likely get thermalized. The average time before emitting an IR photon is longer than the average time between collisons with other molecules.

            As such, basically no 15 um photons that get emitted by the ground will make it far through the atmosphere. Also, the odds are very slim that the energy from a specific IR photon will excite a CO2 molecule and that that excited molecule will then “de-excite” by emitting an IR photon back to the ground.

            Unless you can show that atmospheric CO2 radiates 15 micron IR …”

            Of course it does. Any warm material (like the CO2 molecules in the atmosphere) radiates thermal IR (some better than others).

            The CO2 molecules in the atmosphere can get excited not only by absorbing IR photons, but also by collisions with surrounding molecules. So some fraction of the CO2 molecules will be excited at any given time and there will be some continuous flux of IR photons in all directions.

          • mpainter says:

            Thanks for answering, Tim. I thought that kinetic energy would play a role, at least theoretically. So saturation level lowers incrementally with increasing CO2.

            But how is the effect any different. At whatever level of atmospheric CO2, the 15 micron band is absorbed within several meters of the surface. In any case, whether the absorbed energy is kinetic or briefly converted as radiation, the energy held in the atmospheric gases is not changed. The atmosphere has exactly the same level of energy at any concentration of CO2. Nothing has changed except the saturation level, and that is inconsequential.

          • Bart says:

            Tim Folkerts:

            “Actually, the GHE is predicated on radiation only transfer FROM THE TOP OF THE ATMOSPHERE.”

            Actually, no. The theory is that photons rising from the surface are impeded from getting out. So, you get a divot in the outgoing radiation spectrum, and the entire curve has to rise in order to reestablish equilibrium.

            And, we see the divot. No doubt about it, though most of it is due to water vapor rather than CO2. So, on the whole, GHGs must indeed make the surface hotter than it would be with no GHG.

            What we do not see is whether an incremental change in atmospheric CO2 results in an incremental increase in the size of the divot. It is the difference between a secant line and a tangent line. We do not actually know the sensitivity of that divot to increasing CO2 in the present climate state.

            If you increase GHG only at the top of the atmosphere, then it’s not going to receive a lot of IR from the surface anyway, and of what it does, the roughly half that redirects towards the surface will not make it back down.

            There is a good analogy with your car’s cooling system. Putting a hunk of metal between your engine and the airflow would tend to heat up your engine, all things being equal. But, pump some coolant through the engine so that it can advect to that hunk of metal, and make sure the hunk has lots of radiating area, and you’ve got a system that will keep your engine cool.

          • Bart says:

            “But adding more GHGs raises the top of atmosphere radiating level it creates one more dam downstream. This new dam causes some rise in water level at the downstream end of the river. And since convection sets a slope = lapse rate, this will cause a pile up all the way back upstream.”

            Increase the dam however high you like. If the spillway is lower, it will have little to no effect. Moreover, this spillway is variable, and it opens wider as the water level increases behind the dam (heat stirs up more convection).

            Radiation from the top of the atmosphere is not dammed. It is the entire atmospheric depth that creates the dam. If you are a photon, and you bypass that dam (the aforementioned divot) via the convective flow and get to the top of the atmosphere, then you are free to go.

          • Tim Folkerts says:

            Bart says: “The theory is that photons rising from the surface are impeded from getting out.
            Those photons from the surface are impeded by the first few meters of CO2 (especially near 15 um).
            The photons from the next few meters are impeded byt the few meters above that.
            And so on to the top of the atmosphere. So it is the top layers of CO2 that ultimately impede the outgoing 15 um photons.

            And, we see the divot. No doubt about it, though most of it is due to water vapor rather than CO2.”
            I agree. understanding that “divot” is pivotal to understand the GHE.

            I highly recommend that people play with MODTRAN here: http://climatemodels.uchicago.edu/modtran/. While far from perfect, it does a great job of getting a feel for the radiation in the atmosphere — looking up or down from various altitudes; changing GHG concentrations; different locations and different seasons.

            For example, a quick look suggests (roughly) that CO2 is about 1/4 of the GHE; H2O is about 5/8, and other gases are the other 1/8.

            “If you are a photon, and you bypass that dam (the aforementioned divot) via the convective flow and get to the top of the atmosphere, then you are free to go.”
            Photons can bypass the dam by going through the “atmospheric window”.

            Or alternatively, *energy* could bypass photons altogether by rising via convection. In this case, the energy could be turned into IR photons by the CO2 at the top of the atmosphere, at which point it is free to escape. But again the CO2 at the TOA is playing a critical role. The TOA CO2 still creates that critical “divot”.

          • barry says:

            mpainter, I did reply, but several posts have been swallowed on submission. Dr Spencer may allow my first attempt today. i’m going for my third now, to see if there’s a workaround this comment-gobbling phenomenon.

          • barry says:

            Dang.

            (Sorry again about the multiple posts in moderation, Dr Spencer. Can’t figure out why it’s happening)

          • mpainter says:

            Tim Folkerts, your photon >>> CO2 >>> photon >>> CO2 is a zero sum game. This does not add energy to the atmosphere, it just transposes energy from kinetic to radiant and back again. This does not retard the escape of energy from the atmosphere, it does not raise temperatures. Not when CO2 is at saturation. The 15 micron band is thermalized and stays thermalized. Doubling CO2 will not matter.

          • barry says:

            Bart,

            What we do not see is whether an incremental change in atmospheric CO2 results in an incremental increase in the size of the divot.

            We can see a darkening of radiance in the spectral bands associated with CO2 over time from satellites, and more downwelling radiation in those bands from ground-based measuring systems. These are empirical evidence of the enhanced GHE. Numerous studies analysing radiance changes over time corroborate.

          • barry says:

            mpainter, are you saying that upwelling radiation at 15 microns is ‘trapped’ a few meters above the surface and cannot be re-emitted to higher levels of the atmos?

          • mpainter says:

            No. I’m saying that increased CO2 does not change the thermodynamics of the atmosphere. No energy added, no retardation of energy loss. No surface warming, either, because atmospheric energy does not increase.

            The radiative flux will increase, yes, but the temperature does not change because the energy simply transposes from kinetic to radiant and back again. This back and forth transposition does not lead to warming nor to retardation of energy loss from the atmosphere.

          • Tim Folkerts says:

            mpainter says: “This does not retard the escape of energy from the atmosphere, it does not raise temperatures. Not when CO2 is at saturation. ”

            But there is always some altitude where CO2 is not “saturated” and IR can start to pass through/escape to space. Doubling the CO2 concentration here DOES retard the escape of energy.

          • mpainter says:

            Tim Folkerts,

            yes, the hypothetical “effective radiation level”. But, radiation of what? Because the TOA spectrum shows a hole in the 15 micron band, does it not? Little or no energy emitted by CO2 into space. Increasing atmospheric CO2 ppm does not change this, because there is no “effective radiation” of the 15 micron band.

            I conclude that there is very little emission by CO2 molecules at any level in the atmosphere.

          • Tim Folkerts says:

            mpainter,

            The fact that little radiation comes from the CO2 in the 15 um band is exactly the point!

            Remove the CO2 and “divot” would disappear. Then much MORE energy would suddenly leave, cooling the earth as a whole until a new balance is achieved.

            Conversely, adding more CO2 will widen the “divot”. More CO2 will also cause the 15 um radiation to come from even higher in the atmosphere, where it is cooler, thereby deepening the “divot”. The deeper, wider “divot” reduces the outgoing energy, warming the earth as a whole until a new balance is achieved.

          • mpainter says:

            Tim, thanks for replying.

            Two conclusions:

            1) Negligible 15 micron IR is radiated at the ERL, hence the height of the ERL cannot be of any consequence. Move it up or down, still negligible.

            2) The energy represented by the divot has been shifted to other wavelengths, obviously. The 15 micron wavelength is thermalized and the energy is most likely radiated from water molecules.

            So the whole question hinges on the transposition to atmospheric water of the energy absorbed by the CO2, and how effectively the water radiates this energy. CO2 acts as the absorbant, water as the radiator.

            FYI, the greenhouse effect has been mischaracterized. Increasing atmospheric water moderates temperatures by reducing the diurnal range, that is, by reducing tmax and increasing tmin. Compare dry Sahara with humid tropics. Note how this observation escapes/is ignored by the theorists. Thus AGW.

          • Tim Folkerts says:

            mpainter,

            1) the divot removes 10’s of W/m^2 of radiation, but still emits 10’s of W/m^2, so that is hardly “negligible” either way. And adding CO2 can remove 1’s of W/m^2, which is enough to affect temperatures.

            2) Yes the radiation gets shifted. some gets shifted to the bands radiated by water. But some also gets shifted to the band in the atmospheric window = more radiation directly from the surface = a warmer surface = global warming. There is no reason to expect ALL of the energy to gets shifted ONLY to the bands that water can emit.

          • mpainter says:

            Test…

          • mpainter says:

            Tim, shifted to water because that is the dominant species of radiant gas. The water is an energy sweeper, a sort of atmospheric guzzle-all that all kinetic energy is transferred to, eventually. And the 15 micron band is thermalized instantaneously. No role for CO2 in the GHE, except to transfer 15 micron IR to water molecules. Adding CO2 does not retard that process, but facilitates it.

            Regarding surface warming, see my comments above regarding late twentieth century warming, cloud albedo, and the stepup in the global temperature anomaly.

          • Bart says:

            Tim Folkerts:

            “Those photons from the surface are impeded by the first few meters of CO2 (especially near 15 um). The photons from the next few meters are impeded byt the few meters above that. And so on to the top of the atmosphere. So it is the top layers of CO2 that ultimately impede the outgoing 15 um photons.”

            Precisely. So, if convection allows transport of heat above the many layers of that filter, so that heat can be released above most of them, then the filter has little effect. It’s a spillway.

            ‘The TOA CO2 still creates that critical divot.’

            It is a much shallower divot at that point.

            barry:

            “We can see a darkening of radiance in the spectral bands associated with CO2 over time from satellites, and more downwelling radiation in those bands from ground-based measuring systems.”

            Can we? Only literature I have seen is at selected sites, not globally, with very low SNR, and no assurance that the purported result is due specifically to the very small increase in CO2 concentration over the satellite era.

      • Climatechange4realz says:

        @bindidon why don’t you look at my previous posts I already proved that co2 has no correlation whatsoever with global temperatures since it is steadily increasing. If you look at dr roy Spencer’s graph there has been no steady increase in global temperatures since 1998. Dr roy spencer uses real satellite data that is unadjusted and straight from the satellite records. As I said before if co2 was the main cause of climate change in which you warmists claim then we would continue to see a steady upward increase in global temps not an 18 year pause as dr roy spencer is showing from that satellite records.

  34. Climatechange4realz says:

    So tell me “quiet observer” on a scale from 1 to 10 how much do you think does man have control of the earths climate?

  35. Quiet observer you seem to have a good understanding of climate sensitivity. According to your article it seems I was wrong about a few things but I am glad that me and you both agree that man made global warming is junk science. Which one of these charts do you recommend?

  36. Norman says:

    Too bad, if the idiot keeps posting Roy will have to stop comments again and maybe forever. One compulsive fanatic will spoil it for the rest of the posters. I really like reading the comments section and it is open enough where all the various opinions can be aired.

  37. Bindidon says:

    Sorry Barry, the communication line was again interrupted I guess (this time I managed to save the comment before)

    🙁

  38. Bindidon says:

    You are obviously right, Barry!

    ‘Baselining’ a record may well shift anomaly levels, but certainly not their temporality.

    Nevertheless, please have a look at the following plot:

    http://fs5.directupload.net/images/160505/bpsj6sop.pdf

    where I first compared UAH6.0beta5 and GISSTEMP for both El Ninos (1997/98, 2015/16) and added RSS3.3 to be sure.

    Apart from RSS’ solist uptick in april 1998, you see that all three records share a peak in february for both El Nino events.

    So my question: when you write

    Two months lag between sat and surf. Its in the data

    which data do you mean?

    • Bindidon says:

      There seems to be a problem when integrating some links into comments.

      I just sent some comments to commenter Barry, with links to anomaly data provided by UAH, RSS and GISS, and all comments were dropped off.

      Strrrrange Thinggggs Happppen heeeere!

      • I see bindidon so your here to deny the real science are you? Do you have any sources to back up your claims? If you do please send me links to them like a real climate scientist would. If not then that post was just plain meaningless?

        • Bindidon says:

          I just sent some comments to commenter Barry, with links to anomaly data provided by UAH, RSS and GISS, and all comments were dropped off.

          Is it too difficult for you to understand?

      • By the way bindidon that chart you posted has been manipulated. The temperature has been steady for the past 18 years. Your chart is made to fit the global warming scare and if the earth is warming so much then what’s with all these cold records being broken over the past decade.

        http://iceagenow.info

        • Bindidon says:

          By the way bindidon that chart you posted has been manipulated.

          Wow! Then Bindidon himself has been the Great Manipulator… mea maxima culpa!

          All data you see was downloaded from the Net, read into Excel, carefully normalized wrt UAH’s baseline (1981-2010) and plotted using Excel’s chartware.

          1. Feel free to do the same, you will obtain the same results.

          2. During El Nino events (and even during the five preceeding years), temperatures may increase a lot.

          3. The temperature difference between 1997/98 and 2015/16 is explained by worldwide known Senior Climate Superscientists as a step up between 2000 and 2002.

          Understood, Climatechange4realz?

        • Bindidon says:

          What now concerns your claim for so many cold records all around the world, please note that they all are local events.

          We speak here about globally averaged temperatures, in which these cold records are merged together with warm records in certainly similar quantities.

    • barry says:

      Yes, all 3 record share ‘a’ peak in February. We are clearly looking at this differently. I’m speaking of the hottest month in the el nino year – the highest monthly anomaly for each of the data sets.

      For the surface data sets, the warmest month is February. For the satellite data sets, the warmest month in 1998 is April. 2 months apart. The same lag for the same duration is found for the very strong 1982/3 el Nino. The hottest monthly anomaly in the satellite record for 1983 occurs 2 months after the warmest monthly anomaly in the surface records for 1983.

      Here are the 1998 Jan-Dec monthly anomalies for GISS, RSS, and UAH beta6.

      GISS
      0.61, 0.88, 0.61, 0.64, 0.71, 0.77, 0.70, 0.69, 0.46, 0.46. 0.49, 0.57

      RSS
      0.55, 0.74, 0.58, 0.86, 0.67, 0.57, 0.60, 0.57, 0.49, 0.46, 0.19, 0.31

      UAH
      0.48, 0.65, 0.47, 0.74, 0.64, 0.57, 0.51, 0.52, 0.44, 0.40, 0.12, 0.25

      Is that clearer?

      It’s the same pattern in 1982/3. Surface sets’ warmest anomaly in that very strong el Nino year was January. The satellite record peak anomaly occurred in March, 2 months later.

      Results are mixed for weaker el Ninos.

      The tropospheric lag to sea surface temps is well-known. There is often a lag between surface and troposphere for ENSO events, especially strong ones. Surface temp response is 3-4 months, and troposphere is 4-6 months, generally.

      I tend to use ONI metric for ENSO. In 1998, ENSO peaked in November 1997 (highest value reached during the OND quarter). Surface temps peaked in Feb, tropospheric temps peaked in April (highest monthly anomaly during el Nino year).

      According to the MEI record, el Nino peaked August/September 1997.

      http://www.esrl.noaa.gov/psd/enso/mei/table.html

      Tropospheric temps peaked 7 months after the MEI peak. Surface temps peaked 5 months after.

      (ONI index is based on Nino3.4 SSTs. MEI index is based on sea-level pressure, surface winds, SSTs, surface air temperature and cloudiness)

    • barry says:

      Amending for clarity:

      “The tropospheric lag to sea surface temps is well-known. There is often a lag between surface and troposphere for ENSO events, especially strong ones. Surface temp response is 3-4 months, and troposphere is 4-6 months, generally.”

      The tropospheric lag to sea surface temps is well-known. There is often a lag between global surface and troposphere temperature for ENSO events, especially strong ones. Surface temp response is 3-4 months after peak el Nino (warmest 3.4Nino SSTs during el Nino), and troposphere is 4-6 months after peak el Nino, generally.

      “Tropospheric temps peaked 7 months after the MEI peak. Surface temps peaked 5 months after.”

      Tropospheric temps peaked 7 months after the MEI peak. Surface temps peaked 5 months after the MEI peak.

  39. @queitly.observing but the way in case you didn’t know john l Casey is one of the most accurate climate predictors alive all because he uses the relational cycle theory.

  40. Hans Jelbring says:

    Dear Roy,

    I have sent two replies to what David Appell claims relating to Hans Jelbring and these have not shown up at your blog. I want these responses published.
    Is this blog censored and for what reasons?

    The comments relates to what David Appell tells may 4, 2016 at 10:20 and may 4, 2016 at 7.30.
    It seems strange if David Appell is allowed to downgrade me and my research without reason and that my answers are not published at this site. Please give an explanation?

    Best regards

    Hans Jelbring
    Ph.D. Climatology
    M.Sc electronics
    B.Sc. Meteorology

  41. fonzarelli says:

    Dr Shapiro, Dr Spencer has already admitted it. He on the record as saying he thinks it’s about 50/50, which would be at the low end of the ipcc claim of “at least half”…

  42. Bindidon says:

    According to one of Roy Spencer’s posts, the average absolute temperature in the LT is about 264 K, i.e. -9 C and thus 24 C less than at Earth’s surface.

    If we assume a loss of about 6 C per km upwards in the atmosphere, that would mean the LT level where these -9 C were measured is somewhere at 4 km above surface.

    That in turn means an atmospheric pressure between 700 and 500 hPa.

    But the UAH6.0beta5 record is even below the temperatures measured by RATPAC A and B radiosondes at 300 hPa.

    Are the RATPAC records then all wrong? Does anybody have valuable information about that?

    What do VIZ radiosondes measure in the LT? I can’t find any data about them.

    • barry says:

      VIZ radisonde network has been depleted and is now outmoded by other products.

      http://www.ua.nws.noaa.gov/Equip.htm

      • Bindidon says:

        Thanks Barry, I’ve been informed of that.

        But then: why is it used in J. Christy’s most recent testimony dated 2016 Feb 6?

        • It’s funny quiet observer there are other physicists that are also man made climate change deniers like you and I but think that co2 warms the earth but there are also some that say that co2 is converted sulfur acidic water droplets that act like mirrors reflecting solar radiation. What is your take on this?

          • Mack says:

            Clever stuff Duggie boy…but desperate attention seeking attempts by talking with yourself here as climatechange4realz, ain’t gonna work, neither.

  43. @quiet observer and can I be sure that the conclusion you have come to about man made co2 particulates cooling the planet is right?

  44. Physist Murray salby came out with a movie on climate sensitivity do you agree with him? If not tell me why he is wrong?

    https://m.youtube.com/watch?v=K_hBOU26F5o

  45. fonzarelli says:

    Testing…

  46. @corev show me your proof that man made atmospheric co2 causes global warming by listing sources to support your claims. Spencer’s chart shows no steady increase in global temperatures for the past 18 years now and yet atmospheric man made co2 continues to increase as we speak

    • CoRev says:

      Ole, where did I say that: “man made atmospheric co2 causes global warming”? I was agreeing with Barry re: IR/heat is slowed and not “trapped”. I also want to have others calculate to delay associated with that “slowing” of the IR.

      You could answer that.

  47. @corev “human co2 slows down the cooling. Rate of the atmosphere causing the earth to warm” why don’t you try telling queit observer that as well. I’m sure you and him will have a ton in common when it comes to the true science that supports this man made global warming claim

  48. @corev explain it in a way that I can actually understand it please and this time use links to back up your claims. If you can’t do that then you clearly do not understand the true science of climate change

    • CoRev says:

      Ole, you made this comment: “@corev human co2 slows down the cooling. Rate of the atmosphere causing the earth to warm” using quotes implying I said that. I did not, making your comment a clear misstatement.

      You then go on with this statement: “@corev explain it in a way that I can actually understand it please and this time use links to back up your claims.” Why do you want to discuss something that only you and no one else said?

  49. barry says:

    mpainter,

    A few replies to you (5 or 6 in different sub threads) have disappeared upon clicking ‘submit’ over the last few days. I don’t know why this happens, but it appears I’m not alone. I’m re-posting a response to the McLean paper below, as a new comment instead of sub-thread, to see if it takes this time.

  50. barry says:

    Nope, won’t take. I’ll try segmenting it, though I’m loath to post bunches of stuff in a row.

  51. barry says:

    Dr Spencer, I’ve made numerous attempts re-editing posts to see what causes them to disappear. None successful (spacing out or removing links/changing or removing HTML format/removing potential spam filter words).

    Posting this to apologize should you see a bunch of posts from me held in moderation. I’ve given up testing now.

    • Barry, I have no idea why those posts got held for moderation…I just let the first one through before you started editing. I have a bunch of Dou$ Co++xn keywords that I filter for, but I don’t see any of them in your case.

      • barry says:

        Thanks. Next time it happens I’ll try a couple of other ideas to test why posts are sent to moderation.

  52. Climatechange4realz says:

    @Jelbring Supporter nice paper! Well scientifically put together! Just one problem . It doesn’t prove shit! Since 1998 there has been no steady increase in global temperatures as most satellite data suggests. According to the man made global warming theory from an increase in co2 we should see a steady increase in average yearly global temps yet that hasn’t happen now for 18 straight years even as man made co2 increases dramatically. Even NASA going on about how 2015 was the “warmest year ever” has a chart that says so on numerous accessions in the past such as between 1940 and 1980. The greenhouse gas theory is indeed the greatest scientific fraud of all time! If you want to study climate change look at solar cycles

    • Bill Laurune says:

      Do those satellites have sensors that measure the temperature of the surface, or are they broken?

      Have the remaining sensors decayed in any way?

      Have the orbits decayed?

      Why do surface thermometers, even those well outside any so-called urban heat island, show clear warming?

      Why are species moving up elevations and toward higher latitudes? Are they in on the hoax?

      • geran says:

        Bill, you’re not trying to claim the El Nino was caused by CO2, are you?

      • David Appell says:

        Bill Laurune says:
        “Have the remaining sensors decayed in any way?
        Have the orbits decayed?”

        Please read the relevant papers before asking questions that were addressed long ago.

  53. @jelbring supporter Even cott’n focuses too much on the specifics like most climate change deniers when the evidence is right there that there have been no catastrophic global warming or cooling for 18 years now. Therefore it is safe to conclude that a constant increase co2 does not warm the earth nor does it cool the earth. All of the green house gases have no sustained change in the climate! It is complete political dogma! The sun controls our climate co2 doesn’t end of story! You don’t need to be a scientist to conclude that!

    • Bill Laurune says:

      “It is complete political dogma!”

      Really? Even in places like Saudi Arabia that earn tons of money selling hydrocarbons, they accept that CO2 causes warming just because of dogma? They are planning to decrease dependence on oil revenues and install a lot of solar because of dogma?

      Really, can you not even pause to consider facts that fly in the face your personal dogma?

      • Bill first of all of your going to criticize me provide links with evidence that support your claim. Second of all I don’t care if the freakin boogie monster believes in global warming. It doesn’t matter who believes in global warming I proved that adding co2 actually cools the earth why don’t you try reading all of my other comments before making such idiotic remarks. Get your facts straight kid

  54. @jelbring Supporter provide me a link that has not been fiddled by the AGW crowd that you say that they fiddle with dr Roy Spencer’s chart. I go by pure raw data. Secondly no the global cooling has begun and is not expected to start up again until the 2040s but only moderately so because the 200 year cycle is headed downhill according to the most accurate climate predictor in the U.S. As far as short term temperature declines and sunspots go. Heres the link:

    http://www.veritence.net/commentary.html

    Second what makes you think people fiddle with dr Roy spencer Roy’s data? All of the climate charts on climate for you show that besides February and March in the peak from the elnino temperature spike there has been no global warming for the past 18 years

    http://www.climate4you.com/GlobalTemperatures.htm#Earths%20rotation%20and%20global%20temperature

  55. This is among dr Roy Spencer’s which is among the least fiddled of all those charts. It’s the alarmists charts like the hockey schtick that have been fiddled with

    • David Appell says:

      Adjustments aren’t “fiddling” — they are necessary to remove biases.

      The satellite models also require a host of adjustments — cross calibration across several satellites, for the diurnal cycle, hot targets and satellite drifts. Some think they are significantly more complicated than any needed for surface temperature measurements.

      Carl Mears of RSS thinks the surface data are more reliable:

      “A similar, but stronger case can be made using surface temperature datasets, which I consider to be more reliable than satellite datasets.”

      http://www.remss.com/blog/recent-slowing-rise-global-temperatures

  56. fonzarelli says:

    Test 1…

  57. Vincent says:

    The problem for humanity is it’s inability to take action to remove harmful effects even when the causes are known.
    For example, we all know that obesity results from eating a greater quantity of food than the body actually requires for its daily operations. The surplus food that is eaten is stored as fat, which is fine if one lives in an environment subject to the occasional famine, but not fine if one lives in an environment where there’s always a continuous supply of tasty food.

    The solution to obesity is very simple. Just eat less and exercise more. It’s not rocket science, yet the solution seems so difficult to implement and put into practice.
    The same applies to air pollution and smog. We know the causes, which are the burning of fossil fuels without adequate emission controls, the burning of wood as fuel, clearing forests through burn-off practices, burning garbage and so on.

    We know the solutions. Governments and local authorities need to ensure that all coal-fired power plants have adequate emission controls, such as the Ultra-Supercritical variety which not only uses the coal more efficiently but significantly reduces the harmful emissions of CO, SO2, Nitric Oxides and particulate carbon etc, but not so much that clean and odourless gas called CO2.

    We also have to ensure that all vehicles meet certain strict standards of emissions, something that even Volkswagen have recently cheated on. Indonesia and Thailand, during certain times of the year, engage in heavy burn-off of forest debris in preparation for the new planting season. This results in widespread smog that drifts over to Singapore and Malaysia, also causing health problems over there. It happens year after year with no solution in sight. In Northern Thailnd, the smog has been just as bad this year as it’s ever been, despite a so-called ban on the burn-off practices.

    The authorities in India and China have failed to adequately regulate the control of emissions from fossil fuels. New Delhi has even worse smog than Beijing at certain times of the year. It’s a huge health problem for these countries, and other less developed countries.

    It’s all very well to engage in theoretical discussions as to what role the clean and odourless gas called Carbon Dioxide might have on our climate, but we should not forget that the persistent, real and current problem, causing much ill-health and premature loss of life in various parts of the world, is the resulting pollution caused by the burning of fossil fuels.

    Simple solutions are often the best. If you are overweight, eat less. You’ll also save money.

    If there are huge external costs to burning fossil fuels, in terms of health and environmental damage, then don’t burn the fuels. Simple. Use hydro, wind and solar-generated electricity instead. Use electric cars instead of dirty diesel and petrol.

    The initial costs might appear to be greater than the established methods of producing energy, but that’s at least partly because it’s difficult to put a price tag on the future health consequences for a young child exposed to the awful Delhi smog in India.

    After the initial development costs of the clean, sustainable and alternative energy supplies have been amortised and the production of the new technologies escalates, the price will quickly fall and we will all benefit from both cheaper and cleaner energy as well as better health. What more could you ask for?

    https://en.wikipedia.org/wiki/Air_Quality_in_Delhi

    http://www.ndtv.com/india-news/beijing-and-delhi-2-cities-and-2-ways-of-dealing-with-smog-1254197

    • geran says:

      “If there are huge external costs to burning fossil fuels, in terms of health and environmental damage, then dont burn the fuels. Simple. Use hydro, wind and solar-generated electricity instead.”

      Vincent, there are NO “simple” answers. You just want to avoid readily available and cheap natural fuels, so you claim all of your “alternatives” are “simple”. They are NOT. Hydro always get massive and expensive challenges from the wackos that want to save snails or fish or some unknown wildflower. Wind and solar have very well known deficiencies.

      If you are really sincere about getting away from “fossil fuels”, quit playing around and support nukes!

      • Vincent says:

        Geran,
        Did you not read the distinction I made between the known solutions, which are simple, and the implementation of those simple solutions, which are complex, and my analogy with the problems of the obese person?

        The implementation is complex because of the psychological condition of humanity, such as widespread greed, corruption, unrealistic expectations, addictions and denial of reality.

        To help bring about these beneficial changes of clean energy supplies, let’s consider the options. Is it realistic for us to expect countries that have got themselves into poverty and general dire straits through corruption, incompetence, inappropriate belief systems, continual fighting among themselves and so on, to magically behave sensibly and honestly with regard to emission controls on the burning of fossil fuels?

        I would say it’s clear that this is not realistic, and the current pollution in the major cities of India and China demonstrate this.

        As a result of this miserable failure of the majority of the world’s populations to curb harmful emissions from fossil fuels, we have to consider the only other realistic option, which is to develop new and efficient technologies to enable everyone to get their energy requirements from clean and renewable sources.

        However, for the reasons I’ve already mentioned, implementing the shift to renewable and clean energy supplies is still complex whilst there are cheaper and dirtier alternatives still available, which will appeal to the greedy, the corrupt and the incompetent.

        This is where the scare of global warming due to CO2 emissions comes into play, to add that extra inducement to societies to make the change to clean energy.

        Imagine what the situation would like be if we didn’t have that scare. Don’t you think the current pollution, world-wide, would be even worse?

        Nuclear fuel might be an option for those societies where greed, corruption and incompetence is less of a problem. However, even in Japan, that Fukashima nuclear disaster could have been prevented if the nuclear plant had been built above known previous tsunami flood levels. One has to wonder why such knowledge of previous flood levels was ignored when choosing the location of the plant.

        • geran says:

          I condensed it down for you Vincent:

          “I would say its clear that this is not realistic, and the current pollution in the major cities of India and China demonstrate this.”

    • mpainter says:

      You sent your complaints in the wrong direction, Vincent. China, India, Malaysia, Indonesia, etc. are all in the other direction. Take a good look at your map, and you will understand.

  58. RW says:

    The ‘adjustments’ wouldn’t be so suspicious if they didn’t virtually always result in more warming.

    • David Appell says:

      The adjustments in the Karl et al paper in Science last summer lowered the long-term warming trend.

      (See Figure 2 in their paper.)

      • mpainter says:

        That paper corrupted datasets, such as the buoy datasets, to support a fabricated SST trend. The usual AGW tactic, with full approval of the usual AGW crowd: Appell, Mosher, etc.

        • David Appell says:

          Your off-handed and trivial comments are not relevant to the scientific debate.

          • mpainter says:

            A skeptical approach is is important to achieving understanding, David. By such an approach one can learn on one’s own.

            For example, I have examined all of the NOAA Mean Sea Level Trend plots for each of their tidal gauges (several score of these) and discovered that the gauges on stable coasts show no sea level rise for thirty years, more or less.

            Tidal gauges that show a rising SL are located on subsiding coasts. Subsidence is due to several causes:

            1) ground water withdrawal: as in the Chesapeake Bay area where it is a well known problem and has been investigated for many years by such as the USGS. Also Galveston Bay area, where measures have been taken to control ground water withdrawal. These measures have arrested subsidence.
            2) glacial isostatic adjustments at the margin of the continent. This occurs on coasts of the northeast, from NYC northward. These adjustments have been long addressed in the literature and may be seen in GRACE data.
            3) sediment compaction/geosynclinal downwarp, as at Grande Isle, Louisiana, where the Mean Sea Level Trend shows a sea level rise of 9 mm/ year!. Most of south
            Louisiana is affected by such subsidence, much to the delight of the alarmists. That is you, David Appell.
            4) local tectonic subsidence, such as has registered on several of the west coast gauges. Most of the West Coast gauges show a flat Mean Sea Level Trend for the past thirty years or so, from Vancouver to San Diego.

            There is another tidal gauge on the west coast. It’s located on Harvest Platform in the Santa Barbara Channel. This one is operated by NASA. That’s right, __NASA__
            And why does NASA operate a tidal gauge?
            To key the Jason altimetry satellite. NASA calls it “ground truth”. It itself is calibrated by redundant GPS.

            Guess what Means Sea Level Trend at Harvest Platform is, David?

          • Mpainter they blamed the sea level rise in Miami for the supermoon as part of human caused global warming. Where are your sources and links supporting your claims? And how do you know that those tidal gauges haven’t been manipulated or put somewhere else? Alarmists do that. You are smart but you lack common sense like most Americans. The sea level is rising but at a very small rate of about 3 inches per decade which may be a factor to human caused global warming but just because it’s three inches a century now doesn’t mean it’s going to increase by 20 feet within the next 20
            Years which is what al gore claims. Be careful what you right wise one and if you think that man causes catastrophic global warming that Florida will be under water 20 years from now you really need to double check your sources my friend.

          • Mpainter I deeply apologize for what i said. Turns out you and I are on the same page. However as I said if we continue adding co2 to the atmosphere over 100s of years in time and don’t switch to another energy source 100 years from now I feel that the earth will become a sizzling oven or a frozen ice box because the affects of man amplified this however will be much after me and your lifetimes so I am not such worried about it as extremists like al gore which completely over exaggerate the whole issue

  59. David I think your missing the entire point here. Co2 had been on the increase ever since the late 1800s from man made fossil fuel emissions. Troughout that time period up until now man made co2 has been on a major increase. Assuming that greenhouse gasses like co2 have an affect on climate sensitivity whether warming or cooling the planet is a false statement. Simply because over the past 136 years temperatures have undergone pauses such as between 1940 and 1989 therefore to assume that we are putting co2 into the atmosphere which is warming the planet whether it would be at a slow rate or not is a false claim simply because if this were true we would continue to see an increase in average global temperatures through the years without any pauses. Now assuming that an increase in man made ghg emissions such as co2 cools the planet as you stated in your article over the long term we would continue to see a steady decrease in temperature but over the past 136 years until 1998 which are the 18 warmest years on record we have seen a long term increase in over global temperatures which alarmists are blaming on human admitted ghg emissions such as co2 but that is not the case because looking back at historical ice core data we will see that there is a lag time between solar driven temperatures and increases and decreases of co2 over a 800 year lag time simply as co2 continues to increase temperatures have actually decreased as we head into a new glacial period. So simply saying that oh the affect is long term is pure hogwash because co2 is the affect and not the cause of changes in temperature as past data shows us simply assuming that increasing the affect is going to affect the cause is utter nonsense it’s like me telling my mom that I’m full and there is leftover food on my plate on my mom adding more food to my plate would somehow cause me to start eating the food even though I’m full.

    • Tim Folkerts says:

      “… therefore to assume that we are putting co2 into the atmosphere which is warming the planet whether it would be at a slow rate or not is a false claim simply because if this were true we would continue to see an increase in average global temperatures through the years without any pauses.”

      This is faulty logic. The claim is simply that CO2 is *a* factor influencing global temperatures, not that CO2 is the *only* factor. By your logic, if I eat an extra 2 lb of sugar one week and don’t gain weight, then I have proven that sugar does not contribute to weight gain!

      • mpainter says:

        Who would accept such a test as proof that sugar caused weight gain?

        Answer: the same as those who accept the temperature record of the satellite era as proof of AGW

        • barry says:

          CC4R,

          if this were true [CO2 warming] we would continue to see an increase in average global temperatures through the years without any pauses.

          That holds true only if the earth were as smooth as a billiard ball with no other influences on global temperature, which of course there are. ENSO, valcanos etc are short term influences, hence the interannual ups and downs. Anthropogenic aerosols climbed rapidly in the first part of the 20th century, which are thought to be partly responsible for the 30-year pause mid-century. Over geological time-frames, orbital variations are most likely the cause of ice ages.

          Nobody ever expected other influences to quit just because atmospheric CO2 started increasing.

      • geran says:

        Tim, it appears you are graduating from “Warmist” to “Lukewarmer”. Congrats. Keep working at it and maybe someday you will reach the top–“Extreme Skeptic”!

        • CoRev says:

          geran, Extreme Skeptic!? I would class as “full blown cynic”, a class I readily embrace.

        • ray says:

          “…[Folkerts]…graduating…”

          Do not hold your breath.

          About nine months ago, Tim Folkerts was here claiming that the sea-ice freeze in Antarctica was proceeding so slowly that it was possible the maximum extent would fall short of the mean of the 1979-2008 period.

          A month later, a growth spurt had increased the ice area by 1.3 million sq kms; eventually, the maximum for the season exceeded the historical mean by some 200,000 sq kms.

          I do not remember him coming here with an immediate up-date.

          Of course, we cannot accurately observe the sea-ice in Antarctica this season, because an instrument on the F-17 satellite has failed. However, it is possible that it is cold and dark down there.

        • Nice one Geran Tim needs scrutinty for his false childish alarmist claims! Although I have to admit he does have a point. If we continue to increase co2 in the atmosphere and co2 is a contributer to climate change. Although it is not the main one it can cause an ugly mess in the long term whether it may be turning the world into a frozen ice box or a sizzling oven. The problem is extremists like al gore are making more of a big deal then it really is taking people’s mind off what’s really happening and directing them more to the long term affects that may have an impact on our future generations to come centuries from now. What we are dealing with is catastrophic global cooling due to a once in a 200 year solar energy output from the sun causing a nonstop cooling era causing temperatures to drop like a rock from now until the 2030s causing crop shortages and major changes in the earths agriculture which let up to many deaths the last time this solar minimum happened in the 1600s and the 1800s only this time we have 7 billion people that will be affected rather then only 32 million in the 1800s. All you have to do is look back at solar cycles and you will see what I’m talking about

        • Tim Folkerts says:

          Geran says: “graduating from Warmist to Lukewarmer.”
          I prefer to stick to “physicists”. Most of these other terms are too bogged down with emotions and misunderstandings to be of much use.

          Ray says: “Do not hold your breath. … I do not remember him coming here with an immediate up-date. “
          So your only real objection is that I am not regularly updating all my posts? I commented on a remarkable decline, from well above average to slightly below average in only a few month. I may have made an unremarkable comment that this might make the anomaly a little below average in the near future (nothing about alarming catastrophic collapses in the future). I have no obligation to follow up with posts about unremarkable future changes.

          Climatechange4realz: “Tim needs scrutinty for his false childish alarmist claims!”
          Really? Please point out one alarmist claim I have made in this thread. Heck, see if you can find one anywhere.
          Ironically, it is YOUR post that is actually chock full of such alarmism.
          * “whether it may be turning the world into a frozen ice box or a sizzling oven.”
          * “an impact on our future generations to come centuries from now.”
          * “What we are dealing with is catastrophic global cooling”
          * “causing temperatures to drop like a rock from now until the 2030s”

          • mpainter says:

            Nothing in Tim Folkerts comments indicates alarmism. He points this out and you respond in a foul-mouthed way. An apology would look good, that is, if you care about about looking good.

            I, for one, welcome the comments of Tim Folkerts.

      • Tim I never said that it wasn’t a factor of global climate change nor to what extent all
        I said is that co2 can’t cause global warming. By cause I mean that is the main driver of climate change. Did you even bother to read my previous posts? I said that adding ghg like co2 actually cools the atmosphere. It does not warm it. Try arguing with mr cott’n that co2 warms the atmosphere. I am curious as to how he will respond. If we keep admitting co2 into the atmosphere without switching energy sources this earth will become a frozen ice box 100s of years from now. Not 10 or 20 years from now but 100s at the minimum since co2 is such a Minor green house gas in the atmosphere. If you want to really understand climate change I suggests you look into solar cycles which attribute at least 90% accuracy with global climate changes

  60. David I recommend you look at the third chart on this link which shows a steady increase in co2 but at the same time temperature increasing

    http://www.climate4you.com/GlobalTemperatures.htm#Earths%20rotation%20and%20global%20temperature

  61. @Science Lecturer well said. There is no proof at all that co2 warms the planet as I stated above. If anything adding greenhouse gases like water vapor and co2 actually cools the planet as you and dr cott’n stated. We notice that during these solar minimums the magnetosphere decreases and allows more water vapor and clouds to form causing more of the suns rays to be blocked out of the earths snow storms causing more rain and snow to form. Likewise aerosols admitted from volcanos after a major eruption such as from mount penotoubo release as sulfur dioxide which when released in the atmosphere converts to sulphur acidic water droplets acting as little mirrors reflecting as much of the Suns Rays as they can. That is why deep solar minimums such as the dalton and montor minimum are corelated with record breaking volcanic activity causing so called volcanic winters actually adding to the cooling of the solar minimums. however I do not agree that adding ghg causes cooling in the long term

  62. @science lecturer Except for maybe a doubling of water vapor which corelates exactly with increasing and decreasing temperature levels unlike co2 which lags temperature by about 800 years

  63. @Corev yes those are them

  64. Leaving out all the statistics and consensus because in science statistics and consensus don’t prove shit. The adding of any greenhouse gasses whether it be co2 methane or whatever. They are claiming that it warms and cools the earths climate no it doesn’t warm the earths climate nor does it cool it as history proves to us. If this were true we could continue to see a steady increase or decrease in global temps over any given time span. But this is simply not true because looking at the earth over the last 10,000 years or the glacial/interglacial temps have actually been cooling. Not warming and over the past 200 years in terms of the bicentennial cycles of the sun the earth is warming and has stopped warming over the last 200 years or so even as co2 or whatever it may be is going up and the temperature has been in a steady platuae

  65. I meant to say stopped warming over the last 18 years sorry

  66. Now that it’s obvious that co2 isn’t the main climate driver we can add in climate sensitivity as an upper bound. In science an upper bound on an answer is almost as important as the answer itself. It provides a backup so god forbid the worse scenario were to happen it happens. In terms of climate sensitivity carbon dioxide makes up less then 1% of the atmosphere with every 1/1000 molocules making up 400 parts per million square volume. Let’s consider a doubling of co2 since preindustrial times. Since the current concentration is about 400ppmpv to the 2nd power a doubling on overall co2 will result in an increase of about 200 ppmv since 100 ppmv including overall co2 has been added to the earths atmosphere. This results in a warming of about 1 degree centigrade or 1.8 degrees Fahrenheit since man made co2 accounts for only 30% of the overall increase this will cause man to have a contribution of about 0.5566 per doubling co2. It’s the affect in the long term that worries me but what worries me more is that the natural component of climate change which is about to cause a deep increase in global temperatures.

  67. Deep decease I meant sorry

  68. ray says:

    This, from the IRI ENSO forecast published May 12:

    “Most ENSO prediction models indicate a return to neutral by the end of May with likely development of La Nina (of unknown strength) by fall.”

    • geran says:

      ray, some of the models forecast a RECORD La Nina. Even if only a teeny La Nina occurs, AGW is busted. (Because, how can AGW produce colder oceans?) But, if a RECORD La Nina occurs, us skeptics get to own all beach front property in our preferred latitudes.

      That’s how it works, right?

      • barry says:

        AGW does not mean that winter el Nino/la Nina oscilltion will cease. Likewise, straw man arguments will probably never be completely burned away. Unfortunately.

      • barry says:

        [“winter” doesn’t belong in the sentence – poor editing on my part]

  69. ray says:

    “That’s how it works, right?”

    Vous vous amusez.

  70. Aaron you are right that there are lags between solar activity and earth driven temperature as history has shown us. However if what your doing is saying that because there is a hiatus this is proof that the sun doesn’t control the earths climate. If you agree with that then if your claim is that co2 is the main controller of the earths climate then we should continue to see a steady increase in global temps which hasn’t happened in 18 years. However I do agree that if we continue to soar co2 in the atmosphere this will lead to major issues in the long term if we don’t switch to a more effiecent source of energy then fossil fuels which according to Murray salby is predicted to run out by 75% or so in the next 50 years which are oil and natural gas and all we will have left is coal which makes up about 25% of all sources for fossil fuels. The problem I have is that according to natural fluctuations in the Suns energy output which is the main controller of climate change is about to plunge into a 206 year reduction in solar energy output causing a 30 year cold spell which has already started according to the best climatologist in the U.S. Seems as though the government is shoving so much catostrophic man made global warming down our throats that no one really has the time and effort like me to do enough research on the subject to find that co2 is actually one of the most minor climate change influencers as the 18 year pause has shown us. In fact some scientists like cott’n say that co2 actually cools the earth at a minuscule amount. Do the research yourself kid and tell me if my interpretation on what you are saying is wrong and if it’s not show me links to your claims that man really is the main controller of climate change

    • “Climatechange4realz ,clearly, you have trouble interpreting a simple graph. Even Roy’s satellite data shows an upward trend, and that is but only one set of statistics. There are others that show it more clearly.

    • It is interesting that this so called cold spell has begun with the Arctic ice minimum is heading to a new record low….funny how a cooling world does this. A more appropriate explanation is that the statistics are actually correct, and the world is continuing to warm.

  71. jimc says:

    It seems the George Mason scientists behind the RICO investigation of skeptics are leftist activists.

    Shukla is less cagey: In the past I had taken the view that perhaps I can be more effective as an educator if I were not engaged in political debates/actions. I have changed my mind (with regrets as to why I waited so long!), and I have decided to get fully engaged in this process, not just the climate change issues but even the larger issues of inequality and social justice.

    http://www.nationalreview.com/node/435395/print

  72. Vincent says:

    Oops! My last comment appears to have been censored. Such a pity!

  73. Tim S says:

    test

  74. Tim S says:

    I must have used a wrong word somewhere in my previous attempt. The guy is back and up to his normal ways of making a complete nuisance of himself.

  75. ray says:

    “A Delhi court on May 14, 2016 took cognizance of a [1,400 page] charge sheet filed against [former Chairman of the IPCC] R K Pachauri and said there was sufficient evidence to proceed.”

  76. Norman says:

    Climatechange4realz

    You sound a lot like Hansen just 180 degrees opposite. Not the scientific approach. You are trying to appeal to emotions of disaster. Yours is a cold disaster and Hansen is a hot one. It would be nice not to let your emotions cloud the issue. I like the clarity of science.

    Just like the doomsday “End-Times” prophets (so far all have been wrong) they use emotional manipulation to convince people that doom is coming and be prepared. They use their interpretation of Revelations (incorrect as it has been many times) you use your current understanding of a very complex system with numerous inputs and variations and shrill about “YOU WILL REGRET IT!!!!” like you have the complete knowledge of how the climate and weather worked. If you and Hansen are so full of knowledge that you possess God-like knowledge than predict the next 10 years of global temperature, sea level, Arctic ice level, and how all this effects regional weather systems.

  77. Norman your comment doesn’t explain anything. You didn’t provide evidence or links to support your claims. You say “if you and Henson are so full of knowledge that you posses god-like knowledge then predict next 10 years of global temperature, sea level, artic ice level and how all this effects regional systems.” Why don’t you look at my previous comment that I wrote about global temperature going into a solar decline over the next 20 years. If you want to get an idea on how the climate will change you look at history because history repeats itself as I said before the sun goes in cycles that have repeated affects on the earths climate. The warmists like Al hoar claim bull shit forecasts according to him the artic should be gone be now but it’s not because if it was we would experience a significant sea level rise in sea levels. I live in south Florida and I’ve been to the beach my whole life and have noticed no significant rise in sea levels as warmists like Al gore claims. As far as artic sea ice goes this varies on a yearly time scale because of the Atlantic and pacific currents which usher in warmer water and cooler water at certain times. The sea level has risen about 3 inches per century. And don’t say oh it’s caused by We the people. Bull shit! As I said before since 1998 as dr Roy spencer provides there has been no significant warming since 1998 as warmists like Al gore claim we should continue to see a steady warming on a year to year basis. But we are simply not! As far as long term goes this is far beyond our life times! And by then will be out of fossil fuels so the affect on global warming is limited and miniscule! Next time you want to comment me provide sources and links to support your false claims!

  78. Norman says:

    Climatechange4realz

    I made no claims in my post that needed links to support. There have been regions with cooler temperatures but were they global? Europe could have been colder for a period of time because of changes in the Gulf Stream.

    I do not think the human race has enough information at this time to really tell one way or the other what the globe will do climate wise. That is why I do not think your claims are any more credible than are those of the CAGW crowd. Lots of speculation and emotion, far less logical reasoned evidence based science.

    Melting of Arctic ice does not much effect sea level, ice on land melting would.

  79. Norman says:

    Climatechange4realz

    It is obvious that you did not understand my post but proceeded to call it stupid. I am talking about the Arctic sea ice (which is what the climate scientists incorrectly speculated that it would be gone in summer months). Sea ice melting will not raise the sea level since the floating ice has the same amount of water as what was in the Arctic ocean. If you put ice in a drink and measure this and then wait until it all melts the level of liquid does not go up and overfill your glass.

    You can talk all you want about how solar cycle affect climate change but that does not mean you are right about your conclusions. Do you know for fact the entire globe (Southern Hemisphere) was much colder during the times Europe was very cold? Do you have evidence or just your opinion?

    Bertrand Russell: “The trouble with the world is that the stupid are cocksure, while the intelligent are so full of doubt.”

  80. gregg weidner says:

    Why is it that always the debate and attacks to science is whether there is or is not climate changes? Duh really… .here’s your sign…. climate change is reality..deal with it. Whether or not it’s caused by humans and our lust for carbon release into the atmosphere …ask the dinosaurs or better yet how did we survive the Ice Age…it’s called the greenhouse effect…Embrace it..it’s why we are thriving as a species. Gheeze all this education and not a bit of common sense or recognition that we as humans are insignificant in the universe….get over it.

  81. gregg weidner says:

    Glad you finally caught my sarcasm ….so much a waste of energy arguing over what we cannot control no matter how much control we think we have in controlling nature..let alone climate….just a leaf in the wind

  82. gregg weidner says:

    I know…that did sound like a dumb ass response..intended 🙂

  83. Norman says:

    Climatechange4realz

    I do not think you can follow thoughts that do not generate within your own cranium. You are attacking a point you are unable to grasp and then you get frustrated at your limited mental ability. Sorry you have such problems.

    I do not think explaining the reasoning to you will help. Bur I can attempt the impossible. During the “Little Ice Age” Europe was much colder than at other periods. Does this cold region imply that the whole Earth was colder?

    Here is a link you request.
    http://www.britannica.com/science/Little-Ice-Age

    A statement from this link for you: “However, these regional temperature declines rarely occurred at the same time. Cooler episodes also materialized in the Southern Hemisphere, initiating the advance of glaciers in Patagonia and New Zealand, but these episodes did not coincide with those occurring in the Northern Hemisphere. Meanwhile, temperatures of other regions of the world, such as eastern China and the Andes, remained relatively stable during the Little Ice Age.”

    Do you comprehend what has been stated? While Europe was very cold at times, other areas of the globe were not. The claim of the article is it may have had more to do with NAO than solar output changes.

    There are many things still not known about climate and the changes that have taken place. Nothing yet is established science or certainty. Many theories and ideas have been proposed yet none totally explains past climate and cannot be used to forecast future climate.

  84. Bindidon says:

    I’m stunning quite a bit about the aggressivity of some commenters, especially those viewing

    http://www.climate4you.com

    and some of its ‘scientific’ backgrounds, e.g. Barrett Bellamy Climate, as the only detentors of the truth.

    Those commenters I strongly recommend to have a look around their somewhat restricted knowledge. One link might help them to reconsider the situation:

    http://voxeu.org/article/myth-europe-s-little-ice-age

    • geran says:

      Yeah, Bin, I’m “stunnng quite a bit” also.

      My first response to your comment did not go through.

      (It’s called “climate science”.)

  85. geran says:

    “as for you Geran provide evidence by posting links to support your claims otherwise your so called climate science you claim to be is a load of cow wash!!”

    I’ll go with the “cow wash”.

    (Then I don’t have to waste my time explaining the actual science to folks that will never get it, like Norman.)

  86. Bindidon says:

    Lmao ?! Sounds quite a bit like the acronym of a german injury, huh? And this ‘z’ at the end of a pseudo reminds me the extreme right end of the political spectrum there, like these ‘Boehse Onkelsz’, huh?

    Well, Dr Spencer: I think I preferred Do.g Cott.n.
    My last comment here.

    • geran says:

      “My last comment here.”

      Bin, when you have some science to present, I assume Dr. Roy will accept.

  87. Lewis says:

    Dear Climatechange4realz,

    Do you really believe that ice melting in the Arctic raises sea levels? (may 15 – 10:53 AM you wrote: Ice melts. When ice melts it turns to water. What do you think causes flooding? Acess amounts of water. When the ground cant take anymore water it floods. Ever heard of run off?)

    I could go on…..Suffice it to say, you’re over your head here. My point is to feed the troll.

  88. Therefore my saying is if you can’t scientifically explain it right you can’t scientifically claim it right

    • Gordon Robertson says:

      “Therefore my saying is if you cant scientifically explain it right you cant scientifically claim it right”

      You just ruled out the anthropogenic warming theory. No one has ever explained it using scientific proof..

  89. Whose moderating my comments? And why?

    • I’m removing the ones where you engage in name-calling and insults. -Roy

      • mpainter says:

        Oh, please, don’t stop at name-calling and insults.

      • gregg weidner says:

        Thank you for your consideration Roy, I did not intend to incite an aggressive reponse but was only trying to express sarcastically, my opinion that our time and energy should be spent more adapting to climate change rather than having the arrogance that we think we can affect it..let alone control it. I appreciate the passion that anyone has towards climate change..I just wish we would all would look at historical facts from the beginning of the universe let alone earth’s climate evolution and respect that we and our actions are really insignificant….OK I am against polluting our air, our waters, our land..I am not a pollution advocate..let’s concentrate more on what we can logically control and leave the rest for fate..just don’t blame me for climate change when I/we were not around when the Ice Age melted.

        • lewis says:

          Mr. Weidner: Exactly so. Much of the problem is that man has decided to build cities in flood plains, barrier islands and other places way too close to the ocean. Now, having built there, someone (too many someones) imagine the oceans should stop the rise started some 20,000 years ago, simply because man had the temerity to build stupidly.

          We go farther. There is a group of these radicals who actually seem to detest anything mankind has done to improve his life on this planet. They remind me of those who sacrificed to the gods to change some current unpleasant weather or volcano or some such.

          For those of us who try to enjoy the short time we have here, to keep it clean and give our progeny a chance, these radicals go too far.

          It is easy to go on.

          Best wishes.

  90. Dr spencer sometimes I have no other choice but to call people names not because I’m a rude person but because I do it for our citizens lives. what we are dealing with as john l casey puts it is a life threatening global catastrophe in the next 15 years causing major food shortages. It’s real and it’s coming! And I’ve been trying to warn everyone but no one will listen to me! I don’t know what else to do! History proves its real please you have to believe me!

    • geran says:

      This makes about 17 “life threatening global catastrophes” in my lifetime.

      But, I may not have counted them all….

    • Gordon Robertson says:

      “what we are dealing with as john l casey puts it is a life threatening global catastrophe in the next 15 years causing major food shortages”.

      That’s been coming since 1988 and it’s nowhere in sight.

      • CoRev says:

        Gordon, “Thats been coming since 1988 and its nowhere in sight.” That food claim has been coming as long as I can remember in grade school and that was in the early 50s.

    • lewis says:

      Dear Mr. Climateetc.
      Spare me your concern. I’ll be burning fossil fuels in your honor, chopping trees and commuting 45 miles each way to work in a low MPG vehicle (ford F150)

      The climate will do as it will – and has. Your stamping of feet and gnashing of teeth will do nothing to influence it.

      Best wishes,

  91. Gordon:

    1. What are you taking about?
    2. Where is evidence to links that support your claims?

    If you can answer those two questions I would highly appreciate it.

    • Gordon Robertson says:

      @climate… “1. What are you taking about?
      2. Where is evidence to links that support your claims?”

      I presume you’re referring to my comment that “You just ruled out the anthropogenic warming theory. No one has ever explained it using scientific proof.”

      The IPCC have been studying global warming since 1988, trying to find proof that humans are causing it. Thus far they can state nothing more than it is likely. Of course, they are using their own scale of confidence levels and many disagree with the likelihoods they claim.

      In 2007 (AR4), the IPCC went out on a limb and claimed it was 90% likely humans are causing global warming. It was later revealed (Lindzen) that the statement came from 50 lead authors, not the 2500 reviewers. Lead authors are politically appointed and write the Summary for Policymakers. The IPCC has had the dubious practice of using the Summary to rewrite the main report from the 2500.

      In 2013, following AR5, the IPCC admitted there had been a warming hiatus since 1998. So they must have known in 2007 of the hiatus when they made the rash claim of it being 90% likely humans are causing global warming. In fact, in the Climategate email scandal, circa 2009, Kevin Trenberth, a coordinating lead author on IPCC reviews admitted to his peers privately in the emails that the warming has stopped and it’s a travesty that no one knows why.

      Not to be outdone, following their admission of a warming hiatus since 1998, the IPCC raised their confidence level that humans are causing the warming from 90 to 95%. Trenberth went off on a tangent looking for the missing warming and concluded it must be hidden in the oceans.

      NOAA outdid him, they went back and rewrote the temperature record by slashing 5000 surface stations from a global pool of 6500 then applying the real data from 1500 stations to synthesize the missing 5000 stations. In 2015, NOAA trumpeted that 2014 was the warmest year on record. In the fine print, they added that the confidence level was 48%.

      When UAH offers temperature data sets, do they supply a confidence level? No. Confidence levels are only required when there is statistical uncertainty as in a climate model projection. UAH does supply an error margin for satellite uncertainties but that’s hardly the same as synthesizing temperatures in a climate model and using a confidence level to state the likely error.

      2014 was only the warmest year if you were willing to accept a 48% confidence level. If you asked for a 95% level, it fell back to 4th place, where UAH had it pegged.

      There is no scientific proof that humans are causing global warming.

  92. Of course it’s been coming! That’s obvious! I never said it wasn’t coming It’s just not here yet! Gordon and Corev those comments are obvious! Think before you post!

    • CoRev says:

      CC4R, “I never said it wasnt coming.” No, you seemed to think you making a new claim. Famines have occurred throughout history, your prediction is neither new nor unique. It’s no different than saying a flood is coming.

    • Gordon Robertson says:

      @climate…”Of course its been coming! Thats obvious! I never said it wasnt coming Its just not here yet! Gordon and Corev those comments are obvious!”

      My claim was stated with sarcasm. James Hansen began claiming global warming catastrophe in 1998. According to Pat Michaels, he retracted much of the disaster claims in 1998, claiming his computer had messed up. Al Gore, driven by the claims of Hansen, who was a good buddy, made outlandish claims regarding climate catastrophe. Gore leaned heavily on Mann’s hockey stick as well.

      The hockey stick has been debunked and the IPCC has replaced it with the spaghetti graph. Hansen is long gone from NASA but his pipe dreams of climate catastrophe have been taken up by Gavin Schmidt, a mathematician.

      There has been no average global warming since 1998. No warming = no catastrophic climate change. It’s not happening, ain’t gonna happen.

  93. @gordon Robertson not by us human beings. But maybe if you look at the past solar cycles of the sun you will come up with a different answer. One that perhaps not many people are aware of because they are bombarded with man made climate change propoganda.

    https://www.patreon.com/user?ty=h&u=2547435

  94. Peter Adamson showed a satellite image of storm cells hitting the south western coast of Australia. This is the result of high sea level pressure in the south polar region. It blows Antarctic storms further north. It presages a cold and stormy winter for southern climes. The pressure changes are caused by a dip in solar activity – including in ultraviolet frequencies as these interact with ozone in the upper atmosphere. Winds from these storm cells are diverted north and south of the Americas pushing cold water into the Peruvian and Californian Currents. Cold bottom water starts to surface in the eastern Pacific. The cold water sets up feedbacks in wind and currents across the Pacific which result in more cold water upwelling in the north and central Pacific. You can wee in the equatorial region cold water upwelling that is the next, large La Nina forming. Large because we are in a cool phase of the Pacific Decadal Variation.

    http://www.ospo.noaa.gov/…/ano…/2016/anomnight.5.23.2016.gif

  95. @Robert Ellison precisely!

  96. jimc says:

    “New cloud formation discovery may lessen warming forecast”

    http://phys.org/news/2016-05-cloud-formation-discovery-lessen.html

    • Lewis says:

      Jimc,

      The part of that article telling us the researchers didn’t believe we had so many clouds before man started polluting about made me fall out. So the Nile didn’t flood in the springtime, the Amazon was a trickle, the Mississippi was a stream?

      Do they really think the water cycle didn’t work without man’s influence? These are the people telling us the world is falling apart.

      My beliefs are very specific. The earth is very old. A lot went on before man arrived. A lot will go on after his demise. And the way it looks that demise will be self inflicted by a bunch of radical anti-humans. We find them today opposing industrialization and agricultural advances (GMO’s) etc. Next they’ll be opposing medical advances and finally heating, air-conditioning and even screens on windows. – Wouldn’t want to stop the bugs from having a meal would they?

      • Tell me about it Lewis. These global warming doomsdayers couldn’t get any dumber

      • jimc says:

        Lewis, I pointed out the article because of the importance of clouds and because it appears on an avidly, even radically, environmentalist/alarmist website (note the hedging). I got the pdf the site references, but couldnt understand it. I know from the Docs writing that cloud formation is little understood and very significant (albedo, water vapor being the most significant GHG, horizontal and vertical heat transport, etc.) I was hoping someone smarter (e.g. the Doc) could interpret the article and pdf.

        • Don’t even bother with him jimc! Your article is spot on! You provided sources! He didn’t! That’s what debating is about!

          • It’s nice to know there are people like you jimic who at least provide sources to support their claims! That’s what smart people do! Nice job! We will win this!

        • jerry l krause says:

          Hi jimc & lewis,

          My first comment is jimcs comment is what is good about blogsites. We get alerted to breaking news that many of us may never have seen. Lewis, I can see nothing wrong with your comments relative to this breaking news. And jimc, I can see nothing wrong with your reply to Lewis. But then, Climatechange4realz states: Dont even bother with him, jimc!

          It seems him is Lewis but I really do not know. But what I know is that this comments seems to have ended a serious informed discussion relative to the new article to which you, jimc, directed to our attention. That is, until I attempt to redirect attention back to the news article you, jimc, brought to our (readers of this blogsite) attentions. This diversion of attention from a directed focus is what is bad about blogsites. It is difficult to maintain a continuity of a dialogue (a sharing of ideas which do not have to become a debate).

          I have other comments I could make, but I first wait for any response that you, jimc or Lewis, might have before doing so.

          Have a good day, Jerry

          • jimc says:

            For all I know, the article and paper could be worthless, but the context/subject made it seem significant. CC4R seems to have some other agenda.

          • Lewis says:

            Jerry,

            I went to the link to see what was the matter.
            What I found was what I stated. I was rather taken aback. Were they serious? Are these serious researchers? Perhaps so but I, only an interested layman, know better.

            Fortunately what we have here lends some home. Those with preconceived notions about the evil of man find a belief of theirs to be wrong and, since they did the research, are faced with the truth of their findings.

            Perhaps it will happen again and again and science can remove itself from the political realm and return. That, I suggest, is a whim of mine. Not likely considering the money spent on proving whatever.

            Now those in positions to do so, are attempting to use the force of law, threats of imprisonment, if you stray from the chosen path.

            Have a wonderful day.

  97. nigel says:

    “…demise…”

    The late, great, “skule-boy philosopher” Nigel Molesworth opined in the 1950s that the mountain goats of Anatolia (“weerever that is”) were the “tuffest, nobelist” creatures on earth.

    He suggested the “hole humman rase shuld jump in the see, and leve it up to them – and the cokroches.”

    “They coudn’t do a wors job!”

    • Mack says:

      Mind you…they’d probably use a spellcheck.

      • nigel says:

        “…spellcheck…”

        The idea in the humour is, partly, “…out of the mouths of babes…” even if (ESPECIALLY IF) conventional education (INDOCTRINATION) is being resisted.

        “Shades of the prison house begin to close
        upon the growing boy…”

        Wordsworth, “Intimations of Immortality.”

        Wordsworth spoke against the “savage torpor” of pre-formed ideas and cliches, which the circulation of written material was producing even in 1800 AD.

        The book in which my namesake first appears, was called “Down with Skule!” and was followed by “How to be Topp.”

        Bad spelling was part of the shtick of “pawky humor [or even ‘humour’]” of American wits such as ‘Artemus Ward’ and ‘Josh Billings.’

  98. dave says:

    The “global 2-meter temperature anomaly” published four times daily by R Maue has tended lower during May. A further drop in the UAH and RSS numbers seems to be on the cards.

  99. nigel says:

    “…spotless.”

    It had the TINIEST of beauty-spots. I wish I had a face that fair.

Leave a Reply