With the climatological peak in hurricane activity only 3 weeks away, the Atlantic has been fairly quiet so far, despite seasonal forecasts of a more active than normal season.
But recent forecast model runs have been consistently predicting that a low pressure wave in the tropical eastern Atlantic will become Tropical Storm Gaston in the next 5 days or so. Then, it looks like it could intensify into Major Hurricane Gaston, with 110 kt sustained winds by Sunday evening, August 28, which would make Gaston a strong Category 3 hurricane (graphic courtesy of Weatherbell.com):

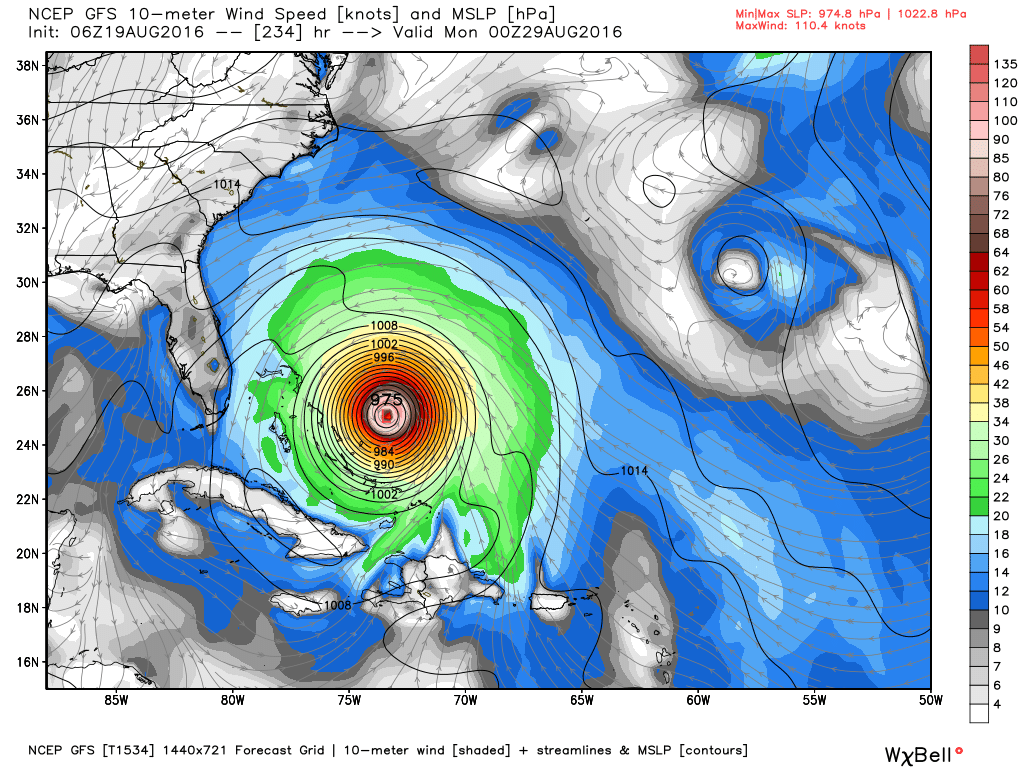
GFS model forecast of seal level pressure and wind speeds for Sunday evening, 28 August 2016. Graphic courtesy of Weatherbell.com.
Of course this is very prelimnary, being almost 10 days out, and the system is currently not even a tropical depression yet. The predicted path of (potential) Gaston is especially uncertain. Interests along the Atlantic and Gulf coasts should monitor this system in the coming days.
This should set the hearts of the warmers thump, thump, thumping.
How is that super, “pause restoring”, greenhouse-busting, warmest-slaying La Nina progressing?
Looks pretty puny to me.
This is your brain on CO2: {!@+??*}
Let me help you:
“In the Pacific Ocean, only two of eight international climate models monitored by the Bureau indicate La Nia is likely to develop during the austral spring, with two more indicating a possible late-forming event in summer. The remaining models suggest neutral or near-La Nia conditions. A La Nia WATCH remains in place, but if La Nia does develop it is likely be weak.”
http://www.bom.gov.au/climate/enso/
One of the symptoms is spelling difficulties.
I can spell puny.
How is that {numerous mischaracterizations} La Nina progressing?
The Nino3.4 region has been in La Nina territory since the 12th of July.
Not sure what your point is. NOAA overpredicted the El Nino so it is likely they will underpredict La Nina.
It will happen with or without their approval so the reason for the consistent misprediction is unclear.
http://www.cpc.ncep.noaa.gov/products/analysis_monitoring/enso_advisory/ensodisc.pdf
About 3/4ths of the models are underpredicting and La Nina is still 55-60% probable.
We’ll see.
October 6 is forty-six days away.
Four_Thousand_Days without a US landfall of a major hurricane! Coming this way! ☺
Will the nascent Gaston spoil this? The cherished hope of the warmers?
thumpthumpthump
Curious how the warmers want hurricanes and fires and floods and droughts; the worse the better. (I suppose they’ll find a way to blame earthquakes, tsunamis and volcanoes on CAGW)
All so they can say – I told you so. And thus justify instituting even more control over YOUR actions and words.
Latest run has it slightly west, over the islands, so reduced intensity (of course). If the model trends continue it might go across the Caribbean to the Gulf.
Current prevailing conditions on rout.
http://www.ssd.noaa.gov/goes/east/carb/avn-animated.gif
Don’t know if that helps, but it gives a general idea of prevailing winds.
This might also help, or, if not, it’s more interesting to watch that a clothes drier.
http://www.ssd.noaa.gov/goes/east/gmex/flash-avn.html
So now that a new system coming off Africa made it to tropical storm status and is now named Gaston, looks like this article needs to be updated . .! 🙂 🙂
I assume the area not far from the Caribbean is the area originally identified – Dr. Spencer, does Weatherbell still show this on track for a possible major hurricane? And what is the prediction for its track now this many days later?
GFS is notorious for inaccuracy this far out. If the euro comes on board, I will start to worry a bit more. The environment was to be less than favorable in the MDR for the coming weeks. I wonder what happened? MJO, Dust, Presssure?
Dang small phone keyboards. Sorry for typo’s….
Storms tend to come in groups during active periods…I’ve never heard a good explanation of why.
This makes some sense on the why part.
https://mobile.twitter.com/TropicalTidbits/status/766328441759203329
Gaston just needs to stay himself clear of da bayou. Mais, dem po Cajuns have had almost a year’s rain jus dis month.
Looking at some of the personal weather stations on wunderground.com, one in Morse, LA reported over 30 inches of rain in two days last week. My first thought was that this was an equipment failure, since most of the other stations in the immediate area were reporting barely half that amount. Since communities to the s. east reported 15 – 20 inches and considering how fast the flood waters hit the Mermentau River system, I am starting to believe that 30 + inches of rainfall may have in fact been correct.
https://www.youtube.com/watch?v=YWaRqB6Z6GM&feature=youtu.be
The descent jet stream from the north will increase condensation on the south and east.
http://www.weatherplaza.com/en-US/sat/?region=usa.ir
Weak solar wind. The jet stream will come down further south.
https://earth.nullschool.net/#current/wind/isobaric/250hPa/orthographic=-59.56,46.98,300
Again intensifying rain in Louisiana.
Fiona looks like a fizzle. It’s all up to Gaston thumpthumpthump.
Australia is also experiencing an unprecedented reduction in the frequency of tropical cyclones. See:
“Australian tropical cyclone activity lower than at any time over the past 5501,500 years”
http://www.nature.com/nature/journal/v505/n7485/full/nature12882.html
This is also predicted by climate models. See:
http://journals.ametsoc.org/doi/abs/10.1175/BAMS-89-3-347
Therefore we may be seeing another (but in this case positive) effect of GHG-related climate change.
The “Fiona fizzle” and a “Gaston fizzle” are welcomed!
(be still my beating heart !)
“This is also predicted by climate models.”
The paper cited is a simulation of what might happen with a DOUBLING of carbon dioxide levels.
There is no trend in the annual accumulated cyclone energy figures for the Southern Hemisphere over the last forty-five years:
http://models.weatherbell.com/tropical.php
I see now that the predictions are for the last twenty years of the TWENTY-SECOND CENTURY.
The Letter to Nature ends (my emphasis):
“Our results, although based on a LIMITED record, SUGGEST that this MAY BE occurring much earlier than expected.”
Wait a while. Presently we shall see alarmist #2 with a study that shows that IF his model simulations are correct, then we MAY see cyclone activity doubling before the end of the current millennium.
And, of course, the next time a violent cyclone hits Australia we will see the headline:
“Climate scientists say “Rejoice! Global warming was a false alarm!”
“…limited record…”
Two stalagmites, so far as I can see.
A fixed location on land seems a pretty haphazard way of sampling cyclones, which leave the sea in their full intensity on narrow fronts, i.e. they are compact.
Vide:
Cyclone Tracy
https://en.wikipedia.org/wiki/Cyclone_Tracy#/media/File:Cyclone_Tracy.jpg
To put the letter in Nature into the context of the FULL views of their authors, we can quote from another paper by the lead author (my emphasis):
“SOLAR FORCING largely drives decadal, interdecadal, and centennial cycles within the tropical cyclone record.”
In case you don’t get a good glimpse of the Wikipedia article on Cyclone Tracy before the photo loads:
Cyclone Tracy is not a good example for showing the typical size of tropical cyclones, but the smallest one on record until a smaller one was recorded in 2008. A diameter 3 times that of Tracy is a better example.
Even though, most tropical cyclones are compact – most large ones are much smaller than nor’easters.
Most cyclones off the North-West of Australia have an average radius of gales of 150 to 200 km. The picture of Tracy was nice because it showed the coastline well.
Some perspective.
https://upload.wikimedia.org/wikipedia/commons/4/4e/Typhoonsizes.jpg
Ah, Yes, here it is:
http://cel.webofknowledge.com/InboundService.do?SID=Y2SYVrIoXFCU2STdMOo&product=CEL&UT=WOS%3A000330321000038&SrcApp=PARTNER_APP&action=search&Init=Yes&SrcAuth=NaturePG-AMR&customersID=NaturePG-AMR&Func=Frame&viewType=summary&IsProductCode=Yes&mode=CitingArticles
An extremely interesting, recent (Mar 16, 2016), tidbit (although I have only read the abstract, for the moment). Salvatore might be interested! We must thank dr no for leading us to it; he intended. all along, that we discover it for ourselves.
If solar forcing is a main driver, one can not in a simple-minded way ‘work back’ from raw indices like ACE, and say ‘the mark of global warming is obvious’.
We will see in this case the jet stream in the south.
https://earth.nullschool.net/#current/wind/isobaric/250hPa/orthographic=-222.23,-69.16,300
And the polar vortex.
https://earth.nullschool.net/#current/wind/isobaric/10hPa/orthographic=-222.23,-69.16,300
And the temperature of 3500 m.
https://earth.nullschool.net/#current/wind/isobaric/700hPa/overlay=temp/orthographic=-222.23,-69.16,300
Climate change has hit Texas: a rainy season of ten days with totals of 6 to over 12 inches of accumulation, unprecedented for August. Precipitation records will be set across the state, low temperature records as well. A wet, cool August for Texas. Daemon CO2? XXX
With more predicted for the rest of the week. Nothing like this in state climate records, not for August, I don’t believe.
“.. with totals of 6 to over 12 inches of accumulation..”
Why do you still persist with ancient imperial units?
Or is the metric system another international conspiratorial plot to enslave the U.S. ?
BTW
“Due to climate change, extreme downpours and unpredictable rains are on the rise. According to a Climate Central analysis, McAllen, TX leads the nation in the percentage increase of heavy downpours. Since 1950 the city has experienced a 700-percent increase in heavy downpours. Houston, meanwhile has seen a 167-percent rise in heavy downpours.”
http://www.climaterealityproject.org/blog/what-does-climate-change-mean-texas
“700% increase in heavy downpours”
McAllen averages about 23 inches rain per year. How many heavy downpours does that work out to?
I suggest that you douche your brains with a pressure sprayer. Stick the nozzle in your ear and flush that daemon CO2 out the other.
You do understand that the study referred to heavy downpours, not to total rainfall ?
Of course you do. You are an expert in deliberate ignorance.
At least try and lift the standard of your barbs.
“I suggest that you douche your brains with a pressure sprayer. ” is what I expect from a recalcitrant teenager. On second thoughts, that may be the explanation.
How much rain in a heavy downpour? Two inches, average? 14 X 2 = 28 inches (700% increase, assuming two heavy downpours in 1950). But for five months of the year, precipitation averages less than two inches. So one rain incident per month… a heavy (or not so heavy) downpour. Looks like in McAllen, Texas, when it rains, it heavy downpours.
If you don’t have a pressure sprayer, you can rent one.
Correction: for seven months of the year, average is less than two inches. That’s under five centimeters.
It’s a matter of the brain not being eat up with CO2. The claim is a “700 % increase in heavy downpours”, when precipitation averages 22.4 inches a year. Can anyone with one particle of intelligence really believe such a claim?
Five years ago, in 2011, this state experienced record drought. The foaming global warmers blamed it on CO2.
This year, record floods. The foaming warmers screech about CO2.
Here’s the truth: Texas alternates between drought and flood, with extended drought about twice a decade and floods between the droughts. It is due to the peculiar geography of Texas, not CO2, and it has been going on for thousands of years, if not millions. Blocking high pressure one summer, tropical (or sub-tropical, as just now) depressions the next.
In 1954, remnants of hurricane Alice dumped up to 21 inches overnight on the watershed of the Pecos River in west Texas. The next day the river crested 90 feet above normal.
NINETY FEET! The Pecos flows through a canyon crossed by US Highway 90. A modern steel truss/concrete pier highway bridge, which spanned the canyon at 65 feet above normal water level, was swept away: steel truss first, concrete piers next. Had that happened today, it would be accompanied by a chorus of screeching. Worldwide screeching, from as far away as Oz.
The use of 1950 as the start is a red flag and undercuts the credibility of the study and of the author’s integrity. The 1950s were notorious for few heavy rainstorms and were much below the average experienced in previous decades. Choosing 1950 as the start for the study period is a prime example of cherry picking.
Also, remember this, the chance of winning the lottery is a million to one, but the chance of someone winning the lottery is a 100%. The chance that someplace some year will have an noteworthy increase or decrease in a weather phenomenon does approach a 100%,
doctor no
I think mpainter is on the correct side of this debate. I think your Climate Central would be total propaganda to achieve an agenda. I found this article from the Texas State Climatologist.
Quote from Article: “Both temperature and precipitation exhibit long-term variability on multi-year to multidecade timescales. The general tendency is for slightly increasing temperatures, but precipitation shows no noticeable long-term trend. Annual precipitation seems to be
related to a strong western United States multi-decade oscillation, possibly caused by sea surface temperature variations in the North Pacific.”
Article:
http://climatexas.tamu.edu/files/osc_pubs/climate_of_texas.pdf
If you want to do some research on the topic look at the floods record in this document. There have been some really severe floods in Texas in the past (way past). That may be why Stevie Ray Vaughan wrote the song about couldn’t stand the weather in Texas (his home State).
https://www.youtube.com/watch?v=nO23B5C_Mcw
Last year, May 2015 broke the record for the wettest month, set in only June 2004.
https://weather.com/forecast/regional/news/plains-rain-flood-threat-wettest-may-ranking
And now mpainter points to unprecedented rainfall in August.
So why quibble with the evidence that suggests Texas is getting wetter?
As dry as Texas is generally, I would think more moisture would be welcomed. Of course, for the alarmists, who have decided no change is the only acceptable course for mother Nature to take, drought would be preferred.
More water, more atmospheric CO2, more plants, more food, more beef. What’s not to like.
And obviously, if you get more rain, some of it will be in heavier downpours. I suggest not building in floodplains, but the alarmists believe we should control the downpours, not accept them and get out of the way.
Hi Lewis. If Texas should be so unlucky as to be hit by a hurricane this year, or a tropical depression, we could see annual precipitation records broken across half the state. Great rejoicing by the eco-freaks thumpthumpthump.
Next, with the coming La Nina, 2017 will bring a state-wide prolonged drought and scorching 100 + F temperatures. The eco-freaks will be dancing in the streets thumpthumpthump.
What are we to conclude about those who rejoice at the suffering of victims of extreme weather events?
doctor no
YOU: “So why quibble with the evidence that suggests Texas is getting wetter?”
Duh, because those records are weather not long term climate. You can find a wettest, hottest, driest, etc region somewhere on the globe. Not real significant. In 2012 Texas had a severe drought, now they have lots of rain. Why do you suspect a 0.8 C increase in global temperatures in 100 years is responsible for these weather patterns?
Most likely both are the result of persistent atmospheric blocks. Depending upon where the blocking high develops you could have excessive rain in one location and hot dry weather in another.
If you looked at the Russian Heat Wave a couple years back, Moscow had record high and dry conditions but it was much cooler East of Moscow. The blocks are usually the responsible party and not a 0.8 C temperature change.
” mtre (“measure”), a basic unit of length, which they defined as equal to one ten-millionth of the distance between the North Pole and the Equator ”
Even if it was correct, it is boring.
A “foot” is many times and ways more interesting.
“plot” —- How Much Land Does a Man Need?
http://www.online-literature.com/tolstoy/2738/
“His servant picked up the spade and dug a grave long enough for
Pahom to lie in, and buried him in it. Six feet from his head to
his heels was all he needed.”
1828.8 mm from his head to his heels was all he needed.
Ruins the story.
That’s a response to ‘doc no’ at 10:45 AM
John,
Thanks for the reply.
Did you know (Wikipedia) that:
“According to the CIA Factbook, the United States is one of three nations (the others being Liberia and Burma) that have not adopted the metric system as their official system of weights and measures” ?
“The customary system was championed by the U.S.-based International Institute for Preserving and Perfecting Weights and Measures in the late 19th century. Advocates of the customary system saw the French Revolutionary, or metric, system as atheistic.”
Dr. No,
There are many reasons to adopt the metric system, but because everyone else has is not one of them.
If you wanted to argue that worldwide standardization would be of economic benefit, then I would agree. It is aggravating and expensive for those who actually incur costs because of the dual standards. As important as this is to you, please tell us, how much does it cost you? Or, as I suspect, are you arguing this for the same reason you beat the AGW drum – the majority consensus should rule without questioners.
I suggest your opinion will finally rule as the progressives (AKA authoritarians) are working hard to eliminate the 1st amendment. Dissent is going to be puneished. – Severely, I expect.
Lewis,
An interesting response. But tell me, how does progress ever occur if the “majority consensus” is not allowed to prevail. There has rarely ever been unanimity surrounding some of civilisation’s greatest steps forward.
i.e. if we must always pander to the vociferous minority, nothing ever gets done.
“Majority consensus”
###
Poor Oz.
What conclusions can we draw of someone who attacks the US because of our system of measurement? What sort of mentally sparks this sort of vociferation?
“Majority consensus”
###
Not in the US, not yet, thank GOD.
Poor Oz.
The U. S. Geological Survey (Interior Department) began making maps using the metric units in a “provisional” series. Some old white guys in Congress objected, and they control the funds. Maybe those folks have died and the USGS should try again.
Anyway, much of the USA is metric without anyone saying so. Do a web search for “metric tools” or note the sales of other things (guns; incl. US military). Look at dashboard speedometers in cars sold in the USA.
The funny thing is, one still reads frequent usage of the classical units in English posts. It may take another 20 years of age-related deaths before these fade entirely. I’ll be checking out before then.
I have used both metric and the standard us system. There are in this country several hundred tons of geologic reports, maps, studies, etc that employ the us standards. All geologists understand this standard. It works quite well: feet, inches, miles.
It’s a fool who wants to switch this to the metric system.
Just look at Roy’s next post where he provides graphs of surface radiation measurements.
The units are Watts per square meter.
Imagine if we had to change joules to imperial units.
What would you prefer?
The foot-pound force ?
the British thermal unit (Btu) ?
the horsepower-hour ?
or the gasoline gallon equivalent ?
I like horse-power hour.
I think Watts per meter squared would be replaced by:
horse-power hour per second per square furlong !!
John
,”official” means “legal for trade” nothing more. In the United Kingdom the use of the Metric System for roads and traffic regulations is actually FORBIDDEN by law.
doctor no
The temperature of McAllen Texas from your source also seems suspect. The claim is that the area experienced a 3.3 F increase in temp since 1970. First the 1970’s were a cool period in the US. So that makes the point rather a tainted view to use a cool time as your starting point. What was it in the 1950’s?
This study will show how corrupt the people of Climate Central are. They could look at the long term temperature of Southern Texas and note that the 1970’s were fairly cool and then use this as the starting point to convince the gullible (as you seem to be) to swallow the junk science they peddle to a lazy populace. People like you that just look at things that support your belief system and ignore all data that goes against it.
http://www.texasclimate.org/Portals/6/Books/SouthTX/Chapter_2.pdf
Look at Figure 6 of the linked article and it will show you how these groups work to manipulate the mind’s of people who do not research on their own but just trust the “Authority” or those who speak as if they are honest.
Some facts: McAllen is located in the southern tip of Texas, known as the “valley”. It is the center of Texas citrus horticulture. Ruby Red grapefruit originates from here. Oranges, also, an especially sweet, pale variety is grown here.
These citrus orchards were established in the 1930’s, when it was warmer. During the cooling episode of circa 1945-1980, the citrus trees were frequently damaged by frost.
The south Texas citrus industry has benefited from warming. Frost damage no longer occurs as climate is now the same as in the 1930’s. Don’t try your climate bugaboo on these folks. The growers were pushed to the wall by the frost damage of the mid twentieth century.
Lows over Canada. It will be a lot of rain in the USA.
http://www.weatherplaza.com/en-US/sat/?region=canada.ir
Just an update on Gaston’s probable path four days past your posting of this piece, Roy: now seems quite unlikely to make landfall anywhere in the U.S. See http://www.boatus.com/hurricanes/tracking.asp?storm=gaston&year=2016#.V7zM7JgrKHs.
There’s no joy in Warmerville, mighty Gaston has struck out.
What happens at sea, stays at sea – or it used to. All that the land people knew was that a fishing port was grieving.
All as expected.
No joy for deniers here.
Gaston is not the storm that Roy wrote about. It is a different storm that formed in the meantime. The forecast storm has not formed yet, let alone been named.
yup. Making 10-day forecasts is a fool’s errand. 🙂
Remarkably, after 5 days the forecast for Invest 99L (the storm formerly expected to be known as Gaston) does not seem to have changed much. Except that now it seems less likely to turn into a major hurricane.
That is interesting! Now 99L is given a 80% probability of turning into a tropical storm.
Meanwhile, for the last couple of days, Tropical Storm Gatson has been expected to become Hurricane Gatson in a few hours, but now tonight, the forecast is for it to remain a Tropical Storm until Saturday.
The general climate and Atlantic Ocean conditions are similar to those before the 1962-63 cold* winter in England. Three years ago the UK Electricity grid had 16% spare capacity. Now, after a mad “green” dash it is 0%, or 6% “with emergency measures”.
I have got plenty of wood, just in case. If the UK “goes black”, the disaster will make a full hurricane strike on Miami look like nothing at all in the death stakes.
*Not only cold but often too still to turn a windmill.
This is quite a noisy series, but the most recent week shows cooling:
http://www.tropicaltidbits.com/analysis/ocean/nino34.png
The Nino 3.4 chart is a propos the possibility of a La Nina, of course, not the possibility of a cold winter in England!
A bit desperate aren’t you?
It is still warmer than a month ago.
Any La Nina this year will be punyyes..PUNY.
It will be a harsh winter in the northern hemisphere.
http://www.tropicaltidbits.com/analysis/ocean/nino34.png
“…a harsh winter…”
I hope not. But I have a plan B, and a plan C, and a…
The course of the jet stream determines the lack of hurricanes in the Atlantic.
https://earth.nullschool.net/#current/wind/isobaric/250hPa/orthographic=-30.37,39.70,455
Gaston Long Floater – Water Vapor Imagery Loop
http://www.ssd.noaa.gov/PS/TROP/floaters/07L/flash-wv-long.html
In the upper left corner of the visible jet stream.
Sorry.
Here visible bend of the jet stream and storm track.
http://oi65.tinypic.com/25uthm0.jpg
The end of the 10+ Major hurricane hiatus is in sight.
Joe Bastardi is calling it and those that watch him know he is pretty darn sharp when it comes to hurricane forecasting. He’s been worried about this particular wave since it came off the coast of Africa and now is calling for it to become a CAT II, cross Florida and become a major in the Gulf. Texas and Louisiana are the two states most likely to see the landfall of this storm. A very Katrina like track, Check out the daily updates.
http://www.weatherbell.com/
I asume we are looking at 99L.
A confused mess so far:
http://www.tropicaltidbits.com/
Unlikely to make a Hurricane for FLORIDA; it is not “getting its act together” as regards compact vorticity. It might develop further in the Gulf of Mexico.
No longer “a very Katrina like track,” although it is now in the Gulf. It is forecast to strengthen to a tropical storm, cross Florida from West to East at the “big bend,” and then go into the Atlantic.
La Nina becomes fixed. SOI high.
https://www.longpaddock.qld.gov.au/seasonalclimateoutlook/southernoscillationindex/30daysoivalues/
Circulation in the Southeast indicates rain in Texas and Louisiana.
http://www.ssd.noaa.gov/goes/east/eaus/flash-wv.html
Louisiana in danger.
http://en.blitzortung.org/live_lightning_maps.php?map=30
That is an interesting website!
As to the possible Hurricane, it seems to be 50:50 whether 99L develops over the Bahamas and hits Florida. Assuming that does happen, it seems to be 50:50 whether it goes North and dies or goes North-West over the Gulf and intensifies. So a 1 in 4 chance of Louisiana being in danger.
http://www.accuweather.com/en/us/baton-rouge-la/70806/weather-radar/329147
Tropical Atlantic – Water Vapor Loop
http://www.ssd.noaa.gov/goes/east/tatl/flash-wv.html
Tropical rains in Florida.
Gaston (the ostensible subject of this thread) took a track out into the Atlantic, and declined into a tropical storm. It may strengthen again, but the chance of it striking North America is zero.
Invest99L is a system which may develop – if it moves across Florida and into the Gulf of Mexico where the water is very warm. Of course, at this time of the year there will be a succession of such “possibles” until the sea starts to cool.
Low over Florida will bring back a lot of rain in the south of the USA.
“…a lot of rain…”
Even when 99L is in the Gulf.
Still, “a big hurricane” is not on the immediate horizon.
Atlantic and Eastern Pacific SST Color Loop
http://www.ssd.noaa.gov/PS/TROP/H5/sst-atl-loop.html
There was discussion here, a couple of months ago, about whether this Atlantic hurricane season was likely to be affected by the transition from El Nino conditions. I thought the change was coming too late, and the season would be normal, or even quiet. That has not proved wrong – so far.
The Global 2-Meter Anomaly of Maue rose in the middle of August, although it has fallen back recently. A modest rise in the UAH/RSS August figures seems reasonable.
In fact, the animations show cloudiness, not water vapor.
http://www.ssd.noaa.gov/goes/comp/nhem/wv-animated.gif
Invest 99L is now a Tropical Depression in the Gulf above Cuba. It is forecast to strengthen and track BACK across Northern Florida into the Atlantic. Still no hurricane alerts.
http://www.tropicaltidbits.com/
https://earth.nullschool.net/#2016/09/01/1800Z/wind/isobaric/850hPa/overlay=total_cloud_water/orthographic=-88.02,25.37,2048
Dave, look here.
http://www.ssd.noaa.gov/goes/west/tpac/flash-wv.html