
 Home/Blog
Weather balloon measurements have been made twice daily at Desert Rock, Nevada for many years. In 1998, a surface radiation (SURFRAD) measurement facility was also installed there, which allows new kinds of analysis of how the radiation budget is affected by atmospheric profiles of temperature and humidity.
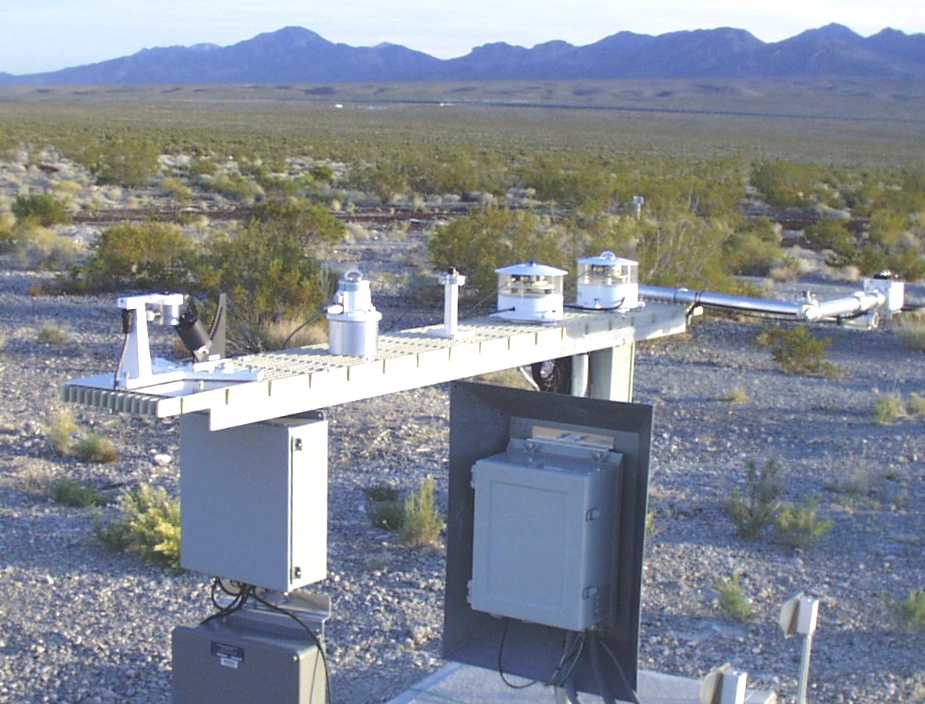
Fig. 1. One portion of the SURFRAD instrumentation network at Desert Rock, NV.
The location is arid, minimizing the influence of clouds and precipitation, making it an ideal site for analysis of downwelling infrared (IR) sky radiation and how it influences surface temperature.
A example of the main radiation components measured every 3 minutes at Desert Rock is shown in the following graph, for July 1, 1998. I have also annotated the approximate times that the radiosonde ascents are made:
Fig. 2. 3-minute radiation budget data at Desert Rock during July 1, 1998.
There are many more measurements than this in the Desert Rock data archive, such as temperature, wind, relative humidity, barometric pressure, ultraviolet radiation, etc.
Of particular interest is the question: How does the downwelling IR intensity depend on the vertical profiles of temperature and humidity? Obviously, IR intensity depends upon temperature….but there has to be an atmospheric emitter of IR, and that is primarily water vapor.
We can examine the issue using nighttime data, so that we don’t have to deal with the huge fluxes of solar energy during the daytime. If I average the SURFRAD fluxes of downwelling IR between 00 UTC and 12Z every day, and compare them the to average of the 00 and 12 UTC radiosonde profiles in ~100 mb thick atmospheric layers, I can do correlations to see how the nighttime “sky radiation” variability is related to atmospheric temperature and humidity variability.
The results are very interesting:
Fig. 3. Correlation coefficients between daily variations of nighttime average downwelling IR and atmospheric temperature and humidity in different layers (vertical axis is pressure altitude, mb), during July 1998 at Desert Rock, NV. Several days that experienced more than scattered clouds and some precipitation were omitted.
The dominant influence of humidity variations on downwelling IR is clearly seen; the greater the humidity, the lower in the atmosphere the downwelling IR radiation measured at the surface originates, and thus the warmer the emitting temperatures and greater the IR intensity.
In contrast, the correlations of downwelling IR variations with temperature variations themselves are rather poor, probably because the temperature variations are so small. Clearly humidity variations dominate the downwelling IR signal, moving the effective radiating altitude up and down as humidity decreases and increases, respectively.
Now, the downwelling IR flux (the dashed line in Fig. 2, above) is what a few of our friends claim does not exist. They claim that there is no “greenhouse effect”, and that the sky (which is almost always colder than the surface) cannot emit IR in the direction of the surface because that would violate the 2nd Law of Thermodynamics.

But, of course, it is the net IR (the sum of upwelling from the warmer surface plus the downwelling from the cooler sky) which must flow from higher to lower temperature, which it does.
So, what, in their minds, is actually being “measured” by these instruments for downwelling IR? Whatever it is, Fig. 3 clearly shows it’s closely related to the humidity of the atmosphere (correlations up to 0.88 for mid-tropospheric humidity), but not very well related to temperature variations in the atmosphere. Barring some sort of conspiracy between all of the atmospheric radiation experts in the world (as well as most of us “skeptics”) it is difficult to imagine how such a “fictitious” measurement, so sensitive to atmospheric humidity, could be constructed by mistake.
But what influence do these variations have on nighttime cooling of surface temperatures? For that is how the “greenhouse effect” is usually expressed: the increase in surface temperatures caused by greenhouse gases compared to if those gases did not exist. It is not possible to answer that question in an absolute sense with measurements because we do not have a full-depth atmosphere with no greenhouse gases we can experiment on. Instead, we can only examine how surface temperature changes by relatively small amounts when the amount of greenhouse gas changes by relatively small amounts.
This can be seen in the next plot, where I have compared the change in surface temperature from 00 UTC (late afternoon) to 12 UTC (early the following morning), to the average downwelling IR during the night:
Fig. 4. Nighttime cooling of surface temperatures at Desert Rock during July, 1998 becomes less as downwelling IR intensity increases.
While the relationship is noisy because there are many factors governing nighttime surface cooling (wind speed, storage of solar energy in the soil during the previous day(s), etc.), we still see that the surface temperature drop during the night becomes less as the downwelling IR increases. This follows our daily weather experience that nighttime temperatures cool off more when humidity is lower, all other weather variables being roughly equal.
While the above analysis is preliminary, and there are many more relationships that could be examined (with many more years of data), the results clearly show that increasing greenhouse gas concentration in the atmosphere (in this case, water vapor) increases downwelling IR radiation from the sky, and increases surface temperature. And, while I have used nighttime data to isolate the effect from the complications introduced with daytime solar heating, it should be remembered that infrared effects on surface temperature are occurring 24 hours a day.
Downwelling IR from the sky continuously maintains surface temperatures well above what they would be without greenhouse gases (while at the same time cooling the upper atmosphere well below what it would be without those gases). Surface temperature is a function of energy gain (from the sun) and energy loss (which is reduced by greenhouse gases).
It’s not magic..it’s just physics.
NOTE TO COMMENTERS: I intend to delete any comments which include personal insults.
NOTE TO READERS OF COMMENTS: Some commenters here throw around technical terms and make grand assertions and detailed arguments which I consider fallacious. I do not have time to counter them all every time they arise, although I have addressed virtually all of them in other posts over the years.


