UAH Global Temperature Update for July, 2016: +0.39 deg. C

August 1st, 2016 by Roy W. Spencer, Ph. D.

July Temperature Recovers Slightly from Previous Free-Fall

NOTE: This is the sixteenth monthly update with our new Version 6.0 dataset. Differences versus the old Version 5.6 dataset are discussed here. Note we are now at “beta5” for Version 6, and the paper describing the methodology is still in peer review.

The Version 6.0 global average lower tropospheric temperature (LT) anomaly for July 2016 is +0.39 deg. C, up a little from the June, 2016 value +0.34 deg. C (click for full size version):

UAH_LT_1979_thru_July_2016_v6

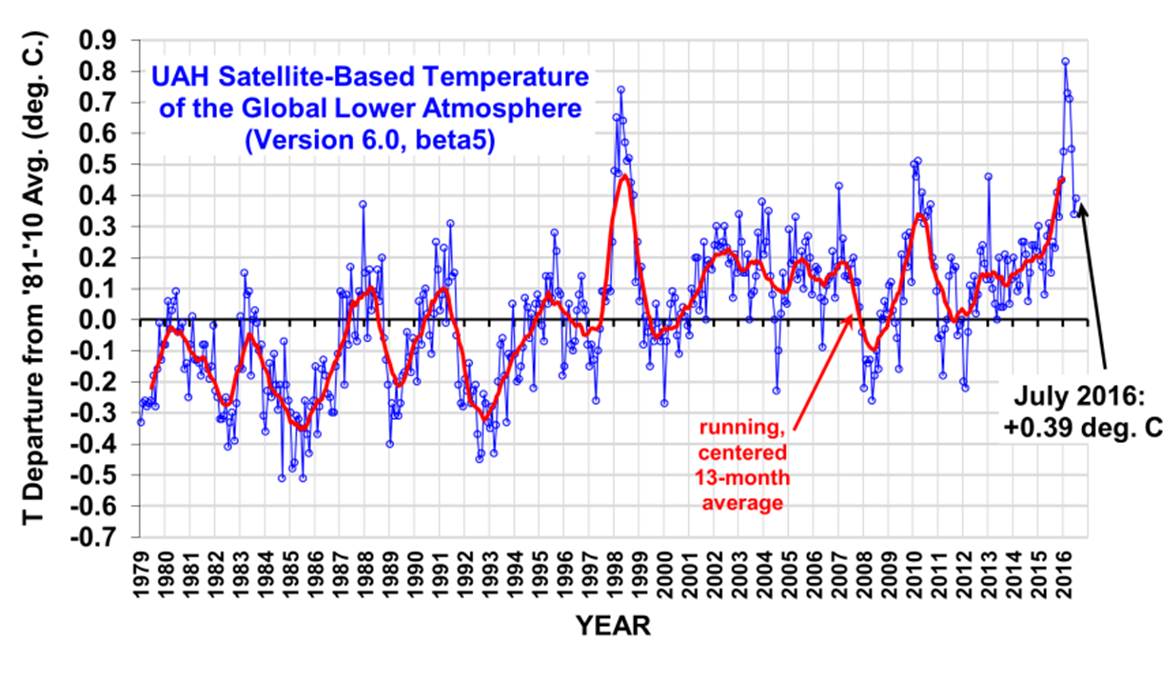
The global, hemispheric, and tropical LT anomalies from the 30-year (1981-2010) average for the last 19 months are:

YEAR MO GLOBE NHEM. SHEM. TROPICS
2015 01 +0.30 +0.44 +0.15 +0.13
2015 02 +0.19 +0.34 +0.04 -0.07
2015 03 +0.18 +0.28 +0.07 +0.04
2015 04 +0.09 +0.19 -0.01 +0.08
2015 05 +0.27 +0.34 +0.20 +0.27
2015 06 +0.31 +0.38 +0.25 +0.46
2015 07 +0.16 +0.29 +0.03 +0.48
2015 08 +0.25 +0.20 +0.30 +0.53
2015 09 +0.23 +0.30 +0.16 +0.55
2015 10 +0.41 +0.63 +0.20 +0.53
2015 11 +0.33 +0.44 +0.22 +0.52
2015 12 +0.45 +0.53 +0.37 +0.61
2016 01 +0.54 +0.69 +0.39 +0.84
2016 02 +0.83 +1.17 +0.50 +0.99
2016 03 +0.73 +0.94 +0.52 +1.09
2016 04 +0.71 +0.85 +0.58 +0.94
2016 05 +0.55 +0.65 +0.44 +0.72
2016 06 +0.34 +0.51 +0.17 +0.38
2016 07 +0.39 +0.48 +0.30 +0.48

The July pause in cooling as La Nina approaches also happened during the 1997-98 El Nino. I’ve examined a daily time series of satellite data for 2016, and this behavior is due to intra-monthly variations in temperature, probably mostly driven by episodic deep convective activity in the tropics. Depending upon how the calendar months line up with the resulting peaks and troughs in temperature, the result is a rather irregular monthly temperature time series. It can be viewed not so much as a variation in radiative cooling to outer space, but a variation in convective heating of the troposphere.

To see how we are now progressing toward a record warm year in the satellite data, the following chart shows the average rate of cooling for the rest of 2016 that would be required to tie 1998 as warmest year in the 38-year satellite record:
UAH-v6-LT-with-2016-projection

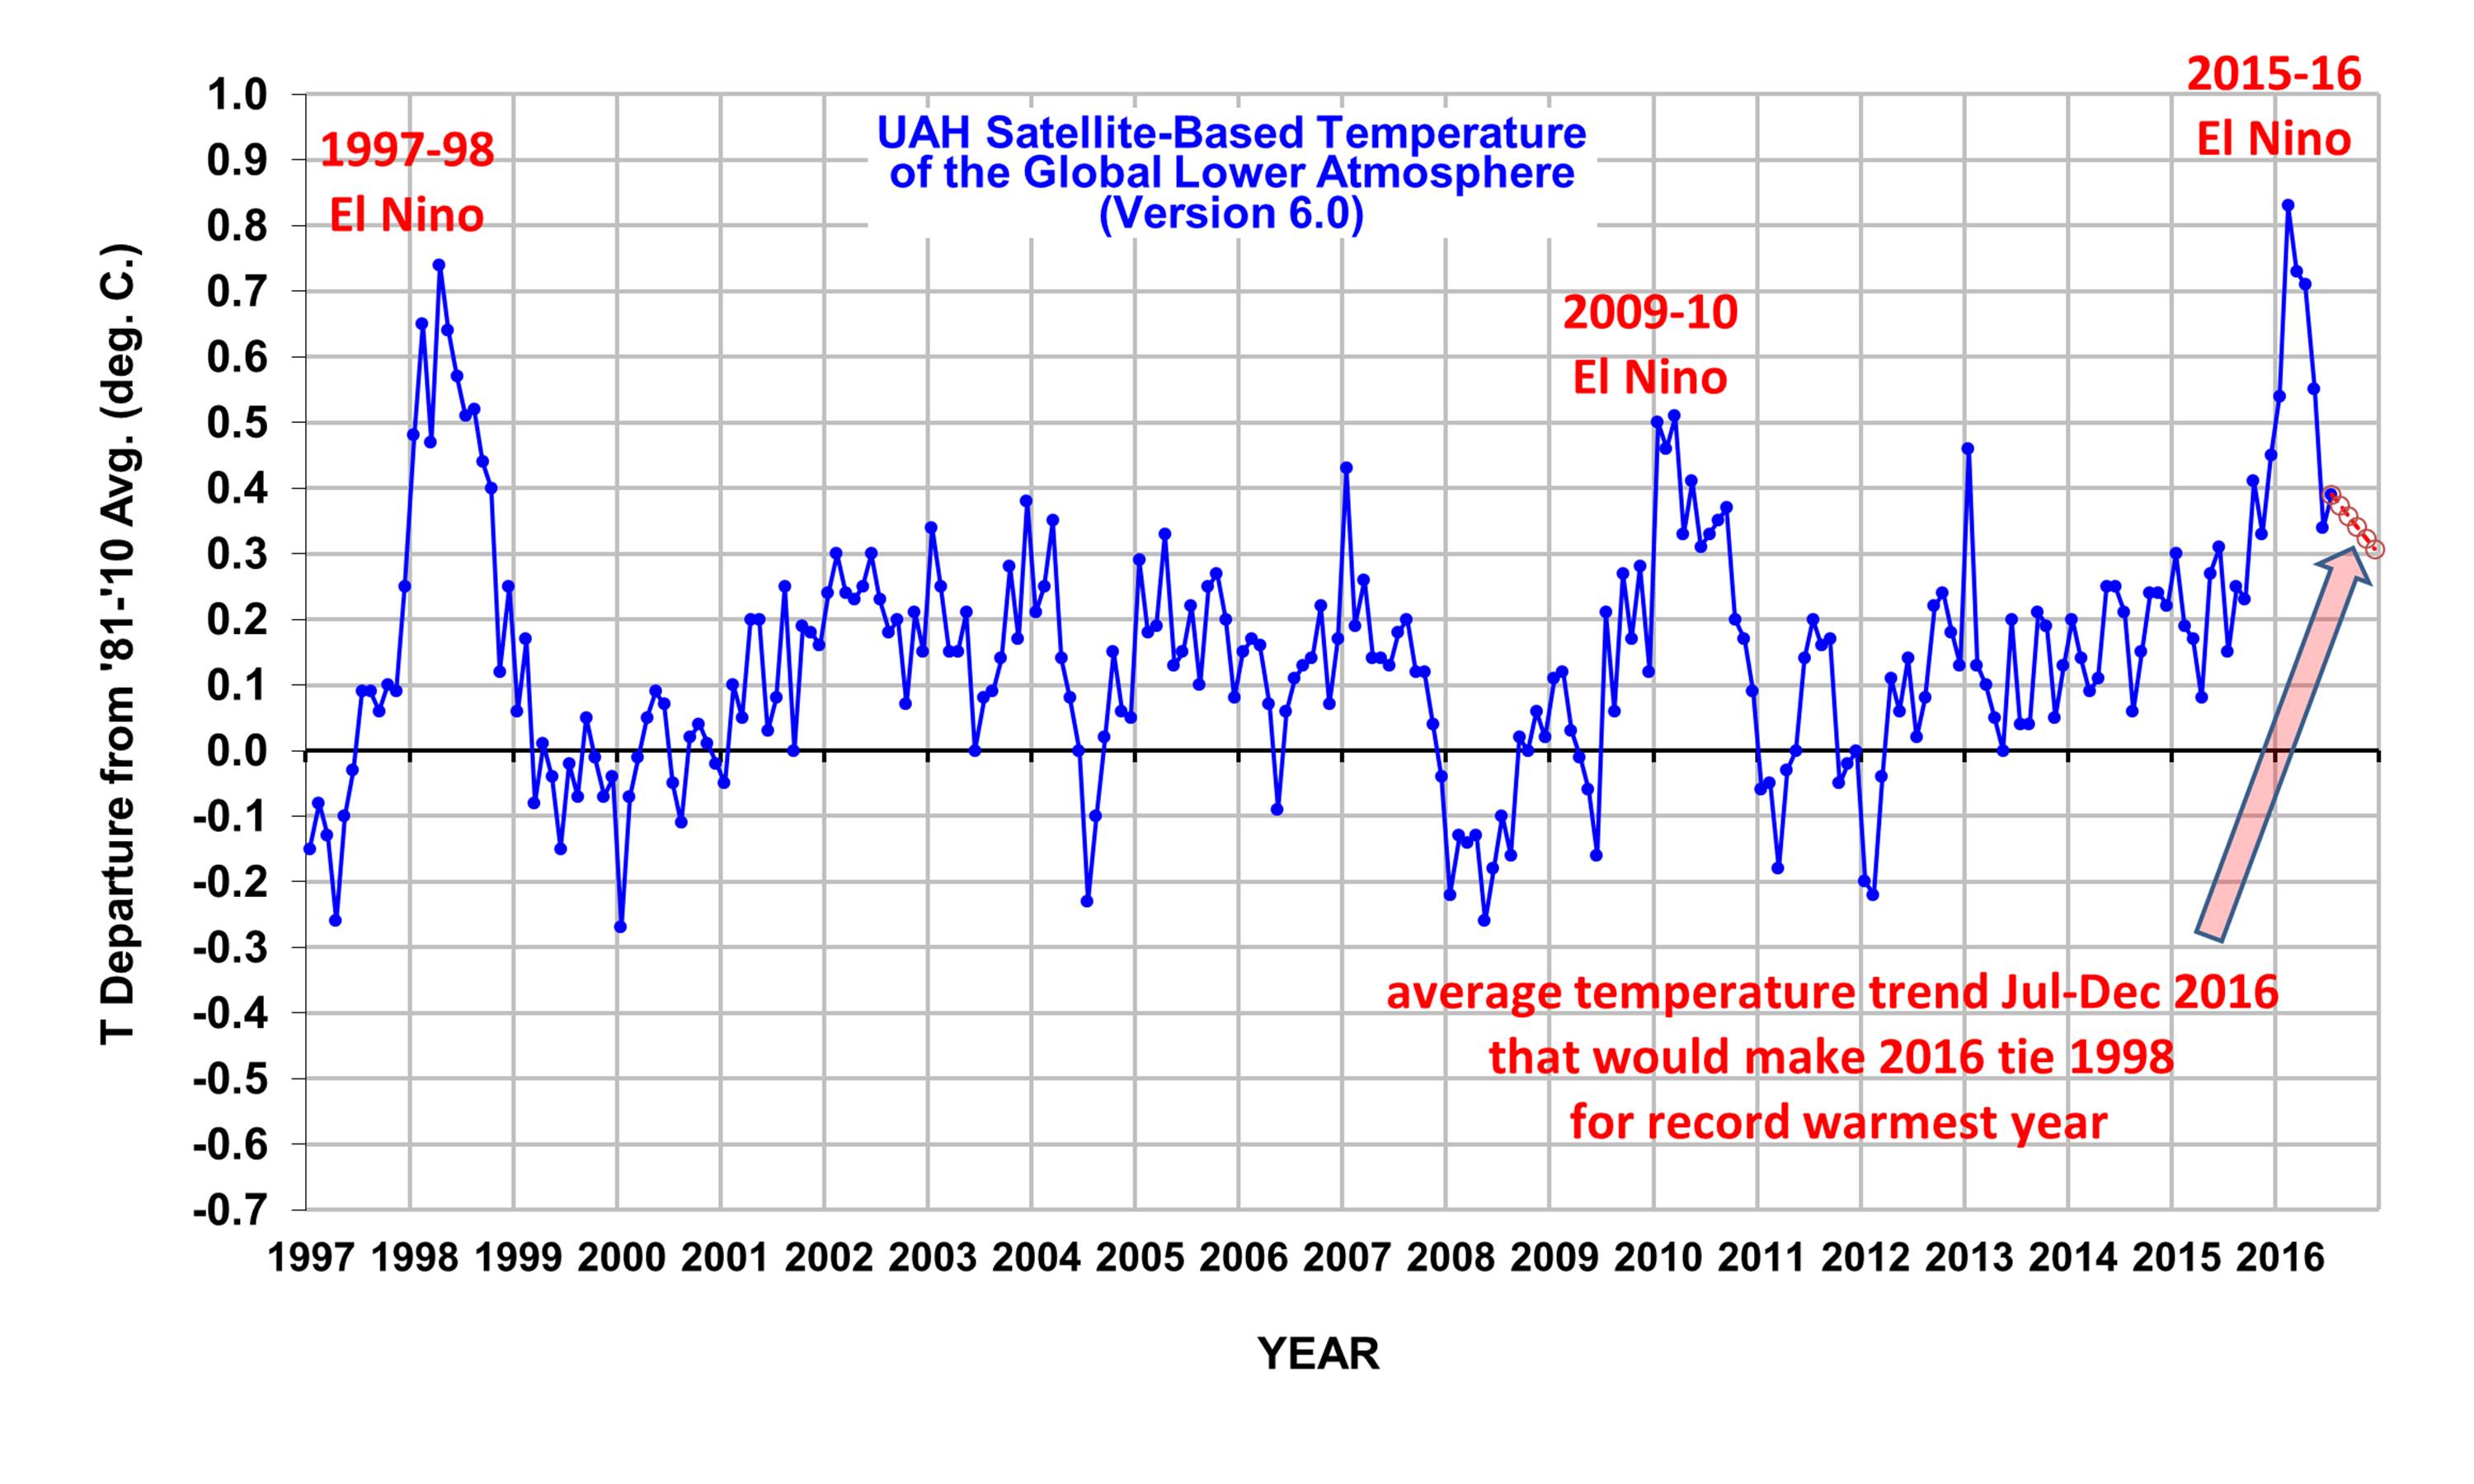
Given the behavior of previous El Ninos as they transitioned to La Nina, at this point I would say that it is unlikely that the temperatures will remain above that projection for the rest of the year, and so it is unlikely that 2016 will be a record warm year in the satellite data. Only time will tell.

The “official” UAH global image for July, 2016 should be available in the next several days here.

The new Version 6 files (use the ones labeled “beta5”) should be updated soon, and are located here:

Lower Troposphere: http://vortex.nsstc.uah.edu/data/msu/v6.0beta/tlt/uahncdc_lt_6.0beta5.txt
Mid-Troposphere: http://vortex.nsstc.uah.edu/data/msu/v6.0beta/tmt/uahncdc_mt_6.0beta5.txt
Tropopause: http://vortex.nsstc.uah.edu/data/msu/v6.0beta/ttp/uahncdc_tp_6.0beta5.txt
Lower Stratosphere: http://vortex.nsstc.uah.edu/data/msu/v6.0beta/tls/uahncdc_ls_6.0beta5.txt


746 Responses to “UAH Global Temperature Update for July, 2016: +0.39 deg. C”

Toggle Trackbacks

  1. ren says:

    The more precipitation, the lower the temperature in the upper troposphere. The lower the temperature, the more rainfall.
    http://sol.spacenvironment.net/nairas/Dose_Rates.html

    • No…it’s well established that convective heating warms the middle and upper troposphere. Increases in deep convective activity cause a temperature rise (and, typically, a temperature drop at the surface due to the increased evaporation required to support increased convection).

      • ren says:

        Why do clouds form and why does it rain?
        Air, even “clear air,” contains water molecules. Clouds exist in the atmosphere because of rising air. As air rises and cools the water in it can “condense out”, forming clouds. Since clouds drift over the landscape, they are one of the ways that water moves geographically around the globe in the water cycle. A common myth is that clouds form because cooler air can hold less water than warmer airbut this is not true.

        As Alistair Fraser explains in his Web page “Bad Meteorology”, “What appears to be cloud-free air (virtually) always contains sub microscopic drops, but as evaporation exceeds condensation, the drops do not survive long after an initial chance clumping of molecules. As air is cooled, the evaporation rate decreases more rapidly than does the condensation rate with the result that there comes a temperature (the dew point temperature) where the evaporation is less than the condensation and a droplet can grow into a cloud drop. When the temperature drops below the dew-point temperature, there is a net condensation and a cloud forms,” (accessed on Sep. 12, 2003).
        http://water.usgs.gov/edu/watercyclecondensation.html

        • ren, your factoids (while correct) have nothing to do with what we are discussing…it’s called “convective heating” and “latent heat release” for a reason. It’s why hurricanes have warm cores. It’s where the energy absorbed to cause the phase change from liquid water to water vapor gets released again, during condensation in clouds.

          Deep moist convection heats the troposphere, and an increase in convection leads to a tropospheric temperature rise. This has been established obervationally and explained theoretically. End of story.

        • “A common myth is that clouds form because cooler air can hold less water than warmer air but this is not true.”

          This is unlikely a myth, but certainly a deliberate attempt to confuse.
          Properly: ‘clouds form because cooler air can hold less water as water vapor, than warmer air’! Clouds are a visible indication of airborne water condensate, a colloid. This colloid phase has released some but not all of the latent heat of evaporation, 2400 J/gm! The amount of water colloid that can remain airborne is highly dependent on air-mass flow rate, but rarely exceeds 5% of the total air-mass involved without violent turbulence, where the percentage of water can exceed 50% by mass!

      • Bob Roberts says:

        Two questions on which I would like opinions from anyone who cares to reply:

        1) Does it make sense that the more evaporation we have, along with convection taking that evaporated water higher in the atmosphere, past much of the CO2 that might otherwise delay the heat (were it to attempt to pass as IR radiation instead of hitching a ride in evaporated H2O), the less “global warming” will be caused by the heat energy being transported that way instead of as radiation, as mentioned? (And as a bonus to this question – if it then forms the right kind of clouds when it gives up that energy, can it act to block some of the incoming solar energy, thus further decreasing “global warming”?)

        2) This one requires a bit of set up: Now from what I understand we have two places heat and CO2 are stored – the atmosphere being a weak storage point for both and the oceans being a much stronger storage point, with more of both stored there. Further, I understand Henry’s law seeks an equilibrium between the CO2 stored in the air vs. that stored in the water BUT that equilibrium can be disturbed as the oceans warm, as some now claim they are doing to explain the “missing heat” (that they don’t seem to be able to actually show us in their raw data – only in the data they’ve adjusted to add it in) – and as the oceans warm this tends to force CO2 out of the oceans (again see Henry’s law) by making it less soluble in warmer water… so here’s the question: If we acknowledge the oceans are warming, and in the process unable to hold as much CO2, wouldn’t it seem that might explain, in a normally, naturally warming world, why we might see an increase in atmospheric CO2 as the warming waters are unable to hold as much and it is forced into the atmosphere? (And as a bonus here – I’ve been led to believe that the cold, deep currents that well up around the world tend to be carbon rich – true or false?)

        • fonzarelli says:

          That’s the BIG QUE… If the oceans are warming faster than “evah”, then why aren’t they out gassing faster than “evah”?

        • gbaikie says:

          ” If we acknowledge the oceans are warming, and in the process unable to hold as much CO2, wouldnt it seem that might explain, in a normally, naturally warming world, why we might see an increase in atmospheric CO2 as the warming waters are unable to hold as much and it is forced into the atmosphere? (And as a bonus here Ive been led to believe that the cold, deep currents that well up around the world tend to be carbon rich true or false?)”

          The ocean are warming as indicate by century long rise in sea level. But a century or so of Ocean warming is mostly relatively near the surface. Or Ocean on average is about 4000 meter deep. Roughly we can assume that warming periods of a century or two is not warming the deep ocean.
          Another thing is CO2 drawn into ocean at poles and transported
          thousands of miles and takes more centuries “finish” a “lap”

          In El Nino one has big system of out welling of cold water “bring up nurients” [CO2 mostly]. Or one get a bump on global CO2 level during El Nino-
          You see it, if you look for it:
          http://www.esrl.noaa.gov/gmd/ccgg/trends/

        • pochas94 says:

          1) Yes. Convective processes physically bypass the lower atmosphere, which contains enough greenhouse gasses to essentially block outgoing infrared radiation if no other mode of heat transfer is available.

          2) Yes, again, although there is more to this than meets the eye. There are some regions with surface waters cold enough to absorb CO2 and remove it from the atmosphere. Other regions can become warm enough to emit CO2. How much CO2 is emitted depends on the composition of the upwelling water which may have been sourced thousands of years ago. How much upwelling is actually going on depends on the state if the 60 year PDO cycle. Then you must consider the activities of plant life (much too important to ignore) and humans. Mapping these regions and trying to calculate a global CO2 flux is what might be called a wicked problem. After making all manner of unwarranted assumptions in order to complete this calculation you will of course use it in your Global Warming model.

      • Conor says:

        Hi Roy
        I have sent a doc. to your Hotmail account. IT should answer many questions, but raise many more.
        Conor

  2. Conor Mcmenemie says:

    Hi Roy. The issue here should be what had triggered the trend of increasing temperatures? Though these updates might be gossipworthy the fact remains that 93% of GW is in the oceans, with a distinct bias at the equatorial Atlantic. Adding too much data which distracts from the core issue reduces the individual and collective ability to achieve a useful result. Key issues are
    1 How and why are the oceans the main recipient of GW?
    2 Why the bias at the east equitorial Atlantic?

    Answer these questions and you are close to solving the problem.

    • 1) The oceans store (or lose) extra heat during climate variaions because they are fluid, and so can easily transport heat vertically, which the land cannot do since it has low thermal conductivity. That’s no mystery to be solved.

      2) Your interest in the tropical eastern Atlantic is presumably due to your fixation on proving some disruptive effect of Lake Nasser on the climate system. I’m sorry, but I don’t think the climate system really cares whether Lake Nasser is there or not…the Sahara Desert by itself is 1,800 times larger than the lake.

      • Conor Mcmenemie says:

        Thanks. 1 Problem arises when the elevated ocean temperature region has a west ward vector yet the ocean current is Southampton. This should be ringing alarm bells.
        2 creation of Lake Nasser affected the salinity and temperature of the whole Eastern Mediterranean region, thus the +6,000 m3/s evapotransportation into the region which produces the AEWS that covered the Eastern Atlantic, as mentioned in 1.
        Ergo the Nile event remains an unresolved yet large scale climatic event.

        • the small decrease in the average flow of water from the Nile due to Aswan High Dam (because of surface evaporation from Lake Nasser) would be such a tiny fraction of the total freshwater flow into the Mediterranean ….

          http://www.grida.no/graphicslib/detail/river-discharge-of-freshwater-into-the-mediterranean_a7d6

          …which when combined with the HUGE wind-driven variations in evaporation from the Mediterranean Sea affecting salinity (which is IMMENSELY larger than Lake Nasser), I don’t see how anyone can claim a cause-and-effect relationship linking the dam with the salinity of water flowing into the Atlantic.

          It sounds like pure speculation, Conor, without serious consideration of all of the natural influences on the salinity budget.

          • Conor Mcmenemie says:

            Wrong.

          • Conor Mcmenemie says:

            Wrong. In the relevant timeframe flood went from 10,000 m3/s to 1,750. The shallow flood covered 26,000 km2 was replaced by a deep lake covering 5,000 km2. Also warm fresh flood floated upon saline Mediterranean, thus eV more than 6,000 m3/s (or + twice average flow rate of the Rhine). This ev vector was specifically due south with slight vering E & W. Directly into the region producing AEWS with the vering factor creating the high/low pressure waves tipifying AEWS. Concurrently the flood factor was specific to the end of the rain season – thus man made reduction in AEWS reducing vegetation, organic CCNs, transpiration, recycling and increasin surface albedo. Also the only moisture contributions in this late season timeframe being Red Sea and Nile flood/ E Med.

            The Nile event remains a major factor in the formation of AEWS, thus E Atlantic insolation.

          • Of course *floods* virtually disappeared….that’s what happens when a dam is built….downstream levels can be much better controlled…but the same amount of water on average still flows down the Nile…minus the extra evaporative loss from Lake Nasser.

            Now, the ecosystem along the Nile was greatly altered, for sure. But I maintain that the small decrease in the total amount of water running from the Nile into the Sea has virtually NO impact on the salinity of the Sea as a whole….all of the other rivers running into the Sea, and especially changes in surface evaporation, will have a much bigger effect.

            What is your goal, Conor? To get the dam removed? If so, why don’t you just say so? Are you being paid to promote this?

            From what I read, the dam is only providing about 10-15% of Egypt’s electricity now, anyway.

          • Conor Mcmenemie says:

            Read Sharaf El Din 1975 (?). Dam had a massive effect upon E Med as well as the flood plain. The flood effect was only happening JASO, Whilst the northern hadley cell was drawing from this region into the ITCZ. The annual flow does not apply, only what happened in this timeframe. Re this subject : I’ve been watching 100,000s dieing of starvation and millions on food aid in this region whilst the experts try desperately to avoid factors affecting the main rainbaring system. There is no need to remove the dam, a factor also stated in the ITCZ paper.

          • Conor Mcmenemie says:

            Also read Rowell 2003 – all of this is in the ITCZ paper.

          • mpainter says:

            Also read about currents through the straits of Gibraltar where higher salinity Mediterranean water flows out underneath the lower salinity N Atlantic current flowing in. There’s no problems there.

          • Conor Mcmenemie says:

            MPAINTER – no argument there. Prob here is how the Aswan Dam Complex altered the salinity and temperature of the eastern Mediterranean and Nile Delta, sufficient to reduce the Easterly Wave formations. Roy supposidly reviewed it, but it seems obvious he didn’t read it. A PPP.

          • Conor, what annoys me is that you hijacked this thread about global-average conditions, and the leading causing of internal climate variability (El Nino and La Nina), and tried to divert it toward some sort of claim that if we just understood how construction of the Aswan Dam has disrupted the climate system, then we’d be as wise as you.

            Go back and read your original comment.

            Well, I’m calling BS on that effort. Maybe such an event did cause a small increase in the average salinity of the Mediterranean, I don’t know. (And my PhD dissertation was on the energetics of African Easterly Waves, so don’t try to BS me on that angle, either). Please don’t hijack the thread to serve your niche purposes. At least Dou6 Co++on (who I have banned) dealt with a truly global issue (the greenhouse effect).

          • Conor Mcmenemie says:

            Best ban me too, but next time you are given a paper for review, try reading it before dismissing it.

          • Conor Mcmenemie says: August 1, 2016 at 11:39 AM

            “Also read Rowell 2003 all of this is in the ITCZ paper.

            Are you referring to: Tapio Schneider et al, 03 Sep 2014 paywalled. or
            http://web.mit.edu/davidmcg/www/papers/McGee_2014_EPSL.pdf?

            They do seem like speculation rather than science.

        • Bob Roberts says:

          I’m sorry, but the idea that the creation of Lake Nasser has had any significant effects globally is about as silly as the idea humans have usurped the much greater forces that dominate our weather, temperature and climate on anything but the smallest, temporary scales.

          No organism can live without affecting it’s immediate environment but the idea humans have become a dominant force, in my mind, is exactly similar, and just as false, as the old idea that humans were the exact center of the entire universe and everything revolved around Earth for that reason.

          • Conor says:

            Bob Roberts

            Your comment standing on its own speaks for itself. BUT in reality after breaking down all of the relevant data it shows that altering the evapotranspiration from the E Med and Nile Delta JASO (+6,000 m3/s) does affect the formation of AEWs in the Sudano/Ethiopian arena. Once the AEWs are up and rolling they self propagate westward across the continent and over the Atlantic. The Nile Dam Complex at Aswan is the principle agent for altering the ev. FACT.

          • Conor says:

            WILL JANOSKA

            The reference to Rowell 2003 was in a paper supposedly reviewed by uncle roy. How Mediterranean SST and Salinity affected sub Saharan Pricipitation.

          • Conor says: August 2, 2016 at 3:59 AM

            “WILL JANOSKA The reference to Rowell 2003 was in a paper supposedly reviewed by uncle roy. How Mediterranean SST and Salinity affected sub Saharan Pricipitation.”

            Hokay! Still looks like fantasy rather than science!

    • Pete Brown says:

      “Adding too much data which distracts from the core issue reduces the individual and collective ability to achieve a useful result.”

      Seriously…?! Someone actually wrote that? On a science blog?

      Dr Spencer, apparently, has been clouding the issue (‘scuse the pun) with too much data… Data, apparently, prevent us from achieving a “useful result”… Apparently, data about changes in temperature of the atmosphere distract us from the core issue – that the atmosphere is getting really hot. So stopit! Naughty Doctor.

      That mind boggling sentiment is the reason why humanity sometimes looks doomed (not the accumulation of CO2 in the atmosphere).

      • Pete Brown says:

        (My mistake. I see that the real issue is the CO2 in the air pushing all the heat into the deep water. Data wouldn’t help with that. What you need is a really active imagination)

        • Conor Mcmenemie says:

          The issue here, apart from ocean heat content being 93% of GW, is that there is evidence of a significant change within the planets largest weather system – producing increased equitorial SST – consistent with published data for GW.

        • Bob Roberts says:

          I know it’s a radical idea, but the evidence I’ve seen (a greening of the biosphere in general, including the deserts of the world in general, a reduction in areas covered in persistent ice and snow, such that growing seasons are getting longer and more land is available for all life forms to live arguably better lives) suggests to me that global warming is good and if I’m wrong about humans NOT being a major or even significant cause of it, we should not be castigating those (fossil fuel companies, cement makers) who are causing it, we should be giving them medals and shaking their hands.

          • Conor says:

            BOB ROBERTS

            A lot of generalisations there. The constantly elevated gmt provides surprises we don’t need ie global cereal crop production is reliant upon certain parameters. Changing climate affects our ability to adjust to feeding the population.

      • Danny Bory says:

        pete brown says:

        “Seriously?! Someone actually wrote that? On a science blog?”

        Your mistake is to think of this is as a science blog. While Dr. Spencer usually (but not always) writes posts that can be considered science, the comment section is mainly inhabited by people with a very non-scientific motivation.

        Dr. Spencer even admitted in his last post that the science is settled regarding the fact that increasing CO2 in the atmosphere will increase the temperature of the earth. That is science. The 502 comments (and counting) that followed by the likes of mpainter, Stephen Wilde, geran, etc. are not science. Don’t mistake cranky old nutters for science.

        DB

        • Danny Bory says:

          Come to think of it, I don’t understand why Roy allows people the free platform for espousing ideas that are both nutty and counter productive to the scientific message he is presumably trying to get out through his posts. They should get their own blog.

          My best guess is that while Roy disagrees with the peanut gallery on the real science, he agrees with the them on the agenda of casting doubt on the the danger of global warming.

          He is an interesting fellow, this R Spencer. He has no credibility from the scientific community so he swims around in the anti-AGW puddles with nuts who tell him that his science is wrong.

          • mpainter says:

            Dr. Spencer maintains that he cannot prove or demonstrate, through observations, an enhanced GHE, but his states it as his opinion.

            How about you, DB, got anything besides belly aching over opinions that you don’t like?

          • mpainter says:

            “He is an interesting fellow, this R Spencer. He has no credibility from the scientific community…”
            ###

            And nasty little spitballs? And why are you here, pray tell?

          • FTOP says:

            DWLIR is the 24th chromosome. We know the ocean is where all the warmth is originating and we know the sun put it there not CO2. The ocean heat content dwarfs the atmosphere, Yet, somehow it is “established” that a process (CO2 DWLIR) that can’t can’t heat the ocean is warming the earth through the ocean.

            https://en.m.wikipedia.org/wiki/Argument_from_authority

            Inaccurate chromosome number
            In 1923, leading American zoologist Theophilus Painter declared, based on poor data and conflicting observations he had made,[15][16] that humans had 24 pairs of chromosomes. From the 1920s to the 1950s, this continued to be held based on Painter’s authority,[17][18][19][16] despite subsequent counts totaling the correct number of 23.[15][20] Even textbooks[15] with photos clearly showing 23 pairs incorrectly declared the number to be 24[20] based on the authority of the then-consensus of 24 pairs.[21][17]

            This seemingly established number created confirmation bias among researchers, and “most cytologists, expecting to detect Painter’s number, virtually always did so”.[21] Painter’s “influence was so great that many scientists preferred to believe his count over the actual evidence”,[20] to the point that “textbooks from the time carried photographs showing twenty-three pairs of chromosomes, and yet the caption would say there were twenty-four”.[20] Scientists who obtained the accurate number modified[22] or discarded[23] their data to agree with Painter’s count.

          • Danny Bory says:

            Dr. Spencer wrote an entire post explaining why the green house effect is scientific fact including ways to demonstrate the effect through observation. This is not a personal opinion.

            You have an opinion mpainter. It disagrees with the scientific literature from the last 100+ years, observations, countless experiments, and Dr. Roy Spencer. Excuse me if I disagree with you.

            And yes, you will have the last word because I have a job and things to get done while you apparently have unlimited time to post your opinions.

            DB

          • mpainter says:

            DB
            If you disagree with my views, why do you not rebut them “with the scientific literature from the last 100+ years, observations, countless experiments..”

            But you don’t. You instead fling a wad of nasty spitballs and flee.

          • fonzarelli says:

            painter, Ding Bat is just another light weight troll… Appeals to consensus, ad homs and not much of anything else. This is where the real battle is (with these “alinsky” elements, not with the science)…

          • barry says:

            “Real battle?”

            In the comments section of a blog? No, we obsessives are not changing the world by duking it out here.

          • fonzarelli says:

            People are free to do battle with alinsky radicalim any way of their choosing. At the ballot box, in our every day affairs or even in a comment section at a blog. Left wing radicalism has infected society with it’s overt rudeness for a quarter of a century in a big way (since the rise of the clintons). It’s as if the evil of society which was once hidden away has bubbled to the surface and is here to stay. Unless… we all work toward it’s end. Can’t imagine that it will happen any other way. Whether people are on the right or on the left, we should all agree that alinsky radicalism has no place in civil society…

          • barry says:

            Society is a broad ‘church.’ There’s room for all sorts. I’m not an Alinsky Radical (had to look it up), but society needs it radicals as much as it needs it conservatives. Too many conservatives and society becomes brittle. Too many radicals and society loses its coherence.

          • Gordon Robertson says:

            @Danny Boring…”He is an interesting fellow, this R Spencer. He has no credibility from the scientific community…”

            Then why did NASA and the American Meteorological Society award Roy and John Christy of UAH medals for excellence?

            Why was John Christy invited as a lead author and reviewer on several IPCC reviews?

            And what do you mean by the scientific community? Do you mean the alarmists and their followers who go along to get along? Those who agree, to get lucrative grants for researching pseudo-science.

          • fonzarelli says:

            It should be noted that alinsky dedicated his “rules for radicals” to satan. There’s no room for evil in civil society…

          • Lewis says:

            Danny Bory, don’t get in over your head.

            The good Doctor maintains this blog for his own reasons. Visitors, including you, should visit with respect. As it becomes obvious you don’t know how to be respectful, I suggest you go hang out with your fellow Democrats.

          • fonzarelli says:

            “Lest we forget at least an over-the-shoulder acknowledgment to the very first radical: from all our legends, mythology, and history (and who is to know where mythology leaves off and history begins or which is which), the first radical known to man who rebelled against the establishment and did it so effectively that he at least won his own kingdom— Lucifer”

        • Conor Mcmenemie says:

          Danny

          Roy supposidly reviewed the relevant paper, but his comments seem to suggest otherwise.

          • Michal says:

            Barry,

            Your statement is nothing short of awesome

            “Real battle?

            In the comments section of a blog? No, we obsessives are not changing the world by duking it out here.”

            Instant classic 😉

        • Gordon Robertson says:

          @Danny Boring..”Dr. Spencer even admitted in his last post that the science is settled …”

          So…if Roy writes something that supports your alarmist views he is cool, but if anyone disagrees with Roy they are nutters? Sounds like alarmist logic.

          What you miss is that Roy is open-minded enough to allow disagreement. Try it on alarmist sites like realclimate, desmogblog, or skepticalscience.

        • Bob Roberts says:

          Well there are people who seem to THINK they have a solid science background – but prove they do not with most if not every post… take Dave Appell, for instance.

          http://www.davidappell.com/David_Appell_3.jpg

        • Conor says:

          Hi DB – peanut gallery here.

          Why is it so desperate to deny the possibility that the E Med and Nile Delta has an effect further downwind (south) in the Sudan/Ethiopia during the period of the annual Nile flood????

          None of you know much about this event, but you claim that anybody that has spent 1,000s of hours on the subject is a cranky old nutter’. Uncle roy has stated that he was guessing about the relationship, whilst I had written a 7.5K paper on it. Now as a scientist do you go with the guessers or those who do the research?

          • Conor, in what atmospheric science journal was your study published?

            Lake Nasser can’t have any substantial effect on African Easterly Waves. They form in the baroclinic zone that exists between the hot Saharan Desert and cooler sub-Saharan Africa, and draw energy from it all along that zone. Since Lake Nasser occupies only 1/1800th the size of the Sahara, it is simply not going to affect AEWs in a measurable way. The same goes “in spades” for any changes in the Nile downstream from the dam, including the delta.

            I worked with the scientists who participated in the GARP Atlantic Tropical Experiment experiment, and have read many papers on the energetics of AEWs, and did my dissertation on the subject.

            Your theory is, as far as I know, not supported by any researcher with a PhD in the atmospheric sciences. And I’m not going to spend the time to go analyze every paper someone throws at me, especially when it is off-topic. I never claimed to have “reviewed” a paper you provided.

          • Conor Mcmenemie says:

            Roy.

            Thanks for starting to ask the right questions. I will email a pdf later which will demonstrate my deep rooted consern. The ICJ said they could not find anybody to review it – that is why I phoned you, since you were down as a prefered reviewer.

    • Gordon Robertson says:

      @Conor…”The issue here should be what had triggered the trend of increasing temperatures? Though these updates might be gossipworthy the fact remains that 93% of GW is in the oceans…”

      Irish logic.

      In case you missed it, the IPCC admitted in 2013 that no average global warming had occurred since 1998. They called it a hiatus, which means stopped.

      The data on this site comes from NOAA satellites which span 95% of the planet while scanning bazillions of oxygen data points in a stationary shot of the scanners. The data sets created from this telemetry by Roy and John Christy of UAH have been awarded medals for excellence by NASA and the American Meteorological Society.

      Hardly gossipworthy.

      The UAH data sets show not only a warming hiatus since 1998 but little or no GW since 1979. The heat hiding in the oceans nonsense came from Kevin Trenberth following the 2009 Climategate email admission in which he lamented that the warming has stopped and it’s a travesty that no one knows why.

      Following his admission, Trenberth started that cockamamey theory about the missing warming being stored in the oceans.

      We know the cause of the present warming spike and we are watching it dissipate. We know it was caused by an El Nino. Your theory makes no sense whatsoever even though I might agree it is warming from the oceans that causes the atmosphere to warm and not a greenhouse mechanism.

      • Conor Mcmenemie says:

        Gordon Robertson.

        I see the quandry: the hiatus was tried to be explained away by additional CO2 induced heat cunningly hiding away from the probes- desperate and silly! The problem I raised was specifically elevated equatorial Atlantic SST. This event could only be explained by a reduced cloud mass above allowing for increased insolation. Scrutiny of this SST event points to a reduction in Easterly waves since the ocean current vectors do not conform to its characteristics . Thus we are presented with evidence of large scale climate shift. Cause of this AEW/SST ???? Reduced ev from the E Med and Nile delta during the JASO. Roy disputes the human induced change in E Med/Delta ev on the basis of mass, but the data suggests otherwise…..

      • Bob Roberts says:

        Of course you forget that since the IPCC admitted that Karl (2015) and others quickly said the IPCC doesn’t know what they’re talking about (and for once they may have been right – about the IPCC anyway, if wrong about most everything else!) then of course Mann and others said Karl and his bunch were clueless, in a very convincing rebuttal:

        It has been claimed that the early-2000s global warming slowdown characterized by a reduced rate of global surface warming, has been overstated, lacks sound scientific basis, or is unsupported by observations. The evidence presented here contradicts these claims. A large body of scientific evidence amassed before and since the Fifth Assessment Report of the Intergovernmental Panel on Climate Change indicates that the surface warming slowdown, also sometimes referred to in the literature as the hiatus, was due to the combined effects of internal decadal variability and natural forcing.

        http://www.nature.com/nclimate/journal/v6/n3/full/nclimate2938.html

        And the parade of those trying to explain away the – whatever you call it – I prefer the surface warming slowdown – continues as they look for the monster under the bed (heat in the oceans) and can’t seem to find it.

        Meanwhile we have a massive WEATHER event (El Nio) which might explain where that missing heat was and went – it WAS hiding in the oceans, but it just left them and is now headed out to space where it belongs! And we seem to be headed back to no statistically significant warming – or maybe back to warming that is typical of what the Earth has been doing during every interglacial period since the first.

        I don’t know, call me silly, but I just can’t get excited about the fact a warming world causes more women to go to the beach more often in less clothing… oh wait, YES I CAN! See, I told you, GLOBAL WARMING IS GOOD!

        • Bob Roberts says:

          For some reason (probably because I used the n with the mark on the top, not the normal n) El NINO came out as EL NIO in the above post. I know how to spell it, it wasn’t a typo, I’m sure you know what I meant.

        • fonzarelli says:

          “GLOBAL WARMING IS GOOD”

          Not if you don’t live near the beach… (☺)

  3. Roy, thanks for the timely update. The preliminary July UM CCI GFS-based global surface temperature anomaly estimate is also up a bit from June. Averaging the daily estimates for July and shifting the reference period to 1981-2010, I get +0.40C for July compared to +0.27C for June and the peak this year of +0.72 back in February.

    I noticed that the WeatherBELL preliminary estimate for July was slightly lower at +0.38C, although their June estimate was also +0.27C, while their February estimate was slightly lower at +0.70C, referenced to 1981-2010.

    I have posted graphs of the latest UM CCI estimates here:
    https://oz4caster.wordpress.com/monthly-trends/

  4. fonzarelli says:

    Gaia IS a tease, isn’t she?

  5. It is a wait and see game now that solar conditions are becoming very quiet, taking into consideration the transition to La Nina conditions.

    I want to see how the cooling evolves and the depth of the cooling this time in contrast to past times when the earth transitioned to La Nina conditions versus El Nino conditions when the sun was in a prolonged active state as opposed to now being in a prolonged minimum state. This minimum state which started in 2005, but was interrupted by the weak but still maximum of solar cycle 24 from 2010 to just recently.

    I want to see what happens to the albedo does it increase, even a 1% increase would have significant climate impact.

    Will prolonged minimum solar activity promote a more meridional atmospheric circulation, more global cloud cover ,greater sea ice and snow cover which would increase albedo?

    That is what I want to find out, and that should be the case then the cooling going forward would go beyond just the cooling associated with ENSO transitioning from an El Nino condition to a La Nina condition.

    That is what I am going to monitor providing the sun cooperates and stays very quiet like it is presently and I expect will do so going forward for many years to come.

    • barry says:

      Salvatore, it’s not completely certain that a la Nina will eventuate. Most bureaus monitoring currently give it about a 50% chance of kicking in and sticking through the end of the year.

      Models ease their La Nia likelihood for 2016
      Tropical Pacific sea surface temperatures have been in the neutral range for several months now, and may remain neutral for the remainder of 2016. The latest outlooks have lowered their chances of La Nia forming later in the year. Two of the eight models surveyed maintain a La Nia outlook throughout the southern spring. Several other models approach La Nia thresholds, with some exceeding for brief periods. The Bureau’s model outlook passes the La Nia threshold in August but returns to neutral levels for October and December.

      http://www.bom.gov.au/climate/model-summary/

      BoM is updating their ENSO outlook today, so recycle this link in a few hours -> http://www.bom.gov.au/climate/enso/

      • Bob Roberts says:

        Agreed – while many are predicting La Nina, there’s no guarantee. Just like a lot of people expected the super El Nino to bust the CA drought and it did not, only eased it somewhat in many parts of the state, not the whole state, perhaps due to “the blob” and the resulting “peculiarly persistent ridge”.

        (Of course one good rainy season doesn’t bust a drought – that takes several. CA has a long history of mega droughts – this one, hyped by the alarmists, isn’t all that spectacular if you look at the long view.)

    • gbaikie says:

      “I want to see what happens to the albedo does it increase, even a 1% increase would have significant climate impact. ”

      I think where albedo increases is more important than some
      global average of albedo. Where and when. And what kind of clouds- low or high and etc.

      Broadly/loosely, more clouds in tropic reduce Earth’s heating [cooling effect], more clouds away from tropics and towards the poles retains more heat, doesn’t have much effect upon how how much Earth gains energy [Warming effect].

      But also clouds form from global pattern like EL Nino, and pattern of cloud formation could feed or dampen some global
      patterm- clouds causing things and clouds being result of things.
      Which reminds me why is US getting less hurricanes, and next year will have have more [such as a lot more}?

    • David Appell says:

      “here is my prediction for climate going forward, this decade will be the decade of cooling.”

      – Salvatore del Prete, 11/23/2010
      http://ourchangingclimate.wordpress.com/2010/10/20/andrew-dessler-debating-richard-lindzen/#comment-8875

  6. Dr. Mark H. Shapiro says:

    Hmmm. Looks like the “dramatic cooling” isn’t so dramatic. I’m willing to bet that July 2016 will be in the top two or three warmest July months in the surface temperature record also.

    • second warmest July, after 1998, in the satellite record.

      • mpainter says:

        That makes perfect sense. This the first “super” El Nino in eighteen years, the last in 1998.

      • Bob Roberts says:

        Which, in the grander scheme of things, doesn’t mean much. May tend to suggest a warming world, doesn’t prove humans are a significant cause of that warming.

        Most people, I hope, would welcome a somewhat warmer world. Seeing as the “warming” generally takes place in the higher latitudes and on the colder nights, causing more land to be more habitable and causing less killer frosts and freezes.

        • dave says:

          When I was at school in the 1950s, I was promised – PROMISED I tell you – by the Geography Master that, because of this thing called CO2 build-up, the South Coast of England would become the new French Riviera. When I asked whether the food would automatically improve to French standards, I was reproved, “Now, let’s not venture beyond the bounds of sanity!”

        • David Appell says:

          Bob Roberts wrote:
          “May tend to suggest a warming world, doesnt prove humans are a significant cause of that warming.”

          No temperature calculation can, of course, ever prove that on its own.

    • Michal says:

      Mark,

      Even with the uptick of July the current rate of cooling is currently more than “expected”.

      The current El Nino is currently projecting to be of shorter duration than previous El Nino’s

      The uptick in of itself is nothing unusual they are 2 in the 1997-8 El Nino cooling period.

      In the 2009-2010, there is a 5 month period where the cooling stopped.

      The issue is we have observed so little it is difficult to state what is normal, typical, or excepted. At this time, we have the joy that every new piece of observation and data increases our understanding.

      • barry says:

        Current el Nino is slightly longer than that of 1998 according to NINO3.4 SST method.

        http://www.cpc.ncep.noaa.gov/products/analysis_monitoring/ensostuff/ensoyears.shtml

        • Michal says:

          Barry,

          Thanks for providing the link. Good information!

          By the analysis provided that an El Nino is any devation of .5 C for longer than 3 months. Then the current El Nino is longer than the 97-98. And methodology used is a valid way of measuring most data with a stable base line.

          Unfortunately, we do not have a stable baseline in the temperature data.

          The 97-98 El Nino started at a baseline -.1 C
          The current El Nino started at a base line of +.2 C

          If we compare at a floating base line the current El Nino is shorter duration.

          Also it is my preference to measure duration by half height. If the duration is measured at half height, the current is El Nino shorter duration than 97-98. and this is regardless of the base line used.

          Which is the better way of measuring an El Nino I am uncertain.

          Floating Baseline?
          Fixed Baseline?

          And it is unlikely we will determine the best base line without at least 100 years of observation.

          But if we started measurements in 1700 and stated an El NIno is any deviation of .5 C for longer than 3 months for a fixed base line. Then the current El Nino would be over 100 years long.

          So i am biased to the floating baseline.

          FYI I realize a floating base line also has limitations. But i believe the limitation of the floating base line are less than a fixed base line. Most likely an equation will need to be developed to determine best base line for best comparison.

          thanks for your counter point,

        • barry says:

          If I understand it correctly, the 30-year baseline adjustments are used to detrend SST anomalies. This seems physically sound, because ENSO is an oscillating system – the transfer of heat energy from upper ocean to atmosphere (strong sustained period of this = el Nino) and the reverse (strong sustained period of this = la Nina).

          The only reason not to detrend anomalies that I can think of is if ENSO cycle is considered a source for long-term warming. That’s physically unreal. To take it to extreme, we would say we’ve been in a permanent super el Nino since the last ice age, or that the change from ice age to current interglacial (NINO3.4 SSTs being 3C warmer now than then) is a result of el Nino.

          Clearly that’s not the case. ENSO is internal to the climate system, not a forcing agent, so if there is a long-term underlying change in SST trends (for whatever reason), then that must be accounted for when figuring ENSO anomalies.

          Answers won’t be perfect, but if they are more uncertain, one could no more be sure that this Nino was longer than the last or shorter, or the same length.

          To have a useful discussion participants would have to agree on what ENSO is (physically) to begin with, and how/if it should be reckoned against long-term SST trends that have (or may have) nothing to do with its cycle.

          MEI index is based on another way of calculating ENSO events, and this uses a lot more information – wind speed and direction, sea surface pressure, SSTs, cloudiness etc. That index uses a sliding 30-year baseline to keep data detrended from longer-term changes.

          http://www.esrl.noaa.gov/psd/enso/mei/

          According to that index, the recent el Nino is weaker than 97/98, particularly at peak, and currently of the same duration. If values remain above 1.0 for the month of July (updated in a couple of weeks) then the recent el Nino will be a month longer than 97/98 by that metric.

          http://www.esrl.noaa.gov/psd/enso/mei/table.html

          Caveat of uncertainties can be taken as read.

          • Michal says:

            Barry

            Then it appears to me we are primarily in agreement. In the nuances we had different perspectives.

            A 30 year base line is as good as any standard.

            It appears to me your logic is sound and well versed and your evidence substantiates your conclusion.

            It appears we can agree to measure the duration of anything can be some what subjective. And the comparison of duration of 97-98 El Nino the current El Nino is close enough the subjectivity can alter conclusions

            After recieving the data you provided
            http://www.cpc.ncep.noaa.gov/products/analysis_monitoring/ensostuff/ensoyears.shtml

            It is interesting that the amplitude of El Ninos vary more than the duration.

            At your link here
            http://www.esrl.noaa.gov/psd/enso/mei/
            The analysis of duration by amplitude is a more valuable metric than amplitude or duration alone.

            Thanks

          • mpainter says:

            Your whoopee! El Nino spike turned in the briefest, sharpest spike ever: a coffin nail. AGW RIP.

      • gbaikie says:

        “The uptick in of itself is nothing unusual they are 2 in the 1997-8 El Nino cooling period.”

        It’s not really an uptick, you look at as dead cat bounce- or fell to sharply the month before this.
        Or if don’t assign “purpose” the random temperature the month
        before by chance was too low and the present uptick is either the “right spot” or randomly to high or low. And we don’t even need to talk about the “error in measure” or luck of measurement.

    • Gordon Robertson says:

      @Mark…”Looks like the dramatic cooling isnt so dramatic”.

      It’s called summer here in the Northern Hemisphere. In Vancouver, Canada, the first two weeks of July were well below average. It has warmed in the 2nd half of July but only to normal temps.

      We are having severe flooding due to rain in Fort McMurray, Alberta. La Nina is normally associated with flooding.

      Fort Mac recently had devastating forest fires that burned half the town.

    • Harry Cummings says:

      Dr Mark Shapiro is an expert in the field of climate, that’s what he told me and you can’t get any better than that.

  7. Let’s see what happens from here on out. It is way to early to draw any conclusions but the test is on. In going forward a clearer picture of solar versus AGW influences on the climate will start to emerge.

    I really want to know. I want to be right but I rather be wrong then not know.

    • it will probably take a few years, at least, including getting through the approaching La Nina, to see whether temperature will (1) settle out to pre-El Nino levels (my first guess), (2) experience a step up like what occurred after 1998, or (3) go lower than before (your prediction, but I doubt it will happen).

      • barry says:

        Sustained la Nina is not certain at this stage.

        http://www.bom.gov.au/climate/model-summary/

        • mpainter says:

          A super El Nino without a super La Nina? Hardly any chance of that happening.

          • Bob Roberts says:

            Did you forget your tag again?

          • Bob Roberts says:

            The below response should have said SARC tag, but since I put it in the form of a closing HTML tag the post failed to show it… I’m still learning what does and doesn’t work here.

          • Bob Roberts says:

            And also learning that subsequent comments appear below, not above… DOH!

        • barry says:

          A super El Nino without a super La Nina? Hardly any chance of that happening.

          The robustest period of record is from about 1950, and we’ve had 2 (maybe 3) super el Ninos prior to recent. They were followed by la Ninas. But a sample of 2 isn’t very deterministic. Most bureaus monitoring have lowered the chance of a sustained la Nina (5 months straight) to about 50%.

          The extended MEI goes back to the late 19th century. There was a super el Nino 1877/78, which was not followed by a la Nina. Although not quite the amplitude of the 97/98 el Nino, it has the same profile of decline to neutral conditions, ending at the same time of year as 97/98. The next strongest el Nino lasted 2 years (1940-42). The short-lived, weak la Nina didn’t kick in for 9 months following that. The earlier record comes with more uncertainty, of course.

          We’ll see what happens.

          • mpainter says:

            The ocean meridional overturning that actuates La Nina, i.e., the upwelling west of South America, is in full spate. Has been since March. If you had any founding in oceanography, you would understand that this will be unlikely to change in the next year or two.

          • barry says:

            I’m reporting the views of expert oceanographers on the chance of la Nina forming. Perhaps your expertise is greater?

          • mpainter says:

            I doubt that you understood my comment.

          • barry says:

            Non-sequitur

          • barry says:

            But really, do you think you have more expertise on the subject than the people at the institutes that monitor ENSO? They’ve dialed back the probability of a sustained la Nina forming, yet you seem to be continuing your previous confidence that it will definitely happen.

            Are you saying you have more expertise than they do?

          • mpainter says:

            Barry, do you believe that ENSO is a “sloshing back and forth of the warm waters of the equatorial Pacific”?

            You are a hard case. You are one of the deluded.

          • mpainter says:

            Barry, there is no question in my mind that my understanding is superior to yours. The La Nina conditions of ENSO regions 1-4 is the report of your beloved experts. You are a hard case that clings to your delusions.

          • barry says:

            You keep ducking the question. Do you think you have more expertise than the 8 institutes that monitor ENSO?

            Barry, do you believe that ENSO is a sloshing back and forth of the warm waters of the equatorial Pacific?

            No. Those aren’t my words.

          • mpainter says:

            Well, then you ignore the “experts”.

            I am well founded in the natural sciences and I depend on my own judgment. The “experts” are often wrong. If my judgment tells me otherwise, I disregard the experts.

            Your problem is that you have no understanding, hence you have no judgment.

    • Aaron S says:

      Salvatore,

      Man I hope you don’t wait and see with to much time and energy. If the PDO flips, then some of the stored heat will release and potentially counter a slightly cooler sun. It could be decades until they system equilibrates and the sun reaches a minimum that significantly increases albedo.

      Cheers,
      Aaron

      • Bob Roberts says:

        Simply more evidence that there are a lot of factors that are a lot more significant than human CO2 that are in control… how did Mann and his co-authors put it?

        It has been claimed that the early-2000s global warming slowdown characterized by a reduced rate of global surface warming, has been overstated, lacks sound scientific basis, or is unsupported by observations. The evidence presented here contradicts these claims. A large body of scientific evidence amassed before and since the Fifth Assessment Report of the Intergovernmental Panel on Climate Change indicates that the surface warming slowdown, also sometimes referred to in the literature as the hiatus, was due to the combined effects of internal decadal variability and natural forcing.

        http://www.nature.com/nclimate/journal/v6/n3/full/nclimate2938.html

      • David Appell says:

        The PDO flipped two years ago.

  8. That is what we have to find out and will.

  9. It has to be one of the three. Which one will it be??

  10. RW says:

    “I really want to know. I want to be right but I rather be wrong then not know.”

    There is no way to know. No one knows which way things will go, including the IPCC scientists. Just because there is seemingly valid theory that added CO2 *should* provide a warming push to the system, it does not mean the system must warm. Any change is the sum of all the pushes, warming and cooling, natural and anthropogenic.

    • Bob Roberts says:

      The “seemingly valid theory” relies on a lot of attribution and assumptions which decades of actual observations have tended to disprove though decades of global warming has been induced into the records as a series of adjustments of questionable validity as explained elsewhere.

      I am still waiting on a reasonable explanation of why the atmosphere, a weak container of both heat and CO2, would be able to push around the oceans, a strong container of heat and CO2 – I think a better theory would have it going the opposite way and the ENSO, for one thing, tends to support that idea. Every time we have a large positive phase we set new surface temperature records it seems. But every time that positive phase fades away so do those records.

    • I really want to know. I want to be right but I rather be wrong then not know.
      You can never ever know. That is but your unobtainable goal deliberately inculcated into you by your government “free educational system” by the vast global aristocratic masters that hope, but do not know that their hired thugs will protect them from you “if you get a clue”, rather than “have them for lunch”, before you can “have them for lunch”!

    • David Appell says:

      Everyone knows there is more warming ahead. Everyone.

      • Aaron S says:

        Everyone knows there is Warming ahead? Zero chance of La Nina? Bold one. Perhaps I can do u like u do salvatore for the next 2 years of la nina. But im not that mean and dont care that much.

        • David Appell says:

          Aaron: A La Nina, if it happens, is a natural, temporary downward fluctuation. It won’t matter at all in a decade, or 10, or 30 — continued decadal warming wil.

      • AndyG55 says:

        So won’t it be hilarious to watch “everyone”
        as the planet continues to cool for the next couple of decades. 🙂

  11. My argument for solar is there must be and is a deviation from solar norm that would impact the climate. I think the question is what is that deviation ? Does solar vary enough to reach that deviation?

    I think as far as solar goes those are the questions because if the sun (EXTREME EXAMPLE BUT MAKES MY POINT) were to go dead we know the climate would be effected.

    So what point off normal solar activity (solar deviation) would a solar impact upon the climate have to be? Is it the values I have come up with? Are they sufficient ?

    • Michal says:

      Salvatore,

      Yes, the sun effects earths climate.

      Yes, it appears we are moving to a level of lower sun spot activity.

      But at this time we do not have strong correlation of how much sun spot activity affects total sun radiance. There is correlation that the two are interconnected to some degree. It is likely it will take 50 years of more strong observational data to verify how much they are connected. Then it may take even longer to understand to a reasonable degree how much the heat sink of the ocean creates a lag between Solar radiance and the temperature of the earth.

      If the sun would not be so stable we could understand this quicker. But if the sun was not a stable we would not be here.

      So enjoy the journey of being on the cusp of new understanding. If you focus all on the conclusion it is likely you will just become more frustrated.

      Hope this helps,

      • nigel says:

        “…total sun radiance…”

        Much of the speculation does not depend on the total radiance, but on related phenomena such as change in the solar wind, which affects cosmic ray penetration into the atmosphere and hence cloudiness.

        • Aaron S says:

          Nigel,
          As i umderstand it, Solar cosmic rays cool and during a solar max they are more common but still are rare and related to short term weather phenomenom. The idea they drive long term climate change is a common confusion and is all over the place at skeptical science. Svensmark’s theory is about galactic cosmic rays from exploding super novas that constantly bombard our planet from all orientations. During low activity the suns magnetic field also decreases and this allows more cosmic rays into the atm thus forming more high albedo clouds that cool more. There is huge uncertainty in the impact both pre and post industrial revolution (we have increased sulphates in atm) of GCR. On Earth’s climate but there is abundant literature that they do. My PhD was as a stratigrapher and i got into searching for periodicity in climate records of whatever age like tree rings or annual varves. The record of the sun’s 22 yr magnetic cycle are all over the place. Plus there are causation and correlation relayionships between climate change and solar activity.

          Cheers
          Aaron

      • barry says:

        It’s not yet known if GCR has much of an impact on climate, and some evidence to the contrary.

        • Michal says:

          nigel

          Yes if we could understand all the causes of cloud formation, this debate would be over.

          If we could eliminate all the variables of cloud formation then everything else would be easy to determine.

          Unfortunately, cloud formation appears to be very complex and determined by multiple poorly understood variables of which solar wind and cosmic rays is only one piece.

          Since we can not determine all the variables of cloud formation we need to look at other ways to determine the affects.

      • Bob Roberts says:

        The idea that variations in solar irradiance aren’t strong enough to affect climate seems to me to be a weak and hasty summary of ways the sun affects Earth’s climate. There are many other ways, I would expect. I think as we learn more about the ways the Sun affects the planets we might figure out what it is that is causing this – it certainly IS NOT a change from nearly nothing (270 ppm) to next to nothing (400 ppm) of CO2 in the atmosphere. I mean, I’m not saying that isn’t having SOME effect, but I would expect it would be “down in the weeds”, the uncertainty in our measurements, at best.

        • barry says:

          The idea that variations in solar irradiance arent strong enough to affect climate

          Re the 11-year sunspot cycle, climate is measured in multi-decadal time periods, so that cycle will have a very mow impact.

          But the cycles themselves are of different intensity, and we see a low ebb at the beginning of the 20th century, greater intensity mid-century, and flat thereafter or slightly weakening. The latter part of the 20th century suggest that solar variation is not a primary driver of global surface temps on climatic scales. However, IPCC attributes part of the early 20th century temp rise to long-term increase in solar intensity, so even the mainstream view is that the sun has some effect – which is physically intuitive. How much is what is argued over, not if it happens.

  12. An Inquirer says:

    I was not expecting the small uptick. I realize that the uptick likely is within reasonable error bars, but given the direction of the ENSO regions, I was not expecting the uptick. Not shocked, not bewildered . . . just unexpected.

  13. William Dean says:

    Dr Roy

    I look at the AQUA temperature graphs often and saw that the temperature at all atmosphere levels was equal to or lower than for the same month last year yet the just published July anomaly is 0.39 versus 0.16 in 2016. Can you guide me to the data set that is used to produce the 0.39 value. Thank You.

    • we stop using Aqua around mid-2011 as I recall, its AMSU channel 5 data is very noisy. I don’t recall if the adjacent channels (4 and 6) are working well enough to be used as a rough surrogate for ch. 5.

      Right now we are using 2 main satellites: NOAA-18 and NOAA-19. NOAA-15 has some small calibration drift, so I don’t believe we are using it.

      • William Dean says:

        Thank You Roy. I appreciate what you do

        • An Inquirer says:

          Excellent exchange between William Dean and Dr. Spencer. If commenters could limit themselves to this type of polite, relevant commentaries and with courteous replies, then this blog would be twice as useful!

      • Dr. Spencer,
        What ever happened to the AQUA CERES instrument data? Is not that 60 degree from nadir data still important to glean some understanding of this atmosphere? Even if only a clue as to what to try to measure next.

        • Bob Roberts says:

          I think he answered this and his answer was:

          we stop[ped] using Aqua around mid-2011 as I recall, its AMSU channel 5 data is very noisy. I dont recall if the adjacent channels (4 and 6) are working well enough to be used as a rough surrogate for ch. 5.

          Right now we are using 2 main satellites: NOAA-18 and NOAA-19. NOAA-15 has some small calibration drift, so I dont believe we are using it.

          • Bob Roberts says: August 2, 2016 at 12:44 AM

            “I think he answered this and his answer was: we stop[ped] using Aqua around mid-2011 as I recall, its AMSU channel 5 data is very noisy. I dont recall if the adjacent channels (4 and 6) are working well enough to be used as a rough surrogate for ch. 5.”

            Dr. Roy did not answer at all Not the amsu channel 5. The CERES instrument was not measuring downward (nadir) but off 60 degrees from that (observing the atmosphere from a way different angle). I think the measurements would have destroyed any claim of CO2 influence.
            Dr. Roy was the data daddy of that instrument. Where did that data go and why is that data not available to those that can interpret such in a manner free from politics? Likely that data is BS as no one knows just what was being measured by CERES. Please why are those measurement data, as poor as may be, being withheld from the public by your US government? What evidence is there?

  14. dave says:

    “…just unexpected…”

    For what it is worth (not much) I forecast – under “Pokemon Nerds” thread – a figure of + 0.42 C. (because the “2-meter anomaly” was up for a while, in the middle of July. It has now fallen back).

    One must remember that even these “Figures for the Month” are merely some sort of smoothing of a phenomenon which is quite happy to wander up or down a half degree C IN A FEW DAYS (while being strongly mean-reverting).

    “July was + 0.39 C” does not mean that the whole month of July showed a steady anomaly of + 0.39 C.

    ENSO conditions are “Neutral”. A moderate El Nina is FORECAST as a 50-60% chance. We will see.

  15. Gordon Robertson says:

    @Roy

    FYI…the graph on your home page is showing the error message again on a recent version of the Firefox browser. The graph shows as a hyperlink titled “UAH LT 1979 thru July 2016 V6” and when that is pressed the following error results.

    “You don’t have permission to access /wp-content/uploads/UAH_LT_1979_thru_July_2016_v6.jpg on this server.

    Additionally, a 403 Forbidden error was encountered while trying to use an ErrorDocument to handle the request”.

    I managed to get it up using a version 12 copy of the Opera browser but when I pressed on the graph to make it bigger the error appeared. Same with a recent version of Internet Explorer version 11 – 64 bit. The graph shows but trying to enlarge it gives the forbidden message.

  16. Mike Flynn says:

    From the look of the graph, if Gavin Schmidt is right about CO2 being the control knob of the Earth’s temperature (or some drivel to similar effect), then somebody has obviously been playing randomly with Gavin’s knob.

    Or maybe the greenhouse effect is of no effect at times, and has a negative effect at night, indoors, or when it gets really cold. The observed temperatures don’t seem to correlate with CO2 concentration too well.

    I suppose foolish Warmists will start crying about natural variation, or how Nature is denying itself by refusing to obey the model outputs.

    Oh well, all part of the rich tapestry of life.

    Cheers.

    • barry says:

      CO2 is not the only control knob, and time-scale is a factor.

      • Mike Flynn says:

        barry,

        Have you ever considered abandoning foolish Warmist deny, divert, and confuse tactics?

        If you did, you might be able to express what you are trying to say.

        Merely making meaningless remarks about non existent climatological control knobs, and time scales, shows the intellectual paucity of foolish Warmist propositions.

        In relation to Dr Spencer’s observations as plotted, what is it that you are trying to communicate? Or like Schmidt, Mann, Trenberth, Hansen and all the rest of the fumbling bumblers, are you unable to contemplate reality?

        Foolish Warmists. So much for Rapid Response Groups, Unions of Concerned Scientists, Scientific Communication Programs, and all the rest, if you are the best communicator the foolish Warmists can provide.

        I suppose if you can’t find facts or logic to support your contentions, you could always resort to unintelligible nonsense. You seem to be making a start, albeit not a terribly good one. Keep it up. You can only get better. I wish you luck.

        Cheers.

      • David Appell says:

        Atmospheric CO2: Principal Control Knob Governing Earths Temperature, Lacis et al, Science (15 October 2010) Vol. 330 no. 6002 pp. 356-359
        http://pubs.giss.nasa.gov/abs/la09300d.html

    • yeah, the whole CO2-going-up-and-temperature-going-up thing is pretty weak causal reasoning. Any two linear trends of any variable you choose are, in a sense, perfectly correlated…but very few of them have any cause-and-effect relationship.

      • fonzarelli says:

        Dr. S., in your opinion, what are the causes of the 30 year periods of cyclical warming/cooling (which go back to 1850)?

      • David Appell says:

        Roy W. Spencer, Ph. D. says:
        “yeah, the whole CO2-going-up-and-temperature-going-up thing is pretty weak causal reasoning.”

        Roy, as you well know, the science shows that a higher CO2 concentration in the atmosphere traps more heat and leads to higher temperatures.

        And you also know that no one has ever said this is the sole influence on climate, especially over the short term.

  17. JohnD says:

    Dr. Spencer,

    Thank You for continuing to speak out.

    I was hoping you could comment on the 60 minutes episode last night about ocean floor sedimentary core samples being taken near Greenland. Near the end of the episode, the 60 minutes reporter and a professor (Columbia University professor of Paleoclimatology Peter Demenocal) are looking at a core sample about 8 ft long that, I am estimating since it is not stated, that it represents more than 500,000 years of sediment. The professor points out the transitions from ice age to warm period that are plainly visible in the sediment. The reporter then asks the professor how we know from the core samples that the warming we are seeing now is not part of the natural warm/cold changes visible throughout the sedimentary record. The professor response is that the normal transitions throughout the core sample are gradual, but that the transition today (he points at the very end of the core sample) is dramatic and sharp. This seems preposterous to me that any such conclusion could be reached from such a core sample. The sedimentary deposit would for the last 50 years would be less than a 0.1″, that is just noise in an 8 ft long core sample, and it would seem an analysis of anything in the core sample less than 200 years would be worthless.

    • mpainter says:

      Interesting. If the core indeed represented 500,000 years, then the top 0.1″ would be hardly discernable. But Domencal is wrong about ice age temperature transitions. These tend to be much sharper than the warming of the last century or so. He knows this, so see what happens when a paleoclimatologist has an opportunity to get on tv. We have excellent ice age temperature data from Greenland ice cores, and these record the precipitous temperature changes of 4-8 C (or more) in a few decades, in interstadials (Oescher-Allerod Events) or at the beginning of interglacials such as the Holocene. The situation today in climate science is disgusting.

    • Mike Flynn says:

      From Wikipedia –

      “Measurements of oxygen isotopes from the GISP2 ice core suggest the ending of the Younger Dryas took place over just 4050 years in three discrete steps, each lasting five years. Other proxy data, such as dust concentration, and snow accumulation, suggest an even more rapid transition, requiring about a 7 C (13 F) warming in just a few years.Total warming in Greenland was 10 4 C (18 7 F).”

      If this was an example of gradual change thousands of years ago, I’d hate to see a sudden one.

      Maybe the professor was suffering from a sudden attack of foolish Warmism.

      Cheers.

      • ren says:

        Abstract

        Understanding the temporal variation of cosmic radiation and solar activity during the Holocene is essential for studies of the solar-terrestrial relationship. Cosmic-ray produced radionuclides, such as 10Be and 14C which are stored in polar ice cores and tree rings, offer the unique opportunity to reconstruct the history of cosmic radiation and solar activity over many millennia. Although records from different archives basically agree, they also show some deviations during certain periods. So far most reconstructions were based on only one single radionuclide record, which makes detection and correction of these deviations impossible. Here we combine different 10Be ice core records from Greenland and Antarctica with the global 14C tree ring record using principal component analysis. This approach is only possible due to a new high-resolution 10Be record from Dronning Maud Land obtained within the European Project for Ice Coring in Antarctica in Antarctica. The new cosmic radiation record enables us to derive total solar irradiance, which is then used as a proxy of solar activity to identify the solar imprint in an Asian climate record. Though generally the agreement between solar forcing and Asian climate is good, there are also periods without any coherence, pointing to other forcings like volcanoes and greenhouse gases and their corresponding feedbacks. The newly derived records have the potential to improve our understanding of the solar dynamics and to quantify the solar influence on climate.
        http://m.pnas.org/content/109/16/5967/F3.large.jpg
        http://m.pnas.org/content/109/16/5967.full
        http://cosmicrays.oulu.fi/

        • Bob Roberts says:

          Of course, all such “reconstructions” involve a lot of estimates, guessing and, it seems, more and more ideologically driven “attribution”. One thing I’ve observed is that climate science has been set back by those who keep using their political and ideological notions to drive how they do their ‘science’, particularly when they do things like alter records then destroy the originals and any record of their alterations, go out of their way to silence those with opposing views, etc. The last time I saw behavior like that of those who are full of Catastrophic Anthropogenic Climate Change Alarmism Galileo wound up in trouble, even though he was right. And history repeats itself.

    • Bob Roberts says:

      I suggest that the persistent claims about current changes being either faster or of a greater scale than past changes are simply ranging from ill-informed to deliberate lies from those who know better. Extreme cases of Gore’s “over-representation of factual presentation” doctrine.

      It seems that there was a point within my lifetime when many scientists stopped doing science and became political advocates pretending to do science but really doing propaganda. Also competing for grant dollars so becoming alarmists, trying to sell that their research involved the most important and pressing issues and so they needed lots of money – and a large lab and a large salary, lots of assistants and of course all-expense paid vacations every year to go continue to hype how their area of research was chasing the most critical issues of our age and must not only get more funding, but should also be the primary driver of national and international policy – and also should result in huge tax collections which their organization should control – and be able to draw on for their salaries, which would go even higher, no doubt.

    • barry says:

      John, sediment accumulation varies widely depending on location.

      Sediment can accumulate as slowly as 0.1 millimeter (0.04 inch) per 1,000 years (in the middle of the ocean where only wind-blown material is deposited) to as fast as 1 meter (3.25 feet) per year along continental margins . More typical deep-sea rates are on the order of several centimeters per 1,000 years.

      http://www.waterencyclopedia.com/Oc-Po/Ocean-Floor-Sediments.html

      I wouldn’t assume that the full core was being held. They break them up for easier handling.

  18. nigel says:

    “Maybe the professor was suffering from a sudden attack of foolish Warmism.”

    Yes. He was speaking in tongues. The holy spirit of self-certainty had inspired him.

  19. doctor no says:

    Meanwhile, the data keeps rolling in.
    The trend in temperatures since December 1978 is now +1.21 degrees per decade.
    At the start of the year the trend was only +1.14 degrees per decade.

    Of course, the usual suspects will now claim (LOL) that things will change with a “super” La Nina about to hit. Sorry guys:
    “Most ENSO prediction models indicate neutral ENSO conditions during July, with likely development of La Nia during August or September, lasting through fall and into winter. Most likely strength is weak.”
    http://iri.columbia.edu/our-expertise/climate/forecasts/enso/current/

    LOL

    • Lewis says:

      Dr. No, I hope you’re right. The extended growing season has been great for the larder.

      And I hate ice and snow.

    • nigel says:

      “The trend in temperatures since December 1978 is now +1.21 degrees per decade.”

      Try dividing by ten.

      • mpainter says:

        Figures don’t lie, but liars figure. Let’s see if he corrects himself.

      • doctor no says:

        Well done nigel – you are the first to spot my deliberate mistake.
        To everybody else – pay closer attention.

        For fun, let us assume the average trend remains at a constant +.121 degrees per decade.
        After 12 decades, the total warming by the year 2100 (relative to 1980) will be about +1.4 degrees.

        If the trend accelerates by +.01 degrees per decade, in 2100 the average trend will have increased (by about +.08 degrees per decade) to about +.2 degrees per decade -indicating that the total warming (relative to 1980) will be about +2.4 degrees.

        This is a “luke warm” number compared to model-based estimates of surface warming at that time (but I am not sure what the relationship is between UAH values and actual surface temperature values)

        • AndyG55 says:

          “(but I am not sure what the relationship is between UAH values and actual surface temperature values)”

          In the only region of the world (USA) where they have a surface temperature set unaffected by UHI and data tampering, the trends on UHA USA48m, RSS ContUSA, and USCRN are almost an exact match, and all are essentially ZERO trend until the recent EL Nino.

          Surface temps show a more transient response to hot and cold.

          https://s19.postimg.org/ps2geu8qb/USCRN_et_al.png

      • geran says:

        “Well done nigel you are the first to spot my deliberate mistake.”

        What an obvious cover up.

        Hilarious!

        • dave says:

          Also, “doctor no” is ignorant of English as she is spoke and writ proper. Only Antipodeans use the slang word “fizzer” to mean something which is a fiasco (confusing it with “mere fizzler”). Everwhere else, it means something which goes along well or in a lively manner, or – in my set – Champagne before breakfast.

          • torontoann says:

            “Champagne before breakfast.”

            I remember, as a slip of a girl, being taken to Les Halles for the traditional stomach settler of Champagne, chased by onion soup with a crust of cheese. Since my stomach is violently averse to all three of these things, my date did not have the romantic triumph he was expecting.

          • doctor no says:

            Are you suggesting “Antipodeans” do not speak English as well as Americans?
            or just Englanders?

            Do you mean you do not have beer on your cornflakes for breakfast?

        • dave says:

          “…beer on cornflakes…”

          No, but a mate of mine who was at University with Barry Mackenzie says Barry threw up on his, one morning. Sir Les Patterson was born!

          • nigel says:

            Do New Zealand husbands still tattoo their wives to indicate they are “off-limits”?

          • dave says:

            Barry McKenzie a mistake for Barry Humphries.
            Understandable since the second invented the first.

    • David Appell says:

      doctor no says:
      “Meanwhile, the data keeps rolling in.
      The trend in temperatures since December 1978 is now +1.21 degrees per decade.”

      Wrong.

      It is 1/10th of this value.

      Jeez, learn some math, huh?

    • AndyG55 says:

      Your continued use of the step change of the 1998 El Nino, and the current, transient spike of the El Nino, shows that you are nothing but a Dr of BS. !!

  20. barry says:

    The bi-monthly ENSO update at BoM has just been posted.

    http://www.bom.gov.au/climate/enso/
    http://www.bom.gov.au/climate/enso/#tabs=Outlooks
    http://www.bom.gov.au/climate/model-summary/

    At this point in the year, ENSO outlooks are more certain than before April. We’ll see in December how well the various institutes have done at forecasting ENSO conditions for the rest of the year.

  21. My argument for solar is there must be and is a deviation from solar norm that would impact the climate. I think the question is what is that deviation ? Does solar vary enough to reach that deviation?

    I think as far as solar goes those are the questions because if the sun (EXTREME EXAMPLE BUT MAKES MY POINT) were to go dead we know the climate would be effected.

    So what point off normal solar activity (solar deviation) would a solar impact upon the climate have to be? Is it the values I have come up with? Are they sufficient ?

    I sent the above yesterday but I want to expand a little on the above which is the solar criteria needed to impact the climate according to the data I could gather needs to be slightly below typical values associated with the sun when it reaches it’s lowest values when the sun is in it’s typical 11 year sunspot cycle. In addition duration of time has be much longer.

    Past history does show that when the sun did enter quiet periods such as the Maunder Minimum and Dalton two name the most recent ones global temperatures did go down.

    So I investigated what was the solar criteria during these quiet periods when global temperatures seemingly responded in a downward fashion and concluded the following solar criteria that was present which I will list.

    SOLAR FLUX SUB 90

    EUV LIGHT SUB 100 UNITS

    SOLAR IRRADIANCE OFF BY .015% OR MORE

    SOLAR WIND 350 KM/SEC OR LOWER

    AP NDEX 5 OR LOWER

    COSMIC RATE COUNTS IN EXCESS OF 6500 UNITS

    MY REASONING

    The sun is now at or near these values and I think duration will be quite long therefore I expect a climatic impact if past history is an accurate indicator. Secondary effects associated with the above solar criteria will accomplish this climate impact.

    SECONDARY EFFECTS

    GLOBAL CLOUD COVERAGE INCREASING-due to galactic cosmic rays increasing atmospheric circulation changes.

    SEA SURFACE TEMPERATURES DECREASING- due to a decline in UV light

    ATMOSPHERIC CIRCULATION MORE MERIDIONAL- due to a decline in EUV light, ozone changes.

    GREATER SNOW COVERAGE/SEA ICE COVERAGE- due to atmospheric circulation changes.

    INCREASE IN VOLCANIC ACTIIVTY -due to galactic cosmic ray increase and by products of these cosmic rays.

    THE UPSHOT OF ALL THE ABOVE IS TO CAUSE THE ALBEDO TO INCREASE. EVEN A .5% TO 1% INCREASRE WOULD HAVE A SIGNIFICANT CLIMATE IMPACT.

    One can not deny that each and every time solar values reached very low values global temperatures always responded down , always.

    That is my case time will tell.

  22. dave says:

    Few people have noticed that there seems to have been a bit of a game-changer, from work done by ocean biologists.

    Everybody knows that CO2 put into the Atmosphere is shared with the Ocean – with the UPPER part of the Ocean, that is. EVENTUALLY, almost all the added carbon will be mixed into, and disappear into, the whole Ocean. Until now, that has seemed irrelevant since the mixing time of the Ocean is of the order of a thousand years.

    There is another way in which carbon is transported downwards however. “Mesopelagic”* fish feed on plankton at night near the surface and retreat hundreds of meters deep for the rest of the time – where they poop out carbon and respire CO2.

    It USED to be thought that the biomass of this sort of animals was one billion tons. We know know that the actual biomass is TEN billion tons**. (So much for “settled science”!) The downward transport mechanism is ten times more important than thought. And the accounting in the world carbon cycle which was “odd” and inexplicable, has found a missing transaction.

    The increase in CO2 is fertilising the plankton which is enabling the mesopelagic fish to flourish and spread the carbon around in a much bigger volume of water. Perhaps, instead of taking a thousand years to “clear” our inputs Nature can do it it a hundred years.

    For one thing, the change in surface water pH which is hypothesised must be ameliorated by the dilution.

    But, as one of the biologists said dryly: “These findings have not yet been incorporated into anybody’s models of cycles”.

    * Literally, swimmers in the middle levels.

    **The reason for the change in the estimate is as follows. These fish live in the dark, and have developed extraordinary sensitivity to vibrations in the water. Estimates were made on the basis of how many fish were brought up by “netting”. The fish were better than anybody knew at sensing and avoiding the nets.
    And so they were under-estimated. Recently, sonar-using submersibles have been used, which detect the enormous numbers which are actually there.

    • mpainter says:

      Interesting. If each fish eats it’s weight in carbon annually, then over thirty gigatonnes of CO2 are removed annually from ocean photic zone. This is going to destroy mankind. I haven’t figured out exactly how, but I’ll get back and report on it when I do. Maybe all of the fish feces will cause a disastrous rise in sea level. I’ll make a quick calculation and prove it. I’m a mathematician, you see.

    • barry says:

      As oceanic CO2 is well-measured and has risen about as much as atmospheric, this would suggest that the ocean uptake is larger than thought (some of which has been gobbled). Whatever the fishes have been eating, it doesn’t seem to have changed the rate of atmospheric increase, and nor is it intuitive why that should. If these findings are robust, then they may have been slowing oceanic de-alkanisation. So what happens to the CO2-eating organisms if the seas get warmer?

      • mpainter says:

        Barry says “As oceanic CO2 is well-measured and has risen about as much as atmospheric…”
        ###
        No, Barry. Get an education.

        • barry says:

          Estimates vary slightly, but about half (40-60%) of the excess CO2 emitted into the atmosphere is absorbed by the biosphere, mostly by the oceans. This is a well-known fact, and the main reason we know that atmospheric CO2 increase in modern times is almost entirely anthropogenic. Millions of measurements of oceanic CO2 have been taken. Here is one paper from 1997:

          “Approximately 250,000 measurements made for the pCO2 difference between surface water and the marine atmosphere, ΔpCO2, have been assembled for the global oceans.”

          http://www.pnas.org/content/94/16/8292.abstract

      • mpainter says:

        Who measures ocean CO2? I think Barry confuses ocean pH measurements with CO2 measurements. These pH measurements are many, but these are _not_ accurate and _not_ reliable for determining overall ocean pH. Barry has made up more twaddle.

        Regarding ocean de-alkalinization, there is enough calcium in the oceans to convert forty-six million gigatonnes of CO2 to calcium carbonate.

        Forty-six million billion tonnes, Barry, so relax.

        • barry says:

          Eg, 1997:

          Approximately 250,000 measurements made for the pCO2 difference between surface water and the marine atmosphere, ΔpCO2, have been assembled for the global oceans.

          http://www.pnas.org/content/94/16/8292.abstract

          • mpainter says:

            Nope, they can’t measure CO2 in the ocean because there is none (except minisculely.
            They measure di-hydrogen carbonate, also known as hydroxymethanione acid, or carbonic acid. And how do they measure that, barry?

            By measuring pH. Poor Barry, how he gets duped by the AGW crowd.

          • barry says:

            The measurements for CO2 in that study were direct measurements of CO2, not proxies.

            http://www.jstor.org/stable/42852?seq=1#page_scan_tab_contents

            (6th paragraph, title “Measurements”)

            Many studies have done it with direct measurements.

            You give yourself far more credit than is warranted.

            It would be to your credit here to concede that your assumption was wrong.

          • mpainter says:

            Barry, you are ignorant of the manner of deriving CO2 estimates of CO2 concentration in water. This is done by measuring pH and converting according by formula. There is no CO2 in water.
            Repeat no CO2 in water.
            No CO2 in water
            No CO2 in water.
            Except minutely.

            Let me know if you have trouble understanding, and I’ll try to help.

          • barry says:

            mpainter says: “If each fish eats its weight in carbon annually, then over thirty gigatonnes of CO2 are removed annually from ocean photic zone.”

            Do you believe you mistyped that?

            Surface waters are abundant in CO2. Much of that CO2 is transformed to non-gaseous carbon forms through chemical and biological reaction. Some pats of the world’s oceans absorb CO2, and others release it (eg tropical oceans).

            Measuring changes in ocean pH is one way to estimate ocean uptake. Direct measurements of CO2 in surface waters is another is another.

          • barry says:

            Here’s another paper on direct CO2 measurements from surface waters.

            http://oak.geo.berkeley.edu/~inez/MSRI-NCAR_CarbonDA/papers/takahashi-dsr02.pdf (2002)

            In the list I provided above, you can also see estimates based on pH changes.

          • mpainter says:

            Barry, you imagine to make a virtue of ignorance.

          • barry says:

            Did you read the papers I cited? Are they not taking direct measurements of surface water CO2?

      • dave says:

        “…it doesn’t seem to have changed the rate of atmospheric increase…”

        The rate is already well below the projected rate of older models*. It may help to EXPLAIN it … and therefore that it will continue like that.

        * Twenty years ago, the meme was “The mystery of the missing carbon.”

        “If the seas get warmer?”

        I do not suppose the fish want to be boiled. However, if you calculate the heat capacity of the Ocean …

        http://www.nature.com/ncomms/2014/140207/ncomms4271/full/ncomms4271.html

        That did not come out as a link…One of life’s many mysateries.

    • barry says:

      Is there a link, Dave?

    • barry says:

      Dave, do you also have a link to the biologist saying, “These findings have not yet been incorporated into anybodys models of cycles.” I googled the quote and came up empty-handed.

      Thanks for the link to the study.

    • barry says:

      There is a recent update to that study, highlighting uncertainties (mostly the same authors).

      http://www.ncbi.nlm.nih.gov/pmc/articles/PMC4728495/

      • dave says:

        There was plenty about uncertainties in the original paper.

        I think they are milking it now:

        “The mesopelagic micronekton component is clearly important in the biological pump and detailed studies are needed…”

        i.e. Jobs for life, please.

        Lost the link to the biologist. He was being quoted on Science Daily perhaps.

        • barry says:

          So there was plenty about uncertainties in the paper you think was a “game-changer,” but you also think that clearing up those uncertainties up is “milking it.” The researchers are academically dishonest but their work is sound? Interesting narrative.

          • dave says:

            Plenty about uncertainties – i.e. enough to establish that there was little uncertainty about the basic fact of massive undercounting until now.

            I did not say the researchers are academically dishonest. Just human. Nobody is giving them new data so they are rehashing what they have.

            There has always been a tacit rule in Academia. Do not publish your one and only discovery more often than every three years.

          • barry says:

            Be wary of single-paper syndrome and its children. Too many people on these debates hang their understanding on one or two papers different from the rest. Understanding accumulates. From what I read of the two papers, ‘undercounting’ is possible, perhaps likely, but not a given. Then we see how it stacks up against subsequent studies, uncertainty is reduced, clarity emerges.

            There are plenty of examples of ‘eureka’ papers that were later found to be flawed.

            What significance this paper has for AGW I’m not sure. Ocean carbon biogeochemical processes are interesting re the oceans, but don’t change the well-measured rise of CO2 in the atmos that we have.

          • dave says:

            That is why we need another VOYAGE to look again.

  23. dave says:

    The Sea is just a big sewer. I once met an American lady who was swimming in the Mediterranean. She said “Ah, where do you think the fish – um -go to the bathroom?” I pointed at the shimmering blue water. She frowned; I said desperately “But it sinks!” It was too late. With compressed lips she did a tight little breast-stroke to the ladder, got out, and took a long shower.

  24. barry says:

    “The Sea is just a big sewer.”

    The atmosphere is a dump for various kinds of waste material.

  25. Svend Ferdinandsen says:

    What reference periods for the anomaly have been used?

    And how did you do in the beginning 1979 before a reference period could be established?

    • Reference periods are listed on the charts (1981-2010).

      There were no satellite measurements before 1979.

      • Svend Ferdinandsen says:

        Thanks anyway even if it was only half an answer.
        The reference period 1981-2010, can not have been used untill after 2010.
        How was anomalies calculated in the first years?
        I mean untill you had some reference to relate to.

        I hope you now understand what i ask for.

      • An Inquirer says:

        Dr. Spencer. I understand the beginning of satellite temperature measurements in 1979.

        Could you comment on Tony Heller’s contention that there are satellite images of ice cover that we could use before 1979? From various sources, it does seem that 1979 could have been a high point in Arctic ice cover, and Mr. Heller does provide some satellite photos of less cover in the early 1970s.

        I realize that your focus is on Temperature and not ice, but I just wondered if you have a comment.

  26. galacticconnection.com/cosmic-rays-the-driving-force-in-climate

    • barry says:

      It seems to be very important that a la Nina forms. So important that the views of experts (giving it about an even chance this year) are ignored in favour of graphs of SSTs.

      Why are people so keen for la Nina?

    • Mike Flynn says:

      This seems to contain the flavour of current thinking –

      “Its easy to see how convection gets water down in to the interior of the ocean. The challenge is figuring out where and how that water gets back to the surface.”

      Little challenge, as far as I can see. The brightly coloured graphics showing colder, denser water magically rising to the surface are examples of fantasy being presented as fact.

      One might assume that organisations such as NOAA might actually have a clue, but apparently not. Basic physics explains all. No magical foolish Warmism or psychic influences needed.

      It seems much discussion of “upwelling” relates to foolish Warmist delusions. I wouldn’t be surprised if the supposed upwelling description was unknown before the supposed CO2 heating effect came into existence.

      Cheers.

    • Straightforward enough, I would have thought: A reversal in wind direction draws surface to waters either to the East or to the West. As they can’t flow freely around the globe and water can’t “pile up”, the water reaches the rim of the Pacific basin and proceeds to descend. Displacement currents compensate with deep water rising towards the other rim. I’ve never seen any indication that this is even controversial. ENSO is hard to predict, certainly, but not that hard to understand.

      As Dr. Ron says further up, water can freely mix down to tens or hundreds of metres, in contrast to land, so large masses of water have a dominant buffering influence on climate, as anyone who lives hear a large lake can tell you. And of course the quantity of heat stored by water is orders of magnitude greater than that in the atmosphere.

      • Apologies again for the rechristening, Dr. Roy. Not sure how that started.

      • Mike Flynn says:

        Elliott Bignell,

        You have thought wrong, in typical foolish Warmist fashion.

        Less dense water on top does not proceed to descend, no matter how high you pile it!

        Water cannot freely mix, if it is floating on top of more dense water. Given that some deep ocean currents run in completely the opposite direction to those above and below them, thinking that surface winds influence currents or temperatures thousands of meters below might be erroneous.

        Denser water descends, less dense water rises. End of story. Real physics rather than Realclimate physics.

        Still no magical CO2 influenced upwelling of denser water rising to the surface. No CO2 heating of anything at all. Foolish Warmists.

        Cheers.

  27. barry says:

    Should a sustained la Nina not form this year, I wonder how people who have been saying it definitely will happen (some have even said it’s already here) will explain it.

    • mpainter says:

      Most assuredly La Nina conditions obtain in ENSO regions 1-4. You apparently are ignorant of how meridional ocean overturning corresponds to the ENSO cycle, and how inevitable is the cooling of the troposphere under La Nina conditions.

      Information is available over the web that will help you correct your ignorance.

      • barry says:

        Your mistake is to hang la Nina formation on one parameter. For example, wind speed and direction contribute as well as MOC changes. I’m not ignorant of various factors contributing (I wouldn’t claim expertise), but you are clearly myopic about what causes la Ninas. Maybe that’s why your view is at odds with 6 monitoring institutes.

        • mpainter says:

          Walker circulation is coupled to upwelling west of South America. The upwelling = moc. The implications of this escape you. You cannot arrest La Nina without stopping this coupled moc/Walker cell. But once that starts, it runs its course. The only question now is the length and the intensity of the 2017-18 La Nina

          • barry says:

            Walker circulation is coupled to upwelling west of South America.

            Easterly trade winds are currently normal strength. We’ll see if they intensify.

          • barry says:

            Plenty of times in the record that la Nina conditions were reached for a month or two only to fall back to neutral, so no certainty there. I surmise that you base your reasoning purely statistically – that la Nina followed two previous ‘super-el Ninos’, therefore you assume the same will happen now. Is that about right?

          • barry says:

            The sustained la Nina that followed the ’82/’83 ‘super el Nino’ occurred a year after that event. La Nina values were obtained in the months following the le Nino, but relaxed towards neutral for a while before sustaining 12 months+ after the el Nino.

      • barry says:

        Most assuredly La Nina conditions obtain in ENSO regions 1-4

        Not as yet…

        • mpainter says:

          Poor Barry.

        • An Inquirer says:

          You are probably looking at these numbers more than I am, but I did notice that in ENSO regions 1 and 2, the temperatures have fallen about 2 degrees in the last year, but have stabilized recently. In Region 3.4, the temperature has fallen 3 degrees, and now has a negative anomaly.

        • barry says:

          La Nina ‘obtains’ at sustained -0.5C anomalies in the NINO3.4 region, going by SST metric. In the last week of July the average SST anomalies in that region were just above the -0.5C threshold (-0.4). NINO3.4 SSTs will likely cross the threshold this month. NINO1, 2 and 4 are currently positive anom. La Nina ‘obtains’ when 3.4 anom is below -0.5C for a period of months (most institutes require a minimum 5 month period to call a la Nina).

          6 out of 8 institutes monitoring give 50% chance of sustained la Nina conditions persisting through the rest of the year. BoM predicts a short dip into la Nina-like SSTs (Aug/Sept), then relaxation to neutral conditions for the rest of the year. The other 2 research groups predict greater likelihood of full-blown la Nina, but by no means certain. This is different to predictions of a couple of months ago, when a higher chance of sustained la Nina was estimated.

          mpainter has his own views. We’ll see.

        • barry says:

          NINO3 SSTs crossed the Nina threshold in the last week.
          NINO3.4 is negative but not yet across the Nina threshold.
          NINO1, 2 and 4 SST anomalies are currently positive.

          http://www.bom.gov.au/climate/enso/monitoring/nino1.png
          http://www.bom.gov.au/climate/enso/monitoring/nino2.png
          http://www.bom.gov.au/climate/enso/monitoring/nino3.png
          http://www.bom.gov.au/climate/enso/monitoring/nino3_4.png
          http://www.bom.gov.au/climate/enso/monitoring/nino4.png

          These images are live, so things may look different when you click on them later in time.

          La Nina threshold is not yet reached. As BoM states in their update 2 days ago:

          Despite some cooling of the tropical Pacific Ocean surface waters, ENSO indicators remain neutral and well shy of La Nia thresholds.

          Three months ago I thought it was likely a la Nina would form. But I take my advice from the experts, not some self-aggrandized notion of personal expertise.

        • barry says:

          Should note that various institutes have slightly different thresholds for calling ENSO events. NINO3.4 +/- 0.5C sustained anomalies (5 months) is middle-of-the-road.

  28. ren says:

    Tropospheric temperature falls faster than in 1998.
    http://www.nsstc.uah.edu/climate/2016/june/1998v2016_temps.jpg

  29. ren says:

    Interestingly, that in July the temperature increased the most in the southern hemisphere.

    • dave says:

      “…the temperature increased the most in the southern hemisphere.”

      The temperature ANOMALY, please.

    • barry says:

      UAH6.5 is not updated as yet. What data set are you looking at?

      • dave says:

        “”What data set…?”

        The table at the top of this thread:

        Northern hemisphere FROM 0.51 in June TO 0.48 in July,

        Southern hemisphere FROM 0.17 in June to 0.30 in July.

      • barry says:

        Ah yes, thanks. I was wanting to see what happened in the tropics.

        Tropics from 0.38 (June) to 0.48 (July)

      • barry says:

        If you happen to read this, dave, check out the anomalies for the South Pole. That’s where the biggest swing Jun/Jul happened.

        So Pol = -1.31 / -0.05
        SP Land = -2.13 / -0.94
        SP Ocean = -0.92 / 0.37

  30. Dr. Ron, it looks a bit early to call the “record year” thing, so it’s a good thing we had mpainter to assure us that this month’s small rise simply could not happen.

    However, I have to ask: Why this obsession with the calendar year? You even plot a 13-month balanced moving-average on your monthly updates, so there can be no imagining that you are not aware that the calendar year is an arbitrary period. Why not just plot the linear trend for the whole data set? Al statements about medium- and long-term warming are, after all, statements about this trend.

    If one year doesn’t quite precisely line up with shortest-on-the-left, tallest-on-the-right, who cares? Are you planning to have it court-martialled?

    • geran says:

      Ron, Roy, Ron, Roy?

      It’s probably not important to get a person’s name correct, huh Bigsmell?

    • My apologies, Dr. Roy.

    • The calendar year thing is just tradition, no scientific significance, I agree. I’ve plotted the linear trend line in the past, but dropped it after endless complaining that the trend is not a good fit to the data.

      • dave says:

        Somewhere, Dr Spencer, you ask for details of a supposed experiment in which Tyndall raised the temperature of his room by 5 degrees fahrenheit using unheated carbon dioxide. I could not find that comment of yours again, but recently the matter has been clarified. So here is that clarification.

        In his Bakerian lecture of 1861, Tyndall reported a number of experiments. He never measured anything except in his “experimental tube”. He never mentions measuring “the room”. In the published paper, there is a passage in which he discusses an experimental anomaly which he tracks down to an accidental heating and cooling cycle in his tube caused by pumping and evacuating it. He measures the range, caused by the pump action, of the temperature in the tube (5 FAHR.), from pumping a cycle of AIR (not even CO2) and later he discusses the effect on his actual experiments (slight).

        SOMEHOW this has morphed into;

        “He raised the temperature of the room 5 FAHR with his tube of cold carbon dioxide.”

        The relevant passage, ending with the 5 FAHR. denoument, is as follows, with some clarification and emphasis:

        “A thermo-electric couple was soldered to the external surface of the experimental TUBE and its ends connected with a galvanometer. When AIR was admitted [into the tube], a deflection [of the galvanometer] was produced, which showed that the air, on entering the vacuum, was heated. On exhausting, the needle was also deflected, showing that the interior of the TUBE was chilled [by the pumping out]. These are indeed known effects; but I was desirous to make myself perfectly sure of them. I subsequently had the TUBE
        perforated and thermometers screwed into it, airtight. On filling the TUBE the thermometric columns rose, on exhausting it, they sank, the range between the maximum and minmum in the case of air amounting to 5 (degrees) FAHR.”

        Clearly, when Tyndall speaks of thermometers being screwed air-tight into the tube he means the bulbs are inside – because the temperature range in the tube is what he is trying to measure – and the threads that register the change in the thermometer fluid are outside, where they can be read.

        I suppose some people imagine “the thermometric columns” means OTHER thermometers in Tyndall’s lab; and that “in the case of air” meant the air of the LAB and was not merely a reminder of what was being tested in the tube. The myth therefore becomes Tyndall saying: “I was messing about with my tube when, WOW, I happened to notice the temperature in my lab going crazy!”

        The myth gets an added bit of colour sometimes with references to Tyndall squirting CO2 into the air. That I think comes from a party trick which Tyndall used in public lectures but describes first in the 1861 paper. He used a heat source and pointed a thermometer at it. He then passed a stream of invisible olefiant gas (ethylene; not even carbon dioxide) between the heat source and the thermometer. The thermometer always showed immediate cooling. He was demonstrating that a gas which lets visible light through can sometimes intercept radiant heat. He talks of this as amazing but only because it was contrary to prevailing views which he had shared.

        • OK, most of what you describe here is just temperature change from adiabatic compression and expansion, which has nothing to do with radiative heating/cooling.

          The “party trick” description is ambiguous. What kind of thermometer would he “point at” a heat source?

          Whatever Tyndall did or didn’t do, whether correct or bogus, has no impact on what we currently know from radiative transfer through gases (except from an historical perspective, and giving credit where it is due). So, I don’t waste much time trying to understand what was done back then.

          The broadband IR radiative effects of gases are very small over short path lengths, and it takes sensitive lab equipment to measure it. I’d be surprised if any experiment Tyndall performed was able to demonstrate radiative effects of gases in a lab setting.

          • nigel says:

            (1) Thermo-electric pile(s).

            (2) Tyndall had no difficulty in demonstrating and measuring radiative effects of gases in a lab setting. The following abstract from the Royal Society Proceedings is a ten-minute read and inter alia explains how he did it.

            http://www.jstor.org/stable/pdf/111871.pdf

          • Thanks, Nigel…from this writeup and a drawing I found of his apparatus, it does look like the kind of setup one might use back then to demonstrated the IR radiative absorption by certain gases. So, maybe it really did work.

          • nigel says:

            Dr Spencer:

            You might need a JSTOR account to access the link. But a free one is sufficient for this old material.

          • dave says:

            Dr Spencer

            Here is the 10 second read:

            “The radiative power of gases was examined by causing them to pass over a heated sphere of metal, and ascend in a column in front of the thermo-electric pile…”

    • doctor no says:

      The linear trend in (monthly ) UAH temperatures since December 1978 is now +.121 degrees per decade.
      At the start of the year the trend was only +.114 degrees per decade.

      In addition, the “PAUSE “, which interfered with global warming but subsequently died – has returned in mutant form to interfere with the the cool anomalies associated with the current La Nina.

      mpainter,
      We need to give it a proper name e.g.:
      Zombie pause
      Franken-pause-stein.
      Godzilla pause .?

      • Gordon Robertson says:

        @dr no…”The linear trend in (monthly ) UAH temperatures since December 1978 is now +.121 degrees per decade”.

        Since when do linear trend have anything to do with anything without a stated context? There is no context between 1979 and 2016, there are a series of contexts.

        Prior to 1997, the UAH data was showing an average well below the 1980 – 2010 baseline. Even NOAA admits such anomalies are cooling. So the first 18 years of the UAH record are a recovery from cooling.

        In late 1997, a major El Nino struck which raised the global average briefly 0.8C above the baseline. It was followed by a longer term La Nina which lowered the average below the baseline, effectively cancelling the EN spike.

        Then things got interesting. In 2001, there was an abrupt increase globally of 0.2C. No one has ever explained that and anthropogenic gases do not explain such an abrupt increase.

        From 2002 – 2007, the global average was flat. Then another La Nina struck in 2008, driving the average below the baseline again. It was followed by another EN spike in 2010 and you can see an almost perfect cosine wave formed by them. The average of a cosine wave is 0C.

        Following the 2010 EN was another major LN, in mid-2011. The average drifted slowly back to the 0.25 flat line average until the major EN spike of early 2016. We are waiting to see where that ends up if a strong LN follows.

        A linear trend line tells you absolutely nothing when drawn through that data. UAH has done an analysis on the volcanic aerosols that caused the cooling between 1979 and 2007 and adjusted for that. The adjustment shows a warming on 0.09C/decade.

        Multiplied by the 3.5 decades that gives a warming of about 0.315C. However, that is not TRUE warming since some of it is still below the baseline and includes the mysterious 0.2C blip of 2001. True warming is closer to 0.25C.

        You can see the trend the past 18 years by examining the graph visually using the red running average. It is flat. Therefore, your trend includes an 18 year slope followed by an 18 year flat trend line.

      • barry says:

        Using the full period is a better approximation of long-term changes (climate). Short-term trends respond more to the noise (interannual ‘weather’) internal to the system. An extreme example of short-term trends would show a linear trend of +0.4C/decade from 2008 to present. No one should take that as meaningful. The ‘classic’ climate period of 30 years (the baseline period for UAH) is recommended in part to account for (dampen) short-term oscillations and signals to establish a climatological average.

    • Gordon Robertson says:

      @Elliot…”Why not just plot the linear trend for the whole data set?”

      I have explained that in detail in a recent post. Drawing a linear trend line through data means nothing if you don’t explain the contexts under which the data was gathered.

      The first thing anyone learns in a course on probability and statistics is not to trust a simple average. A linear trend line is a simple average.

      You have to look at what is affecting the data. The first 18 years of the data is affected by two major volcanic eruptions that caused aerosol cooling relative to the 1980 – 2010 average (0C baseline). The late 97 El Nino spike broke that cooling cycle and for the first time since 1979, raised the global average above the baseline.

      That EN was followed by a major La Nina, then, inexplicably, there was a 0.2C rise in the global average. A similar event occurred circa 1977 which was related to the Pacific Decadal Oscillation.

      I have read theories that the 98 EN warmed the oceans to such an extent that they retained some of the heat after the EN was gone.

      No one knows what caused the 2001 blip and drawing a trend line with an unknown warming event raises questions as to the validity of the data. I don’t suspect the data itself, which comes from NOAA satellites, but I do suspect the current 0.25C true warming shown by UAH graphs.

      With that mysterious spike, the true warming is only 0.5C over 35 years.

      • Gordon Robertson says:

        That should read, ‘without that mysterious spike’.

        • Gordon Robertson says:

          @barry …”Last plot is detrended data to compare 2001 on straight line with other years”.

          You present data from an amateur site (woodfortrees) with a graph created by an amateur. We don’t need your amateur graph, we have a real one done by professionals right on this site.

          While playing with the woodfortrees engine years ago, I was able to change a trend from positive to negative by slightly changing parameters.

          I am looking at the actual data on this site wherein the average jumps circa 2001 to around 0.25 C for no apparent reason. There was a reason in late 1997 for a large positive anomaly due to the EN. However, the previous 18 years had averaged below the baseline and there was no reason for that 0.25C blip in 2001 that persisted afterward.

          It’s plainly obvious that the large EN spike had a persistent effect on warming.

        • barry says:

          The data is direct from UAH5.6. I can do the same in Excel. The trending is done by OLS method, the most basic, and the detrending by a simple calculation.

          The 2001 rise is nothing special compared to the rest of the data regardless of whether we’re looking at Nino assisted years or not, whether you’re looking at monthly or annual average.

          But let’s roll this out a little further. State exactly the size of the change in 2001, whether for monthly or annual average, or however you reckon this unusual change in anomaly, and I will find you mirrors for it elsewhere in the UAH record.

          Let’s keep it simple. No rhetoric, just numbers.

        • barry says:

          While playing with the woodfortrees engine years ago, I was able to change a trend from positive to negative by slightly changing parameters.

          Me too. There’s all sorts of ways to do this. It’s especially easy with short periods, just by changing the time period slightly. Running a trend with annual averages rather than monthly also changes the slope slightly.

          As long as we show our work we can see what has been done. The trend calculator used on that site is ordinary least squares. But let’s bypass wft if you prefer and look straight at the data.

      • barry says:

        Inexplicable rise easily explained by la Nina finishing and tropical SSTs moving into neutral territory + normal variation.

      • Dr No says:

        Gordon, you foolish skeptic.
        Using your analysis a flight of stairs is simply a series of flat trends interspersed with mysterious spikes. According to you, we need to remove the spikes because we cannot explain them !
        Therefore, when I walk up the stairs, according to your laughable analysis, I am really staying at the same level !

        “The first thing anyone learns in a course on probability and statistics is not to trust a simple average. A linear trend line is a simple average.”
        You obviously have never studied probability and statistics.
        A linear trend is a least squares line of best fit – not a simple average.

        Finally, you state:
        “With that mysterious spike, the true warming is only 0.5C over 35 years.”
        i.e. you are agreeing that the warming trend is about +1.5 degrees per 100 years!
        For god’s sake, make up your addled mind foolish skeptic.!!

      • barry says:

        drawing a trend line with an unknown warming event raises questions as to the validity of the data

        Much of the variability in the data has causes that are unknown, especially month to month. Weather is chaotic but bounded. That’s why long time periods are more useful than short for climate info, which is the average of weather conditions over long periods (typically 30 years WRT global climate).

  31. geran says:

    TS “Earl” has now been upgraded to hurricane status.

  32. barry says:

    More detail on la Nina predictions for the next 2-6 months:

    As of mid-July, 38% of the dynamical or statistical models predicts La Nia conditions for the initial Jul-Sep 2016 season, while 62% predict neutral ENSO. At lead times of 3 or more months into the future, statistical and dynamical models that incorporate information about the oceans observed subsurface thermal structure generally exhibit higher predictive skill than those that do not. For the Oct-Dec 2016 season, among models that do use subsurface temperature information, 43% predicts ENSO-neutral conditions and 57% predicts La Nia conditions. For all model types, the probabilities for La Nia are close to 50% from Aug-Oct 2016 through Nov-Jan 2016-17, about 55-60% for Dec-Feb and Jan-Mar 2017, and drop back below 50% beginning in Feb-Apr 2017.

    http://iri.columbia.edu/our-expertise/climate/forecasts/enso/current/?enso_tab=enso-iri_update

    • mpainter says:

      Barry, are you not smarter than a climate model? No?
      Well, I am. That’s the difference between you and me.

    • barry says:

      I’m much less expert than the experts, and am impressed that you are more expert than them.

      • mpainter says:

        What’s wrong with forming your own judgment? The “experts” can be wrong and often are, especially in climate studies.

      • barry says:

        Nothing wrong with forming your own judgement, but one should always be careful not to overrate one’s opinion, which is the opposite of skepticism. Being a skeptic, I think it’s ludicrous to automatically prefer your own opinion over people with far more experience and insight. And if you think you have more insight than the people who actively research ENSO, you’re very likely self-deluded.

      • mpainter says:

        La Nina says tell barry hello.

      • barry says:

        That’s nice. I’ve missed her. Maybe she’ll turn up soon.

        • mpainter says:

          I haven’t missed her, and in fact she is not welcome. She brings prolonged drought and scorching 100+ temperatures to this area. The none-too-bright AGW crowd will whoop it up and call it global warming when in fact it is cooling. But they are an ignorant bunch that never miss an opportunity to screech out alarms, even when it makes them look foolish.

        • mpainter says:

          mpainter, expert on the wretched science of the AGW proponents, predicts a La Nina this year. The Humboldt Current turned west at Peru in April. This indicator is 100% reliable. Well, maybe 99%. AGW RIP.

  33. Mike Flynn says:

    barry,

    Science is the belief in the ignorance of experts, said the physicist Richard Feynman in a 1966 talk to high-school science teachers.

    Foolish Warmists seem to put their faith in self proclaimed climate experts, rather than thinking for themselves. Who are these experts you admire so much? Surely not the balding bearded bumbling buffoon variety!

    Why not put your faith in real science, rather than Realclimate science?

    Cheers.

    • David Appell says:

      Were he alive today, Feynman would have perfectly understood why AGW is required by the laws of physics and probably a strong voice in the media calling for avoiding it.

      • geran says:

        Davie, you’re quite the dreamer.

      • Mike Flynn says:

        David Appell,

        Michael Mann apparently communes with dead trees.

        You seem to go even further, and commune with dead physicists. Did Feynman inform you precisely when he changed his mind about his view that repeatable experiments being the very foundation of real (rather than Realclimate) science?

        As Feynman said “And now you find a man saying that it is an irrelevant demand to expect a repeatable experiment. This is science?”

        On the other hand you have the pretend scientist, Michael Mann, who said –

        “Fundamentally, Im a climate scientist and have spent much of my career with my head buried in climate-model output and observational climate data trying to tease out the signal of human-caused climate change. What is disconcerting to me and so many of my colleagues is that these tools that weve spent years developing increasingly are unnecessary because we can see climate change, the impacts of climate change, now, playing out in real time, on our television screens, in the 24-hour news cycle,

        At least he accepts that when the weather changes, the average of weather – climate – changes also. Foolish Warmist. The self proclaimed climate scientist now bases his pronouncements on the 24 hour news cycle.

        As Feynman said – “This is science?”

        Pardon me chortling!

        Cheers.

        • David Appell says:

          “Did Feynman inform you precisely when he changed his mind about his view that repeatable experiments being the very foundation of real (rather than Realclimate) science?”

          You can’t do experiments in climate science — it is an observational science.

          Feynman would know that too. You should also.

    • barry says:

      I read from a variety of sources. I tend to favour critical knowledge from people who are dedicated to that field of research over random blog commenters who post more rhetoric than substance. This seems to annoy random blog commenters who proclaim to know ‘real science’ and ask me to have ‘faith’ in it. Of course, belief has nothing to do with it. Non-experts have to exercise some judgement. All knowledge is provisional.

      • Mike Flynn says:

        barry,

        What is this critical knowledge you tend to favour? Do you consider second rate mathematicians and tree whispering Nobel Prize pretenders to be paragons of research excellence?

        Climate is the mathematical average of weather. Nothing less, nothing more. Foolish Warmists pretend that the practitioners of this strange type of Cargo Cult Scientism are worthy of respect.

        Foolish Warmists have difficulty accepting that climatology closely resembles a cult which has provided nothing of value to humanity in general. A few very expensive toy computer games, with no commercial value at all. Calls to wipe out the human race, by removing that most essential plant food, CO2, from the atmosphere.

        Combined with ever more strident predictions of imminent doom, which is always coming tomorrow, or shortly thereafter, the foolish Warmists seem to wonder why the laughter they hear is directed at them, rather than with them.

        If believing in climatology gives you solace, I wish you well. If you believe climatology shows the future more clearly than astrology, or is of more use than phrenology – good for you!

        If you ever stumble on a fact supporting the notion than calculating the average of historical records over and over, and projecting a different future each time, is science, then feel free to present it. Or you can just keep proclaiming that climatology and science can be used in the same sentence without generating laughter in an audience of real scientists.

        I’d ask you again to trot out your climate experts, but past requests haven’t been successful.

        Foolish Warmist.

        Cheers.

      • barry says:

        Dr Spencer, I have a post just above this one with a bunch of links to ENSO monitoring stuck in moderation. Would you kindly admit it?

      • barry says:

        Mike, if the post with links doesn’t come through, I visit the Australian Burueau of Meteorology, US National Weather Service, Tokyo Climate Centre and UK Met Office for ENSO information and data. BoM and USNWS also provide information from other bureaus. I cited USNWS on recent ENSO forecasts yesterday.

        I also do my own thinking, but I do not think I know better than these institutes.

        • Lewis says:

          Barry,

          Most people who adhere to the conventional wisdom or, as it seems to be called now, the consensus, like to imagine they think for themselves. Hardly. They are following the lead of someone they have chosen to let lead them.

          The facts, whatever they are, speak for themselves. Many/most do not have time or the knowledge to learn the facts for themselves and so must depend upon others to discern the facts and make them available.

          For instance, I come to this blog to note what the average temperature change/anomaly is each month. Dr. Spencer and his peers, are kind enough to make this available. I have no ability to determine if what he offers is correct or not. Others do. Many of them make comments about changing of records – who do I trust? I must allow someone with more knowledge to lead me. I have no choice. The only thinking involved is deciding who.

          The reason I trust Dr. Spencer is because he seems to be trying to offer information, knowledge etc, to no specific end except knowledge itself. Those who try force me to accept a certain point of view, theirs, are not to be trusted.

        • barry says:

          Most people who adhere to the conventional wisdom or, as it seems to be called now, the consensus, like to imagine they think for themselves.

          Oxymoronic statement. “Adhere” being the key word. You may as well have written “believe.”

          That’s not how my mind operates. I weigh evidence. The results form provisional opinions.

          You and I can lecture each other on the intellectual depravity of adherents to one set of beliefs or another, but it’s mundane stuff and beside the point. What we think may matter, what other groups may think is political discussion.

  34. ren says:

    Why does 1997/1998 peak is so little seen in the increase in global temperature?
    http://woodfortrees.org/graph/gistemp/from:1979/plot/uah/offset:-0,3

  35. Pehr Bjornbom says:

    Thank you Dr. Roy Spencer and Dr. John Christy for your pioneering work on determining the global mean temperature anomaly by using satellite data. I think that your excellent work is and will be of utmost importance for developing our understanding of our changing climate.

    Between 1979 and 2016 we have the most reliable observations both for the carbon dioxide content of the atmosphere and for the global mean temperature change:

    http://www.climate4you.com/images/CO2%20MaunaLoa%20MonthlySince1958.gif

    http://www.climate4you.com/images/AllInOneQC1-2-3GlobalMonthlyTempSince1979.gif

    According to the theories of atmospheric physics an increase of carbon dioxide content of ca 20%, that is observed between 1979 and 2016, should give rise to some temperature increase. The observed temperature increase of 0.35-0.5 K during this period agrees with the wide climate sensitivity interval according to the climate science literature. This supports the theory that an increased content of greenhouse gases results in an increased global mean temperature in the long run.

    Furthermore, the greenhouse effect of CO2, that the carbon dioxide content of the atmosphere results in a considerable increase of the surface temperature, is seen in satellite observations. The outgoing long-wave (IR) radiation from Earth to space is 240 W/m2. From the satellite observations of the spectrum of this radiation the effect of carbon dioxide is to decrease this radiation with roughly say 30 W/m2. If we instantly remove all carbon dioxide from the atmosphere thus the outgoing radiation would increase 30 W/m2 and Earth would begin cooling to reduce this radiation to 240 W/m2 again.

    According to a back of the envelop calculation the global mean temperature would drop from 288 K to 288-288*30/240=252 K, that is very cold. This is a very rough estimate but without carbon dioxide in the atmosphere our planet would definitely be a much colder place and of course a planet without any life.

    • Pehr Bjornbom says:

      More on the back of the envelope of calculation of the temperature drop when outgoing radiation drops from 270 to 240 W/m2. If we assume that the radiation is proportional to the absolute temperature we find the result as above with a temperature drop of more than 30 K, of course this is a very rough estimate. A little more advanced calculation assumes that the radiation is proportional to the absolute temperature to the power of four. This gives a temperature drop of around 10 K. However, then the effect of decreased content of water vapor must be considered resulting in a further drop of temperature. Thus it is not clear which of those two methods of back of the envelope calculations would give the best result. But they clearly indicate how important the greenhouse effect is for our lives.

      • geran says:

        “Thus it is not clear which of those two methods of back of the envelope calculations would give the best result. But they clearly indicate how important the greenhouse effect is for our lives.”

        It’s “not clear”, but it “clearly indicates how important…”

        Hilarious.

        • Pehr Bjornbom says:

          This is clear because with both of those two very simple but well-founded calculation methods the temperature drop becomes so much for a 30 W/m2 drop in outgoing radiation.

          • geran says:

            Sorry Pehr, but your calculations make no sense.

            288-288*30/240=252 K ???

            You seem to be trying take a ratio of temperatures, based on a ratio of fluxes? That’s not how it works.

            You also seem to confused about radiated temperature and surface temperature.

            Among other errors….

          • Mike Flynn says:

            geran,

            /sarc on

            As any foolish Warmist knows, fluxes can be added and multiplied, just like temperatures. If you have a glacier emitting > 300 W/m2, then 10 m2 emits 3000 W.

            Concentrating this then gives quite enough heat to boil a kettle, make a nice cup of tea, and sit in front of the 3000 W radiated heat. To foolish Warmists, glaciers are quite warm, according to foolish Warmist physics.

            For some foolish Warmists, PhD just means “piled higher and deeper”.

            /sarc off.

            Cheers.

      • Pehr Bjornbom says:

        Yet another back of the envelope estimation of how much the surface temperature would have to decrease in order to get a decrease of the outgoing radiation 30 W/m2 is to use climate sensitivity values. For example a climate sensitivity value of 1.2 K per doubling of CO2 would decrease surface temperature 1.2*30/3.7 = 10 K. The calculated decrease is proportional to the climate sensitivity, for example 2.4 K climate sensitivity would give a decrease of 20 K.

        This agrees well with the two other back of the envelope calculations. In any case these are all very rough estimates because available climate sensitivities have not been considered for such large changes of the radiation.

        • geran says:

          Okay Pehr, if you only want pseudoscience, here goes:

          The atmosphere “traps heat” and radiates back (back radiation). The back radiation raises the surface temps, which then continue to radiate, only more. But again, the radiation is trapped and cannot get out. The surface continues to warm, and warm, and warm. The massive IR again tries to escape through the atmosphere. But, it is “trapped”. Where does it go? Well, it goes back to the surface again, and we have “global warming”, to the MAX!

          The process continues until the planet boils.

          Happy?

          • Pehr Bjornbom says:

            Thank you geran, brilliant! 🙂

            I am not someone who declines some good humorous satire. The climate debate really deserves some ridicule for all exaggerations and because of all those annoyingly ignorant actors with one or another hidden agenda.

            What we know is that observations are showing that carbon dioxide in the atmosphere is increasing and that the global mean temperature also has an increasing trend on climatological time scales. There is also a theory explaining that increased carbon dioxide should cause a temperature increase, albeit with many deficiencies. There is various other support for this theory, for example the satellite observations of the long-wave IR spectrum for the radiation emitted by Earth, as I have discussed above.

            Personally I find this theory of the greenhouse effect in climate science convincing but I cannot see that climate science today can tell us if a large addition of carbon dioxide to the atmosphere will give only a little temperature increase without problems or a big catastrophic one or a medium case with more or less serious problems as a result of the changes to a warmer climate. I think this is the background we today have to live with for evaluating the risks and possibilities with different scenarios for action or inaction. Hopefully, future climate research with much more observations and continued theoretical development will give us a better understanding of what is going on.

          • geran says:

            Pehr, thank you for your gracious remarks.

            Allow me to comment to :

            We agree.

            That depends on the time scale, but let’s continue.

            The “deficiencies” reduce the “theory” to pseudoscience.

            The planet emits long-wave IR. Always has, always will. That proves NOTHING about AGW.

            There is NO scientific evidence that atmospheric CO2 can warm the planet. There is some evidence that, in extreme surface temperatures, it can cool the surface.

            No risk, no action.

            The learning continues….

          • geran says:

            Wow, most of my comment was deleted!

          • geran says:

            This is pathetic, but let me try again.

            [Pehr’s remarks]

            [What we know is that observations are showing that carbon dioxide in the atmosphere is increasing…]

            We agree.

            [… and that the global mean temperature also has an increasing trend on climatological time scales.]

            That depends on the time scale, but lets continue.

            [There is also a theory explaining that increased carbon dioxide should cause a temperature increase, albeit with many deficiencies.]

            The deficiencies reduce the theory to pseudoscience.

            [There is various other support for this theory, for example the satellite observations of the long-wave IR spectrum for the radiation emitted by Earth, as I have discussed above.]

            The planet emits long-wave IR. Always has, always will. That proves NOTHING about AGW.

            [Personally I find this theory of the greenhouse effect in climate science convincing but I cannot see that climate science today can tell us if a large addition of carbon dioxide to the atmosphere will give only a little temperature increase without problems or a big catastrophic one or a medium case with more or less serious problems as a result of the changes to a warmer climate.]

            There is NO scientific evidence that atmospheric CO2 can warm the planet. There is some evidence that, in extreme surface temperatures, it can cool the surface.

            [I think this is the background we today have to live with for evaluating the risks and possibilities with different scenarios for action or inaction.]

            No risks, no action.

            [Hopefully, future climate research with much more observations and continued theoretical development will give us a better understanding of what is going on.]

            The learning continues….

          • geran says:

            NOTE to Dr. Roy–If you are getting your website handled, for free, by Bubba’s Bar and Grill, then fine. But, if you are paying for this site, you need to get your money back….

            Continual complaints, not just me.

          • Mike Flynn says:

            Pehr,

            You wrote –

            “There is also a theory explaining that increased carbon dioxide should cause a temperature increase, albeit with many deficiencies.”

            I have neve seen this theory. I have never even seen a falsifiable hypothesis relating to the alleged heating properties of CO2.

            Raymond Pierrehumbert, noted foolish Warmist, claims that CO2 is an insulator, albeit one with mysterious and magical properties, which raises surface temperatures in sunlight, but allows surfaces to cool when not illuminated by the Sun.

            Is this your theory of CO2 causing temperature increase? It seems quite silly to me, but then again, I’m not a foolish Warmist.

            Cheers.

    • fonzarelli says:

      “The observed temperature increase of 0.35-0.5K during this period agrees with the wide climate sensitivity interval according to the climate science literature. This supports the theory that an increased content of greenhouse gases results in an increased global mean temperature in the long run”

      The problem with this is that the warming during this period (’79-’16) is coincident with a known cycle of warming that goes at least as far back as 1850. If we subtract out the natural warming then the anthropogenic warming will be nowhere near climate sensitivity estimates (nor for that matter TCR). Why on earth is the obvious only being recognized by the Spencers, Currys and Lindzens of the climate science community?

      • Pehr Bjornbom says:

        That there are natural oscillations in the global mean temperature around a long-term trend is something that is well-known in climate science. This graph by Bengtsson and Schwartz (2013) suggests a long-term trend (blue line) caused by increasing greenhouse gases with a natural oscillation superposed:
        http://www.tellusb.net/index.php/tellusb/article/viewFile/21533/30089/101938

        This graph suggests a transient climate sensitivity of 0.314*3,7=1.2 K per doubling of carbon dioxide assuming that aerosol forcing may be neglected.

        Reference:
        Lennart Bengtsson and Stephen E. Schwartz (2013). Determination of a lower bound on earth’s climate sensitivity. Tellus B 2013, 65, 21533,
        http://dx.doi.org/10.3402/tellusb.v65i0.21533

        • fonzarelli says:

          Even then, at 1.2K, that would suggest that recent warming is largely anthropogenic. At 20%, we should see .24K which would be just .06K per decade. This constitutes negligible warming which may or may not actually be in the record. As long as anthropogenic warming is being superimposed on the natural warming cycle, we can say nothing definitive about recent (anthro) warming…

        • fonzarelli says:

          “That there are natural oscillations in the global mean temperature around a long-term trend is something that is well known in climate science.”

          If that is the case, why hasn’t that been recognized by the ipcc? Their climate models actually show cooling for natural forcing alone and depend on constant warming for those with anthropogenic forcing. And why their seeming obliviousness in the face of the recent hiatus?

    • “According to a back of the envelop calculation the global mean temperature would drop from 288 K to 288-288*30/240=252 K, that is very cold. This is a very rough estimate but without carbon dioxide in the atmosphere our planet would definitely be a much colder place and of course a planet without any life.”

      We now have The Pehr Bjornbom religious troll from the Church of the anthropogenic, doing ‘back of the envelop BS’!
      If Earth’s atmospheric CO2 were reduced to 150ppmv all life above protozoa level would cease but the surface temperature would change up or down by less than 1 K. Perhaps that would be good to rid this Earth of the likes of Pehr Bjornbom, so the Roaches could get their try at skilfully managing ‘stuff’, for the benefit of all Roaches.

  36. geran says:

    288-288*30/240=252 K ???

    Pseudoscience supported by pseudo-math?

    In pseudoscience, two “wrongs” make a “right”.

    Hilarious.

  37. Mainstream when it comes to the subject of climate and mainstream climate scientist always seem to go with the climate trend and never have the nerve to go against it because they are clueless.

    They are really clueless and I have zero respect for most of them the blind leading the blind.

  38. Dr. No and company you talk it up but really offer nothing of substance to back up your positions other then jumping on board with the AGW movement.

    We all know the AGW theory you subscribe to but none of you are able to offer past history or other evidence to back up your stance.

    • doctor no says:

      “We all know the AGW theory you subscribe to but none of you are able to offer past history or other evidence to back up your stance.”

      I herby offer you the UAH data which clearly shows a long-term warming trend for the atmosphere. I can also offer you surface temperature data sets, sea level rise data, ice and snow data, ocean acidification data, top of atmosphere radiation data, . what would you like?

      • Mike Flynn says:

        Foolish Warmist.

        Correlation does not imply causation, unless climatology or astrology is involved.

        A falsifiable hypothesis might be more convincing.

        Cheers.

        • nigel says:

          RSS has NO CHANGE (to nearest 1/100 th C) from June to July, in its analysis of LTT anomalies (for a slightly smaller geographical cover than UAH)

          Incidentally, I notice that Accumulated Cyclone Energy for 2016, to date, as issued by R Maue, is 106% of “Normal”, whereas completed 2015 was 138%

      • Wrong Dr. No (and this is where you and others are in denial) if one goes back to the Holocene Climatic Optimum some 8000 years and reviews all the climatic data from that point in time to now you show me why this period of time is unique in contrast to the last 8000 years of climatic history.

        That is what I would like. Show me why this period of time is different then the entire past 8000 years of deviations in the climate.

        This period of time being still cooler then the Holocene Climatic Optimum, the Minoan Warm Period, Roman Warm Period etc.

  39. Earth’s Temperature in Past 18,000 years: <climate

    http://www.faculty.ucr.edu/~legneref/bronze/climate.htm

    There is the data show us why this period of time is different.

    • nigel says:

      Salvatore:

      Well, actually, the Perihelion always occurred during the Northern Hemisphere Summer 8,000 years ago – which is perhaps why the Holocene Optimum was a “little warmer” (whatever that actually means!) than the present.

      One of your predictions must surely be that the rate of increase of CO2 in the atmosphere will slow as SST’s drop and hence more CO2 from the air is accepted, on balance, by the Sea. The recent El Nino saw an impressive increase in atmospheric content. Time for a change? About five years to see how it all plays out.

      And, someday, a big volcano is going to pop!

  40. AGW all talk no substance.

  41. The AGW crowd ignores past history and unless this period of warmth exceeds past periods their theory has nothing to stand on.

    Thus far it is not and I suspect the warming is over this is it.

  42. Once again the data does not support your claims . Dr. No is in denial of the data which shows no warming in Antarctica or for that matter the Southern Ocean.

    Dr. No you are in fantasy land.

    • barry says:

      While there appears to be no trend in Antarctic temps over the satellite period, Steig et al did a study on Antarctic temps since 1952 a few years back collating all the records they could, finding that over that period there had been warming averaged over the continent with the data collated. The paper was reviewed by some in the skeptic community, who also found warming since 1952, but half that found by Steig et al.

      • An Inquirer says:

        Barry,
        You often provide useful information, but sometimes you astound me for how unaware you are of problems in the “AGW” camp. You refer to Steig’s Antrctica study as if you are oblivious to the significant problems / mistakes with that study. Most of my friends in the AGW camp stay away from that study for good reason!

        • David Appell says:

          What good reason?

          Why would you say that and not explain the reason? It makes no sense.

          • An Inquirer says:

            David Appell,
            As you can undoubtedly tell, I do not visit this blog every day, nor can I afford the time to address every detail in a timely fashion.
            But here is a quick reply:
            I suggest you do some reading on principal components, the mistakes in Steig’s study, and the sheningans of Gavin in the whole review of the study.
            If you do not understand the role of principal components — especially how arbitrary and capricious selection of the number of principal components affect the outcome — then I strongly suggest that you do not refer to Steig’s study in the future.

      • barry says:

        An Enquirer, I’m fairly familiar with ‘skeptic’ views.

        I wrote;

        The paper was reviewed by some in the skeptic community, who also found warming since 1952, but half that found by Steig et al.

        You aware of this, or should I hunt down the reference?

      • barry says:

        Well, it was easy enough to find:

        http://journals.ametsoc.org/doi/full/10.1175/2010JCLI3656.1

        Conclusion. Continental averaged warming over Antarctica, but less than Steig et all.

        (From 1957, not 1952. I read these a few years ago…)

        3 of the 4 ‘skeptic’ authors are fairly well-known in the blogosphere: Steve McIntyre, Jeff Condon, Nic Lewis.

      • barry says:

        You refer to Steigs Antrctica study as if you are oblivious to the significant problems / mistakes with that study

        I assume any paper is imperfect. I try to be balanced, which is why I mentioned the paper authored by skeptics. You may be interested in what the lead author wrote about Steig et al.

        In my opinion, the Steig reconstruction was quite clever, and the general concept was sound. A few of the choices made during implementation were incorrect; a few were suboptimal. Importantly, if those are corrected, some of the results change. Also importantly, some do not.

        That reads like a balanced appraisal to me.

    • barry says:

      UAH6.5 decadal trends:

      Southern Polar SSTs = -0.5C
      Antarctic continent = +0.6C
      Combined = -0.01C

    • Mike Flynn says:

      Antarctica has cooled just a bit since it supported trees, grass, critters etc.

      A few kilometres of ice here and there seems to be proof of cooling.

      Antarctica also has the coldest recorded temperatures on Earth.

      But if foolish Warmists believe the continent is heating up due to CO2 in the atmosphere, why not humour them? Once all the ice has gone, and Antarctica has gone back to liveable conditions, think of all the extra land for growing good!

      Cheers.

      • barry says:

        Once all the ice has gone, and Antarctica has gone back to liveable conditions, think of all the extra land for growing good!

        If all the ice goes the seas rise by 70 meters.

        • Mike Flynn says:

          barry,

          Your comment seems like a foolish Warmist attempt to divert and confuse, at least.

          You challenge nothing I’ve said, but then make unfounded assumptions that continental uplift will cease, and that the ocean floors will become static, preventing subsidence.

          Of course, these are foolish Warmist assumptions – with no basis in fact at all.

          Coal and oil formations were once above current sea levels, whilst marine fossils above 6000 m in the Himalayas show that sea levels have experienced extreme changes in the past.

          Foolish Warmist. You can no more look into the future than can I. And even I can only make assumptions.

          Cheers.

        • barry says:

          If all land ice melted sea level as a function of volume would rise by 70 meters. You’re free to make whatever adjustments you like for isostatic rebound and land level changes. Current rates of isostatic rebound from last glacial period amount to about +0.3mm/decade sea level.

          Your comment seems like a foolish Warmist attempt to divert and confuse, at least.

          Sea level change from melting the whole volume of Antarctic ice is an obvious corrollary. Comparable volume land ice melt out of the last ice age brought global sea level rise of 100+ meters.

          But sure, let’s wait until all the ice melts of Antarctica and colonise it. That should take about 1000 years according to the ‘warmists.’

          • Mike Flynn says:

            Quick. Quick. Run for the hills! The foolish Warmist Prophet of Doom says that Antarctica will be ice free by 3016, and sea levels will be either 70 or 100 m higher – he’s not quite sure.

            Whatever shall we do? Remove all CO2 from the air, and die of starvation?

            Foolish Warmist! You can’t really look into the future, can you? If you could, you’d own the world. I’m pretty sure the richest man in the world is not you.

            Maybe you’re like the rest of us – making assumptions. Or do you really believe the nonsense you utter about the future?

            Keep going – if you can’t make a living predicting the future, maybe you could hire yourself out as a butt for people’s jokes. On the other hand, I don’t even need to pay you for that, do I?

            Cheers.

          • barry says:

            I thought we were humouring the warmists? Lost your sense of humour?

          • David Appell says:

            Barry, Mike Flynn insults because he cannot formulate responses based on science.

            That’s very clear. Insults are the only response he can think of.

          • barry says:

            Yeah, the insults seem to be a reflex action, so I ignore them, but it gets boring when that’s the bulk of his posts, so now I scroll past his replies.

    • barry says:

      Fun fact: most of the Antarctic continent is the most thermally isolated region on the planet, due to circumpolar winds and ocean currents.

      Consequently, theory goes that this region will warm more gradually than the rest of the planet.

      • barry says:

        Fun fact: most of the Antarctic continent is the most thermally isolated region on the planet, due to circumpolar winds and ocean currents.

        Not to mention the rather large ice cube there.

        • Mike Flynn says:

          Another fun fact.

          Foolish Warmists say silly things like “most of the Antarctic continent is the most thermally isolated region on the planet”

          Sounds sciencey, but of course conveying nothing at all. Thermally isolated? Mostly? So it isn’t affected by volcanic activity, sunlight, darkness, laws of thermodynamics, and do on?

          I wonder if your clue is with the Trenberth’s missing heat, or Mann’s misding Nobel Prize. You certainly don’t seem to be in possession of a clue, let alone a fact.

          You might need to keep looking.

          Cheers.

        • barry says:

          Sounds sciencey, but of course conveying nothing at all. Thermally isolated? Mostly? So it isnt affected by volcanic activity, sunlight, darkness, laws of thermodynamics, and do on?

          You misunderstand. Antarctic region is less affected by other regions. Re horizontal heat transport, not diurnal cycle, volcanoes.

          The clues for comprehending this are pretty clear if you read my post without your jaundiced blinders. React less, think more.

        • Mike Flynn says:

          barry,

          What have other regions to do with the Antarctic?

          Foolish Warmist. The sun heats the surface – not the US, not the EU, not even China.

          Once the Antarctic was ice free. Now it’s not. Maybe horizontal heat transport forgot to pay the bills?

          Foolish Warmist!

          Cheers.

      • An Inquirer says:

        Well, that is one theory. Another theory is that it is the best place to observe CO2 influence on temperature. Other places are subject to AMO, PDO, El Nino, and other cycles — in addition to UHI — which make temperature trends subject to a multitude of variables. In the Antarctic, the impact of CO2 should be much more easy to distinguish.

      • barry says:

        Another theory is that it is the best place to observe CO2 influence on temperature.

        Really? Who says so?

      • barry says:

        In the Antarctic, the impact of CO2 should be much more easy to distinguish.

        I doubt it, for the reasons above.

        The Antarctic peninsula pokes out beyond the circumpolar winds, so measuring temps there might be best under both rubrics.

      • dave says:

        “Antarctic continent…will warm more gradually than the rest of the planet”

        Everbody knows about Polar cells, and ocean currents.

        Be more specific, please. What is the lag, in years, to the rest of the planet?

        • ray says:

          Why does Antarctica need to be warmed up by the rest of the planet? Doesn’t it have its own CO2? Does heat trapping not work there? Because there is so little water vapour the effect of increased CO2 in the atmosphere should stand out.

          Well, we are told that the effect of the CO2 DOWN THERE is to cool the place because the surface is frigid ice. By the same reasoning Greenland should be cooling. But it isn’t, it is the poster boy for warming. So the cooling effect doesn’t work UP HERE. Capricious stuff this CO2. Worse than a flirty girl.

          “The new work does predict that other places with frigid surfaces should see a reduced – but still positive – greenhouse effect. Temperatures in Greenland, however, are rising much faster than global averages, Rutherford [an environmental scientist] notes. That suggests that the effect doesn’t significantly affect surface temperatures there.”

          https://www.sciencenewsforstudents.org/article/carbon-dioxide-has-unexpected-effect-antarctica

          • barry says:

            ray,

            Why does Antarctica need to be warmed up by the rest of the planet?

            “Need?” My point was about Antarctica not being as much influenced by temps in lower latitudes. Greenland, on the other hand is less thermally isolated from neighbouring land-masses.

            I’m not sure how certain the theory is re the article, and it relates to central Antarctica, the coldest place on Earth, not the whole continent. True enough that a colder surface will emit less intense infrared, but beyond that it sounds pretty speculative.

            A major confounding factor in the Antarctic is changes in ozone levels (and CFCs). Ozone is both an absorber of UV rays from the sun and a GHG. Ozone levels dropped markedly to about 1995, and have been stable or slightly recovering since. How this has influenced surface temps is still in some doubt.

            It’s a good question about less WV, so CO2 influence should stand out. OTOH, the theory goes that WV increases with CO2 (warmer atmosphere/higher capacity for WV), and this amplifies warming, so if there’s less WV over Antarctica, there would be less surface warming under ‘warmist’ rubric.

            But if air temps increase, that should bring more WV and precipitation, causing more snow (this is one of the IPCC projections for the region). Yet another influence on temps.

            My point was not that the Antarctic is immune to changes in CO2 levels, but relatively thermally isolated from the rest of the planet due to the circumpolar currents and winds and the huge refrigerant of the massive ice sheets. IPCC projections to the end of the century (take ’em or leave ’em) have the Antarctic continent warming less than the rest of the planet – about on par with sea surface temps, which are also projected to warm more slowly than land-temps.

          • barry says:

            I was interested to read that temps in the central Antarctic can get lower than temps in the (lower) stratosphere. By contrast, central Greenland is 30C warmer.

            Here’s a link to the full paper mentioned in the article.

            http://onlinelibrary.wiley.com/doi/10.1002/2015GL066749/full

          • mpainter says:

            Yes, and that is why CO2 is said to cool the troposphere over Antarctica. Whoops!

          • barry says:

            Over a small part of central Antarctica, where surface temps can get lower than lower troposphere.

            Dunno if it’s true or not, but at least get the details right.

      • barry says:

        There’s plenty of research on projected temp changes in Antarctica, but I don’t now if anyone has expressed it in terms of a calculated ‘lag’ to global temps.

        • Mike Flynn says:

          Plenty of research on projected temperature changes? Foolish Warmist climatologists playing their toy computer games? Pretending to look into the future, perhaps?

          Consult an astrologer. Projections just as good, but won’t cost billions.

          Cheers,

  43. barry says:

    ENSO obs updates.

    NOAA have updated their ENSO table. The three-month period MJJ has NINO3.4 at 0.2, neutral territory for the first time by the metric.

    http://www.cpc.ncep.noaa.gov/products/analysis_monitoring/ensostuff/ensoyears.shtml

    Re monthly data, NINO3.4 region for July was -0.21, negative for the first time this year, but still neutral territory.

    http://www.cpc.ncep.noaa.gov/products/analysis_monitoring/ensostuff/ensoyears.shtml

    MEI ranks bi-monthly, and hasn’t yet updated. I expect the June/July value to be in neutral territory, likely positive.

  44. barry says:

    RSS anomaly change June to July: 0.467 -> 0.469

    • Mike Flynn says:

      barry,

      That’s a mighty fine thermometer you’ve got. Accurate to 0.002 C. How do you keep what you’re reading from changing its temperature? Or is it an arbitrary, adjusted, estimated, climatological temperature?

      I suppose you might even claim the Earth is heating due to the magical heating effects of CO2, but nobody except a foolish Warmist would believe you. Sit outside with your thermometer for a bit. You’ll find it varies more than 0.002 C while you’re looking at it.

      Cheers.

      • Mike Flynn says:

        barry,

        I’m not complaining. I’m just laughing at foolish Warmists who give credence to such nonsense. Just the same as the measurebators who compute sea levels within 0.01 mm. That’s rather less than the thickness of a human hair.

        Foolish Warmists.

        Dream on. Maybe your genocidal ideas may come to pass, one day.

        Cheers.

          • Mike Flynn says:

            David Appell,

            Foolish Warmists persistently ask irrelevant and foolish questions.

            You ask why I insulate my house. As I’ve said previously, I do it to keep cooler than would otherwise be the case. I live in the tropics. Foolish Warmists keep claiming insulation heats things, but they are ignorant of physics.

            Actually, insulators just reduce the rate at which energy moves from hotter to colder. My insulation prevents the interior from heating, not cooling.

            You ask why do I wear a coat? Once again, I repeat a desert Berber saying – “If I had known it was going to be this hot, I would have worn a heavier cloak.” The cooling effect is counterintuitive, but has been verified by researchers. The Bedouin wear black robes, which keep them just as cool in the desert sun as white robes, and don’t show soiling. An advantage where water is scarce. In the sun, I wear clothes (even a coat) to keep cool. In cold conditions, I wear clothes to reduce the rate of heat loss. My temperature doesn’t change much in either case – around 37 C.

            However, be that as it may, insulators, coats, blankets, CO2 – none actually raise the heat content of anything they surround. Foolish Warmists invoke magic insulators which supposedly raise the temperature of the Earth day by day, and night by night.

            This is complete nonsense, of course. Foolish Warmist Cargo Cult Scientism. Correlation is confused with causation, and fantasy is preferred to fact.

            Fell free to keep asking foolish Warmist gotchas.

            Cheers.

          • David Appell says:

            Your use of light and breezy insults is a poor attempt to cover up the fact that you don’t know any science, and never cite any.

            Insults are clearly the only thing you have.

            In fact, I can’t recall you ever citing any science, ever, not even once.

            Am I wrong?

          • David Appell says:

            “However, be that as it may, insulators, coats, blankets, CO2 none actually raise the heat content of anything they surround.”

            So why do you wear one when it’s cold outside?

          • David Appell says:

            Mike Flynn wrote:
            “In cold conditions, I wear clothes to reduce the rate of heat loss.”

            AHA!!!

            And that’s precisely what CO2 and other GHGs do — reduce the rate of heat loss.

            Like a coat keeps you warmer, that keeps the surface warmer.

          • David Appell says:

            Mike Flynn wrote:
            “In cold conditions, I wear clothes to reduce the rate of heat loss. My temperature doesnt change much in either case around 37 C.”

            What happens if you keep making your coat thicker and thicker?

          • Mike Flynn says:

            Foolish Warmist.

            You wrote –

            “AHA!!!

            And thats precisely what CO2 and other GHGs do reduce the rate of heat loss.

            Like a coat keeps you warmer, that keeps the surface warmer.”

            Gotcha gone wnrong. Insulator reduces the rate at which energy moves from hotter to colder. As in energy from the hot sun to the colder Earth surface. Some gotcha!

            Forget stupid irrelevant foolish Warmist analogies, if you wish. Addressing reality is usually more productive. You keep obsessing on coats on a body generating enough heat to maintain a constant surface temperature. Try something like the Earth, or a recently deceased corpse, perhaps.

            Foolish Warmists refuse to accept that the Earth has been cooling for four and a half billion years. It does not generate enough internal heat to maintain its surface in its original state – ie., molten.

            Foolish Warmist – you can’t cope with fact, so you try the worn out foolish Warmist ploy of deny , divert, and confuse.

            CO2 heats nothing. You can’t even suggest an optimal CO2 level.

            Venus is not Earth. Irrelevant. A corpse continues to cool, regardless of how well you clothe it.

            Can you provide a falsifiable hypothesis supporting your foolish Warmist nonsense? If you can’t, you’re merely parroting Cargo Cult Scientism of the Climatological variety.

            You may keep on calling it science, if you wish.

            Cheers.

      • barry says:

        Of course the accuracy isn’t that good. The figures are simply copied from RSS. I didn’t imagine anyone would be so utterly stupid as to make hay out of a 0.002 difference. But then you came along.

        Thanks once again for the wholesale fiction about what I believe. The lovely thing about straw men is that the supply is as large as your imagination. It’s the cheapest tinder out there. I’d suggest acquiring a higher value mental habit but that might be beyond your means.

      • barry says:

        Maybe your genocidal ideas…

        …don’t exist.

        You go, girl. Burn those straw men.

        • Mike Flynn says:

          barry,

          You quoted figures. Now you say that they are no good. Why quote useless figures? That’s the province of the foolish Warmist.

          As to strawmen, foolish Warmists cannot suggest an optimal CO2 concentration. They just whine about CO2 levels being too high, for some bizarre foolish Warmist reason.

          Reducing CO2 below that necessary to maintain plant life results in the destruction of the human race. Putting a limit on CO2 in the atmosphere limits plant life, and the limits of human growth. Foolish Warmists don’t care about humanity. They follow the dictates of the demented doomsayer, James Hansen.

          I prefer more food, not less. Therefore more CO2, not less.

          Go and starve if you wish. For me, more CO2 – good. Less CO2 – bad.

          What is your foolish Warmist optimal CO2 level? Now is your chance to try the foolish Warmist deny, divert, and confuse tactic. Good luck!

          Cheers.

          • David Appell says:

            “Reducing CO2 below that necessary to maintain plant life results in the destruction of the human race.”

            Strawman argument, since no one advocates that.

            The problem is anthropogenic carbon, not natural carbon.

          • mpainter says:

            Anthropogenic CO2 is entirely beneficial.

          • David Appell says:

            You make it so trivial to write you off.

            Thanks for that.

          • mpainter says:

            David, thank you for trivializing the benefits of atmospheric CO2.

          • Mike Flynn says:

            David Appell,

            I merely made a statement, which, I am glad to see, you actually quoted.

            Not an argument, as foolish Warmists cannot even suggest an optimal CO2 concentration. Nothing to argue about, as foolish Warmists are unable to actually suggest anything apart from reducing CO2 levels.

            And of course, they now realise that CO2 is plant fertiliser. Calling for limits to human food supplies seems to be further than foolish Warmists are prepared to go, if they are forced to acknowledge the outcomes of their mad preoccupation with fossil fuel use.

            Foolish Warmists. What do you consider to be optimal CO2 levels, and why? Why do support limits on world food production? How many people do you think should be condemned to starvation as a result of limiting CO2 (plant food) production?

            More CO2 good. Less CO2 bad. Care to produce some actual facts to the contrary? Guesses about the future are not facts, by the way.

            Over to you.

            Cheers.

          • mpainter says:

            David, thank you for trivializing the benefits of atmospheric CO2.

            I should finish my thought.
            With the hard-core AGW types like David Appell, it is “biosphere be damned, our cause is supreme, there shall be no more food for the biosphere above the level we decree”. So thanks for the window on your soul.

          • David Appell says:

            “Not an argument, as foolish Warmists cannot even suggest an optimal CO2 concentration.”

            They’ve been saying this for decades — how could you not have read about it?

            The optimal climate is the one we’ve already adapted to.

          • David Appell says:

            “More CO2 good. Less CO2 bad.”

            If more CO2 is good, why isn’t Venus a paradise, where the atmosphere is 96.5% CO2?

          • mpainter says:

            Don’t fret about Venus, David, we’re on earth

        • barry says:

          You quoted figures. Now you say that they are no good.

          ‘Not accurate’ is not the same as ‘no good.’

          I posted them because people here like to compare anomalies, that’s all. I posted without comment. Wasn’t selling anything. Then you blabbed some bulldust.

          I’ve tried being civil. You’re a waste of oxygen. ‘Bye.

          • doctor no says:

            Barry,
            I sympathise. This is always the case i.e. spending precious time trying to educate these uncivil morons.
            I find it more amusing to keep throwing real data in their faces rather than to argue their ignorant, petty and irrelevant points. That seems to shut them up (for a while at least).

          • dr.no'satroll says:

            Who’s the uncivilized moron here?

      • David Appell says:

        RSS isn’t measuring temperatures, they (like UAH) are calculating them from a model.

    • barry says:

      Thats a mighty fine thermometer youve got.

      Not my thermometer, bub. It’s not even a thermometer. Go complain to RSS.

    • barry says:

      UAH anomalies are also in 1000ths of a degree. You know who to complain to about that..

  45. ren says:

    “The El Nio Pacific Ocean warming event didnt continue to
    fade in July, and global average temperatures as well as
    averaged temperatures in both hemispheres and the tropics
    rebounded slightly during the month, according to Dr.
    John Christy, director of the Earth System Science Center at
    The University of Alabama in Huntsville. Temperatures tend
    to bounce around a little from month to month, even during
    general trends such as what we see as El Nios and La Nias
    come and go. Julys warming isnt unique. These little bumps
    also were seen in the cooling after other ENSOs.
    http://www.nsstc.uah.edu/climate/2016/july/july2016GTR.pdf

  46. nigel says:

    “between 55 and 60 percent”

    “dave” already posted it in this thread on August 1, although he said 50 to 60 percent.

  47. Bindidon says:

    People expecting a strong La Nina coming soon should have a look at Klaus Wolter’s MEI:

    http://www.esrl.noaa.gov/psd/enso/mei/ts.gif
    http://www.esrl.noaa.gov/psd/enso/mei.ext/ext.ts.jpg

    They well might be disappointed.

    Simply because mostly, a strong La Nina rather follows a weak El Nino than a strong one.

    Look at what followed the strongest Ninos of 1877/78, 1982/83, 1997/98, and at what preceeded the strongest La Ninas of 1872-77, 1893/96, 1916/18, 1954/57, 1973/77.

    • doctor no says:

      See also:
      http://www.weatherzone.com.au/climate/indicator_enso.jsp?c=nino34

      The 30-day average SOI up to August 5 is even less than a month ago:
      https://www.longpaddock.qld.gov.au/seasonalclimateoutlook/southernoscillationindex/30daysoivalues/

      This suggests that the current La Nina is a fizzer and that several people here are going to be mightily disappointed.

      LOL

      • geran says:

        “This suggests that the current La Nina is a fizzer…”

        “no dr”, you are always so hilarious. You apparently have very little knowledge about anything related to science.

        There is no “current La Nina”! It is just now forming. It will take months to become an “official” La Nina.

        The ENSO 3.4 area anomalies have already dropped almost 3C. Try to explain where all that heat went, “no dr”. Where is all that “missing” heat, anyway?

        Hilarious.

        • doctor no says:

          You sound confused.
          First you claim there is no La Nina but claim temperatures ‘have already dropped almost 3C’

          “Try to explain where all that heat went, no dr. Where is all that missing heat, anyway?”

          What has that got to do with anything? The “missing” heat goes wherever the heat always goes during these events. Your problem is that the current event looks like stalling, and amounting to something best described as “puny”.

          I suspect that the cooling trend has been stalled by the emergence of a Frankenstein pause!

          Hilarious.

          • geran says:

            “no dr” clearly does not know what a La Nina is.

            He clearly does not understand where the “missing” heat went.

            Yet, he believes he knows science!

            And, the funniest part is that he doesn’t understand why he is so hilarious!

          • ren says:

            2015 11 29.14 26.78 2.36
            2015 12 29.04 26.73 2.31
            2016 1 28.94 26.71 2.23
            2016 2 28.89 26.89 2.01
            2016 3 28.87 27.37 1.50
            2016 4 28.97 27.85 1.12
            2016 5 28.61 27.96 0.64
            2016 6 27.84 27.73 0.11
            2016 7 27.10 27.31 -0.21
            http://www.cpc.ncep.noaa.gov/products/analysis_monitoring/ensostuff/detrend.nino34.ascii.txt

          • geran says:

            And the BOM chart coincides nicely with the NOAA data.

          • geran says:

            When I asked “no dr” where the “missing heat” went, he then asked, “What has that got to do with anything?”

            He has no understanding.

            The heat from the ENSO waters moves to the atmosphere and then to space. We are now watching this via the UAH reporting of falling temps. The point “no dr” misses is that the “missing heat” is being “lost in space”. This phenomena is in direct conflict with the GHE theory which says that the atmosphere “traps” heat.

            Maybe “no dr” is also “lost in space”!

          • geran says:

            “phenomena” should, of course, be “phenomenon”, singular.

            (Up early, and only one cup of coffee!)

          • Norman says:

            geran

            You post: “The heat from the ENSO waters moves to the atmosphere and then to space. We are now watching this via the UAH reporting of falling temps. The point no dr misses is that the missing heat is being lost in space. This phenomena is in direct conflict with the GHE theory which says that the atmosphere traps heat.”

            Your misunderstanding of the GHE is what leads you to see a conflict where there is none. Empirical data of the GHE will clearly show how the GHE works.

            During the day, the upwelling IR rises at a much faster rate than the downwelling IR. The net IR decreases during the day and the GHE is less effective (but still there). If the Pacific dumps a lot of energy into the lower atmosphere, raises the temperature, the GHE will still take place but the upwelling will be at a higher rate and result in cooling.

            http://www.esrl.noaa.gov/gmd/webdata/tmp/surfrad_57a5dba72c5be.png

            If the link works you can view many locations and different days with different weather patterns. The general point of the data is the GHE is always present (downwelling IR) but is less effective as the Earth’s surface warms.

          • Norman says:

            geran

            Here is the link of actual measured values (not based upon your incorrect belief system).

            You should attempt to plot some graphs and then you may properly come to understand the GHE effect and how it really works instead of getting it wrong.

            http://www.esrl.noaa.gov/gmd/grad/surfrad/dataplot.html

          • geran says:

            Here comes Norm with his clueless pseudoscience again!

            Norm you always try to dance around the issue. The “heat” is leaving the atmosphere! The atmosphere is NOT trapping the “heat”.

            None of your “spin” will change the facts.

            Hilarious.

          • geran says:

            And Norm, your continuing re-definition of the GHE is hilarious.

            “If the Pacific dumps a lot of energy into the lower atmosphere, raises the temperature, the GHE will still take place but the upwelling will be at a higher rate and result in cooling.”

            Now, your “new” GHE is cooling the planet!

            Hilarious.

          • Norman says:

            geran

            I think it would help you if you did take the time and slight effort and click on the links I provided. They would explain a lot.

            There must be a something inside you that does not want to face the reality so you avoid it and just keep right on posting.

            If you would, click on link to answer the question correctly.
            http://www.esrl.noaa.gov/gmd/webdata/tmp/surfrad_57a5f20454e55.png
            Question for you. You have a surface that is emitting around 625 Watts/m^2. If you had no GHE, energy would leave at this rate (625 joules/sec-m^2). The surface material has a set number of joules based upon its temperature and make-up (heat capacity of the material).

            Now with the GHE you also have 425 Watts/m^2 returning to the surface. Your surface loss with GHG present is now at the rate of 200 Watts/m^2.

            So which surface cools at a greater rate? The one losing 625 joules/sec-m^2 or the one losing 200 joules/sec-m^2?

          • geran says:

            Norm, when you lose the point, which is every time, you try to move on to more pseudoscience. Let’s just stay with your new definition of the GHE: The GHE “cools the planet”.

            When did you first realize the atmosphere cooled the planet? You didn’t actually listen to me, did you?

            Hilarious.

          • Norman says:

            geran

            GHE does not warm the planet in a direct fashion and no scientist is making this claim. It slows the rate energy leaves the surface.

            You have to think slightly above a linear processing capability. There is not just one process going on with the Earth’s surface. It is not just “cooling” it has a constant source of energy input from the Sun. The term constant is because the total solar irradiance reaching the Earth varies little over time.

            If you have two surfaces receiving the same constant flux of radiant energy and the first surface is losing energy at a faster rate than the second, the second surface will be warmer than the first.

            In the Earth system the surface receives energy from the Sun. With GHE the net loss from the surface is considerably lower than with no GHE so a surface with GHE will become warmer than one without such an effect.

            It is basic and simple mathematics that explains it. On the previous post I actually demonstrated the effect using simple math.

          • geran says:

            Norm, as you can probably understand, when you start rambling in circles, I just skip over your comment.

            But, when I do take the time to actually read what you write, I come up with some really choice pseudoscience. Like once you wrote:

            “The energy does NOT leave the system, but the energy leaves the system.”

            Hilarious.

    • Bindidon says:

      Again: it makes few sense to restrict a La Nina prediction to Nino3.4 SST or, like this unbelievable Werner Brozek regularly tries at WUWT, to predict a La Nina behavior out of UAH temperature records.

      It is much better and much reliable to use combined indices like e.g. ONI or MEI.

    • Bindidon says:

      And let us ALL keep in mind the following:

      An El Nino or La Nina event is identified if the 5-month running-average of the NINO3.4 index exceeds +0.4 C for El Nino or -0.4 C for La Nina for at least 6 consecutive months.

      So wait and see, we’ll have time enough in october/november to discuss what’s really going on.

    • Bindidon says:

      ‘This phenomena is in direct conflict with the GHE theory which says that the atmosphere traps heat.’

      No, geran.

      The GHE theory does not say that.

      It says that not all IR heat is evacuated to space.

      A part of what is not is kept in the atmosphere, what leads to an accumulation of water vapor there; a part of it is reemitted back to the surface.

      That’s all.

  48. Bindidon says:

    The correct trend for UAH6.0beta5 including the July 2016 anomaly seems to be 0.123 +- 0.008 C / decade.

  49. Bindidon says:

    Ooops?! Roy’s site seems to have literally eaten a comment posted around 01:30 AM MEST…

  50. Bindidon says:

    An interesting experience: comparing UAH6.0beta5 with the Multivariate ENSO Index (MEI)

    http://fs5.directupload.net/images/160806/lwqe59ou.jpg

    MEI was scaled down by 50% and shifted 4 months to offset the lag between ENSO and its troposphere response.

    Two interesting ‘moments’: look at 1982-83 and 1991-93.

    There we see that the UAH anomalies are much lower in comparison to other El Nino events.

    Maybe this is due to The eruptions of El Chichon (1982, VEI 5) and Pinatubo (1991, VEI 6).

    • doctor no says:

      Bindidon, thanks for sharing your analysis.
      Just a comment:
      In this case the UAH data exhibits a positive trend reflecting global warming whereas the MEI index, because of its design, has no long-term trend. Therefore, the choice of baseline period can affects the interpretation. For example, if you choose a different period, (e.g 1979 to 1999) you can get the the anomalies to align early on but the UAH values will appear to be overestimates at the end of the series. Secondly, since UAH reflect global conditions as opposed to just equatorial Pacific conditions, there is no reason to expect the anomalies to be identical. Nevertheless, the 1980 to 2010 baseline is as good as any and the UAH anomalies do appear relatively small in 1982-83 and 1991-93. As you suggest, volcanic eruptions is a plausible explanation.

    • barry says:

      It’s not just ENSO and temps. There is worldwide natural variability that is not accounted for in Klaus’s values.

    • barry says:

      The two volcanic events are well-known to have depressed temps for a few years in all the records. But there’s still more natural variation unaccounted for.

  51. Bindidon says:

    I see somewhere above:

    David Appell says: August 5, 2016 at 9:32 PM

    This will lead to the realization that CO2 is redundant to water vapor and clouds in its radiative properties and, in fact, adds nothing to the thermalization by the atmosphere of surface radiation.

    What observational data supports this interpretation?

    mpainter says: August 5, 2016 at 11:24 PM

    Absorbency spectra.

    Well mpainter… the problem with you and geran is that you always produce words in answer to our links to information.

    None of you answers with such links.

    • mpainter says:

      Bindidon

      Clouds, too. The contribution of CO2 to the GHE is very nearly 100% redundant to wv and clouds, hence no of no significance in climate.

      • Tim Folkerts says:

        Not at the top of the troposphere, where there is alomst no water vapor and almost no clouds.

        Try playing with MODTRAN to see the effects — add or remove CO2, H2O and/or clouds to see that CO2 has definite effect above and beyond what water does.

        • geran says:

          Riiiiiiight!

          Climate models again!

          You got to love the comedy.

        • Norman says:

          Cloudless Nevada site:
          http://www.esrl.noaa.gov/gmd/webdata/tmp/surfrad_57a63d6e9e8b3.png

          Clouds seem to have a huge impact on the Downwelling IR measurements. I am not sure mankind’s addition of some carbon dioxide will do much to influence the downwelling IR.

          • mpainter says:

            Norman, clouds radiate through the “atmospheric window”, that is, DWLWIR that is not absorbed by the atmosphere. CO2 has nothing to do with that. Another fact that the AGW crowd forgot to tell…if they ever knew.

        • mpainter says:

          Tim, thanks for your response, but we have been here before.

          Water vapor, clouds above radiating level is shown by cirrus, contrails. Sources put ERL at 8-10 K meters, cirrus at up to 12 K meters. Clouds play a role in radiation to space that is ignored by AGW.

          Operative word: ignored. This will change.

          In any event, doubling CO2 does not change radiation to space on a theoretical basis. Do the math.

          • Tim Folkerts says:

            No, clouds are NOT ignored! All models include the effects of clouds. Now, they certainly don’t model the clouds perfectly, but saying clouds are ignored is just silly. How about pointing us all to a major climate model that does NOT have clouds?

            Yes, adding CO2 DOES change the radiation to space — in two ways.
            1) More CO2 broadens the shoulders of the bands (eg near 15 um), .
            2) More CO2 at the higher altitudes blocks outbound radiation from lower altitudes better.

            Both of these mean that brighter, warmer, more intense IR from lower warmer areas is replaced with dimmer, cooler, less intense radiation from higher. Less IR leaving means more warming.

            The math was done (among other places) at the MODTRAN site I linked to. go take a look.

          • mpainter says:

            I did not say that models ignored clouds. Fine way to twist my meaning, while you _ignore_ the fact that clouds radiate to space in the CO2 band. And water vapor, too. CO2 is redundant to water at all levels in the troposphere.

          • barry says:

            There’s overlap, but WV/clouds do not radiate in exactly the same bands as CO2, and especially not in regions of the atmosphere that are drier than those with clouds.

            TOA, in terms of radiation to space, is about 6km altitude.

          • mpainter says:

            Dead wrong, Barry. Clouds absorb and radiate in the same bands as CO2, and more effectively.

          • mpainter says:

            TOA is 10-12 km. You are uninformed and confused, Barry, as usual.

          • Tim Folkerts says:

            Mpainter,
            Go look at MODTRAN (which is NOT a climate model, but rather a model for atmospheric propagation of electromagnetic radiation. Play with clouds and CO2 and water vapor levels when looking down from 70 km (ie above the vast majority of the atmosphere).

            See if there is ANY way you can get clouds or water vapor to mask the effects of CO2, even though they “overlap”.

            http://climatemodels.uchicago.edu/modtran/

          • mpainter says:

            Tim, thanks for your response.
            This skeptic sees Modtran as another opaque model device from another AGW zealot: Pierrehumbert. What effort has been made to quantify and partition TOA radiation in the tropics, for example? Clouds emit in the CO2 spectrum.
            Modtran makes what assumptions in this regard? The sea surface is opaque to LWIR, yet AGW ignores this. Why should we believe that the Modtran devisors treat clouds properly?

            I am skeptical of any model devised by the uchi AGW crowd, sorry. My assumption is that they make no effort to distinguish cloud and water TOA from CO2 TOA in the shared wavelengths.

          • mpainter says:

            Tim, it is another snarl of unsustainable AGW assumptions in the matter of upper troposphere physics. Some of these are just plain wrong, as per observations. The whole AGW scheme falls apart when examined closely. This includes the assumption that atmospheric water/CO2 shared wavelengths are radiated TOA only by CO2. I happen to know better.

          • Tim Folkerts says:

            “This skeptic sees Modtran as another opaque model device from another AGW zealot: Pierrehumbert.”

            Why would you choose to see MODTRAN as something completely different from what it is? I could choose to see the moon landing as a hoax, but that doesn’t make it so.

            Here is what MODTRAN is:
            “MODTRAN is an atmospheric radiative transfer model developed by Spectral Sciences Inc. and the US Air Force Research Laboratory. It has been extensively validated and serves a a standard atmospheric band model for the remote sensing community.”

            * From the USAF; not Pierrehumbert.
            * A radiation model; not a climate model.
            * developed for remote sensing; not climate prediction.

            So unless you think the whole remote sensing industry and the USAF are secretly run by Pierrehumbert, I don’t see how your claims are even remotely possible.

          • mpainter says:

            Tim, your link is to the U of Chi, thus my supposition concerning the origins of Modtran.

            Regarding your claim that there is not water vapor and clouds in the upper troposphere, B.S. button.

            Regarding your claim that clouds and wv in the upper troposphere do not radiate to space, B.S. button on that.

            Regarding your claim that clouds and water vapor do not emit TOA radiation in wavelengths shared with CO2, B.S. button on that.

            To the extent that you cite Modtran to support your B.S. claims, B.S. button on that.

            Model thumping is not for me. I lack that kind of faith, no thanks.

          • Tim Folkerts says:

            You said originally that “The contribution of CO2 to the GHE is very nearly 100% redundant to wv and clouds”. I was pointing out that this claim is wrong in the upper troposphere, by showing calculations that show a clear impact. Calculations based on models used extensively by engineers for real-world problems.

            “Regarding your claim that there is not water vapor and clouds in the upper troposphere, B.S. button.”
            I never made any such claim. There is a huge middle ground between your original “CO2 is unimportant” and your strawman that “there is not water vapor and clouds”.

            There IS water vapor in the upper atmosphere. There are a few clouds there as well. The calculations are perfectly capable of handling this.

            Sorry, you can’t sweep away good science with strawmen.

          • barry says:

            TOA is 10-12 km. You are uninformed and confused, Barry, as usual.

            You’re referring to the height of the tropopause, I suppose.

            TOA in terms of the energy budget is that height in the atmos where energy out = energy in. It’s rarely expressed as an altitude because it is variable depending on local conditions.

            At what altitude do you think energy in = energy out? At the tropopause??

          • mpainter says:

            Tim, you need to do some science.

            Your claim of “Straw men” is a dodge. Model thumping is all you have at this point. Does not impress. I have studied the spectra.

            Barry, right TOA radiation occurs below the tropopause. Tim claims “almost no wv or clouds” at that level and that is B.S., but he refuses to correct himself.

            Once again, CO2 makes little or no contribution to the GHE. The so-called “shoulders” are already absorbed by the atmosphere.

          • barry says:

            Well, my memory failed me. TOA reference height (per radiation budget) is generally considered about 20km, not 6km, as I wrote.

            http://adsabs.harvard.edu/abs/2002JCli…15.3301L
            http://mynasadata.larc.nasa.gov/glossary/top-of-atmosphere-2/

          • barry says:

            First link failed: try this.

          • barry says:

            mpainter, more GHGs in the atmos will increase warming even if gases already present absorb across the spectrum that additional gases do. WV does not some how get in front of other gases and prevent them from absorbing. Add GHGs and radiation has a thicker medium to pass through. Additional CO2 is still absorbing and re-emitting, slowing the rate of escape of thermal energy from the surface. (But CO2 has bands that WV does not absorb, and other bands than WV only weakly absorbs)

            ‘Saturation’ doesn’t mean that radiation stops. Photons don’t get ‘trapped’. They are absorbed, re-emitted and absorbed again. CO2 molecules don’t get magically bypassed

          • mpainter says:

            Barry, get an education.

          • mpainter says:

            Tim, Will Janoshka below calls BS on your Modtran.

            As usual, the last resort of the AGW proponent is to trundle out an opaque model and make pseudoscience claims based on model products. Sorry to see you do the same.

          • mpainter says:

            Correction, Janoschka

      • Norman says:

        mpainter

        Here is an excellent and thoughtful post on the previous thread:
        http://www.drroyspencer.com/2016/07/the-warm-earth-greenhouse-effect-or-atmospheric-pressure/#comment-219394

        I am looking at some data and you may be correct on your understanding. I hope you are not an anti-science denier like Mike Flynn or geran who cannot seem to understand the GHE at all. It looks as if you may accept it as valid science but are questioning the contribution of mankind’s emission of Carbon Dioxide via burning oil and coal.

        Also Tim Folkerts, it would not be a matter that it has some effect, it is about how large of an effect it would be.

        Looking at this data it looks as if mpainter is on to something with the clouds.

        http://www.esrl.noaa.gov/gmd/webdata/tmp/surfrad_57a62b6b41e1f.png

        Cloudy Sioux Falls, South Dakota:

        • geran says:

          Norm, if the energy does NOT leave the system, but the energy leaves the system, is the system warming or cooling?

          I’m sure you will show all the math.

          Hilarious!

          • Norman says:

            geran

            I have already done the math for you on the previous post. It seems math is not a strong point in your educational background. There would be little reason to show it again. You can look at the previous thread if you want to see some math.

            http://www.drroyspencer.com/2016/07/the-warm-earth-greenhouse-effect-or-atmospheric-pressure/#comment-218472

          • geran says:

            Norm, something tells me you would not be willing to compete with me in an upper level math test. (Especially for $$$)

            I can imagine you couldn’t even solve a basic differential equation.

            (Now Norm is looking for a link to differential equations!)

            Hilarious.

          • Norman says:

            geran

            I don’t think it is possible to advance to higher level mathematics when you are unable to understand even simple addition and subtraction.

            Math Test Challenge for you:

            If you have 10 apples in a basket and every minute you add two apples but remove one apple from the basket, after 10 minutes will your basket have more apples in it? (GHE, losing less apples per minute than non GHE case)

            Now to really tax your brain.

            If you have 10 apples in a basket and every minute you add two apples but also remove two apples from the basket, after 10 minutes will your basket have more apples in it? (No GHG present)

            GHE does not require high level math to understand it. You need the higher levels to work on the details but not the basic concept.

            You seem to have no ability to comprehend the most basic fundamental aspect of GHE and why the GHG will lead to a higher elevated surface temperature relative to a none GHG atmosphere.

            You have measured empirical evidence to look at. You have the moon to reflect upon. If you took higher math you really wasted your time since you missed the simple math, addition and subtraction.

          • geran says:

            Norm, you continue with examples that you believe support your pseudoscience. Yet you espouse nonsense like “the energy does NOT leave the system, but the energy leaves the system”.

            If you actually seek science, the falling UAH temps invalidate the GHE.

            Your choice–science or pseudoscience.

            (I bet I can predict your choice.)

          • Norman says:

            geran

            geran: “If you actually seek science, the falling UAH temps invalidate the GHE”

            GHE is confirmed by real world measurements of downwelling IR.

            No this does not invalidate the GHE. Global temperatures can rise and fall and I think clouds have a huge impact. That does not negate the GHE. It could invalidate CAGW but that is a hypothesis I do not subscribe to.

            There is GHE: (established verified and measured fact that Mike Flynn and geran are not able to understand how it works, Dr. Roy Spencer knows how it works and accepts is as proven science…validated by real world measurements)

            There is AGW: Most scientists accept an increase in surface temperature because of mankind’s actions of burning fossil fuels.
            The amount of warming is highly debatable.

            CAGW: Skeptical Science peddles this and I would agree with you, geran, that this is pseudoscience…it is an unproven, untested hypothesis based upon potential feedback mechanisms which have not yet been demonstrated to be valid. Currently it would appear that the climate models suggesting this hypothesis are not making any useful predictions about future warming (demonstrated by Dr. Spencer)

          • geran says:

            Norm, you are now trying to twist the GHE to be something other than described by the IPCC. You were wrong, and now you are trying to weasel out of it. Not a surprise.

            The IPCC clearly described atmospheric CO2 as a “heat source”. (See the Arrhenius CO2 equation.) They were wrong. Folks that got deceived, instead of admitting that they got tricked, are now trying to claim the normal atmospheric heat transfer mechanisms are the “new GHE”.

            You only trick yourself.

    • geran says:

      Bin, I don’t do “links”. Those are often corrupted by pseudoscience. I can refer you to some really go physics books, if you’re interested…..

    • Bindidon says:

      And if Dr Spencer’s robot was a bit more comprehensive, I would have added quite a lot more information.

      All subsequent comments I tried to send were simply dropped.

      Jesus what a primitive site…

  52. ren says:

    Does anyone believe that the cycles of circulation in the oceans depend on CO2?
    http://woodfortrees.org/plot/esrl-amo
    http://climexp.knmi.nl/data/ipdo.png

  53. ren says:

    See temperature anomalies in the Atlantic (including Hudson Bay)
    http://oi64.tinypic.com/2crjzo2.jpg
    http://www.accuweather.com/en/hurricane/atlantic

    • Conor says:

      REN

      Check SSTs Atlantic 1945/64 mean values. 1N 20N : 1W 30W

      Produce a month by month animation or better still send your e address and I will post a ppt with the stuff already done.

  54. The bottom line is this period of time in the climate is in no way unique or different from previous warm spikes the climate has had since the Holocene Optimum. This period of time is not only not as warm as previous spikes of warmth in the climate such as the Roman and Medieval warm periods to name a few but does nothing to alter the fact that the climate since the Holocene Optimum some 8000 years ago has been in a gradual cooling trend with spikes of warmth within this gradual cooling trend.

    If one evaluates the climate since the Holocene Optimum until today and takes into consideration Milankovitch Cycles and superimposes solar activity upon this and further refines this with volcanic activity and more recently more reliable ENSO data a very good correlation will be shown to be established between these factors versus the resultant climate. Further if CO2 is put into this mix one will find a zero correlation between the climate and CO2 concentrations.

    So all this talk about this period of time in the climate being unique is a bunch of BS.

    Further now it looks likely very low solar conditions should prevail for many years going forward and this should end this current warm spike, which has probably most likely already ended and a down trend in temperatures should be the rule for the foreseeable future from here on out.

    If one applies the past climate data since the Holocene Optimum through the present and tries to link it to CO2 it is not going to work.

    • Conor says:

      Salvatore Del Prete

      Destouni and Jaramillo 2015: http://science.sciencemag.org/content/350/6265/1248

      Humans have affected the atmospheric H2O content by 10,000 km3. This allows more UV to penetrate particularly to the ocean’s surface, since OHC is 93% (and counting) of the observed GW we should be concerned about this man made issue. The CO2 BS is an agenda encouraged by various environmentalists and other interest groups, who are getting in the way of the real problem. AGW is real, but ill defined atm.

    • Bindidon says:

      So all this talk about this period of time in the climate being unique is a bunch of BS.

      Sometimes one has the impression to commnunicate with children.

      Salvatore Del Prete: why do you think
      – of microscopic details like similarities between the actual climatic context and those which occured 1,000 or 5,000 or even 100,000 years ago,
      and not
      – of the societal, technological, economical and financial aspects depending on a preservation of the actual climatic parameters?

      For me it is simply incredible that adults can think so simple.

      Even just 2,000 years ago, we were still no more than 300 millions of humans, without any of all these highly climate-sensible aspects building today a huge network without which today’s Humanity is unable to survive for long.

      Please talk with persons busy in insurance and above all reinsurance! They will laugh at your rather unluckily simple-minded comments.

  55. Conor says:

    Bindidon

    Who are your comments referring to? I had already contacted Lloyds of London Insurance – they didn’t get back – doh.

  56. The data thus far shows AGW is not real, again this period is not unique and is not even close to what global temperatures approached during the Holocene Climatic Optimum.

    In addition the global temperature trend I think will be down going forward.

    We shall see the test is on low solar versus co2 increases. I am in the solar camp.

  57. Holocene – History of Earth’s Climate – dandebat.dk

    dandebat.dk/eng-klima7.htm

  58. http://dandebat.dk/eng-klima7.htm

    The data which shows this period of time in the climate simply is not unique.

  59. Bindidon says:

    I come back to a previous comment (which of course concerned TLT): August 5, 2016 at 4:48 PM

    The correct trend for UAH6.0beta5 including the July 2016 anomaly seems to be 0.123 +- 0.008 C / decade.

    This was a reaction on various correction remarks on Dr No’s comment telling about ‘The trend in temperatures since December 1978 is now +1.21 degrees per decade.’

    That 0.002 C delta per decade was irrelevant, but other, bigger differences made me a bit suspicious, and I decided not only to add the July increment to my 6.0beta5 table, but also to download the complete dataset into another Excel table.

    Pretty good idea!

    First you think of some little rounding errors corrected: OK!

    But then you see at zonal positions 25, 26 and 27 (USA48, 49 and Australia) a really huge difference between the two.

    Here is a comparison of 10 of the 27 OLS trends for the two ‘revisions’ (old … new):

    Globe..: 0.123 … 0.122
    NH…..: 0.149 … 0.146
    SH…..: 0.096 … 0.095
    Tropics: 0.117 … 0.115
    NoExt..: 0.170 … 0.167
    SoExt..: 0.080 … 0.079
    NoPol..: 0.246 … 0.239
    SoPol..:-0.011 …-0.012
    but
    USA49..: 0.189 … 0.152 (!!!)
    AUST…: 0.236 … 0.154 (!!!)

    Whats happening here? Did I miss something important?

    Any comment a bit more intelligent than ‘AGW RIP’, ‘Pseudoscience’, ‘Hilarious!’ or ‘Foolish Warmist’ and the like, will be welcome.

    • Your post is meaningless and is just more AGW propaganda which has nothing to stand on if one looks at past climatic history.

    • mpainter says:

      No warming since the step-up in the late twentieth century. No warming in sight. No El Nino spike-hype for 15-20 years. AGW RIP.

      Or you can continue to dodge the facts, blind ion.

    • geran says:

      Bin, you set a pretty high standard. It’s hard to submit a comment more intelligent than “AGW RIP”, “pseudoscience”, “hilarious”, or “Foolish Warmist”, but let me try.

      How about “Nice cherry-picking”?

    • Mike Flynn says:

      Bindidon,

      Only foolish Warmists would believe nonsensical temperatures measured to 0.001 C, particularly if measured remotely at great speed, over a wide area, and from a constantly changing temperature source of constantly changing albedo, not to mention at different absolute times.

      Or thousandths of a degree per decade? You cannot store heat from day to day, or even decade to decade. Try it if you don’t believe me. You may attempt to use the magical heat trapping powers of CO2 if you wish.

      Ah, the power of Cargo Cult Scientism. I’m sure some believers really thought that the Nobel Committee actually awarded a Nobel Prize for Science to the aspiring second rather Michael Mann. Who could really be that silly? Even foolish Warmists should be less gullible.

      If you want to discuss real science (rather than RealClimate pseudo-science), feel free.

      Firstly, maybe we could agree that the Earth’s surface cools in the absence of sunlight – say at night. If you can’t accept such an easily observable fact, no basis for discussion exists.

      A simple question – does the surface cool at night? The answer seems to be self evident – yes, it does. Do you agree, and do you wish to continue?

      Cheers.

  60. Whats happening here? Did I miss something important

    YEA LIKE THE LAST 8000 YEARS OF CLIMATIC HISTORY.

  61. The AGW enthusiast are oblivious to past climatic history because it shows how ridiculous their argument is that this period of time in the climate is somehow unique.

  62. Bindidon says:

    Again a comment thrown away!
    That’s enough, bye bye…

  63. Mike Flynn says:

    And still, in spite of the models, the Earth has cooled for four and a half billion years.
    And still, in spite of the models, the surface cools at night.
    And still, in spite of the models, nobody has ever managed to heat anything using CO2.

    Foolish Warmists deny facts, instead dancing at the end of the wildly gyrating Conga line led by a few deluded bearded balding bumbling buffoons.

    Has the Earth cooled since its creation? Yes.
    Does the surface cool at night? Yes.
    Has anybody ever performed a repeatable experiment heating anything with CO2? No.

    Foolish Warmists – wasting their lives avoiding facts, and denying the evidence of their own lying eyes.

    No doubt the universe is unfolding as it should.

    Cheers.

    • Conor says:

      Mike Flynn

      Unfortunately you are been distracted from the core issue of H2O – humans affecting this component 290 times more than our affect upon CO2. AGW is real, but the anti-emissions lobby are making so much money out of their franchise that they obscure anything that threatens their territory.

  64. The AGW scam has a good chance to end before this decade is out.

  65. Norman says:

    Mike Flynn

    You declare: “And still, in spite of the models, the Earth has cooled for four and a half billion years.

    Do you mean the surface or the entire Earth?

    This suggests the core is slowly cooling at 100 C/ billion years (which is just a guess).
    https://en.wikipedia.org/wiki/Inner_core

    If you mean the surface, the available evidence (which may have many flaws) then it has shown no overall cooling or warming for at least 800,000 years.

    http://earthobservatory.nasa.gov/Features/GlobalWarming/images/epica_temperature.png

    It fluctuates but it seems to be at a stable equilibrium point in-between the range of 15C. You can still have an equilibrium condition (like night and day Earth) in a sine wave. As long as the trend is not going up or down over time but fluctuates within a range it is still in equilibrium.

    • Mike Flynn says:

      Norman,

      Both.

      The current rate of cooling (of the whole Earth) is a matter of disagreement between geophysicists, with estimates based on measurements varying between one and three millionths of a K at the surface per annum.

      Unfortunately, in the absence of a perfect insulator, the core cannot cool at the same time as the surface heats, or remains at the same temperature, in lieu of some enormous increase in external energy supply. There is a thermal gradient from the centre of the Earth to the nominal 4K of outer space, and heat moves from hotter to colder. No little reverses – at least not according to the laws of thermodynamics as currently understood.

      Nobody has actually measured the absolute temperature of the surface with any useful accuracy or precision, either now, or in the past.

      There is no equilibrium, but trying to measure averages of the heat content of the Earth in terms of millionths of a degree change in overall constantly changing surface temperature is an exercise in fantasy.

      No heating due to CO2. None. Much local but ephemeral heating due to processes leading to the production of CO2. Combustion of fossil fuels, oxygen breathing carbon based life forms, etc. add in all the other heat from things like atomic fission, and pretty soon you can measure increases in temperature – even at night when the Sun isn’t shining!

      Cheers.

  66. Mike Flynn says:

    Some foolish Warmist wrote the following-

    “In the Earth system the surface receives energy from the Sun. With GHE the net loss from the surface is considerably lower than with no GHE so a surface with GHE will become warmer than one without such an effect.”

    Sciencey nonsense.

    Approximately half the surface receives energy from the Sun at any given time. Although some of NASA’S colourful graphics show the Sun illuminating all the continents at once, I assure the writer that it is not true. Obviously, NASA has it’s fair share of foolish Warmists.

    No foolish Warmist can actually define the GHE in scientific terms. And foolish Warmist who believes that the GHE exists indoors, at night, or generally in the absence of sunlight is not terribly realistic.

    If the writer believes that the atmosphere has insulating properties (as does Raymond Pierrehumbert), why not just say so? At least other scientists might be able to understand. They might also choose to explain how insulators operate, as the writer seem remarkably unaquainted with the physics involved.

    No magic. No heating of the surface in the absence of an external heat source. Even with the Sun, the surface has managed to cool by several thousand K since its creation.

    If I have made any factual errors, I would appreciate correction. I doubt correction, if any, will come from the writer of the quote, as he doesn’t seem very knowledgeable about physics.

    Cheers.

  67. Norman says:

    Mike Flynn

    Why do you have such a difficult time understanding the GHE effect.

    Cooling at night does not invalidate the theory. The rate of cooling is what validates the GHE.

    Maybe read through this previous Dr. Spencer about the GHE on cooling rate.

    http://www.drroyspencer.com/2015/04/why-summer-nighttime-temperatures-dont-fall-below-freezing/#comments

    • Mike Flynn says:

      Norman,

      You challenge nothing that I have said. You can’t even define the GHE, let alone provide its properties. You talk about a theory, which once again you can’t actually state in scientific terms.

      Some science!

      Foolish Warmist!

      Cheers.

  68. The greenhouse gas effect is a result of the climate not the cause.

  69. Norman says:

    Mike Flynn

    Empirical evidence for the GHE that you will no accept.

    http://www.esrl.noaa.gov/gmd/webdata/tmp/surfrad_57a696e27173a.png

    With the GHE in place the Earth’s surface, at the linked location (Nevada), is losing energy at a rate ranging from 100 watt/m^2 at night to around 200 watt/m^2 during the daytime. Without the GHE the surface would be losing energy at the rate of 500 watt/m^2 at night to 600 watt/m^2 per day.

    It becomes painfully obvious that with a GHE the temperature will not drop as much as without the effect.

    http://www.esrl.noaa.gov/gmd/grad/surfrad/dataplot.html

    Look at other locations, dry, wet etc. Each has a GHE.

    • Mike Flynn says:

      Norman,

      Foolish Warmist.

      You can’t accept that insulators work in both directions. Greenhouses are irrelevant, but foolish Warmists don’t understand greenhouse operation or insulators.

      No CO2 heating. Freezing water radiates heat at over 300 W/m2. Foolish Warmists don’t understand physics, which is why someone like Gavin Schmidt (a relatively obscure mathematician) is anointed as a self proclaimed climatologist.

      The world has cooled, in spite of all the hugely expensive toy computer games saying otherwise.

      The atmosphere has an insulating effect. It has been measured. It heats nothing, just as any other insulator. The Earth is cooling, and no amount of insulation will heat it up.

      Foolish Wamist. Pray for a miracle, if you wish. I wish you luck.

      Cheers.

  70. Norman says:

    Mike Flynn

    Also established physics confirms a radiative GHE will take place in with GHG present.

    http://emerald.tufts.edu/as/tampl/en43/lecture_notes/images/eq1_6.gif

    If linked correctly this is the basic heat transfer equation for an enclosed object (Earth’s surface). From this source.
    http://emerald.tufts.edu/as/tampl/en43/lecture_notes/ch1.html

    All radiative heat transfer equations are similar. The big thing to note is the temperature of the wall or surrounding enclosure will effect the heat rate transfer. The hotter the wall the less heat the object will transfer so it will cool slower. If it has a constant input of energy (as does the Earth system) the object will reach a higher temperature if the surrounding wall is at a higher temperature than a previous state.

    • Mike Flynn says:

      Norman,

      Unfortunately, there is no wall around the Earth. Light reaches the surface from stars, planets, the Moon, satellites, stellar bodies, and the background light ever present throughout the universe.

      Conversely, light, or EMR if you prefer, emitted by the Earth’s surface is seen from space, from the Moon, and just keeps going.

      Infrared pictures taken by satellites of the Earth’s surface through the atmosphere show that the atmosphere is transparent to infrared of those wavelengths. Maybe you don’t actually understand the strange interaction between light and matter.

      Foolish Warmist, confusing the radiative effects of sunlight with the magical heating powers of CO2.

      From your link –

      “Radiative heat transfer does not require a medium to pass through; thus, it is the only form of heat transfer present in vacuum. It uses electromagnetic radiation (photons), which travels at the speed of light and is emitted by any matter with temperature above 0 degrees Kelvin (-273 C). Radiative heat transfer occurs when the emitted radiation strikes another body and is absorbed. We all experience radiative heat transfer everyday; solar radiation, absorbed by our skin, is why we feel warmer in the sun than in the shade.”

      And at night, do you cooler or warmer in the shade? Does CO2 make a difference?

      CO2 heats nothing. Your greenhouse effect is physically nonsensical, like most, if not all, climatological Cargo Cult Scientism. Not even a falsifiable hypothesis. Oh well.

      Cheers.

  71. ren says:

    This graphic shows the exact action of laws the gas in the troposphere. It also shows that the stratosphere is completely transparent to infrared radiation, because the increase in particle energy takes place from the top rather than in the lower, denser layers.
    http://www.cpc.ncep.noaa.gov/products/stratosphere/strat-trop/gif_files/time_pres_TEMP_MEAN_ALL_NH_2015.png
    http://www.cpc.ncep.noaa.gov/products/stratosphere/strat-trop/

  72. Norman says:

    Mike Flynn

    I think it would help greatly in your argument if you took a step back and really tried to understand the GHE. It is very obvious that you have an incorrect understanding of the process and are using this to slam on those who accept the GHE (which is actually measured).

    Your claim of GHE: “And at night, do you cooler or warmer in the shade? Does CO2 make a difference?

    CO2 heats nothing. Your greenhouse effect is physically nonsensical, like most, if not all, climatological Cargo Cult Scientism. Not even a falsifiable hypothesis. Oh well.”

    It is a falsifiable hypothesis. If you remove all GHG from the atmosphere and then monitor the temperature after that removal.

    Does CO2 make a difference. Yes it does. If you had no GHG in the atmosphere you would get much colder in the shade than you do with GHG. You will still cool but the rate of cooling is much less drastic with GHG. If you look at the links above on the actual measured values you will see that your body would lose radiation much faster than with GHG and you could feel this effect and the air temp around you would also drop at a faster rate. The ground in the shade would cool much faster.

    If you go to the link:

    http://www.esrl.noaa.gov/gmd/grad/surfrad/dataplot.html

    You can go to some places that have cloudy days and nights and look at the downwelling IR. The falsifiable nature of the GHE is there. If GHE did not exist then clouds (which also emit downwelling IR) should not change the measured value of downwelling IR. If you look around the link you will see clouds greatly effect the reading and on thick cloudy days and nights there is almost no difference in the upwelling IR and downwelling IR. They are about the same and the temperature does not go down at night. I hope you try and look.

    • geran says:

      Norm, you stay sooooo confused in your pseudoscience. You are now confusing clouds with atmospheric CO2. You don’t even understand your own pseudoscience.

      Hilarious!

      • Norman says:

        geran,

        I am not confusing anything. Your lack of understanding of the GHE is clouding your comprehension on the topic.

        What do clouds at night do? Why does the surface temperature remain the same? There is no confusion it is the same process, thick clouds are just much better at GHE than anything else. The bottom is relatively warm and they emit all wavelengths of IR back to the
        surface.

        Carbon Dioxide does an equivalent thing just not as well. Of the GHE in moist areas CO2 produces only about 10% of the downwelling IR. If your downwlling IR is 300 Watt/m^2 than CO2 would only be responsible for 30 Watts/m^2 of the downwelling flux.

        Do want the apple in basket example again?

        • geran says:

          Norm, apples are all you have. You have NO science!

          You’re all over the board, rambling like a drunk sailor. (No offense to sailors.) For some reason you think rambling on, trying to emulate Dxxg Cxttxn, will make your pseudoscience somehow correct.

          You reject physics books, but love your “links”. Hilarious!

          You claim “energy does NOT leave the system, but the energy leaves the system”. Hilarious!

          You claim the GHE “slows the cooling”, but then you claim the GHE will “result in cooling”. Hilarious!

          It’s almost as if you want to be a “climate clown”!

          • Norman says:

            geran

            When you just lie I have to call you out on it…

            Your totally false claim: “You reject physics books, but love your links. Hilarious!”

            In the thread before this one I linked you to a textbook on heat exchange, did you intentionally neglect to look at it so you could lie about it?

            Lie on, it is what you do the best. Lie and distort. Truth is not your strong point. Are the links lies?

          • geran says:

            Norman, I gave you a link to a very good college physics book. You rejected it. Your memory loss may be something you should be concerned about….

            (Accusing others of lies is the last resort of pseudoscience.)

          • Norman says:

            geran

            Your claim to justify your lie: “Norman, I gave you a link to a very good college physics book. You rejected it.”

            What did I reject. I was not planning on buying the textbook you linked to. I already own a college physics textbook and it does not contain radiative heat transfer equations (lots of other material but not that). I found a link to an actual heat transfer textbook where this is the focus of the material.

            You can lie to yourself if it helps, and keep the lie going. I called you out on a lie man up and accept it.

          • geran says:

            Norm, your rambling just confuses you further.

            You ramble: “I was not planning on buying the textbook you linked to. I already own a college physics textbook and it does not contain radiative heat transfer equations (lots of other material but not that). I found a link to an actual heat transfer textbook where this is the focus of the material.”

            Let me translate: Your “physics” book isn’t any good. You rejected the one I mentioned. Then, you “found a link”.

            You reject physics books, but love your links. Hilarious!

          • Norman says:

            geran

            Covering up your lie and not manning up.

            YOU: “Let me translate: Your physics book isnt any good. You rejected the one I mentioned. Then, you found a link.

            You reject physics books, but love your links. Hilarious”

            A lying translation, what indicates to you that my physics book isn’t any good? It is a general physics textbook that covers much material and does not get into detailed heat transfer physics.

            I did not just find a link or reject your physics book. The link was to a college level textbook focused on the physics of heat transfer.

            Why do you like to lie so much, what satisfaction does it give you? You lie, then cover it up with another lie and just keep right on lying.

          • geran says:

            Norm asks: “…what indicates to you that my physics book isnt any good?”

            Norm answers himself: “I already own a college physics textbook and it does not contain radiative heat transfer equations…”

            Norm, the more you ramble, the funnier you get! You are the “poster boy” of pseudoscience.

    • Norman says:

      Mike Flynn

      Here is a good example of GHE in process (GHE does not mean the effects of Carbon Dioxide alone…it is the downwelling IR that is produced by clouds, water vapor, carbon dioxide, methane, ozone and other gases).

      http://www.esrl.noaa.gov/gmd/webdata/tmp/surfrad_57a76bbb2f7ba.png

      Penn State on February 24, 2016
      http://www.esrl.noaa.gov/gmd/webdata/tmp/surfrad_57a76bbb2f7ba.png

      The link shows the downwelling and upwelling IR are nearly equal and the temperature is not changing.

      The weather conditions were cloudy at night and light winds from the East (North wind could cool the temperature by moving in colder air and southern wind could elevate temperature by moving in warmer air from the south).

      https://www.wunderground.com/history/airport/KUNV/2016/2/24/DailyHistory.html?req_city=Penn+State+University&req_state=PA&req_statename=Pennsylvania&reqdb.zip=16802&reqdb.magic=3&reqdb.wmo=99999

    • Mike Flynn says:

      Norman,

      The foolish Warmist attempt to deny, divert, and confuse by claiming that removing all GHG from the atmosphere would result in some unspecified result is not a falsifiable hypothesis.

      A falsifiable hypothesis must be capable of falsification by repeatable experiment. First, how do you intend to remove all GHGs from the atmosphere? How do you intend to repeat the experiment? Nobody would be alive!

      Foolish Warmist! That’s not science, that’s Cargo Cult Scientism!

      The Moon possesses no GHG. I suspect you’ll execute the usual foolish Warmist deny, divert, and confuse movement by referring to irrelevant averages. Climate is another irrelevant average beloved of foolish Warmists.

      Sorry Norman, but just saying that CO2 makes a difference is completely silly. Everything makes a difference to everything else in the long run.

      CO2 heats nothing. It’s an unsubstantiated hysterical foolish Warmist assertion.

      Cheers.

  73. Kristian says:

    Norman, you said:
    http://www.drroyspencer.com/2016/08/uah-global-temperature-update-for-july-2016-0-39-deg-c/#comment-219379

    Your misunderstanding of the GHE is what leads you to see a conflict where there is none. Empirical data of the GHE will clearly show how the GHE works.

    During the day, the upwelling IR rises at a much faster rate than the downwelling IR. The net IR decreases during the day and the GHE is less effective (but still there). If the Pacific dumps a lot of energy into the lower atmosphere, raises the temperature, the GHE will still take place but the upwelling will be at a higher rate and result in cooling.

    The misunderstanding here, it appears, is entirely on your part, Norman. You still do not see how these ‘radiances’ of yours are purely radiative expressions of temperature. They are temperature EFFECTS, not causes of temperature. Earth’s own thermal radiation is a RESULT of its temperature, not the cause of its temperature.

    Your misunderstanding of how the atmosphere really works comes to light in your second paragraph above. You say: “During the day, the upwelling IR rises at a much faster rate than the downwelling IR.” This is really only a nebulous, roundabout (Climate Science^TM) way of describing a simple, everyday phenomenon of the physical world: How, during the day, as the Sun shines down on the surface, heating it, the surfac temperature rises much faster than that of the air layers above it, eventually creating a superadiabatic temperature gradient, leading to convective instability -> convection starts cooling the surface, preventing its temperature from rising way ‘too much’ (no convection on the Moon). Then you say: “The net IR decreases during the day (…)” If by that you mean “becomes more negative”, then you’re right. The radiant heat loss of the surface (its ‘net LW’), after all, is DWLWIR minus UWLWIR, and so if the latter term (always larger during the day) is growing faster than the former, then the negative sum of the two naturally increases.

    So the radiant heat loss of the surface is always much larger and more effective during the day than during the night. Only, during the night, there is no simultaneous heat INPUT. And so the temp rises during the day and falls during the night.

    But, Norman, you need to heed geran’s words: “The heat is leaving the atmosphere! The atmosphere is NOT trapping the heat.”

    As much energy EXITS the Earth system across any suitable time frame (like a day [24h] or a year [365d]) as what ENTERS it. If not, we would not be in a steady state. No energy is “trapped” or “held back” anywhere. As a certain amount of outgoing energy (“heat”) from the surface (and incoming from the Sun) is absorbed by one part of the atmosphere, an equal amount of energy is always emitted to space by some other part of the atmosphere. Because energy is also constantly being transported (without net loss) between these two parts. From the net absorbing (heating) end to the net emitting (cooling) end. That’s our state of dynamic radiative-convective equilibrium.

    The temperature of Earth was set in a hypothetical ‘storing-up-of-internal-energy’ phase (t_i -> t_f). It’s the “internal energy” [U] contained within the Earth system (accumulated during this phase) that gives it its steady-state
    temperature, not any instantaneous radiant power fluxes moving back and forth internally. Not even the solar flux can be directly tied to the temperature of any one specific level or region inside the Earth system. The Earth system has equilibrated into a state where it is organised in such a way that it manages to put out exactly as much energy to space as it receives from the Sun. And that’s it. The various TEMPERATURES of all the levels and regions inside the system are determined and maintained by internal (circulatory) processes, not by this particular energy balance (heat IN vs. heat OUT).

    If the mass of Earth’s atmosphere were twice as large as in the current state, Earth would still put out as much energy to space as it received from the Sun. But the average surface temperature would’ve been significantly higher than it is now. If, on the other hand, our atmosphere had the exact same mass as in the current state, but had much more IR-active constituents in it, then Earth would still put out as much energy to space as it received from the Sun. And the surface temp would’ve been unchanged.

    I guess you will reflexively object to what is being pointed out here. But ponder this:

    Venus radiates its planetary flux to space from the same general atmospheric pressure/density levels as Earth does, even though these levels on Venus contain hundreds of times as many IR-active molecules as they do on Earth. So why is the surface temp on Venus so much higher than on Earth (the lapse rates are also pretty close)? Because these similar atmospheric pressure/density levels are situated several tens of kilometres higher above the ground on Venus than on Earth. Why? Because of the much, much larger ATMOSPHERIC MASS.

    Mars has an atmosphere containing 96% IR-active constituents. Yes, it is mostly CO2 (like on Venus), which – without the help of bulk air pressure/density – only absorbs within rather narrow bands of the EMR spectrum, but it will still obviously absorb a substantial portion of the outgoing surface IR. In fact, any cubic metre of Martian air above the surface contains on average 26 times as many CO2 molecules as a similar volume of air on Earth does. Such a number of molecules per m^3 in Earth’s atmosphere would be equal to a concentration of 10,400 ppm (that’s 1.04%)! However, on Earth, [T_s – T_e =] +33K, while on Mars, [T_s – T_e =] -8K. Does that mean that the Martian atmosphere creates a negative insulating effect on the solar-heated surface? No, of course not. The Martian surface would be even colder without an atmosphere at all. But it shows that there is no “RADIATIVE greenhouse effect, rGHE” as specifically defined (T_s > T_e) on Mars. All that CO2 in the atmosphere certainly absorbs outgoing IR from the surface, but this fact doesn’t do anything to raise the Martian T_s above its T_e. The opposite is the case. And why is that? Because the atmosphere is TOO THIN. It has too little overall mass. It has plenty enough of IR-active constituents, no problem there. But it simply hasn’t got the bulk mass (pressure/density) to go along with it. To make it grab hold and gain traction; in short, to make it work …

  74. Kristian says:

    “It” of course being that part of the atmospheric insulating effect actually raising the T_s above the T_e …

  75. Norman says:

    Kristian

    Here is a point that may prove your idea is not a correct one.

    Mass of atmosphere is what determines surface temperature.

    On a thick cloudy night convection has stopped and the air is calm. No advection moving air from one location to another. The surface temperature does not drop. The mass of the atmosphere has not changed. The surface is not receiving any new solar energy to maintain its temperature but yet it does not change. If you look at the net IR (Upwelling IR minus Downwelling IR) under these conditions you see that the net IR is close to zero. The surface is not losing any energy as all the energy emitted by it is returning. Energy IN equals Energy OUT and the surface maintains an equilibrium temperature. I think that is enough to at least poke a major hole in what you believe to be a valid conjecture.

    Also it is not valid to compare different systems like Mars. Even with more CO2 per volume on Mars there are not enough molecules to store the energy emitted by the Martian surface so the CO2 does not warm up and emit a Downwelling flux to keep the surface warm. A thicker atmosphere will allow more energy to be stored in its mass.

    I think you should look at the link I provided Mike Flynn and geran that shows radiation and temperature data for various spots in the US and plot some graphs. You can make up ideas and test them to see what the actual outcome is. You can also go to Weather Underground to get historical weather data. If air is moving in or out (windy) it will have major effects on the temperature variable besides the radiative effects. I think if you play with some plots and test your ideas you will soon come to accept GHE as a radiative phenomena controlled by GHG in the atmosphere.

    • ren says:

      When the temperature drops in winter in the troposphere tropopause altitude decreases. It works hydrostatic equilibrium.
      http://www.cpc.ncep.noaa.gov/products/stratosphere/strat-trop/gif_files/time_pres_TEMP_MEAN_ALL_SH_2015.png

    • Kristian says:

      Norman says, August 7, 2016 at 8:48 AM:

      On a thick cloudy night convection has stopped and the air is calm. No advection moving air from one location to another. The surface temperature does not drop. The mass of the atmosphere has not changed. The surface is not receiving any new solar energy to maintain its temperature but yet it does not change. If you look at the net IR (Upwelling IR minus Downwelling IR) under these conditions you see that the net IR is close to zero. The surface is not losing any energy as all the energy emitted by it is returning. Energy IN equals Energy OUT and the surface maintains an equilibrium temperature. I think that is enough to at least poke a major hole in what you believe to be a valid conjecture.

      I don’t get you, Norman. What is new here? What is surprising about this? And when did I ever deny the fact that this happens?

      To put it differently, how does this even remotely relate to my mass explanation of the atmospheric insulation effect on the solar-heated surface?

      You can’t use CLOUDS to ‘prove’ the existence of a “radiative greenhouse effect (rGHE)”, Norman. There are so many reasons for this, because clouds behave nothing like the gases making up the air, which is what’s supposed to produce the effect.

      Moreover, what you should never forget, is that the “rGHE” is supposed to be a NET radiative effect on the surface temperature. It is supposed to raise its GLOBAL AVERAGE. And I’m sorry to inform you that the overall (net) radiative effect of clouds on the global surface of the Earth is not one of warming, but one of cooling. Net CRE globally is -21 W/m^2 according to CERES, which is quite significant.

      The point is this: Yes, clouds (and atmospheric conditions typically associated with clouds) reduce surface cooling rates during the night. But they ALSO reduce surface heating rates during the day. And the latter effect is evidently much stronger overall than the former.

      You need to take this to heart, Norman.

      Even with more CO2 per volume on Mars there are not enough molecules to store the energy emitted by the Martian surface so the CO2 does not warm up and emit a Downwelling flux to keep the surface warm. A thicker atmosphere will allow more energy to be stored in its mass.

      EXACTLY MY POINT! Atmospheric mass is it! You see it as clearly on Venus, only the other way around. The reason the surface temp is so high there (T_s >>> T_e) is not because of the level of atmospheric IR activity, but because of the total mass of the atmosphere. It seems you are deliberately turning a blind eye to this pretty obvious circumstance. Because I’ve mentioned it now several times, and you always appear to refrain from commenting on it.

      I think you should look at the link I provided Mike Flynn and geran that shows radiation and temperature data for various spots in the US and plot some graphs.

      Why? I know about these plots from before. I’ve seen hundreds of them. I’m not Flynn or geran, Norman. I know how radiative insulation works. But like I’ve told you now on multiple occasions, the atmospheric insulation effect on the solar-heated surface is very real indeed. And the atmosphere needs to be IR active for it to work properly (on the surface itself). But it is the MASS of the atmosphere that ultimately forces the average surface temperature (T_s) to rise above the planetary emission temperature (T_e), not its radiative properties. They are but a tool. And the evidence is to be found right here in our very own solar system (Mars vs. Earth vs. Titan vs. Venus and more) …

      I think if you play with some plots and test your ideas you will soon come to accept GHE as a radiative phenomena controlled by GHG in the atmosphere.

      Why do you want me to “accept” a dogma, something that is evidently not true? The “GHE” is a mass effect, not a radiative one, Norman.

      * * *

      Another piece of evidence against the notion that the DEGREE of atmospheric IR activity matters to the surface temperature of a planet is the nonexistence of an “enhancement” of the postulated “greenhouse mechanism” over the last 30+ years on Earth. Even as the atmospheric concentration of so-called “GHGs” (including CO2 and water vapour) has gone massively up over the same period.

      • Norman says:

        Kristian

        Your point “You cant use CLOUDS to prove the existence of a radiative greenhouse effect (rGHE), Norman. There are so many reasons for this, because clouds behave nothing like the gases making up the air, which is whats supposed to produce the effect.

        Moreover, what you should never forget, is that the rGHE is supposed to be a NET radiative effect on the surface temperature. It is supposed to raise its GLOBAL AVERAGE. And Im sorry to inform you that the overall (net) radiative effect of clouds on the global surface of the Earth is not one of warming, but one of cooling. Net CRE globally is -21 W/m^2 according to CERES, which is quite significant.

        The point is this: Yes, clouds (and atmospheric conditions typically associated with clouds) reduce surface cooling rates during the night. But they ALSO reduce surface heating rates during the day. And the latter effect is evidently much stronger overall than the former.”

        Why do clouds behave nothing like GHG emitting IR? The cloud has a temperature and emits IR. GHG’s have temperature and emit IR. The only big difference in this would be the cloud would cover more wavelengths of IR in its emission spectrum. That is what the plots I linked to show. Cloudy nights have a very low IR net loss while cloudless nights it is much higher loss.

        With the clouds. If man would geo-engineer the clouds you could see an enhanced GHE with them. One would build up thick clouds at night to maintain the surface temperature and eliminate all clouds during the peak of solar insolation. The surface temperature would rise and it might even get to the equilibrium temp of 90 C after some time (can’t be sure how it work but the potential is there).

        I will agree with you that you have to have certain mass to have a GHE. You need enough atmosphere that it can hold some energy, but I do not know what that amount would be or if increasing it would act to increase the surface temperature. You might have a strong point with the evaporation rate, which is a surface cooling mechanism, but in global energy budgets the evaporation loss is only 80 watts/m^2 and all the energy of evaporation ends up in the atmosphere warming it (via condensation which allows some to return as downwelling IR).

        I do not know why mass of atmosphere would have a significant effect on surface temperature. With your Venus case, the IR leaving the planet is very low. I do not know how a massive atmosphere is preventing radiation from leaving the surface directly to space. That is the part of your idea I really do not understand how it is supposed to work. It could be the idea that high pressure on Venus converts the Carbon Dioxide into a semi-liquid form and IR does not travel through this at this point and only when it returns to gases form does IR move through it. Then the Carbon Dioxide ocean would actually act as a strong insulator for the surface of Venus. IF this is not the case, if you removed the thick clouds, the Carbon dioxide and replaced the atmosphere with nitrogen (you would get some collision induced IR generated by N2 but not close to the clouds and carbon dioxide) what would prevent the surface IR emission of around 16,000 watts/m^2 from freely moving directly to space and then satellites would show Venus as a super hot IR emitter and it would also start cooling at a rapid rate losing that much energy. Venus is a cold IR emitter. What is stopping the IR from direct passage from the surface if GHG’s are the responsible party?

    • Mike Flynn says:

      Norman,

      When you write foolish Warmist rubbish like –

      “On a thick cloudy night convection has stopped and the air is calm. No advection moving air from one location to another. The surface temperature does not drop.”, you might expect people to disbelieve you.

      When and where did this particular miracle take place?

      Calm conditions, no wind, no Sun, and the surface temperature remained constant from sundown to sunset. Do you think this happens often? If you left a container of water at 90 C on the ground, would its temperature drop? In the absence of cloud, would an umbrella or sunshade do?

      Foolish Warmist nonsense!

      Cheers.

  76. Norman says:

    Mike Flynn

    You: “you might expect people to disbelieve you.

    When and where did this particular miracle take place?

    Mike if you will not look at links I put in with my post and then ask such a question, wow is it that hard for you to click on a link to look at it? Kind of pointless to debate or discuss material with you if you are that stubborn that you refuse to check up on the evidence I used to support my statements. Evidence has no bearing on your belief?

    A link to my post with the links demonstrating no net IR energy loss during the night and the temperatures do not drop.

    http://www.drroyspencer.com/2016/08/uah-global-temperature-update-for-july-2016-0-39-deg-c/#comment-219530

  77. Norman says:

    Mike Flynn

    YOU: “If you left a container of water at 90 C on the ground, would its temperature drop? In the absence of cloud, would an umbrella or sunshade do?

    Foolish Warmist nonsense!”

    I think the only “foolish nonsense” is the utter lack on any scientific background leading you to conclude all types of garbage and somehow thinking it is intelligent posts.

    Here is one link to look at (but will you)
    http://www.esrl.noaa.gov/gmd/webdata/tmp/surfrad_57a7e4dfba129.png

    If you check the downwelling IR it is around 400 Watts/m^2.

    Your water pot at 90C is emitting IR at the rate of about 947 Watts/m^2. If you can do simple math you can try to grasp the concept. 947 is much greater than 400!!

    The water in pot is losing 947 Watts/m^2 while the atmosphere is only returning 400 Watt/m^2 to the water. Simple math will suggest the water is losing energy at the rate of 567 Watts/m^2 so it will cool, but it will only cool until it is in equilibrium with the downwelling flux. The water in the pot will not radiate less than 400 watts/m^2 as this is how much is absorbing from the sky. It will reach an equilibrium temperature of around 20 C which the temperature graph demonstrates.

    Does that help?

    Cheers and have a very nice day!

    • Mike Flynn says:

      Norman,

      Your link shows the temperature dropping at night. You claim it doesn’t.

      Who shoukd people believe? You, or their own eyes, reading the information you supplied.

      The atmosphere at night cools. The desert surface may drop from >45 C in the day, to below zero C at night. The presence of CO2 heats nothing. You may not realise that freezing water radiates >300 W/m2. You may consider this hot. I don’t.

      All this nonsense about equilibrium is just that. Foolish Warmist nonsense.

      The surface heats in sunlight. No sunlight, no heating.

      CO2 heats nothing. No amount of foolish Warmist deny, divert, and confuse, no stupid and irrelevant analogies can change this simple fact.

      Believe what you will, if it keeps you happy.

      Cheers.

      • Norman says:

        Mike Flynn

        I have to ask and obvious question. Are you just having fun on this blog? Do you post things because it is amusing to do so and you have no real desire to interact with those you reply to?

        YOUR CLAIM: “Your link shows the temperature dropping at night. You claim it doesnt.
        Who shoukd people believe? You, or their own eyes, reading the information you supplied.”

        https://www.wunderground.com/history/airport/KUNV/2016/2/24/DailyHistory.html?req_city=Penn+State+University&req_state=PA&req_statename=Pennsylvania&reqdb.zip=16802&reqdb.magic=3&reqdb.wmo=99999

        This has an actual log of night-time temperatures for Penn State February 24th, 2016 the same date as the IR graph I linked to.

        Look at the temperature logs (scroll down a bit) and read the time stamp and temperature starting at 1:15 AM to 5:35 AM

        1:15 AM 34.7 F
        1:35 AM 34.3 F
        1:55 AM 34.5 F
        2:15 AM 34.7 F
        2:35 AM 34.3 F
        2:55 AM 34.5 F
        3:15 AM 34.7 F
        3:35 AM 34.5 F
        3:55 AM 34.7 F
        4:15 AM 34.5 F
        4:35 AM 34.7 F
        4:55 AM 34.7 F
        5:15 AM 34.5 F
        5:35 AM 34.5 F

        If you consider this data as showing temperature dropping then you are too dense to reason with however others may see it and be able to understand.

        What is the point of this statement: “You may not realise that freezing water radiates >300 W/m2. You may consider this hot. I dont.” This just needs ????

        I have also agreed with you that CO2 does not heat the surface. Why do you repeat what no one is stating? This is really a strange behavior. What is up with that?

        • geran says:

          Norm, the “poster boy” of pseudoscience, doesn’t believe going from 34.7C to 34.3C is a “drop”!

          Hilarious!

          • Norman says:

            geran

            You demonstrate that you are dumber than a box full of rocks. You pick two temperatures out of a series and try to conclude a temperature drop.

            I thought you might have some intelligence but were just having some fun on blogs annoying people with your antics. Your last post just proved you are really just not very smart and have little to no reasoning ability.

            Look at one hour later and the temp is back to 34.7.

            You are too dense to reason with.

          • geran says:

            So, in your pure pseudoscience, you only see the “rise”, but not the “drop”!

            Hilarious!

            (Norm, all your juvenile insults only add to your humor. They indicate how desperate you are. Please keep them coming.)

          • Norman says:

            geran

            Too dense to reason with.

          • I’ve deleted a few of Geran Imo’s more insulting posts, which are increasingly off the reservation. Hilarious!

          • Norman says:

            geran

            So from the temperature series at 1:35 AM the temperature is 34.3F and at 5:35 AM the recorded temperature is 34.5F.

            In the 4 hour time series you would claim the temperature dropped?

            Now I understand why you can’t grasp GHE you are unable to figure out what direction temperature is going. When you are that dense it is a waste of time to reason with you since you do not possess this ability.

            Too dense to reason with.

          • geran says:

            “…reason with…”!

            Hilarious!

            Here’s just one example of your “reasoning”:

            The energy does NOT leave the system, but the energy leaves the system.

            You can only “reason with” someone else practicing pseudoscience.

  78. Michael blazewicz says:

    I am amazed at the correlation between the lower global atmosphere temperature fluctuations and the actual CO2 in our atmosphere as supplied by Roy Spencer in another article. Different dates sets but highs and lows directly correspond. How is this not strong evidence of a climate system that has a strong association between temperatures and CO2 ?.

  79. ren says:

    Let’s see reality. Temperature of 3500 m in the north. Please pay attention to the Hudson Bay and the North Atlantic.
    https://earth.nullschool.net/#current/wind/isobaric/700hPa/overlay=temp/orthographic=-352.60,89.81,455

  80. Tim Folkerts says: August 7, 2016 at 12:14 PM

    Here is what MODTRAN is:
    MODTRAN is an atmospheric radiative transfer model developed by Spectral Sciences Inc. and the US Air Force Research Laboratory. It has been extensively validated and serves a a standard atmospheric band model for the remote sensing community.

    This is but your complete BS Tim! to be continued:

  81. ModTran is but an obsolete Fortran relic that uses the HiTran database established in the 1960s, 70s by the US Air Force Cambridge Research Laboratory, Hanscom Field near Boston. That entire effort was only to establish the attenuation of amplitude and spatial modulation of EMR radiative signaling through Earth’s atmosphere. to be continued:

  82. Go to Jonova to read the rest!

  83. Kristian says:

    Norman,

    You go on and on about the DWLWIR from the atmosphere to the surface as if it were somehow a causative agent of the surface temperature, when in fact it is simply a radiative expression of atmospheric (air column) temperature.

    But think of it this way:

    1)
    What would your ‘DWLWIR flux’ be if the air in Earth’s atmosphere were as IR active as it is now (or more), but as thin as (or thinner than) the Martian one? And what would it be able to accomplish?

    2)
    What would your ‘DWLWIR flux’ be if the air temperature in Earth’s atmosphere were only 2.7K? And what would it be able to accomplish?

    3)
    What would your ‘DWLWIR flux’ be if Earth’s atmosphere were about 1mm high, or like an exosphere, where individual molecules don’t really interact. And what would it be able to accomplish?

    The answer to the last question in all three cases is the same: Well, it certainly wouldn’t be able to raise Earth’s T_s above its T_e. Meaning, it would not be able to ’cause’ a “radiative GHE” as defined.

    So what is the common missing denominator …?

    You guessed it: BULK MASS.

    1) The Martian atmosphere has too little bulk mass. It is simply too thin (there are too few molecular interactions per unit of time) for it to hold much heat. And accordingly, its T_s is (significantly) lower than its T_e. Even though it is much more IR active than Earth’s atmosphere (96% vs. 0.5-1%).

    2) An atmosphere without mass will never be able to warm.

    3) An atmosphere without mass would basically not exist, it just wouldn’t ‘get off the ground’. At most it would be a wafer-thin sheet of gaseous material draping the surface. Or it would be an exosphere.

    IOW, it is not the ‘DWLWIR’ per se that matters. It’s the MASS of the atmosphere being warm (and heavy). The DWLWIR is just an apparent radiative EFFECT of the air’s temperature, acquired solely by virtue of its thermal mass.

    You see, it’s not enough for molecules in the atmosphere to absorb outgoing electromagnetic energy in the form of IR photons from the surface. The energy needs to be thermalised before being reemitted in order for the atmosphere to warm, thus for it to gain a temperature at all. And that thermalisation occurs only when the excess EM energy is conducted into the bulk air mass by way of molecular collisions and turned into internal translational kinetic energy. That process requires a sufficiently interacting molecular MASS. The energy thus captured is stored inside the bulk air mass and spread globally and up through the air column by turbulent mixing (atmospheric circulation), eventually giving the atmosphere (or troposphere, really) its particular steady-state energy/temperature distribution.

    What is it that captures the outgoing heat from the surface, lets the medium in direct thermal contact with it warm from it, and then holds that warm medium (and the energy making it ‘warm’) close to it, thus insulating it? That’s atmospheric MASS.

    The fact that the air layer on top of the Earth’s surface is just a couple of degrees cooler (on average) than the surface itself is not because it is IR active, Norman. It’s because it has thermal mass that has accumulated internal kinetic energy, originally transferred as heat (included net LW) from the surface, and because there is a natural atmospheric circulation having distributed this energy internally within the troposphere in a way that makes the warmest layer always lie closest to the heating end (the surface down low) and the coldest layer closest to the cooling end (the tropopause up high).

    Your atmospheric ‘DWLWIR flux’ to the surface is simply a direct result of this process, of the warmest (and densest) air layers lying closest to the surface itself. It is a radiative TEMPERATURE EFFECT.

    • Tim Folkerts says:

      It is not “either/or”; it is “both/and”. Both the overall amount of atmosphere AND the presence of GHGs are necessary for “the greenhouse effect”.

      * A planet like earth with the same total mass of atmosphere but no GHGs (eg only N2 & O2) would be very cold.
      * A planet like earth but with the same mass of GHGs (removing the bulk of the atmosphere in the form of N2 & O2) would also be very cold.

      It is pointless to argue which “one” causes the effect!

      • Kristian says:

        Tim Folkerts says, August 8, 2016 at 11:20 AM:

        It is not either/or; it is both/and. Both the overall amount of atmosphere AND the presence of GHGs are necessary for the greenhouse effect.

        Yup. I’m just trying to get Norman here to acknowledge the MASS part.

        * A planet like earth with the same total mass of atmosphere but no GHGs (eg only N2 & O2) would be very cold.

        Such a planet’s surface would be, but not its bulk atmosphere.

        It is pointless to argue which one causes the effect!

        Not when moving on to the idea of an “enhanced GHE”. You can’t enhance the atmospheric thermal effect by simply increasing the atmosphere’s concentration of IR-active constituents. But you WILL enhance it by increasing the atmosphere’s MASS.

  84. Norman says:

    Kristian

    I have to respectfully disagree with your conclusions.

    First you do not explain in any fashion what happens to the IR being emitted by the Earth’s surface (which can get quite high in the summer months). You have not explained how atmospheric mass in any way prevents this energy from leaving the Earth system and cooling it. If you double the mass of Earth’s atmosphere with more N2, why would that slow the radiant energy loss from the surface. It may initially warm the surface with such and addition but then the surface will be radiating more IR and without a way to prevent this radiation from leaving the Earth system, the surface will cool at a more rapid rate.

    I am going to hope this link works. It is of the heated layer in the upper stratosphere where ozone absorbs intense UV light preventing it from reaching the Earth’s surface. The layer is very thin and has a pressure 1/1000th of the Earth’s surface pressure. So this very thin layer approaches Earth’s surface temperature. It is very thin and is not receiving any energy from the layers below as they are much colder and convection is not taking place in the stratosphere. I think this layer demonstrates that radiation alone can and does warm regions of the atmosphere.

    https://encrypted-tbn0.gstatic.com/images?q=tbn:ANd9GcTaJ_OKhA3CDlXRYM65R6UKVrAfff9gAYqjA4SyI-QuEV5UNnX0_Q

    • Kristian says:

      Norman,

      That’s because we see this issue from diametrically opposite sides.

      I, however, have long since acknowledged that radiative properties of an atmosphere are indeed a necessary ingredient in creating an “atmospheric insulation effect” on a solar-heated planetary surface, while you still refuse to acknowledge in the least that atmospheric MASS is equally essential, in fact, even more fundamentally so …

      Again, I don’t get you, Norman. Why this obstinate unwillingness to even consider different perspectives to your own on this particular subject?

      I have tried to make it as plain and simple, as obvious, as possible in my comment above. Are you seriously telling me you don’t get the things I point out to you? Or are you just ignoring them?

      A couple of exchanges ago, I brought up Mars and how it’s enveloped by an atmosphere made up of 96% CO2, and how its T_s from observational estimates still appears to be considerably lower than its T_e, in direct contradiction with the common definition of the “rGHE”, here described by Raymond T. Pierrehumbert:
      https://geosci.uchicago.edu/~rtp1/papers/PhysTodayRT2011.pdf

      An atmospheric greenhouse gas enables a planet to radiate at a temperature lower than the ground’s, if there is cold air aloft. It therefore causes the surface temperature in balance with a given amount of absorbed solar radiation to be higher than would be the case if the atmosphere were transparent to IR. Adding more greenhouse gas to the atmosphere makes higher, more tenuous, formerly transparent portions of the atmosphere opaque to IR and thus increases the difference between the ground temperature and the radiating temperature. The result, once the system comes into equilibrium, is surface warming.

      The same idea illustrated here (Soden & Held, 2000):
      http://www.climatetheory.net/wp-content/uploads/2012/05/greenhouse-effect-held-soden-2000.png

      In other words: The rGHE = T_s > T_e.

      Not so on Mars, though. On Mars you have T_s < T_e. Why?

      – There ARE "atmospheric greenhouse gases" in its atmosphere.
      – There IS "cold air aloft".

      So what's the problem?

      Your reply:
      “Even with more CO2 per volume on Mars there are not enough molecules to store the energy emitted by the Martian surface so the CO2 does not warm up and emit a Downwelling flux to keep the surface warm. A thicker atmosphere will allow more energy to be stored in its mass.”

      Norman, this is EXACTLY EQUIVALENT to what I have described in my comment above! So how you from this are then able NOT to see and acknowledge – in fact, outright dismiss – that this has got something to do with the BULK MASS of the atmosphere, is totally beyond me!

      From this I can only conclude that you are somehow completely dogmatically prepossessed or blinded on this issue.

      And thus there is no point – for me at least – in pursuing this argument any further. Because we will seemingly NEVER agree. I will seemingly NEVER be able to convince you to stop just for a moment and rethink this whole matter through from the beginning …

      • Tim Folkerts says:

        “and how its T_s from observational estimates still appears to be considerably lower than its T_e, in direct contradiction with the common definition of the rGHE”

        Actually that is not a direct contradiction. Pierrehumbert said “higher than would be the case if the atmosphere were transparent to IR”, not “higher than T_e”.

        If the atmosphere were transparent, the average surface temperature would be well BELOW T_e. This is a simple consequence of uneven heating by a parallel beam of sunlight falling onto a spherical surface. That fact that Mars’ average surface temperature is ~ T_e (rather than much cooler than this) is evidence of “higher than would be the case if the atmosphere were transparent to IR” and hence not a contradiction.

        • Kristian says:

          Tim Folkerts says, August 8, 2016 at 11:49 AM:

          “Actually that is not a direct contradiction.”

          So in your mind, if T_s ~ T_e, then there is still a “radiative greenhouse effect”? Interesting position. So this equation to you describes “something”, but specifically NOT the “rGHE”:
          T_s = T_e + (Γ * Z_e)

          “Pierrehumbert said higher than would be the case if the atmosphere were transparent to IR, not higher than T_e.”

          Indeed. But you also do see what his statement entails, Folkerts:
          http://www.climatetheory.net/wp-content/uploads/2012/05/greenhouse-effect-held-soden-2000.png

          You also do know about this postulated relationship between the Z_e and the environmental lapse rate, whereby the so-called “GHGs” force a planet’s Z_e up from the warmer surface itself and into the cooler atmosphere above, and the lapse rate in turn naturally sees to it that the temperature at the surface far below is forced to rise as the T_e rises towards its radiative equilibrium with the planet’s star. You know like, T_s ‘used to be’ 255K, but now T_e is 255K, and so T_s is forced to rise (to 288K).

          As Pierrehumbert puts it:

          Adding more greenhouse gas to the atmosphere makes higher, more tenuous, formerly transparent portions of the atmosphere opaque to IR and thus increases the difference between the ground temperature and the radiating temperature. The result, once the system comes into equilibrium, is surface warming.

          He might just as well have said: “Adding greenhouse gases to the atmosphere …”

          This is the “greenhouse surface warming mechanism” defined, Folkerts. And it is specifically tied to the relationship T_e < T_s. All other processes that might make T_s higher, but not as a result of being lower then some perceived elevated atmospheric T_e, with the tropospheric lapse rate connecting the two, are NOT this “greenhouse surface warming mechanism”. They are OTHER mechanisms.

          Remember now that the “rGHE” is ALL about average temperatures. Average surface temp. And average emission temp. T_s and T_e are, by definition, average values. At the same time, T_s represents the average temperature of something definite, something physical, the global surface of the planet, while T_e is just a calculated value based on total emission flux to space. It doesn’t really originate from any particular ‘temperature’ level anywhere. So where is Z_e on Mars? Based on the planet’s average flux to space. A few kilometres below the surface?

          • Kristian says:

            Sorry, that should be:

            All other processes that might make T_s higher, but not as a result of the surface being situated lower than some perceived elevated (and cooler) atmospheric Z_e, with the tropospheric lapse rate connecting the two, are NOT this greenhouse surface warming mechanism”.

      • Norman says:

        Kristian,

        To be fair to myself, in a post above I did agree with you that you have to have some mass to create a GHE.

        Here is my quote from above: “I will agree with you that you have to have certain mass to have a GHE. You need enough atmosphere that it can hold some energy, but I do not know what that amount would be or if increasing it would act to increase the surface temperature.”

        • Norman says:

          Kristian,

          Also about Mars and the GHE. Carbon Dioxide is not the strongest GHG. The best estimates I could find for its contribution were at best 20%. Clouds and Water vapor make up most the GHE.

          The global radiation budget gives downwelling IR a value of 342 Watt/m^2. If you had only Carbon Dioxide in the Earth’s atmosphere at current levels, the GHE would only amount to 68 Watts/m^2 and the surface of Earth would be much cooler than it currently is. You would have more solar insolation during daytime because of no clouds but the night would get very chilly. The daytime GHE would also be a lot less so more IR would leave during the day as well as at night.

        • Kristian says:

          That’s good, Norman. If we can sort of meet halfway and agree that it takes BOTH a certain amount of mass AND radiative properties to enable an atmosphere to create an insulating (indirect warming) effect on the solar-heated surface (T_s > T_e), then we’re actually making some headway.

          Again, what I’m saying is not that an atmosphere’s IR-absorbing/emitting properties don’t count for anything. What I’m saying is simply that the atmosphere’s DEGREE of “IR activity” (that is, its concentration of IR-active constituents) doesn’t matter. Either the atmosphere is IR active, or it’s not. There is no in between. No gradation. Because as soon as it’s become IR active, atmospheric circulation (convection) takes care of the rest.

          When it comes to atmospheric MASS, however, it DOES matter whether it’s large, intermediate or small. And the real-world evidence for this is:

          Mars >> Earth/Titan >> Venus

    • Tim Folkerts says:

      Norman asks: “If you double the mass of Earths atmosphere with more N2, why would that slow the radiant energy loss from the surface.”

      Adding more non-GHG will impact the radiation by raising the radiative “Top of Atmosphere” (ToA). Doubling the bulk of the atmosphere (even ussing non-GHGs like N2) will raise the GHG molecules as well, so they will be radiating to space from a higher altitude. But since higher altitudes tend to be cooler due to the lapse rate, the GHGs at the new, higher, cooler ToA will radiate LESS to space. This will create a back up of energy all the way down to the surface.

      Ultimately, the surface will get warmer (and actually INCREASE the radiant energy to space through the “atmospheric window to compensate for the reduced radiant energy from the TOA).

      (yes, there are lots of feedbacks that will change a few of the details, but that is the basic argument.)

      • Norman says:

        Tim Folkerts

        Thanks for that thoughtful response. I will think about what you have stated, you would confirm what Kristian is saying.

        But I agree with you, even if mass has a major contribution so does the GHG’s present. If you remove one or the other no GHE takes place.

      • Dave Fair says:

        Mr. Folkerts:

        Very off the top of my head, but if a GHG absorbs a photon without changing its vibrational state (roughly, temperature) and emits a photon without changing its state, what difference does it make what its temperature is when emitting?

  85. Pehr Bjornbom says:

    geran August 4, 2016 at 5:44 PM

    Here is my response to your objections to my views on the greenhouse effect.

    We agree that carbon dioxide has an increasing trend and that also the global temperature has an increasing trend depending on the time scale. The time scale I refer to is the last 150 years and especially the time after 1979 when we also have satellite observations of the global mean temperature.

    The theory used to explain that the increasing carbon dioxide contributes to a warming effect increasing the global mean temperature, that is an increased greenhouse effect, is not to be called pseudoscience although this theory is known by climate science too have many deficiencies. This is in fact quite the opposite to pseudoscience because pseudoscience is characterized by overly self-assertive statements lacking convincing evidence.

    The deficiencies of this theory are not about the basic principles of the greenhouse effect, because there is strong scientific evidence for those principles. This can be seen by studying any textbook on fundamental atmospheric science. Instead the problems have to do with applying those principles on the complex climate system resulting in vast uncertainties on how much warming will result from adding a large amount of carbon dioxide to the atmosphere and if this will result in minor problems, considerable problems or even major catastrophes.

    We agree that our planet emits long-wave IR radiation. However, you have missed that satellite observations of this radiation give us evidence supporting the theory of the greenhouse effect. Dr. Roy Spencer, answering a question (beginning at 52:21), explains on this video from a climate conference how the greenhouse effect theory of the planet is validated by satellite measurements of outgoing long-wave IR radiation:
    https://youtu.be/potLQR7-_Tg?t=3146

    So you are wrong to believe that there is no scientific evidence that atmospheric CO2 can warm the planet. The fact is instead the opposite, there is strong scientific evidence that atmospheric CO2 is keeping the planet warmer and habitable.

    However, although we know that CO2 in the atmosphere is keeping the planet surface much warmer than without CO2, the greenhouse theory is giving us rather uncertain information on how much further warming a given increase of the CO2 content in the atmosphere will give and what climate problems this will result in. That’s why the climate debate is so difficult with such diverging opinions. But that is another story, that doesn’t change the fact that there is strong scientific evidence for the greenhouse effect.

    • geran says:

      Hi Pehr, thanks for you polite response! Let’s see if I can do as well.

      <>

      <>

      We agree that CO2 is increasing. We also agree that global temperature has an increasing trend DEPENDING ON THE TIME SCALE. That is, pick the right time scale, and you can find “global warming”. But, on a long time scale, any “warming” is not significant enough to rule out natural variability. And, on a long time scale, any “warming” is not consistent with IPCC projections.

      <>

      It only takes ONE “deficiency” to debunk a theory. So, “many deficiencies” relegates the IPCC GHE/CO2/AGW “theory” to pseudoscience.

      <>

      There is no “strong scientific evidence for those principles”. The “principles” involve the bogus Arrhenius CO2 equation which has NO mathematical proof.

      <>

      Well, if your textbook teaches the atmosphere is a “blanket”, you may need a new book.

      <>

      No, the IPCC models clearly (and incorrectly) indicate a definite “warming”, which is not happening.

      <>

      Pehr, which satellites provide “evidence” of the GHE? What are the observations and details?

      <>

      Atmospheric CO2 is not a thermodynamic “heat source”.

      <>

      You are confusing the heat transfer functions of the atmosphere with “warming”. The atmosphere is continually cooling the planet. Heat transfer from Earth’s surface to space is NOT instantaneous. Heat transfer from a warm surface to a “heat sink”, is not “warming”, it is “cooling”.

      <>

      Again, you are confusing the heat transfer functions of the atmosphere with “warming”.

      <>

      Exactly! The GHE is WRONG, so all you will get from it is “uncertain information”.

      <>

      So many “diverging opinions” is just one example that the IPCC GHE/CO2/AGW theory is WRONG. Claiming “strong scientific evidence” for such a theory is pseudoscience.

      • geran says:

        Oh yeah, brackets don’t work!

      • Pehr Bjornbom says:

        Hi geran,

        That both carbon dioxide content and the temperature has increasing trends on those time scales may be explained by the greenhouse effect. Changes in the global mean temperature may also be explained by natural variation. The changes observed in the global mean temperature with an increasing trend on some time scales and other variations may be explained by the combined effect of an increasing greenhouse effect and natural variation. Neither the greenhouse effect nor natural variation can be ruled out from such an explanation. This is an important cause of the uncertainties in projecting how much warming in the form of temperature increase we will get from a given increase in CO2 content in the atmosphere.

        The deficiencies I talk about don’t concern the fundamental principles of the greenhouse effect. The fundamental theory of the greenhouse effect is found in any academic textbook on atmospheric physics. There are no known deficiencies in this fundamental theory.

        It is when those fundamental principles are applied on the complex climate system in order to find out how much warming we will get from a given increase of carbon dioxide content that the problems occur. While it is straightforward from the fundamental principles to prove that increased carbon dioxide content will result in warming of the planet surface, it is difficult to find out what happens more in the form of feedback effects and not the least in the form of natural variation. Again, all scientists who have seriously looked into this problem agree that increased carbon dioxide will result in warming but it is very uncertain how much this warming will become.

        That the Arrhenius CO2 equation from 1896, the first attempt to quantify the greenhouse effect, would have a role in the theory of the greenhouse effect, as presented in modern textbooks on atmospheric physics, is a misunderstanding. That equation has merely historical interest and may be used for illustrating in a simple way the so-called radiative equilibrium of an atmosphere. However, the modern theory of the greenhouse effect is based on the principle of radiative-convective equilibrium, something that was unknown to Arrhenius. Also the mathematical and physical basis for the greenhouse theory, as described in modern textbooks on atmospheric physics, is advanced and convincing.

        Regarding which satellites have been used, the observations and the details for finding evidence for validating the greenhouse theory I refer to Dr. Roy Spencer who knows much more than me about those things. Here is again the link to the video where he discussed this issue in a climate conference:
        https://youtu.be/potLQR7-_Tg?t=3146

        You seems to have some issues with my use of the word warming. I will try to clarify my way of using this word in this context.

        We agree that the carbon dioxide in the atmosphere is not a heat source. The only heat source assumed in the greenhouse theory is the sun. Very schematically the heat is radiated from the sun in the form of visible light to the surface of the planet where it is absorbed. From the planet surface heat is then transferred in various ways, as sensible heat, as latent heat and partly by long-wave IR radiation, through the atmosphere to the radiation altitude. From this altitude the heat is leaving the planet to space in the form of long-wave IR radiation. This may be considered as a stationary process where all heat flows are considered as means over a longer time period. The temperature at the surface of the planet in this stationary state appears to be a function of how much carbon dioxide there is in the atmosphere. The temperature becomes higher with increasing carbon dioxide content.

        So carbon dioxide warming the planet surface means that with more carbon dioxide in the atmosphere the surface temperature becomes higher as described above. I hope this clarifies what I mean with warming in this context.

        • Norman says:

          Pehr Bjornbom

          Good post and I agree. I hope your method of discussion has the ability to reach geran and enhance his understanding. I have not been able to communicate useful information to him in a considerable time frame.

          I think you did bring up a point (which I attempted somewhere up above) that the GHE is different than AGW theory. One is well established and measured, which is the GHE. The AGW not so much and the CAGW definitely not established. I think geran lumps them all together as one idea.

          • Pehr Bjrnbom says:

            Norman

            Thanks, I appreciate your point on GHE vs. AGW and CAGW. My intention here was to discuss the fundamental science of the greenhouse effect, nothing else.

        • geran says:

          Well Pehr, I’m specifically talking about the IPCC/CO2/GHE/AGW pseudoscience. If you are now walking away from that nonsense, congratulations!

          What you now seem to be advocating, as the NEW GHE, is the natural heat transfer properties of the atmosphere.

          I would recommend you use the acronym “NGHE*” for the NEW GHE theory, so people will not think you believe in the original IPCC/CO2/GHE/AGW pseudoscience.

          Also, be careful with statements such as this: “The temperature at the surface of the planet in this stationary state appears to be a function of how much carbon dioxide there is in the atmosphere. The temperature becomes higher with increasing carbon dioxide content.”

          You don’t want folks to think you have fallen back into the trap.

          • Pehr Bjrnbom says:

            geran

            I want to avoid discussing the IPCC here because the purpose of the IPCC implicates action in the interface of climate science and policy. The fundamental science of the greenhouse effect I have discussed here was discovered and developed long before the IPCC was created.

        • geran says:

          And watch out for “hanger-ons”. There’s one–forget his name, something like “nimrod”, or “not-normal”, something like that. While hilarious, he has little science background. He wouldn’t know something like the “eigenvector of curl”, for example.

          Hilarious.

          • Norman says:

            geran

            For once you are correct. I have not studied eigenvectors or eigenvector or curl.

            https://en.wikipedia.org/wiki/Eigenvalues_and_eigenvectors

            It is useful knowledge to certain fields of study but not sure how it is used in climate science or why you think it is significant that I don’t know how to use this. There are many things I do not know and science and math are very extensive branches of knowledge. But my lack of knowledge in some area would not help your lack of understanding of radiation physics.

          • geran says:

            Oh, yeah, it is “Norm”!

            I knew the first thing you would do is do a search on “eigenvectors of curl”! Your pseudoscience is even predictable.

            Norm, you believe that you can bake a turkey using only ice cubes. And, then you try to claim that anyone that disagrees with you does not understand radiative heat transfer!

            Hilarious.

          • Norman says:

            geran,

            Your statement: “Norm, you believe that you can bake a turkey using only ice cubes”

            This is part of your dishonest lying personality that I exposed earlier when you made a blatant false statement saying I rejected the physics book you linked to. Not buying a book and rejecting it are very different concepts.

            Honesty, try it you may enjoy the vacation from your lies.

            You make up these false statements that I never said and peddle them as if they were facts.

          • really, Geran? Can’t we have an honest discussion on a subject without making up stuff?

            No one ever claimed you could “bake a turkey using only ice cubes”.

            But you can bake a turkey by adding sufficient room-temperature insulation to a heated oven that isn’t getting hot enough without that insulation.

          • geran says:

            Spencer, not if you are going to delete my comments.

          • geran says:

            Hey Bucko, put those deleted comments back.

            Surely no one had screen shots….

          • geran says:

            Spencer asks: “really, Geran? Cant we have an honest discussion on a subject without making up stuff?

            Yes we can, if you don’t make stuff up.

            Spencer spews his “science”: No one ever claimed you could bake a turkey using only ice cubes.

            But you can bake a turkey by adding sufficient room-temperature insulation to a heated oven that isnt getting hot enough without that insulation.

            So Spencer thinks if you add enough insulation, you can bake a turkey with ice!

            Hilarious.

          • geran says:

            freaking website can not handle it…

            Spencer believes ice can bake a turkey.

        • “The deficiencies I talk about dont concern the fundamental principles of the greenhouse effect. The fundamental theory of the greenhouse effect is found in any academic textbook on atmospheric physics. There are no known deficiencies in this fundamental theory.”

          Correction: “current academic textbook on…”. These text have no science of electromagnetic flux generation and propagation through a dispersive medium. They have only religious beliefs with none of these beliefs having falsifiable attributes, and absolutely no effort to empirically verify or falsify. There is no scientific theory, there is not even a valid scientific conjecture.

          • Pehr Bjornbom says:

            Your comment raises some questions. What is the relevance of the propagation of electromagnetic radiation in dispersive media in atmospheric physics, except possibly for the explanation of the rainbow? It is furthermore amazing to read that you have found religious matter in the books you have read. What textbooks did you read and what religious matter did you find?

          • Pehr Bjornbom says: August 9, 2016 at 4:07 PM

            “Your comment raises some questions. What is the relevance of the propagation of electromagnetic radiation in dispersive media in atmospheric physics, except possibly for the explanation of the rainbow? It is furthermore amazing to read that you have found religious matter in the books you have read. What textbooks did you read and what religious matter did you find?”

            First: There is no longer any scientific definition of the term electromagnetic radiation. Such was officially dropped in 1972 as being vague and fraught with misunderstanding! Such was replaced with a whole series of terms “radiometric terminology” google ‘radiometric quantities’. These replace the generalized term radiation used in the days of Maxwell, Planck, and Boltzmann, when confusion did not exist between a potential for radiant emission ‘Radiant intensity’ (field strength) an across variable or difference, and the actual electromagnetic power transfer‘Radiant flux’, the actual through variable, at least for those interested in EMR. The confusion was intentionally reintroduced by post modern physics by attempting to include EMR power flux to the endeavor of thermodynamics or heat transfer! EMR in any of its terms is never heat or sensible heat. Only the lowest level interaction of electromagnetic flux with mass can result in a change in the sensible heat of that mass. A later intentional confusion factor was the inane splitting of the exact S-B equation into two single temperature equations, ignoring the mathematically required parenthesis surrounding the two temperature difference in electromagnetic radiative potential. The claim now is that thermal EMR flux is determined by solely by the temperature of an emitter rather that the potential difference between the emitter and absorber. Sorry I did not get to the actual radiometric attenuation effects of a dispersive intervening media. Roy does not allow long responses! Please askagain!

          • Pehr Bjornbom says: August 9, 2016 at 4:07 PM

            “Your comment raises some questions.”

            Required reading starts with:
            A Treatise on Electricity and Magnetism
            by James Clerk Maxwell 1873
            If you understand vector algebra well, you may start with John Poyntings translation of the above to vector math. Until you go back and can comfortably apply Maxwell’s quaternion treatment with multiple sources of field strength at the same frequency, but different locations, you simply cannot appreciate the EMR effects of beam steering, and thermal EMR flux cancellation at an equal temperature (radiance) surround.

          • Testing again 1234

        • “So carbon dioxide warming the planet surface means that with more carbon dioxide in the atmosphere the surface temperature becomes higher as described above. I hope this clarifies what I mean with warming in this context.”

          Certainly with Earth’s oceans, higher ocean temperature (from whatever cause) must result in increased atmospheric CO2!
          So ‘in this context’ your term “warming” means only an increase in the undefined ‘temperature’, with no indication of transfer of power to/from that what ever ‘warmed’! Why can you not be consistent in what you mean by your term “warming”?

    • Kristian says:

      Pehr Bjornbom says, August 8, 2016 at 1:30 PM:

      “The theory used to explain that the increasing carbon dioxide contributes to a warming effect increasing the global mean temperature, that is an increased greenhouse effect, is not to be called pseudoscience although this theory is known by climate science too have many deficiencies. This is in fact quite the opposite to pseudoscience because pseudoscience is characterized by overly self-assertive statements lacking convincing evidence.”

      But that’s exactly what the idea of the “enhanced GHE” is all about: “overly self-assertive statements lacking convincing evidence”. In fact, it’s lacking evidence of any kind, not just ‘convincing’ evidence.

      “(…) the problems have to do with applying those principles on the complex climate system resulting in vast uncertainties on how much warming will result from adding a large amount of carbon dioxide to the atmosphere (…)”

      No. Why assume it will cause warming at all? Why MUST there be warming of some kind? That’s no more than a conjecture, mere speculation.

      “We agree that our planet emits long-wave IR radiation. However, you have missed that satellite observations of this radiation give us evidence supporting the theory of the greenhouse effect.”

      Quite the opposite. Satellite observations (ERBE+CERES) clearly show (over the last 30+ years) that there is NO “enhanced GHE” to be seen whatsoever, even with atmospheric CO2 and water vapour having gone up substantially over the period, and that the positive radiative imbalance at the ToA responsible for the net accumulation of energy inside (and thus warming of) the Earth system is rather caused by an increase in solar input.

      “(…) we know that CO2 in the atmosphere is keeping the planet surface much warmer than without CO2 (…)”

      We absolutely do not “know” this. If we took out all the 400 ppm of CO2 in our atmosphere, you really think our world would necessarily be a colder place? Based on what? MODTRAN? It would be a DEAD place. But colder? Hardly.

      • Pehr Bjornbom says:

        You are rejecting important things that I have said based on what I have learnt from studying literature on atmospheric physics and especially the greenhouse effect. This raises the question what is your own source of information on those issues? Could you give some literature references that we could study in order to better understand your statements? Thanks in advance!

        • gbaikie says:

          –This raises the question what is your own source of information on those issues? Could you give some literature references that we could study in order to better understand your statements?–

          I don’t really know of any alternative to GHE theory and I am not dependent upon one, but your question prompted me to see if there were others. For instance:
          “However in the last decade a new theory, developed by Henrik Svensmark a physics professor at the Danish National Space Centre in Copenhagen, about how variations in the Suns magnetic activity may have very a profound impact on climate on earth has attracted growing interest in the scientific community. The theory, explained below, proposes a link between fluctuations in the suns magnetic activity and resulting changes in the solar wind around the earth affecting how many cosmic rays hit the earth, particularly the lower atmosphere, which in turn affect the rate of low level cloud formation which in turn drives climate variability.”
          http://a-sceptical-mind.com/an-alternative-solar-theory

          Which kind of points to reason one has any theory- which is to explain climate variability.
          Over century ago the idea that CO2 warms the planet was based upon attempt to explain why we had glacial and interglacial periods.
          There are lots of reasons offered for why we have glacial and interglacial periods. One for instance is call
          Milankovitch cycles
          https://en.wikipedia.org/wiki/Milankovitch_cycles
          And:
          “What causes ice-ages?

          Fluctuations in the amount of insolation (incoming solar radiation) are the most likely cause of large-scale changes in Earth’s climate during the Quaternary. In other words, variations in the intensity and timing of heat from the sun are the most likely cause of the glacial/interglacial cycles. This solar variable was neatly described by the Serbian scientist, Milutin Milankovitch, in 1938. There are three major components of the Earth’s orbit about the sun that contribute to changes in our climate.
          http://culter.colorado.edu/~saelias/glacier.html
          And also discussed here,
          http://www.pbs.org/wgbh/nova/earth/cause-ice-age.html
          where also says something about greenhouse gases:
          “Although the exact causes for ice ages, and the glacial cycles within them, have not been proven, they are most likely the result of a complicated dynamic interaction between such things as solar output, distance of the Earth from the sun, position and height of the continents, ocean circulation, and the composition of the atmosphere.

          Changes in the concentration of carbon dioxide in the atmosphere are a strong candidate to explain the overall pattern of climatic change. Carbon dioxide influences the mean global temperature through the greenhouse effect.”

          There are lots of problems with idea that CO2 caused glacial periods to warm, one problem is that the rise in CO2 levels follows after centuries after warming begins.
          There little doubt CO2 will rise if average global temperatures have increased and CO2 level will lower after long periods of cooling. Nor is there no doubt the over last few 10 million of years global CO2 level have been low- and currently are still low, in terms “normal levels of CO2 over last hundreds of million of years. The common explanation for the low levels of CO2, are related to recent [tens of millions of years] of increased tectonic activity and subsequent weathering from these newly created mountains.

          It should noted that during the seventies it feared that we would soon be entering an Ice age.
          It also should be noted that we have been an long term ice age for million years and we had what called the Little Ice Age which ended in 1850 AD- or the glaciers worldwide on average stopped advancing. There ideas about how human evolved due to this cooling world- particularly the cooling of Africa which caused in increase on grassland – or decrease of forest- which would be new niche for the new bipedal creature which later become the modern human.
          Anyhow it known that the industrial age was added CO2 and people like Svante Arrhenius predicted warming been caused
          by this human effect. Arrhenius like any sane person thought
          this would another good result. As every warming period in the past was also time of prosperity and cooling periods were things the Dark Ages.
          Anyways since the time of Arrhenius the Earth has increased it’s average temperature- not as much as Arrhenius predicted
          but his guess was more or less correct. And the guess we going to enter new Ice age, was wrong.

          We do know the El Nino result in warming and La Nina with cooling, and we have about as much luck predicting this as we have predicting solar activity.
          We also know the urban environments have what is called the Urban Heat island Effect. And neither of these has anything to do with greenhouse gases.

          • gbaikie says:

            Another aspect about GHE theory is it answering a question what causes a planet to warm up to higher temperature than
            it “should” warm up.
            Or Earth average should be 5 C and it’s 15 C.
            Or in GHE theory Earth should be -18 C, but the greenhouse gases adds 33 C.
            So accordingly the temperature of Earth can be changed by a trace gas increasing or decreasing.
            Or greenhouse gases are the steering wheel which can cause Earth become cold or very hot.
            And this question is related to why is Venus so hot and it’s why believer in GHE theory can imagine that Earth can become
            hot like Venus.

            Fundamentally, I think the flaw in this reasoning is related
            to misunderstanding of how gases function in an Atmosphere.
            Basically, Venus is hotter than it should be, because it has a massive atmosphere.
            But also Venus is not really hot- or at Earth atmospheric pressure, Venus is only a bit warmer than Earth and it’s warmer because it has twice the amount of sunlight as Earth
            has.
            Or Earth is 15 C at sea level pressure. Or one will always have highest air temperature on Earth near or below sea level.

          • Pehr Bjornbom says:

            gbaikie

            Thank you for taking up interesting issues concerning climate change in your first post. I have also read about those issues and find them challenging although I don’t feel that I am sufficiently informed in order to share much of an opinion of my own.

            Svensmark’s theory may explain some variations of the climate for which other scientists refer to the effect of increasing greenhouse gases. There have been some discussions on this issue revealing diverging scientific opinions. Anyway, Svensmark’s fundamental research is important for improving our understanding of atmospheric physics.

            The Milankovitch cycles undoubtedly trigger the changes between glacials and interglacials during the last 400000 years:
            https://en.wikipedia.org/wiki/File:Vostok_420ky_4curves_insolation.jpg

            However, as you wrote the glacial cycles are likely the result of complicated interactions. The large change of the temperature between glacials and interglacials cannot be explained only through the variations in insolation due to the Milankovitch cycles. An important contributing cause, amplifying the temperature variation, likely is the changing albedo of the planet caused by the varying area of ice. But also the changes in carbon dioxide and methane content of the atmosphere, causing a varying greenhouse effect, are considered as another amplifying effect. Anyway, as I have understood the situation, although the triggering effect of the Milankovitch cycles is clear, there is still a considerable lack of understanding of those glacial cycles. Furthermore, in the discussions of all the ice ages during the last 600 million years the effect of changes of carbon dioxide content causing changing greenhouse effect is regularly considered. A changing greenhouse effect is always present as a possible contributing factor in all those discussions of ancient climate.

            As to your second post on Earth and Venus I agree that there is a misunderstanding that Earth could become as warm as Venus. Both Earth and Venus conform very well to the greenhouse theory assuming radiative-convective equilibrium. Very schematically this theory implies that the temperature is determined by an adiabatic lapse rate through the troposphere up to the radiation altitude for long-wave IR radiation from the planet to space. Because Venus has an atmospheric mass that is more than 90 times that of Earth its troposphere is much thicker and its radiation altitude much higher. Although the temperature at the radiation altitude is about the same for Earth and Venus the temperature increase according to the adiabatic lapse rate becomes much greater for Venus giving a surface temperature of 740 K compared to 288 K for Earth. This agrees very well with the theory of the greenhouse effect and the difference is according to this theory because the surface temperature depends both on the greenhouse content of the atmosphere, and the content of other IR radiating constituents, and the gravity effect that the temperature decreases with altitude according to an adiabatic lapse rate through the troposphere to the radiation altitude.

          • gbaikie says:

            Re: “Or Earth average should be 5 C and its 15 C.”

            On average a non reflecting sphere at Earth distance should
            emit the 1360 watts per square meter that it receives from
            the sun. Or the area of disk is 1/4 of it’s spherical area- so on average a sphere should radiate 1360 watts divided by
            4 = 340 watts on average per square meter.
            Earth reflects a lot of sunlight and therefore is radiates
            less than 340 watts. Earth reflects 100 watt and radiates
            240 watts [equaling the 340 watts per square meter it receives from the Sun].
            Or if any planet did not reflect any sunlight, it would not be visible- only be visible in IR light.
            Earth, other than lights of city lights, is not visible on the night side. Or obviously it’s not reflecting sunlight at night. Or the sunlit half of earth reflects 200 watts per square meter on average.

            The sunlit side of a sphere does not receive sunlight
            equally.
            This the case if sphere has atmosphere or doesn’t.
            Or the sun lit side of the Moon does not equally per square meter receive sunlight at it’s surface. Instead most of the sunlight per square meter, occurs nearer the equator with less near the poles.
            [[But it should noted that if on the Moon and one points at the sun with a solar array, one will receive the same amount of sunlight regardless of whether at poles or the equator. Which is not the same on Earth [as Earth has the effect of it’s atmosphere].]]

            Earth [or any spherical body] has 360 degrees of longitude and latitude, 180 degrees of both would be in sunlit, and 90 degrees of both is where most of the sunlight strikes the surface.
            Since each hour is 15 degrees longitude and 90 divided 15 is 6 hours, one can say that during 6 hour of each 24 hour day, one receives more sunlight than in the other 6 hours of daylight. Or it’s cooler in morning and late afternoon and warmer when nearer noon.
            Or if harvesting solar energy, one will get most of the solar energy 3 before and after noon. And if on Earth surface, it’s still the case even if you point [or track] the solar array at the sun.
            Whereas on the moon if point solar arrays, every hour of sunlight has the same intensity.

            A degree of latitude on Earth is equal to 111 km- 180 degrees of sunlit hemisphere is 19,980 km, and portion receiving most sunlight is within 90 degrees of longitude is
            90 times 111 km = 9990 km diameter. Or 4995 km in radius.

            Or wherever and whenever the sun is directly overhead [at zenith] within 4995 km radius of that spot is where most of sunlight is hitting the level surface [gravity make the surface on average level- or at least the ocean will be level- if you disregard the waves].
            Within the circle [5000 km radius] one receives the most sunlight per square meter AND one has the least amount of sunlight reflected per square meter.
            Or in the 200 watts per square meter of reflected sunlight of the sunlit side, less than average is reflected in the 5000 radius circle. Or less in donut hole and more in the donut surrounding it is reflected.
            Or when sun at Zenith one receives about 1050 watts of direct sunlight and 1120 watts reaching a square meter of direct and indirect sunlight [https://en.wikipedia.org/wiki/Sunlight].
            So 1360 – 1120 is 240 watts. And of the 240 watts about 100 watts [or more] is absorbed by a clear sky, leaving about 140 watts which could reflected before reaching the surface. Outside the donut, one has more absorbed and more reflected per square meter [and more diffused- more indirect sunlight compared to direct sunlight].

            So with airless world the 45 degrees [longitude and latitude] away from the point of Zenith receive the most amount of sunlight per square meter or in this region the ground is warmed the most. And a world with thick atmosphere like Earth, roughly the direct heating effect is more dramatic [of course in terms of indirectly, atmosphere distributes the heating]. Moon:
            http://staff.diviner.ucla.edu/science.shtml
            40 degree latitude having surface temp at noon of + 350 K [350 K = 76.85 C]. Also 40 latitude north and south is about
            half the surface of the Moon- same with Earth.
            Or tropics of Earth is 23 degree north and south and tropics
            receives about 1/2 of Earth’s Sunlight. Or tropics is about
            40% of total surface area of Earth and tropical regions warms the rest of the Earth surface. Or above 40 degree latitude [North and South] receives very sunlight which heats it.
            Or without considering the heating from an ocean and/or atmosphere Earth would be 5 C, because half of world above
            40 degrees latitude would be very cold and lowers the average of the warmer equatorial region.
            Or one could have a warmer tropics than we have, and have average temperature colder than we have. Or a 5 C average temperature world doesn’t mean tropics is somewhere near 5 C, rather it means the night and day average temperature above 40 degree latitude is very cold.
            Or any kind of greenhouse effect is not warming the
            tropics- rather it’s the intense sunlight in the tropics which is warming the tropics.
            Or even in the fantasy of earth without greenhouse gas being -18 C, the tropics is still warm. But in such fantasy
            CO2 would be freezing out at the poles.
            Or what warms above 40 degrees latitude is heat transport
            from the tropics and greenhouse gas has nothing to do with this heat transport [rather it’s massive ocean flows and massive atmospheric circulation- see Hadley cell [or https://en.wikipedia.org/wiki/Hadley_cell%5D

        • Kristian says:

          Pehr Bjornbom says, August 9, 2016 at 4:29 PM:

          You are rejecting important things that I have said based on what I have learnt from studying literature on atmospheric physics and especially the greenhouse effect.

          What exactly am I rejecting? The claim that more CO2 in the atmosphere MUST make the global surface warmer on average? If so, I’m pretty comfortable with that rejection. Because there isn’t a single piece of empirical evidence from the real Earth system indicating that is does.

          This raises the question what is your own source of information on those issues? Could you give some literature references that we could study in order to better understand your statements?

          Mmm, not quite sure what you mean. If you’re referring to my mentioning of the satellite measurements showing how the speculative idea of the “enhanced GHE” fails against real-world observations, I already pointed out ERBE/ERBS and CERES EBAF for you, didn’t I?

        • Does this mean that Pehr Bjornbom is truly a learnt ?

  86. Pehr Bjornbom says:

    Mike Flynn August 4, 2016 at 6:31 PM

    Here is my response to your question.

    From a thermodynamic point of view Earth is an open system, although it is often being assumed with good approximation that it is a closed system, not exchanging matter with space. However, it is doubtless a diabatic system and no greenhouse gas whatever would be able to change it to becoming adiabatic.

    Thus, saying that carbon dioxide is an insulator has no scientific meaning. However, as a metaphor one may say that carbon dioxide works as a thermal insulator, referring to that the surface temperature of the planet will be greater with carbon dioxide than without carbon dioxide in the atmosphere. It is like with thermal insulation in the walls of your house. With more such insulation you can keep a higher temperature in your house without burning more fuel. For our planet the radiation from the sun corresponds to the fuel and the increased insulation in the walls corresponds to increased carbon dioxide in the atmosphere.

    However, this is not a scientific explanation of the greenhouse effect, but merely a metaphor in order to give a popular view of how this effect is increasing the surface temperature of the planet.

    • “However, as a metaphor one may say that carbon dioxide works as a thermal insulator, referring to that the surface temperature of the planet will be greater with carbon dioxide than without carbon dioxide in the atmosphere.”

      This may possibly be correct for a planetary atmosphere with no convection (outward atmospheric heat transfer via atmospheric mass motion). On this Earth, exactly the opposite is the physical result. The emissive CO2 (with its sensible heat) is moved to higher altitude to be able to dispatch entropy via EMR flux to space more efficaciously than can be done through the atmosphere from the surface. The surface temperature, and whole atmospheric column temperature “must” go lower as atmospheric CO2 fraction increases.

      • Pehr Bjrnbom says:

        The result in climate science that the surface temperature will increase with increasing carbon dioxide in the atmosphere was in fact obtained assuming a planetary troposphere with intensive convection, that is outward atmospheric heat transfer via atmospheric mass motion (Manabe and Wetherald, 1967). This is called the radiative-convective equilibrium assumption in the atmospheric physics theory of the greenhouse effect.

        Reference:
        Syukuro Manabe and Richard T. Wetherald (1967). Thermal Equilibrium of the Atmosphere with a Given Distribution of Relative Humidity. JAS, 24, 241-259.
        http://journals.ametsoc.org/doi/pdf/10.1175/1520-0469%281967%29024%3C0241%3ATEOTAW%3E2.0.CO%3B2

      • Tim Folkerts says:

        “[CO2] able to dispatch entropy via EMR flux to space more efficaciously than can be done through the atmosphere from the surface.”

        No.

        In the IR band near 15 um, the warm surface radiates rather strongly. Without CO2 (and clouds) to block this IR, large amounts of 15 um IR would be dispatched to space. With CO2, this strong 15 um IR from the surface is absorbed. The 15 um IR that *is* dispatched to space come from the cool upper layers of the troposphere. And IR from the cool CO2 will be much less intense than from the warmer surface.

        So CO2 dispatches energy to space LESS efficaciously.

        • Tim Folkerts says: August 9, 2016 at 4:35 PM

          ([CO2] able to dispatch entropy via EMR flux to space more efficaciously than can be done through the atmosphere from the surface.)

          “No. In the IR band near 15 um, the warm surface radiates rather strongly.”
          Tim, Near the surface any atmospheric CO2 above 140ppmv results in a local atmospheric opposing radiance at or above that of the surface except for mid ocean. Any surface exitance from 14-16 microns is 98% absorbed in the first 4 meters of atmosphere (measured) Notice I stated “through the atmosphere”. At CO2 levels above 140ppmv All radiative exitance to space in that 14-16 micron band originates at or above the tropopause only! The 20 century increase in atmospheric CO2 has only increased EMR exitance to space.
          [CO2] able to dispatch entropy via EMR flux to space more efficaciously than can be done through the atmosphere from the surface.

          • Tim Folkerts says:

            I am not quite sure what is magical about 140 ppm, or how you arrived at this number.

            “Any surface exitance from 14-16 microns is 98% absorbed in the first 4 meters of atmosphere “
            That sounds about right.

            “… results in a local atmospheric opposing radiance at or above that of the surface “
            Downward radiance (in the 15 um band under discussion) from the atmosphere will only be larger than the upward radiance from the surface if the first few meters of air are warmer than the surface. Since this is rarely true, it is much safer to assume the “opposing radiance” would be at OR BELOW the surface radiance.

            “At CO2 levels above 140ppmv All radiative exitance to space in that 14-16 micron band originates at or above the tropopause only!”
            The band actually extends more like 13-18 um. Certainly near the center of the band where CO2 absorbs the best, some or all of the IR to space comes from above the tropopause. However, toward the edges of the band where CO2 absorbs poorly you would need to go farther and farther downward (ie well below the tropopause) to find the origins of the IR.

            So there are two competing trends.
            * Near the center of the band, more CO2 pushes the effective radiating level farther up into the STRATOSPHERE (where it gets warmerthan it was farther down), increasing radiation to space.
            * Near the edges of the band, more CO2 pushes the effective radiating level farther up into the TROPOSPHERE (where it gets cooler than it was farther down), decreasing radiation to space.

            It is not obvious a priori which should be the larger effect as CO2 increases. MODTRAN suggests that the edges of the band make more difference than the centers of the band. (And unless you have something *better* than MODTRAN to put forward, you can do no better than being unsure.)

          • geran says:

            Timmy believes CO2 “warms the planet”, as do most pseudoscientists.

            They entertain us without charge–does it get any better?

          • Tim Folkerts says: August 11, 2016 at 11:12 AM

            “I am not quite sure what is magical about 140 ppm, or how you arrived at this number.”

            STP atmosphere diluted by pure N2 to CO2 140ppmv has in the 14-16 micron band a measured optical depth of 1.7 meters 37% transmission of amplitude modulation of such radiative flux. I know I measured it.

          • (Any surface exitance from 14-16 microns is 98% absorbed in the first 4 meters of atmosphere )

            “That sounds about right.”

            Not ‘sounds about right’ Timmy measured!

            ( results in a local atmospheric opposing radiance at or above that of the surface )

            “Downward radiance (in the 15 um band under discussion) from the atmosphere will only be larger than the upward radiance from the surface if the first few meters of air are warmer than the surface.”

            Timmy Always gets the direction of radiance backward. ‘radiance is potential never flux! Radiance is measured opposing possible flux.

            “Since this is rarely true, it is much safer to assume the opposing radiance would be at OR BELOW the surface radiance.

            Almost everywhere in the Sahara Satchel near afternoon air temperatures are above that of the sand.

          • Testing 1234 Where can I put the rest?

  87. pochas94 says:

    The surface temperature, and whole atmospheric column temperature must go lower as atmospheric CO2 fraction increases.

    Will, I think must is a little strong. There are three zones in the atmosphere. In the Stratosphere, interactions are radiative. In the lower Troposphere convection dominates. In the upper Troposphere, they are both (convective/radiative). How all of this nets out is a matter for discussion. Miskolczi believes that based on observation the effects net out to near zero. I think “near zero” is the best answer at present. I may think differently tomorrow.

    THE STABLE STATIONARY VALUE OF THE EARTH’S GLOBAL AVERAGE ATMOSPHERIC PLANCK-WEIGHTED GREENHOUSE-GAS OPTICAL THICKNESS
    by
    Ferenc Miskolczi

    http://www.friendsofscience.org/assets/documents/E&E_21_4_2010_08-miskolczi.pdf

  88. pochas94 says: August 9, 2016 at 10:58 AM

    (“The surface temperature, and whole atmospheric column temperature must go lower as atmospheric CO2 fraction increases.”)

    “Will, I think must is a little strong. There are three zones in the atmosphere. In the Stratosphere, interactions are radiative. In the lower Troposphere convection dominates. In the upper Troposphere, they are both (convective/radiative). How all of this nets out is a matter for discussion. Miskolczi believes that based on observation the effects net out to near zero. I think near zero is the best answer at present. I may think differently tomorrow.”

    I think near zero also! This is mostly due to the highly variable “atmospheric column water”, that keep everything, not to hot, not to cold, but just right, for baby bear. What a wonderful planet!

  89. Norman says:

    Tim Folkerts

    In response to your post above, I have thought about what you stated.

    “Norman asks: If you double the mass of Earths atmosphere with more N2, why would that slow the radiant energy loss from the surface.

    Adding more non-GHG will impact the radiation by raising the radiative Top of Atmosphere (ToA). Doubling the bulk of the atmosphere (even ussing non-GHGs like N2) will raise the GHG molecules as well, so they will be radiating to space from a higher altitude. But since higher altitudes tend to be cooler due to the lapse rate, the GHGs at the new, higher, cooler ToA will radiate LESS to space. This will create a back up of energy all the way down to the surface.

    Ultimately, the surface will get warmer (and actually INCREASE the radiant energy to space through the atmospheric window to compensate for the reduced radiant energy from the TOA).

    (yes, there are lots of feedbacks that will change a few of the details, but that is the basic argument.)”

    I thought about it and then wondered wouldn’t the density of the GHG’s go down (in no new amounts were added) if you doubled the N2 so the GHE would drop to lower levels based upon the lower concentrations of these gases.

    Also the atmosphere becomes isothermal past the convective boundary for about 10 km. The radiative TOA, from my research, is about 20 km above the surface. From 10 km to 20 km it is an isothermal layer so the air would not be cooler with an increase of N2.

    http://2012books.lardbucket.org/books/principles-of-general-chemistry-v1.0/section_07/84656db9833b291483e7f5d457a41c62.jpg

    • Norman says: August 11, 2016 at 9:04 AM

      “Tim Folkerts,In response to your post above, I have thought about what you stated.”

      (Norman asks: “If you double the mass of Earths atmosphere with more N2, why would that slow the radiant energy loss from the surface.”)

      TF: (“Adding more non-GHG will impact the radiation by raising the radiative Top of Atmosphere (ToA). Doubling the bulk of the atmosphere (even ussing non-GHGs like N2) will raise the GHG molecules as well, so they will be radiating to space from a higher altitude. But since higher altitudes tend to be cooler due to the lapse rate, the GHGs at the new, higher, cooler ToA will radiate LESS to space. This will create a back up of energy all the way down to the surface…….”)

      “I thought about it and then wondered wouldnt the density of the GHGs go down (in no new amounts were added) if you doubled the N2 so the GHE would drop to lower levels based upon the lower concentrations of these gases.”

      Both you and Folkerts seem to be playing mindless religious fantasy games with no science or meaning whatsoever. Just how do you propose to double the Earth’s atmosphere with more N2? Why would you suspect that such would remain as part of Earth’s atmosphere? How could you even find out? None not one meteorologist or ‘climate scientist’ can say how much atmosphere this Earth has in molecules or mass let alone give some reason for that amount of atmosphere at this time.

      • Tim Folkerts says:

        “Both you and Folkerts seem to be playing mindless religious fantasy games”
        1) Clearly you do not understand the nature of science. Answering “what would happen if …” is exactly what science is about. The mere fact that “gedanken experiment” is standard vocabulary within science shows that such things are a common part of science. I don’t need to actually drop a ball to make predictions about what would happen if I did. I don’t need an actual planet with 2x as much N2 to make predictions about that planet.

        2) If you object to thinking about what would happen with a different atmosphere, then why do you propose an atmosphere with 140 ppm CO2 above? Even though you are now trying to raise objections, before you recognized such counter-factual thought experiments as valuable. Such self-contradictory positions don’t inspire confidence. 🙂

        3) And I know that N2 would stay because of gravity. Escape velocity. Temperature. These are all standard ideas for planetary atmospheres. If this confuses you, then you should go back and learn a little more.

        • Tim Folkerts says:August 11, 2016 at 12:42 PM

          WJ:(Both you and Folkerts seem to be playing mindless religious fantasy games)

          “1) Clearly you do not understand the nature of science. Answering what would happen if is exactly what science is about. The mere fact that gedanken experiment is standard vocabulary within science shows that such things are a common part of science. I dont need to actually drop a ball to make predictions about what would happen if I did. I dont need an actual planet with 2x as much N2 to make predictions about that planet.”

          You in your post modern physics seem to think science is some sort of fantasy ‘what if game’, and fantasy predictions based only on your fantasy. Nothing wrong with a stupid/smart wild assed guess. The immediate next thing is “Why is this wrong?” to yourself, and all around you, with investigation. You seem to miss that part, only wishing confirmation of your stupid SWAG. Then you have the audacity to call your sandbox ‘science’!

        • “3) And I know that N2 would stay because of gravity. Escape velocity. Temperature. These are all standard ideas for planetary atmospheres. If this confuses you, then you should go back and learn a little more.”

          Oh really! At twice the surface pressure, Why ‘oh why’ would your new atmosphere not be “forced by gravity” to blow back down all of the Earth’s volcanic vents?

  90. Norman says:

    Will Janoschka

    Say what?
    YOU: “None not one meteorologist or climate scientist can say how much atmosphere this Earth has in molecules or mass”

    https://en.wikipedia.org/wiki/Atmosphere_of_Earth

    The number can vary a bit but that is about the mass of Earth’s atmosphere. You can determine number of molecules by taking the percentages of each gas and then converting to moles (number of molecules). Chemists do this quite a bit when making reagents.

    The science meaning is to work on Kristian’s idea that mass is a major contributor of surface temperature, I agree with Kristian that you need a certain amount of mass to hold temperature for the GHE to work but that is about all I agree with him on. I do not think a pure nitrogen Earth would be as warm as our current one with GHG in it to generate a downwelling IR that lowers the outgoing loss of energy.

    • Kristian says:

      Norman, please stop misrepresenting my position. You say:

      (…) I agree with Kristian that you need a certain amount of mass to hold temperature for the GHE to work but that is about all I agree with him on. I do not think a pure nitrogen Earth would be as warm as our current one with GHG in it to generate a downwelling IR that lowers the outgoing loss of energy.

      I don’t either, Norman, and you know that, because we already agreed on it back on Spencer’s previous post, didn’t we? But just like Folkerts, you need to distinguish between Earth’s SURFACE and Earth’s bulk ATMOSPHERE. The former would be colder than in the current state, but the latter would be hotter. So whether or not “Earth” would end up a colder or a hotter place is really all a matter of definition. It depends on where you place your thermometer. But yes, T_s would be lower. So this is not something we disagree on, Norman.

      My stance is this (quoted from a comment above):
      “(…) what Im saying is not that an atmospheres IR-absorbing/emitting properties dont count for anything. What Im saying is simply that the atmospheres DEGREE of IR activity (that is, its concentration of IR-active constituents) doesnt matter. Either the atmosphere is IR active, or its not. There is no in between. No gradation. Because as soon as its become IR active, atmospheric circulation (convection) takes care of the rest.

      When it comes to atmospheric MASS, however, it DOES matter whether its large, intermediate or small. And the real-world evidence for this is:

      Mars >> Earth/Titan >> Venus”

      This also ties in well with what Folkerts stated regarding doubling the mass of Earth’s atmosphere with more N2.

      • Kristian says:

        “This also ties in well with what Folkerts stated regarding doubling the mass of Earths atmosphere with more N2.”

        That is, it wouldn’t ‘dilute’ the “GHE”. It would enhance it substantially.

        • gbaikie says:

          If Earth atm was 2 atm of pressure by adding N2- so about 90%
          N2 10% oxygen and 1/2% Argon, and 200 ppm of CO2, then I tend to think it could cool earth’s temperature. But not certain about it. Or if Earth was 4 atm, I think it would cool Earth.
          But a 2 atm Earth should reflect more sunlight and when sun’s at zenith and clear day at noon, one should have less than 1000 watts per square meter of sunlight or not going to have 1050 watts per square meters, and could be just below 1000 watts by a bit.
          When the sun is further than 45 degree away from zenith, the atmosphere would diffuse and reflect a lot sunlight as compared to a 1 atm Earth. A human familar to 1 atm Earth atmosphere would probably would notice the dimming of sunlight- or would be different world that one should notice.
          Whereas the increased pressure and less oxygen would be less noticeable- though one has a bigger difference if you breath pure O2. And the fires don’t burn as rapidity. And if jumping out of airplanes one has slower terminal velocity.
          One should have less difference of air temperature and surface temperature, or with 1 atm earth the land surface temperature [the ground] can be more than 20 C warmer, with 2 atm it might be around 15 C difference. But with ocean there is not much difference between ocean surface temperature and surface air temperature with 1 atm atmosphere- so that not going to change much with 2 atm.
          Earth’s average temperature is controlled by ocean surface temperature- largely because 70% of surface is ocean, or in tropics, 80% of surface is ocean surface.
          And I believe that if 1 atm tropical ocean temperature is the same as 2 atm tropical ocean temperature, then the partial pressure of H2O is the same. And partial pressure of H20 controls evaporation rate.
          So boiling point of water would be much higher in 2 atm world- 131 C vs 100 C of 1 atm world. – http://www.engineeringtoolbox.com/boiling-point-water-d_926.html
          Or boiling potatoes or noodles should be a faster cooking times in 2 atm world.

          If one has same temperatures, humans would feel colder at 20 C- or Humans control their temperature mostly by evaporation but convectional loss is also factor. Or dogs would pant less if temperature are the same. Though higher temperatures of 90 F or more would feel hotter. Or surviving 100 C sauna would be less doable- a few minutes at 1 atm becomes would be like less than minute in 2 atm- even though one is though 31 degree away from water’s boiling temperature.
          [[“The temperature in Finnish saunas is 60 to 100 C (140 to 212 F”)- wiki. Would have to change to 60 to about 90 C.]]
          So with ocean surface temperature of 20 C on 2 atm world, should have same partial pressure as 1 atm world, but
          on 2 atm world and at elevation where is it 1 atm obviously it than should have lower partial pressure. What elevation is 14.7 psi?
          And earth 1/2 atm is. Hmm make it 15 C:
          sea level: 14.696 psi
          15,000′ : 8.297
          It’s about 18,000′
          Anyhow, make simple:
          http://www.engineeringtoolbox.com/standard-atmosphere-d_604.html
          And 1 atm elevation on 2 atm will be less than 18,000 feet and density at sea level will be more than twice as compared
          to 1 atm which is 1.2 kg per cubic meters. Or density on 2 atm world at same temperature will 2.5 kg [or more].
          Well if same temperature, the 2 atm world will not have anywhere close to troposphere twice as high and at elevation
          where there is 1 atm pressure it will be much colder and therefore denser. I am sure, but it seems the troposphere could be lower. Or basically one has very dense air from 0 to 5 km- if it’s not warmer air, than 1 atm Earth.
          Or there should more uniformity of temperature and troposphere of tropics should lower than on Earth- and perhaps higher pole ward as compared to Earth.
          It seems only way a 2 atm world could as warm or warmer
          is there “might” be less clouds in the tropics [and less clouds in general].
          Also it seems with 2 atm world, there less difference between wet and dry lapse rate.
          And were there the same amount of water in atmosphere it would a lower percentage or ppm.

          • Kristian says:

            gbaikie says, August 11, 2016 at 6:37 PM:

            If Earth atm was 2 atm of pressure by adding N2- so about 90% N2 10% oxygen and 1/2% Argon, and 200 ppm of CO2, then I tend to think it could cool earths temperature. But not certain about it. Or if Earth was 4 atm, I think it would cool Earth.

            This makes no sense, gbaikie. So the heavier and thicker the atmosphere, the colder the surface, is that what you’re saying? This sounds bizarre.

            Example: The Martian atmosphere has about 960 000 ppm CO2 in it, pretty much the same concentration as the Venusian one. But since the average atmospheric pressure at the surface is ~14,600 times as high on Venus as it is on Mars, a consequence of a hugely more massive atmosphere, then using your apparent logic, T_s on Venus should be MUCH, MUCH lower than on Mars. We both know it’s not. The opposite is the case.

          • gbaikie says:

            — Kristian says:
            August 12, 2016 at 12:37 AM

            gbaikie says, August 11, 2016 at 6:37 PM:

            If Earth atm was 2 atm of pressure by adding N2- so about 90% N2 10% oxygen and 1/2% Argon, and 200 ppm of CO2, then I tend to think it could cool earths temperature. But not certain about it. Or if Earth was 4 atm, I think it would cool Earth.

            This makes no sense, gbaikie. So the heavier and thicker the atmosphere, the colder the surface, is that what youre saying? This sounds bizarre.–

            Well 4 atm should have a significant effect amount of sunlight reaching the surface. With 2 atm it seems more uncertain. Or one going to get some amount reduction in amount of sunlight reaching the surface, one is also going to less heat loss during the night and as said it seems the air on Land will have less difference between ground temperature which warmed by the sun and the surface air temperature.

            Generally I would say earth is warmed by the surface being warmed by sunlight.
            Central issue seems to be would 2 Atm cause tropical oceans
            to be warmer?
            Though it seems to me that 2 atm seems could cause higher land air temperatures in the day.
            Or if the oceans were to disappear leaving the vast depression which are are average 4 km lower in elevation, the ocean floor would have very high air temperature- or could get day time highs as much as around 60 C.
            Or 2 atm atmosphere should allow there to be a higher highest temperature occurring as compared to Death Valley, CA 1913 of 57C [134F]
            But such highest temperatures are weather related rather than a global average temperature. Or yesterday, it’s daytime high was about 115 F [46 C]

            “Example: The Martian atmosphere has about 960 000 ppm CO2 in it, pretty much the same concentration as the Venusian one. But since the average atmospheric pressure at the surface is ~14,600 times as high on Venus as it is on Mars, a consequence of a hugely more massive atmosphere, then using your apparent logic, T_s on Venus should be MUCH, MUCH lower than on Mars. We both know its not. The opposite is the case.”

            I don’t think Venus is heated by sunlight warming it’s surface. I think Venus is heated by sunlight warming the it’s clouds, the acid has a high boiling temperature and are tens of kilometers above the surface in sunlight which is somewhere in range of 2000 to 2600 watts per square meter.
            I think lacking these clouds Venus would be much cooler and I don’t think it would have it’s global wind and without global wind rotating the planet every 4 to 5 days the night side would become cooler.
            Or if Venus surface was being heated, the air would rise up from the surface- and it doesn’t.

          • Kristian says:

            gbaikie says, August 12, 2016 at 4:49 AM:

            “Well 4 atm should have a significant effect amount of sunlight reaching the surface.”

            Why? We’ve quadrupled the mass using radiatively inert N2 gas only. No interaction with EMR, outgoing OR incoming. That’s the premise.

            “Generally I would say earth is warmed by the surface being warmed by sunlight.”

            Duh!

            “Central issue seems to be would 2 Atm cause tropical oceans
            to be warmer?”

            Of course they would be! That is twice the atmospheric pressure on the ocean surface. How do you think that would affect the mean evaporation rate?

            “(…) if Venus surface was being heated, the air would rise up from the surface- and it doesnt.”

            Sure it does. Only bitterly slow.

          • gbaikie says:

            — Kristian says:
            August 12, 2016 at 8:37 AM

            gbaikie says, August 12, 2016 at 4:49 AM:

            Well 4 atm should have a significant effect amount of sunlight reaching the surface.

            Why? Weve quadrupled the mass using radiatively inert N2 gas only. No interaction with EMR, outgoing OR incoming. Thats the premise.–
            Nitrogen is a transparent gas- anything transparent can diffuse and reflect the light it’s transparent to.

            But if the premise is we are dealing with a magical gas which no effect upon Sunlight and we are calling N2.
            Hmm, well as said the denser and more mass per cubic meter, the gas the the more it convective it is in terms of heat- or ground temperature will be closer to the air temperature. Plus humans which are warm body would be effected more by the air temperature. Or it will feel warmer or colder- 15 C will cool a human body more, and 40 C air temperature will be feel hotter. And insulating house will be less effective. Or in a vacuum is easy to to insulate a house.

            –Central issue seems to be would 2 Atm cause tropical oceans
            to be warmer?

            Of course they would be! That is twice the atmospheric pressure on the ocean surface. How do you think that would affect the mean evaporation rate?–

            The partial pressure of a gas affect the evaporation of the same gas as it’s liquid.
            Though Water also become super saturated.
            That is a large uncertainty I have regarding a 2 atm world.
            If a 2 atm slows the evaporation rate at higher temperatures of ocean water, than ocean surface water could have higher temperature, then earth’s current oceans.
            Or if a 2 atm transports more heat poleward from the tropics, as compared to 1 atm world- that would warm regions outside the tropics more. Btw, if this is the case a 2 atm world could have very dangerous winds- or wind power might work.

            At noon and sun is at zenith there not much difference between a 1 atm world and 2 atm world. What would look different in terms of “normal” 1 atm cloud formation in the tropic vs 2 atm cloud formation in the tropics?
            Or would it pretty much appear the same?

            –() if Venus surface was being heated, the air would rise up from the surface- and it doesnt.

            Sure it does. Only bitterly slow.–

            Or instead of bitterly slow another adjective could be immeasurably slow.
            For the Venus surface to be heated, does it matter where the sun is? For example, does sunlight heat the surface on the night side of the planet as much as it does on sunlit side?

          • gbaikie says:

            “Molecular scattering reduces the direct beam of sunlight transmitted through the atmosphere. Most of this is due to the nitrogen and oxygen molecules because they are the primary constituents of the atmosphere.”
            http://www.calpoly.edu/~rfield/SolarFlux.htm

            Agree, or for example if CO2 was primary gas it would cause most of reflection and scattering. Or if there was less atmosphere one would have less reflection and scattering.
            And obviously if add more atmosphere one gets more.

            “Three atmospheric processes modify the solar radiation passing through our atmosphere destined to the Earth’s surface. These processes act on the radiation when it interacts with gases and suspended particles found in the atmosphere. The process of scattering occurs when small particles and gas molecules diffuse part of the incoming solar radiation in random directions without any alteration to the wavelength of the electromagnetic energy (Figure 7f-1). Scattering does, however, reduce the amount of incoming radiation reaching the Earth’s surface. A significant proportion of scattered shortwave solar radiation is redirected back to space.”
            http://www.physicalgeography.net/fundamentals/7f.html

            Both reference are near the top of google search of
            “loss of sunlight due to atmosphere”
            The second ref has chart and says 6% of sunlight is reflected by the atmosphere- 1360 times .06 is 81.6 watts.
            It also says most of sunlight is reflected by clouds,
            being 20%. Or 1360 times .2 is 272 watts.

            “Figure 7f-5 describes the modification of solar radiation by atmospheric and surface processes for the whole Earth over a period of one year. Of all the sunlight that passes through the atmosphere annually, only 51% is available at the Earth’s surface to do work. This energy is used to heat the Earth’s surface and lower atmosphere, melt and evaporate water, and run photosynthesis in plants. Of the other 49%, 4% is reflected back to space by the Earth’s surface, 26% is scattered or reflected to space by clouds and atmospheric particles, and 19% is absorbed by atmospheric gases, particles, and clouds.”

            I am not claiming this is particularly accurate- others will give varying numbers, but everyone should roughly agree the N2 and O2 [because they are the majority of the Earth gases] reflects and diffuses sunlight. Or any transparent gas will reflect and scatter sunlight.

    • Norman says: August 11, 2016 at 12:01 PM

      Will Janoschka

      Say what?
      YOU: None not one meteorologist or climate scientist can say how much atmosphere this Earth has in molecules or mass
      https://en.wikipedia.org/wiki/Atmosphere_of_Earth

      That estimate of atmospheric mass 5.15×10^18 kg is completely bogus done by illiterate meteorologists with no comprehension of analytic geometry!

      The actual Earth atmospheric mass is less that 2×10^18 kg. Such is very iffy as Earth’s atmosphere is in continuous dynamic motion relative to anything. This is not my provable conjecture but only a studied challenge to the illiterate meteorologists to demonstrate that Earth’s actual atmospheric mass is that high!

      • Norman says:

        Will Janoschka,

        Do you have any supporting evidence to the estimated mass is incorrect? You state the mass is less than 2 x 10^18 kg, do you have link to location where this number was determined. Dynamic motion would have no effect on total mass. The mass will not change unless it removed from the atmosphere (via escape) or being absorbed and converted to other molecules. From what I have learned is most cycles are in a steady state.

        Not sure this is valid: YOU “That estimate of atmospheric mass 5.1510^18 kg is completely bogus done by illiterate meteorologists with no comprehension of analytic geometry!”

        Pretty bold conjecture. It would be nice if you had some proof of your statements. I will not assume meteorologists are illiterate and possess no comprehension of analytic geometry.

        • Norman says: August 12, 2016 at 4:54 AM

          “Will Janoschka,
          Do you have any supporting evidence to the estimated mass is incorrect? You state the mass is less than 2 x 10^18 kg, do you have link to location where this number was determined.”

          The atmospheric mass as 5.15 x 10^18 kg is incorrectly calculated as surface pressure 101.325 kPa being the columnar force of vertical atmospheric mass under the vector attraction of massive Earth. While weight is a vector quantity, atmospheric pressure is a scalar with absolutely no vector quality. In projective geometry with a centre compressive attractive force upon external mass (gravity) the scalar pressure “must” be PI times the attractive force of some vertical columnar mass.

          • Norman says:

            Will Janoschka

            You may be brilliant in the sphere of mathematics but why would you use projective geometry in figuring out the mass of the Earth’s atmosphere?

            https://en.wikipedia.org/wiki/Projective_geometry

          • Pehr Bjornbom says:

            Will Janoschka August 12, 2016 at 5:38 AM

            There are two forces caused by pressure acting on a vertical column of air. At the bottom there is a vertical normal force directed upwards F1=p1*A where A is the cross-sectional area, p1 is the pressure and F1 is the force. The force F1 is a vector parallell to the normal vector of the surface with area A and directed upward because the pressure is acting from below. The pressure is a scalar but the force and the normal vector of the surface are vectors.
            https://en.wikipedia.org/wiki/Pressure#Formula

            The other force F2=p2*A is acting on the top of the column and is directed downward. At mechanical equilibrium F1-F2=g*M where M is the mass of the air column. This is so because the gravity force of the air column is directed downward and must be equal to the resultant upward force acted on the column by forces F1 and F2. This gives that

            M=(p1-p2)*A

            From this equation the mass of the atmosphere can be calculated by using the surface area of Earth as A and setting p2=0.

        • Pehr Bjornbom says: August 13, 2016 at 12:04 PM

          As a chemical engineer how in the world can you have that kind of a concept of gas pressure? Any gas pressure is the us the force normal to a surface from the reversal of molecular momentum from all the 2PI steradian angles in a hemisphere integrating 2mvcos(theta), angle from normal, over that hemisphere yields a normal force PI times the force induced by gravitational attraction (compression). That is what the pressure must be to support the whole atmosphere, not just that of the columnar mass radially outward from any altitude. You must be reading some meteorology nonsense to introduce that kind of error. The PI is the scaling factor ignored by climate clowns just as they ignore any type of moving air-mass coherent momentum. They have no science!

          • Pehr Bjornbom says:

            Will Janoschka August 13, 2016 at 12:36 PM

            What you write is elementary knowledge on gas pressure that we learn in the beginning of our university studies in chemical engineering but you make a flawed conclusion. This elementary knowledge gives that the force the gas pressure is exercising on a surface element is parallel to the normal of the surface element with opposite direction:
            https://en.wikipedia.org/wiki/Pressure#Formula

            From the point of view of gas kinetics this is because the component of momentum normal to the surface element of each molecule colliding with the surface element is reversed. The average rate of such changes in momentum from all collisions of molecules give rise to the force normal to the surface element. This theory shows that the strength of the force equals the pressure times the surface area of the surface element:

            F=p*A

            Obviously you need to refresh some fundamentals in gas kinetics and elementary physics.

      • Tim Folkerts says:

        “The actual Earth atmospheric mass is less that 210^18 kg.
        Say WHAT!? It is outrageous claims like this that instantly destroy credibility.

        A quick back-of-the-envelop calculation gives the answer. Since P = F/A = mg/A, then m = PA/g.

        m = (1.01e5 N/m^2) * (5.1e14 m^2) / (9.8 m/s^2)
        = 5.25e18 kg

        There are a couple corrections (primarily that this used sea level pressure but the atmosphere doesn’t always go down to sea level, so there is less atmospheric mass than this would estimate).

        But there is no way the answer can be more than 2x off.

        By all means, you could show off your skills with analytic geometry and show how you get your answer. You might start by numerically integrating the density of the “standard atmosphere”. You will find that the the first 5000 m or so already has more mass than you claim for the entire atmosphere!

        • Tim Folkerts says:

          That should, of course, be “2 x 10^18 kg” when I quoted Will in my post. Some formatting got lost somewhere along the way.

          **********************************************

          And now that I see his “clarification” above, I am even less impressed.

          “In projective geometry with a centre compressive attractive force upon external mass (gravity) the scalar pressure must be PI times the attractive force of some vertical columnar mass.”

          In the words of Pauli, this is “not even wrong”.

        • Tim Folkerts says: August 12, 2016 at 5:38 AM

          The actual Earth atmospheric mass is less that 210^18 kg.
          Say WHAT!? It is outrageous claims like this that instantly destroy credibility. ”
          Please give your measurements of Earth’s Atmospheric mass rather than your insane claims!

          • Norman says:

            Will Janoschka,

            Here is a simple derived atmospheric mass similar to Tim Folkerts using established physics equations that have endured the test of time and repeated experimentation.

            http://www.theweatherprediction.com/habyhints2/487/

            You seem to like to use highly emotional language to make your points seem more valid. In your reply to Tim Folkerts you use the choice words “insane claims!”

            He did give you measurements of Earth’s Atmospheric mass. You use the pressure and gravitational force to get the answer. Both these are measured values.

          • Norman says: August 12, 2016 at 8:46 AM

            “Will Janoschka,Here is a simple derived atmospheric mass similar to Tim Folkerts using established physics equations that have endured the test of time and repeated experimentation.”
            http://www.theweatherprediction.com/habyhints2/487/

            Again the very same false claim that Earth’s surface atmospheric pressure is related to some columnar atmospheric mass rather than gravitational compression of ‘all’ atmospheric mass. Where oh where is any physical evidence that your fantasy is correct?

          • Norman says:

            Will Janoschka

            I am not sure I am following what you are stating.

            YOU: “Again the very same false claim that Earths surface atmospheric pressure is related to some columnar atmospheric mass rather than gravitational compression of all atmospheric mass. Where oh where is any physical evidence that your fantasy is correct?”

            The equation takes the surface area of the Earth, multiplies the force of one meter by all this area and divides the total force on the Earth’s surface by the gravitational acceleration (F=ma). Is there any way you can phrase it differently as I am not understanding your point.

            I fail to see how multiplying the force by the area of the Earth’s surface is not taking in the compression of all the atmospheric mass.

            Also I do not know why you consider this a “fantasy”. It could be incorrect application of physics but it would not be a “fantasy”. Why the use of these type of words? What do you gain from it? Just state clearly why you think the calculation is incorrect and show some proof of your calculation based upon established physics and leave the charged words for political blogs.

          • I’m not sure what you two are disagreeing over…the total mass (actually, weight) of the atmosphere can be computed simply by multiplying average surface atmospheric pressure (14.7 lbs/sq. inch) by the number of square inches covering the Earth.

            While compression of the atmosphere occurs at every altitude in proportion to the weight of the atmosphere above, that compression is a separate issue from the total weight of the atmosphere. The total weight of the ocean at the bottom of the ocean doesn’t depend on compression of sea water, does it?

          • Norman says:

            Dr. Spencer

            I will do your calculation.

            Surface area of Earth: 197 million square miles
            http://www.space.com/17638-how-big-is-earth.html

            Square Miles to Square Inches = 4.0145 x 10^9

            Square Inches of Earth’s surface = (197 x 10^6)(4.0145 x10^9) =790,856,500,000,000,000 square inches

            Multiply by the provided 14.7 lbs/in^2 and you get
            (790,856,500,000,000,000 inch^2)(14.7 lbs/inch^2)= 11,625,590,550,000,000,000 lbs.

            Convert to kilograms (1 lb = 0.45359 kg)= 5,273,251,617,574,500,000 kilograms

            5.27 x 10^18 kg. Same as all the other methods.

            The question is that Will Janoschka believes meteorologists that calculate this number to be illiterate and he believes it is about 1/2 of this value but he does not provide any evidence to support his value. That is where the argument is coming from.

          • Norman says: August 12, 2016 at 10:24 AM

            (Will Janoschka YOU: Again the very same false claim that Earths surface atmospheric pressure is related to some columnar atmospheric mass rather than gravitational compression of all atmospheric mass. Where oh where is any physical evidence that your fantasy is correct?)

            “The equation takes the surface area of the Earth, multiplies the force of one meter by all this area and divides the total force on the Earths surface by the gravitational acceleration (F=ma). Is there any way you can phrase it differently as I am not understanding your point.”

            The false assumption is that surface pressure (of the atmosphere) is due to some gravitational accelerative “force” of the air-mass radially outward from that surface area. Earth’s gravity does not accelerate the air-mass, it compresses the air-mass. The acceleration is a vector quantity, pressure is a scalar not a vector and must account for the ‘normal’ components of ‘all’ momentum changes of molecular rms velocity in every direction.
            If theta is the directional angle from normal then the surface integral over the hemisphere of 2mv cos(theta) is PI times the so called “normal force of gravity”. That PI is a required scaling factor to properly convert your (F=ma) to pressure or for a unit area (P = PIma) where m is the columnar atmospheric mass radially outward from any altitude.

            “I fail to see how multiplying the force by the area of the Earths surface is not taking in the compression of all the atmospheric mass.”

            Such is fine once you scale things correctly for the meaning of pressure

          • Roy W. Spencer, Ph. D. says: Aug 12, 2016 at 12:29 PM

            “Im not sure what you two are disagreeing overthe total mass (actually, weight) of the atmosphere can be computed simply by multiplying average surface atmospheric pressure (14.7 lbs/sq. inch) by the number of square inches covering the Earth”

            Dr. Spencer,
            Archimedes clearly and effectively demonstrated that the atmosphere exhibits none of the attributes associated with weight in 271 BC. Your conversion from gravitational force to surface pressure is but another meteorological “simple, straightforward. and wrong”. See my response to Norman above.

          • Tim Folkerts says:

            Ah! It seems Will is mixing in (and mixing up!) some ideas from kinetic theory. Something related to this perhaps …
            http://kaffee.50webs.com/Science/images/KTG.origin.of.pressure.gif
            where molecules heading in various directions all contribute to the pressure against a surface, and the angles must be taken into account.

            He’s still not getting it right in the end, but at least I can (sort of) see where he is coming from.

          • Tim Folkerts says: August 13, 2016 at 11:04 AM

            “Ah! It seems Will is mixing in (and mixing up!) some ideas from kinetic theory. Something related to this perhaps ”

            So how about the grand college lecturer presenting the proper method for converting Earth’s gravitational compressive potential into atmospheric pressure at any and all altitudes and locations

          • Pehr Bjornbom says:

            This brief presentation of the kinetic theory of gases I find very worthwhile reading. In fact the gas pressure is derived from the definition that P=F/A where F is the strength of the force normal to the surface element with area A. The force F is caused by the rate of momentum change due to collisions of the gas molecules with the surface element.
            http://galileo.phys.virginia.edu/classes/252/kinetic_theory.html

  91. Norman says:

    Kristian,

    My apologies for misrepresenting your position.

    I do disagree with your statement: “My stance is this (quoted from a comment above):
    () what Im saying is not that an atmospheres IR-absorbing/emitting properties dont count for anything. What Im saying is simply that the atmospheres DEGREE of IR activity (that is, its concentration of IR-active constituents) doesnt matter. Either the atmosphere is IR active, or its not. There is no in between. No gradation. Because as soon as its become IR active, atmospheric circulation (convection) takes care of the rest.”

    My reason for not agreeing with it is based upon this article which contradicts your view and some material within is based upon empirical measurements along with mathematical evaluation. I would need very strong counter proof to accept your statement.

    In this linked article please scroll down to Figure 1 on Page 352.

    http://www.patarnott.com/atms411/pdf/StaleyJuricaEffectiveEmissivity.pdf

    It shows the emissivity of Carbon Dioxide. As pressure increased the emissivity goes up for given concentrations but please not the 3 curves. Each is a different concentration in grams/kg. At the same surface pressure the concentration does have a noticeable effect on the emissivity of the gas. Maybe I am reading the figure wrong but I don’t think so at this time.

    • Norman says: August 11, 2016 at 7:34 PM

      “Kristian, My apologies for misrepresenting your position.”

      “It shows the emissivity of Carbon Dioxide. As pressure increased the emissivity goes up for given concentrations but please not the 3 curves. Each is a different concentration in grams/kg. At the same surface pressure the concentration does have a noticeable effect on the emissivity of the gas. Maybe I am reading the figure wrong but I dont think so at this time.”

      Abject deliberate intent to misdirect! “As pressure increased the emissivity goes up for given concentrations but please not the 3 curves.”
      As pressure is increased ‘volumetric’ concentrations (density) is increased, and a reduction in optical depth, hence emissivity. But there is no change in the ppmv of any specific gas. Such effect is disparate from some change in ppmv of a particular gas, with no change in pressure or molecular density of the aggregate.

  92. Pehr Björnbom says:

    Kristian August 10, 2016 at 10:35 PM

    Here follows my response to your comment.

    I do not find your reasoning and your diagrams convincing. OLR varies much due to the short term variations of the temperature of the troposphere from natural variations. If the troposphere is obtaining extra heat from the ocean the OLR will increase. But this increased OLR will cool the troposphere when the ocean ceases to give extra heat to the troposphere and then the temperature of the troposphere will decrease again. The opposite occurs when the ocean cools the troposphere instead.

    From 1984 to 2000 the increase in carbon dioxide of ca 35 ppm would have given a decrease in OLR of ca 0.5 W/m2 if the planet had not responded by a temperature increase. It is very uncertain how much this temperature increase is according to theory but if climate sensitivity is between 1.5-4.5 K per doubling of CO2 the temperature increase would be 0.2-0.6 K. If we only consider the effect of CO2 on the climate and no net natural variation from 1984 to 2000 we would see no change in OLR (or possibly a small decrease) and a temperature increase below 0.6 K, probably much lower. Compare this to your own diagram for 1984-2000:
    https://okulaer.files.wordpress.com/2016/07/hirs-vs-erbs-1984-2000.png

    In reality you cannot expect to see such small effects clearly from the observations of OLR and the tropospheric temperature. That is why it is not possible to verify the increased greenhouse effect with the observations we have so far of OLR and temperature. Perhaps it will be possible to see this increased greenhouse effect in the OLR measurements after 10 or 20 years from now.

    On the other hand from spectroscopic data on the OLR from the planet it is possible to see how greenhouse gases decrease the OLR and to get an idea of how much the temperature of the planet would decrease if there were no greenhouse gases in the atmosphere. I understand that this is what Dr. Roy Spencer was talking about in the video from a climate conference that I have linked to previously. Such spectroscopic data may look like this, although this is a calculated diagram:
    https://en.wikipedia.org/wiki/File:ModtranRadiativeForcingDoubleCO2.png

    • Kristian says:

      Pehr Bjornbom says, August 13, 2016 at 9:43 AM:

      I do not find your reasoning and your diagrams convincing.

      I’m sure you don’t. The data, however, doesn’t care. It shows what it shows.

      OLR varies much due to the short term variations of the temperature of the troposphere from natural variations.

      Yup. That’s it. But not only that. According to the data, it also follows tropospheric temperatures over longer, multidecadal timescales – up during decadal periods of general tropospheric temperature rise (1985-1999), flat during decadal periods of no general tropospheric temperature rise (2000-2015).

      You’re obviously in a state of denial here, Bjornbom. One of the more easily recognisable mental methods of cognitive dissonance reduction in a person with a firm-held belief, put to use whenever he’s faced with data that directly conflicts with his belief.

      But this is what the data shows, Bjornbom. And that is something that you will just have to live with.

      If the troposphere is obtaining extra heat from the ocean the OLR will increase.

      Indeed.

      But this increased OLR will cool the troposphere when the ocean ceases to give extra heat to the troposphere and then the temperature of the troposphere will decrease again.

      Of course. That’s what we see happening. And only that.

      From 1984 to 2000 the increase in carbon dioxide of ca 35 ppm would have given a decrease in OLR of ca 0.5 W/m2 if the planet had not responded by a temperature increase.

      But the planet seemingly didn’t respond to it in the way that you appear to assume it must, because the OLR rather increased substantially from 1984 to 2000, it didn’t stay flat, like it should’ve done if the rise in atmospheric CO2 in fact had been the cause of the temperature rise.

      Instead, the data clearly shows that the actual cause of the temperature rise was an increase in the ASR, the solar input (heat IN) to the Earth system, due to a marked reduction in reflected SW (significantly in the tropics).

      This fact is apparently what you don’t want to acknowledge, Bjornbom.

      Here’s the real causal chain:
      increase in ASR (heat IN) -> increase in temperature -> increase in OLR (heat OUT)

      It’s really that simple … The OLR can readily be seen to simply go up in step with tropospheric temps, after the various ENSO states and volcanic eruptions have been determined and accounted for, both phenomena giving rise to different cloud/WV and/or aerosol anomalies in the atmospheric column, disrupting – in the short term – the normally tight ‘tropo temp>OLR’ relationship.

      In reality you cannot expect to see such small effects clearly from the observations of OLR and the tropospheric temperature. That is why it is not possible to verify the increased greenhouse effect with the observations we have so far of OLR and temperature.

      Haha! Classic warmist hand-waving. Of course you can verify that the warming between 1984 and 2000 wasn’t caused by a hypothetical enhancement of a “radiative greenhouse effect (rGHE)”. How? The OLR went up with the tropospheric temps! At the same time, ASR – the heat in from the Sun – also went up (even more so) during the same interval. What more do you need, Bjornbom?

      When OLR increases, it COOLS the Earth. When ASR increases, it WARMS the Earth.

      And how do you explain this?
      https://okulaer.files.wordpress.com/2016/08/uahv6-vs-ceres-olr-gl1.png

      How is the “rGHE” strengthening and causing warming, when all the OLR does is track the tropospheric temps, and the tropospheric temps aren’t even rising?

      On the other hand from spectroscopic data on the OLR (…)

      Why do you still insist on trying to get me (and anyone else who happens to read this exchange) to follow this obvious red herring of yours? You cannot look at spectrographic data of just tiny segments of the full EMR spectrum and expect to be able to determine whether the “rGHE” has been strengthened or not, Bjornbom. You need to look at the TOTAL OLR FLUX to be able to do that.

      This is something that should be pretty obvious to everyone.

      • Kristain,
        Pehr seems to be one of the very few that try to read with comprehension what others may take the time to write. He may be another Donald! I do not know! If he asks, please answer in a manner that reflects his understanding based of his question!
        I know I never do that, I only attack, but I are an ‘old fart’, with nothing to loose. I now are attempting to become the first ‘equal opportunity bigot’. If I can find a way to piss you off, I must try dat!

      • Pehr Bjornbom says:

        Kristian,

        That the outgoing long-wave radiation OLR varies with the absorbed solar radiation ASR is self-evident. The variation of the ASR may well explain the variations of the OLR we see here:
        http://www.climate4you.com/images/OLR%20Global%20NOAA.gif

        Especially interesting is the dip around 1993 that may at least partly be explained by a volcanic eruption that emitted sulfate aerosols into the stratosphere. Those aerosols reflected solar radiation causing a decrease of the ASR.

        However such natural variations in the ASR and the OLR has nothing to do with the increasing greenhouse effect due to increasing content of greenhouse gases in the atmosphere. However, the major effect of such greenhouse gases is to increase the temperature, and a temperature increase has been observed, while the OLR will be only slightly affected. Thus it is difficult to detect the OLR changes partly because of lacking precision of the measurements, partly because the greater natural variations are overwhelming.

        This is what I wanted to point out. You have not given any discussions of this aspect of measurement errors in the OLR. Therefore I do not find your analysis convincing. Perhaps you will respond with some more convincing analysis, but until then my view remains.

        • Kristian says:

          Pehr Bjornbom,

          You’re only rambling now, Bjornbom. You cannot get yourself to concede that the real-world data clearly shows that the warming is due to an increase in solar heat uptake and specifically not an “enhanced rGHE” (postulated as ‘less heat out (OLR) for any particular T’).

          One more time: When OLR is seen rising over time, in step with tropospheric temps, then that is a telltale sign the rise in tropospheric temps was not caused by an “enhanced rGHE” ‘holding back’ Earth’s heat loss to space (OLR at the ToA). Simply because the OLR wasn’t held back.

          Furthermore, when the ASR is also seen going up during that same period of tropospheric temperature rise, then deducing the real cause of the warming should be a no-brainer, don’t you agree?

          +ASR -> +T -> +OLR

          This is exactly what the data shows.

          There’s not really much more I can tell and show you, Bjornbom. If all you want to do when faced with these facts is to try and ignore and/or explain them away, then that’s your privilege. But also, in so doing, remember that you effectively disqualify yourself from any sound scientific discussion on the subject at hand. Again: ‘cognitive dissonance reduction’ is what I see.

          • Ball4 says:

            When OLR is seen rising over time, in step with tropospheric temps

            Not true in the 2003 to 2014 properly calibrated CERES data, OLR went down slightly as shown in the latest PI CERES paper I linked which Kristian has not yet been able to soundly, scientifically discuss. This is unfortunate as it would be interesting to do so.

          • Kristian says:

            *Eyeroll*

            You’re a troll, Ball4. You have nothing to contribute except bizarre, incoherent and pointless ‘objections’ to whatever you don’t like the sound of.

            People can see the plots of OLR vs. T here for themselves and recognise just how bizarre your ‘arguments’ are, and just what a truly ludicrous character you happen to be. You’ve got nothing, but keep babbling on and on about it all the same …

            Good-bye.

          • Pehr Bjornbom says:

            Kristian,

            I do not think that your political rhetoric style belongs in an honest scientific discussion so I lack interest to continue discussing with you. However, I will give you a final response with a short comment.

            You write that the real-world data clearly shows that the warming is due to an increase in solar heat uptake and specifically absolutely not on increasing greenhouse gases. I am not an expert in interpreting all such data but I note that Dr. Roy Spencer and very many other climate scientists have another view on this issue than you.

            Considering that state of affairs you simply cannot impress me by your primitive political hand-waving.

          • gbaikie says:

            “You write that the real-world data clearly shows that the warming is due to an increase in solar heat uptake and specifically absolutely not on increasing greenhouse gases. I am not an expert in interpreting all such data but I note that Dr. Roy Spencer and very many other climate scientists have another view on this issue than you.”

            What is the warming?
            The most recent warming is from El Nino- which is not particularly related to greenhouse gases.
            The warming from mid 20th century might be due in part to increasing CO2 level.
            The warming from beginning of 20th century doesn’t have many who agree it’s largely due to CO2. Likewise the rise of sea level starting prior to the beginning of 20th century is not thought to be caused by the CO2 emission prior to this.
            Over last thousand years there has periods of warming and cooling and these not considered to be caused by varying CO2 levels.
            8 thousand years ago, earth was quite a bit warming than the present, and cooling over last 8000 years is not related to a lowering of CO2 levels.
            Spencer and others think that doubling of global CO2 might cause some warming.
            I think it might be possible that doubling of CO2 could cause 1 C increase in global temperature, but also think that doubling of CO2 may not cause a measurable increase- 1 C increase, probably would be measurable.
            Currently I don’t think the CO2 increase has been measurable or I can’t say what 100 ppm increase in CO2 did in terms of increase in global temperature. Or it’s possible
            it was .1 C increase- which is not measurable. It might be more than .2 C which could be reaching the threshold of being measurable.
            There is not agreement when exactly the increase of 100 ppm of CO2 will cause warming- or warming from it, has not already effected global temperature but will in the future- in couple decades or within couple centuries. Or since the warming from CO2 has not all kicked in, some who think increasing CO2 levels cause warming, are not bother by idea that it’s been not clearly indicated in temperature records- yet.
            Or that Co2 causes warming has to include how much and when. Or Spencer might say a doubling a Co2 would cause about 1 C increase in global temperature, but not sure he confident of when this would occur or how much of the 1 C increase has already occurred.
            Or if starting point is 270 ppm, than 560 ppm is double that, but most of warming should be at mid point- 405 ppm and we are roughly there already, so has .5 C increase already occur or if stay at around 400 ppm will more warming occur later?
            I don’t think we have already had .5 C increase in global temperature due the current level of CO2- and wildest believers on AGW, may strangely agree with me.
            So if have a timeless quality to CO2 causing warming- I would tend to think it’s possible that a doubling of CO2
            “might” cause a 1 C increase.
            I also don’t think a 1 C increase in global temperature is a bad thing. I would would more concerned if global temperature had remain at temperatures they were during the Little Ice Age. Nor do I think a foot of sea level rise in a century is a problem. And having sea level decreases like we had during the Little Ice Age would more of concern than the modest increase we have had and are likely to continue to have in the future.
            The warning of our world recently is far less of a concern than abuse of science in the name of global warming. Or this corruption in government is the type of thing which kills people.

    • Ball4 says:

      And how do you explain this?

      CERES raw data is not a final calibrated product.

      Kristian, as I tried to explain to you on another thread, the raw CERES EBAF data you use hasn’t received the required final calibrations noted and applied by the CERES team in their publication(s) I linked for you. Once they do that, OLR is shown as decreasing while the UAH v6.0Beta5 product for earth Tmedian appears to be increasing in the same 11year period.

      You need to calibrate the CERES raw data after download for the known issues before drawing any conclusions. Like any precision instrument, CERES has to be calibrated to known sources: mercury & coiled spring thermometers, IR thermometers, gas pumps.

      • Ball4 says: August 13, 2016 at 5:41 PM

        (“And how do you explain this?”)

        “CERES raw data is not a final calibrated product.
        Kristian, as I tried to explain to you on another thread, the raw CERES EBAF data you use hasnt received the required final calibrations noted and applied by the CERES team in their publication(s) I linked for you. Once they do that, OLR is shown as decreasing while the UAH v6.0Beta5 product for earth Tmedian appears to be increasing in the same 11year period.”

        Good God Trick,
        The CERES data mean nothing! Ask those that constructed the instruments. They are fine repeatable measurements of something unknown! Maybe by 2040 someone will finally figure out just what CERES was measuring, which has no relationship to whatever the CERES team thought they were trying to measure! Been there done dat!

      • Kristian says:

        Ball4 says, August 13, 2016 at 5:41 PM:

        (…) the raw CERES EBAF data you use hasnt received the required final calibrations noted and applied by the CERES team in their publication(s) I linked for you. Once they do that, OLR is shown as decreasing while the UAH v6.0Beta5 product for earth Tmedian appears to be increasing in the same 11year period.

        Seriously, what are you on, Ball4?

        I am not showing “raw data”. I’m showing CERES EBAF Ed2.8 ToA. Edition 2.8 is a final data product. Loeb et al. in your linked paper simply seemingly used a newer edition: Ed4. And as I already showed you on that other thread, here’s Ed2.8 (black curve) vs. Ed4 (blue and red curves):
        https://okulaer.files.wordpress.com/2016/08/olr-30-30-paper.png

        Also, updating OLR data doesn’t mean you change the TLT data, Ball4. UAHv6 tlt, 30N-30S, also goes down between 01/2003 and 12/2014, the opposite of what you’re claiming:
        https://okulaer.files.wordpress.com/2016/08/tlt-30-30-uahv6.png

        Here’s the same data, only extended from 03/2000 to 03/2016:
        https://okulaer.files.wordpress.com/2016/08/tlt-30-30-2000-2016-uahv6.png

        And the same datasets, only extended to global:
        https://okulaer.files.wordpress.com/2016/08/uahv6-tlt-90-90.png

        Remember, Ball4, 30N-30S OLR data compares to 30N-30S TLT data, while global OLR data compares to global TLT data.

        • Ball4 says:

          I am not showing raw data.

          Inaccurate claim Kristian. The CERES team itself points out CERES EBAF Ed2.8 ToA Edition 2.8 is raw & uncalibrated not final calibrated data product in the link I supplied Kristian. There are several known calibration steps to perform – they caution any users to perform those steps before analysis which is the whole point of their writing.

          When the adjustment to 30N-30S is made, Kristian also has to adjust the baseline 1981-2010 data to 30N-30S to compute correct anomaly, inspection of the Kristian graph data indicates Kristian did not do so.

  93. Pehr Björnbom says:August 13, 2016 at 9:43 AM https://en.wikipedia.org/wiki/File:ModtranRadiativeForcingDoubleCO2.png
    That graphic is a good example of calculation that ModTran and the HiTran database can provide in a direction of little or no opposing radiance (space) Integrate that over all wavelengths and again over all 2PI (external hemisphere) to get to the totals of exit flux per unit cross sectional area.
    Lets look a bit closer. That big dip for CO2 between 600 and 680 wave-numbers indicates the temperature of the local tropopause. Drop that CO2 to 150ppmv and you will see almost no change in the decrease to 220 K but the wings will close slightly. However the tropopause cross sectional area radiates into almost twice the integrated solid angle as the surface can possibly do. contd:

    • Pehr Bjornbom says:

      Will Janoschka August 13, 2016 at 1:58 PM

      The point is of course that if you drop CO2 completely the dip will disappear giving a large part of increased OLR that must be compensated for with a really large temperature drop. This validates the greenhouse effect caused by CO2. I the spectrogram is also changed to zero water vapor and zero methane the OLR will increase say twice as much with a corresponding larger temperature drop in order for coming back to planetary energy balance.

      You have not studied this diagram very well. The y-axis has the unit W cm/m2 and the x-axis 1/cm. Thus, you should integrate over the wave number (1/cm) in order to get the total irradiance but not integrate over 2*PI steradians, because this is already done. So the total irradiance in W/m2 is the area under the curve, and dropping CO2 would increase the OLR with the area of the ditch between 600 and 800 1/cm plus some smaller areas at other wave numbers connected to CO2.

      • Pehr Bjornbom says: August 13, 2016 at 2:55 PM

        Will Janoschka August 13, 2016 at 1:58 PM

        ” The point is of course that if you drop CO2 completely the dip will disappear giving a large part of increased OLR that must be compensated for with a really large temperature drop. This validates the greenhouse effect caused by CO2. I the spectrogram is also changed to zero water vapor and zero methane the OLR will increase say twice as much with a corresponding larger temperature drop in order for coming back to planetary energy balance.”

        I was trying to point out that at 150ppmv CO2 all vegetation ceases. At 1200ppmv CO2 vegetation thrives. between the too values radiative exitance change is barely measurable, less than 2% of total exitance.

        “You have not studied this diagram very well. The y-axis has the unit W cm/m2 and the x-axis 1/cm. Thus, you should integrate over the wave number (1/cm) in order to get the total irradiance but not integrate over 2*PI steradians, because this is already done. So the total irradiance in W/m2 is the area under the curve, and dropping CO2 would increase the OLR with the area of the ditch between 600 and 800 1/cm plus some smaller areas at other wave numbers connected to CO2.”

        Please go look up the definition of irradiance! Such does not include solid angle at all. It is flux in one direction only directly to zenith. For total exit flux or ‘exitance’ one must integrate over the whole hemisphere, with every direction being different than any other!
        “You have not studied this diagram very well”! I have been creating diagrams like this for over 45 years!

        • Pehr Bjornbom says:

          Well, the diagram we are discussing here shows upward irradiance in W cm/m2 according to he diagram title. So this is a spectral irradiance. This is of course logical since the satellite instruments basically are measuring the irradiance they receive.
          https://en.wikipedia.org/wiki/File:ModtranRadiativeForcingDoubleCO2.png

          If you also integrate the values in unit W cm/m2 over 2*PI steradians, instead of only over wave number, you will get something in the unit W steradians/m2, which is obviously flawed since the result should be in the unit W/m2.

          • Pehr Bjornbom says:
            August 13, 2016 at 4:35 PM

            “Well, the diagram we are discussing here shows upward irradiance in W cm/m2 according to he diagram title. So this is a spectral irradiance. This is of course logical since the satellite instruments basically are measuring the irradiance they receive.”

            Indeed That instrument has a collecting aperture area that from the source is a solid angle! Move that instrument a wee bit from zenith and you will get a different reading. What is the sum of all the W/m^2 in different directions from that source? That sum has units of W/m^2 or total radiative exitance.
            BTW Dr Roy’s site refuses to allow my presenting of any atmospheric water effects!

          • Pehr Bjornbom says:

            Will Janoschka August 13, 2016 at 5:03 PM

            That is simply not correct. I do not think there is any basis left for further discussion of so I leave our discussion here.

          • Pehr Bjornbom says: August 13, 2016 at 5:34 PM

            Will Janoschka August 13, 2016 at 5:03 PM

            “That is simply not correct. I do not think there is any basis left for further discussion of so I leave our discussion here.”

            Hokay fine! If you can please point out even one error in my writings!