Matthew to Arrive 4,000 days after Last Major Hurricane

September 29th, 2016 by Roy W. Spencer, Ph. D.

Updated 7:30 a.m. EDT Saturday, Oct. 1.

Major Hurricane Matthew was briefly a Category 5 hurricane overnight, the first Cat 5 in the Atlantic in nine years. It now has 155 mph sustained winds, making it a strong Category 4 storm on the Saffir-Simpson scale.

Matthew is over the south-central Caribbean, traveling slowly westward, but a turn to the north is expected on Sunday. Matthew is expected to cross eastern Cuba Tuesday morning and possibly make U.S. landfall somewhere on the East Coast around next Friday or Saturday.

Thursday will mark exactly 4,000 days after Major Hurricane Wilma’s landfall.

Hurricane Wilma, the last major hurricane (Cat 3 or stronger) to hit the U.S., struck Florida on October 24, 2005. Will Matthew arrive as the first major hurricane to strike the U.S. in almost 11 years? Only time will tell. (Sandy was Cat 1 at landfall, and technically not a hurricane at that time. Hurricane Ike, 2008, was a Cat 2.)

Here is the latest GFS model forecast for Matthew on midnight Sunday, Oct. 9 (graphics courtesy of Weatherbell.com):

gfs_mslp_uv10m_ma_33

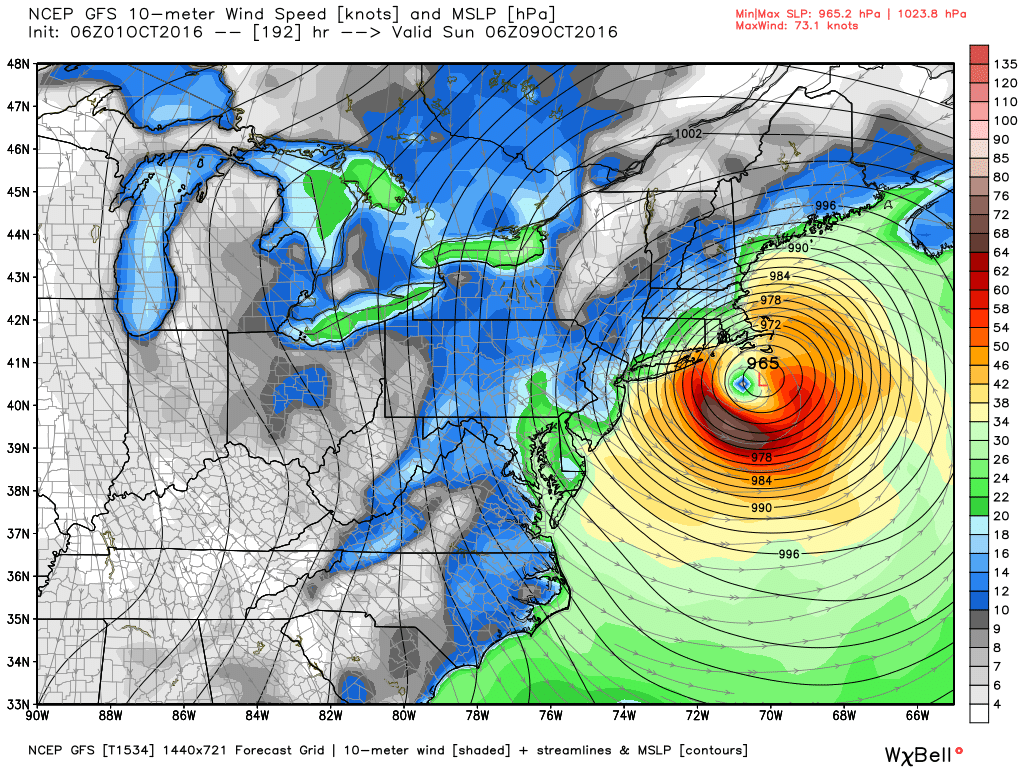
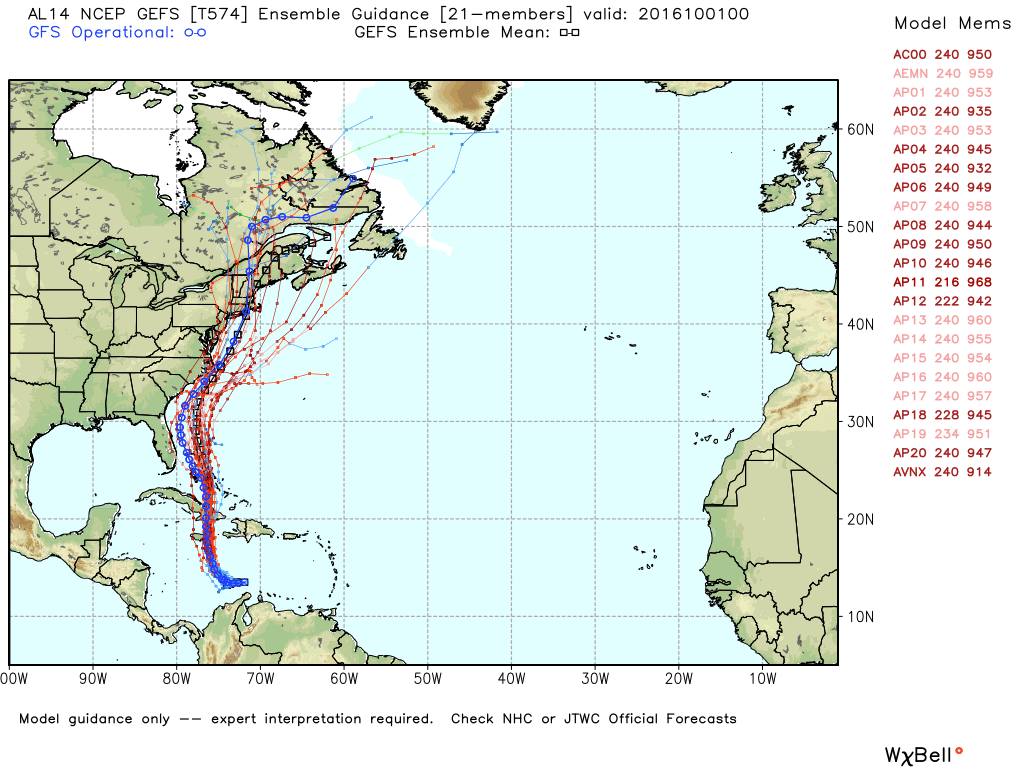
That particular forecast, which remains very uncertain this far in advance, has Matthew making landfall at Cape Hatteras, Cape Cod, and then going inland in Maine. Here is the spread of model forecasts from NOAA’s GEFS ensemble forecast system:

gefs_al14_2016100100


242 Responses to “Matthew to Arrive 4,000 days after Last Major Hurricane”

Toggle Trackbacks

  1. RW says:

    Bummer if it hits.

    • Steven Fraser says:

      The Weatherbell image does not show the track direction, but the annotations predict max wind @ 77 knots, which is in the middle of Category 1 designation. The other chart tracks look mostly like glancing blows, with several of them making landfall. Yes, time will tell.

      • John Noll says:

        When you say last storm 4000 days after last Majow Hurrucane. What about Hurricane Sandy that hit New Jersey and New York.

      • Michael Cohen says:

        I got news for you. Hurricanes are being controlled and not allowed to hit the US…. See “Controlling Hurricanes” on google and Scientific American article…. There are three different methods. Sandy was not a hurricane but a tropical storm…

    • tom s says:

      Oh it won’t matter Roy. It will all be blamed on the molecule CO2. That piddly TS that moved across the Southeast US earliery this season got lots of AGW mention. Maddening.

  2. JDAM says:

    At 0001 October 1 2016 the Obama administration is turning over control of Internet Corporation for Assigned Names and Numbers (ICANN) to an unspecified entity.

    Will this website still exist?

    • Good question. If George Soros calls and offers me a couple million dollars to stop creating trouble, maybe I’ll consider retiring. Yuk yuk.

    • TXGunner1 says:

      It is certainly a non transparent transaction. Most likely, someone who does not live by our constitution will possibly be controlling current content and future content for sure. Who will that person or persons be? No one seems to know. Or at least where I have searched it is not mentioned. All we have is the hope that it is the correct decision. I am dubious to say the least.

  3. Nabil Swedan says:

    Dr. Spencer, What is the elevation of the isobaric curves shown around the hurricane eye?

  4. Vivian Matlack says:

    What about Hurricane Ike in 2008?

  5. DMK says:

    What about Sandy?

    • mpainter says:

      No hurricane at landfall.

      • Pete says:

        We in NJ would say otherwise. We’re STILL recovering from Sandy.

        • tsoho says:

          If that’s really the case it says more about the ineffectiveness of the government’s response than it says about the strength of the storm.

        • mpainter says:

          Pete, what’s going to happen if you get a genuine hurricane? Say, a real killer storm, a cat 3 with winds of 145 mph and a 20 foot storm surge? Will you howl about global warming?

        • Mike M. says:

          The damage done by a hurricane tends to be due much more to storm surge than wind speed. Both Sandy and Ike had storm surges like those that would be expected from major hurricanes. Sandy because it was so big, an Ike because it had just dropped down from being a major hurricane.

          • mpainter says:

            Sandy storm surge was not major hurricane. It was coincident with a spring tide, which added 4-5 feet to a normal storm surge of 6-9 feet. The funnel effect of the creeks and inlets magnified this combination.

            There is a distinction between storm surge and tidal levels. People generally don’t understand this distinction.

            A cat 3 storm surge on top of a spring tide could bring floods of 25 feet above mean sea level. Those who build at the head of creeks and inlets are courting disaster.

          • FTOP says:

            As a Floridian, the math is simple, landfall + high tide is the recipe for disaster…

          • Ric Werme says:

            FTOP, yeah, that’s why no one builds in Miami Beach any more. 🙂

      • Michael Cohen says:

        The Iranian government claimed that it directed tropical storm Sandy into NY and NJ. See “Controlling Hurricanes” on google and article in Scientific American. All you need is a small plane to spray chemicals into the eye of the storm.

  6. Trey Long says:

    Remember when that pompous parasite Gore predicted a huge surge in destructive hurricanes due to Global warming? Every liberal was petrified with fear. What a bunch of imbeciles.

  7. fonzarelli says:

    Dr. S., if you had a dollar for every dunderhead who says “whut about sandy, huh?” with these hurricane posts, you wouldn’t need soros to retire!

    • Yes, I Agree. But what about Sandy? (joking)

      • Jim Edmondson says:

        Sandy was technically not a hurricane at all when it made landfall. It did cause a storm surge of 13 feet, kill over 150 people and cause over $60 billion dollars in damage. But it was not a “Major Hurricane”. Katrina on the other hand was (just barely) a “Major Hurricane” when it made landfall (Cat 3). It caused a 14 foot storm surge, killed closer to 1500 people and caused over $100 billion dollars in damage. Andrew was a true “Major Hurricane” making landfall as a Cat 5, pushing 15 feet of storm surge, killing over 60 people and causing $26 billion in damage.

        I don’t see how people can be confused by this. Isn’t it obvious that Sandy was not a “Major Hurricane” like Katrina and Andrew!!

        • mpainter says:

          People get confused when people like you spread misinformation. Sandy storm surge varied, but nowhere was over ten feet above high tide. The funnel effect caused the worst surge. A cat 5 hurricane striking the middle of Padre Island would cause no damages,for lack of development. Extra tropical storm Sandy hit a populous coast on a spring tide. See if you can figure out the rest for yourself.

          • RAH says:

            The funnel effect and the fact that the worst side of the storm hit at near the peak of a higher than normal tide.

          • mpainter says:

            See “spring tide”

          • fonzarelli says:

            Yeah, painter, katrina would have been a mere footnote in history were it not for the grossly flawed design of those outflow canals. (the pumps being placed at the wrong end of the canals thus needlessly creating the funnel effect)…

          • mpainter says:

            Or, a flow control structure (gate) at the Ponchartrain end of the canal. Uncharacteristic goof by the Army Corps of Engineers. Or,maybe they have their own tale to tell.

          • fonzarelli says:

            As far as i’ve been able to tell, they knew they had screwed up long before katrina hit. Must have had there planning meetings in a bar on bourbon street (which is where half my mail ends up… ☺)

          • mpainter says:

            Fonz,
            Want a fascinating slice of history from NO past? Read up on Story Town. There’s a good book on this, if you can dig it out of some library somewhere. House of the Rising Sun and all that.

  8. Freeland_Dave says:

    I do believe that many of the commenters here are overthinking the article.

    No large Hurricanes hitting the US for the past 4,000 days is an abstract reference to what “all the scientists are in agreement” that global warming was going to cause a dramatic increase of catagory 4 and 5 storms from impacting the US in a very short period of time.

    For the mathematically challenged that’s just shy of 11 years.

    Now perhaps others can see why I don’t really place a whole lot of faith into what “all the scientists that are in agreement” are telling me.

    Seems to me they are more interested in making a name for themselves so that they can get those large grants to “study” things they really can’t change anyway. Enter Dr. Sheldon Cooper.

    • Jim Raymond says:

      Sheldon Cooper! Chuckle, chuckle!

      • KR Binder says:

        Weather professionals of all stripes have trouble predicting the weather we will experience the following week, sometimes even next day! So the 4,000 day lull is especially hilarious to me (and good for coastal dwellers, natch)! Al Gore, where are you now?

        I am sure those of you dedicated to studying what the climate alarmists have done includes selective reporting from only their favorite weather stations in North America because they have “gamed” the system by putting weather stations along runways, on rooftops in concrete jungles, behind air conditioner exhausts and the like? Find the second-best weather website (behind this one) and you will find the research. https://wattsupwiththat.com/2007/06/06/my-summer-project-a-national-weather-station-audit/

        Now that we have deep-diving drones to check subsurface ocean temps and satellite imaging measuring ice pack growth and shrinkage and other such data sources that are hard to “fix” maybe some people with brains will realize climate alarmists are just another part of the green-nut clan? Hey, and it looks like the Sun is about to do a Maunder Minimum period so here comes global cooling!

    • Michael Cohen says:

      The US has been trying to control hurricanes since 1947 and the results can be found in an article entitled CONTROLLING HURRICANES in Scientific American in 2004. See google. There are three different methods described in the article. The only reason that any hurricanes have hit the US is because of foreign countries such as Iran which claimed credit for Sandy.

    • MarkB says:

      No large Hurricanes hitting the US for the past 4,000 days is an abstract reference to what all the scientists are in agreement that global warming was going to cause a dramatic increase of catagory 4 and 5 storms from impacting the US in a very short period of time.

      Could you provide a pointer to anything in the scientific literature that projected such an impact specific to the US?

      I thought the scientific consensus, such as it is, was that the strongest storms would generally get stronger due more energy in the system, frequency increase/decrease was uncertain due to projected increases in other factors (wind shear), and that the trend probably wouldn’t become statistically significant for many decades (something like 2070 IIRC).

  9. Richard says:

    This story is crap. Hurricane Ike was a major storm when it hit Galveston in September 2008. It completely wiped the Bolivar Penisula just East of Galveston off the map. There was nothing left standing and destroyed Galveston. I don’t know where this information is coming from but NOAA says the maximum winds from Ike were 100 mph. Every person that lived through it know that the winds were at least 145-150 mph and if it was not a low five it was a major 4.

    • dave says:

      “I don’t know where this information is coming from…”

      The Archives of the National Hurricane Center, which is part of the National Oceanic and Atmospheric Administration, which is an agency within the U.S. Department of Commerce, has:

      “Ike made landfall over the north end of Galveston island in the early morning hours of September 13 as a Category 2 [sic] hurricane with sustained wind speeds of 110 mph.

      http://www.nhc.noaa.gov/outreach/history/#ike

      Dr Spencer SPECIFICALLY SAYS he is talking about Category 3 or higher.

      These Archives have Ike as the last hurricane notable enough to appear in “Hurricanes in History.” It wasn’t 4,000 days ago, of course, – only about 3,000.

      • Clinton Edwards says:

        I still can’t figure out how Hurricane Ike made landfall over the NORTH END of Galveston Island. The North End of Galveston Island faces the ship channel. I sat through Ike and yes it was a cat 2 at landfall (just barely) and about the biggest Cat 2 on record. The eye of the storm took about an hour to go over my house.

        This page has a nice radar animation of Ike’s landfall: http://www.friendsofanahuacnwr.com/HurricaneRecovery -Roy

      • RAH says:

        Why the heck do so many people have such a hard time understanding that a Major Hurricane is one classified as a CAT III or higher and keep equating “Major” to the damage a storm does and not the measured wind speed? It’s a simple concept.

  10. Myles says:

    We’re off to see the wizard, the wonderful wizard of warming. If even half of the alarmist alerts had come true in the last 30 years, the planet should be in the hands of the cockroaches — assuming they had adapted and learned how to swim. Funny thing, nature. It continual shows us how much smarter it is than we are, but the power/control freaks refuse to let it deter them from their appointed rounds.

    • Trutherator says:

      The Population Bomb authors said in 1984 everybody would be starving to death from overpopulation. They wrote a book later that said they took it back, they’re sorry, because the “wrong people” stopped having babies and the wrong people kept on having them.

      One of the last issues of Omni Magazine featured a professor in California who advocated forced sterilization in “poor countries”. He had five children of his own (biological).

      • dave says:

        “He had five children of his own (biological).”

        Of course he did.

        About the same date, there was a much hyped book in the U.S.A. by an economist of the socialist persuasion who said that the maximum disposaable income of any individual should be capped at ten times the median disposable income. He had stated somewhere else his own disposable income and it was – of course – ten times the median.

      • Michael Cohen says:

        Millions of people are starving to death today, especially in Africa. That is why they are trying to get to Europe. Venezuela is another case where thousands are now starving to death.

        • wert says:

          No, the people who starve are going nowhere. The people who get somewhere are young men trying to get simply a better living. But is is freaking off topic!

      • David Appell says:

        He had five children of his own (biological).

        Evidence?

        Wikipedia says Ehrlich and his wife were married when he was 22 and was 21, and only have one child:

        https://en.wikipedia.org/wiki/Paul_R._Ehrlich#Personal_life

  11. Brian Osburn says:

    Hurricane Season 2016 – GOES East Satellite Animation: May -September

    https://youtu.be/ab77NGf2CXs

    This is an animation using imagery derived from the GOES East satellite. The area in this imagery is called the Hurricane Sector. The animation contains EXACTLY 6,187 individual images.

    Features include: Exact moments when all named storms, hurricanes, and major hurricanes formed.

    Precise data on peak intensity of all storms.

    Thumbnail imagery of all storms at their peak intensity at each stage of their formation.

    Tracks of each storm.

    SPECIAL daily count up from 10/24/2005 – the date Hurricane Wilma made landfall in Florida (the last time a major hurricane hit the USA.) As of 08/31/2016…3963 days have passed. Day 4000 will fall on 10/06/2016.

    Storms in this video: Alex, Bonnie, Colin, Danielle, Earl, Fiona, Gaston, Hermine, Ian, Julia, Karl, Lisa, & Matthew

  12. Fred says:

    I don’t know where you are getting your information from, but the storm surge from Katrina was 25-30 ft.

    • fonzarelli says:

      Not here in new orleans… If the storm surge was that high then the outflow canals would have been overtopped, but they weren’t. Instead they were breeched at about 14 feet.

  13. ren says:

    Status Category 2 Hurricane
    Position 14.1 N, -69.3 W
    Winds 100 mph
    Gusts 120 mph
    Movement W 14 mph
    Pressure 29.91 in / 1012 mb
    http://www.ssd.noaa.gov/goes/east/watl/wv-animated.gif

  14. Joe says:

    Luisiana is due for another bath after all since everyone from the poor suburbs of luisiana came to Houston violent crimes and homocides have gone up.

  15. ren says:

    Last Seven Days Satellite OHC Products Images:
    http://pics.tinypic.pl/i/00824/e67ar5xhuvx0.gif

  16. Frank says:

    How did everyone miss hurricane sandy! How quickly we forget it hit manhatten and caused millions of dollars of money. It’s a good thing I a pay close attention to these storms or we wouldn’t be reminded.

    • Arnold says:

      Frank it was not technically a hurricane…If memory serves me correctly it was called some sort of a typhoon… hurricanes occur in the pacific and typhoons in the Atlantic. Has to do with the size of the eye of the storm. Also I have to research this more but the catorgory size depends on not just the wind but time of day for example Katrina was a cat 3. Because it was roughly at 3am and damage was in a remote area of Florida. Glad to be of help.

      • SlartiBartfast says:

        Arnold you have it backwards… Hurricanes are in the Atlantic and Typhoons are in the Pacific. This is why when this type of storm hits Japan it is always called a Typhoon.

        Although it was Category 3 when it hit Cuba Sandy was not considered a Hurricane at landfall in the USA. It was described as a “superstorm” instead and was actually two storms which had merged over the Atlantic. What made it uniquely devastating was its massive diameter, not the wind speed at landfall. This huge size pushed much more water than normal ahead of the storm, producing the highly destructive storm surge height.

  17. Viperdog27 says:

    Leave a Reply…Why bother. When you are dealing with Progressives that cannot be shaken from their consensus of science that says Climate Change(Euphemism for Global Warming) exists, you’d be better off talking to a brick wall. At least the wall wouldn’t respond with some stupidity based in fantasy. I’m old enough to remember that 30 years ago, we were told that the shorelines would have disappeared and both the east and west coasts would be under water, due to Global Warming. Back then the Progressive alarmists were going bonkers because no-one believed them. Thirty years on and they are still wrong, but that’s just it. When you are dealing with Progressives, when are they ever right about anything and why are there so many gullible dolts that believe them. As to the consensus of scientists who believe, science isn’t consensus. It either is or it is not. In the case of Climate Change that they believe in. It is not!

    • Kerry says:

      As a Floridian and a Global Warming denier,(proudly) should I be wrong I say, YEAH Global warming. If whatever they will be calling it next week is keeping Florida safe, I say good for us.
      Now as to what was happening 30 years ago, (I’m old too) it wasn’t much before that time that we were being warned about Global Cooling and the eggheads were putting (coal dust???) something black on the ice to prevent that.
      As for the rest of my lifespan, I think we are good, it is those flatulent cows I am worried about.

      • fonzarelli says:

        My dim recollection is that it was the former soviet union that was putting ashes on ice. So it was the “commie eggheads” that did it, not the “capitalist eggheads” (who weren’t that corrupt yet… ☺)

        • Kerry says:

          Good one Fonz, but I also am paying attention to the projected sea level rise, as I like the ones in the 22 to 23 ft range as my home is at 26ft. According to ALGORE, I should already have ocean front property. But I can still hope.

    • KR Binder says:

      Thus the popularity of shows like “Ancient Aliens” for crying out loud! Also, the same people celebrate the possibility of water on Mars or a moon of Jupiter or, heck, a stupid comet even! If there is water, then there has to be life, right? Right? Sigh.

      Low information people dominate the populace. I hope most of them stay home for the coming US elections!

      • RAH says:

        I put “Ancient Aliens” on for laughs sometimes. I chuckle about every time the narrator uses the phrase “Is it possible that……?”

      • Ernest Bush says:

        uhmmmmm….there is water on Mars. In fact, it has been seen to cause flows of chemicals on the surface, all captured in photographs. Also, NASA has just shown probable water jets coming off the surface of Europa, one of the moons of Jupiter, fueling scientific speculation of the possibility of a large ocean of water underneath the surface. Ice has been found in deep moon craters by military satellites. Pluto has abundant ice, literally mountains of it, which scientists were not expecting and have not much of an explanation as to why it is there. Some think there is a subsurface ocean on Pluto. In fact, it looks like there is water and ice just about anywhere you look in the Solar System. It looks like science fiction stories about aliens coming to steal our water because of its scarcity will remain a thing of the past.

        There may well be life on other planets or moons in our solar system, since the chemistry needed for life also seems to be showing up on various moons all over the place.

        • RAH says:

          Though I am pretty skeptical about the claim that Comets brought all this water to earth I am more open to the idea that they do carry the stuff of life. They have even found amino acids in comet stuff. And yes, there is strong evidence that there is both frozen and at times liquid water on Mars and the geological evidence indicates there was at one time quite a bit of liquid water on that planet.

  18. dave says:

    “…30 years ago…”

    Takes one back to the 1995 film “Waterworld,” in which the polar ice-caps melt – and the sea level rises 25,000 [sic] feet as a consequence. I actually found the film quite entertaining, but I had to imagine it as taking place on some other planet, to make a degree of belief possible.

  19. dave says:

    I know 1995 was only 21 years ago but it was based on a 1986 script!

  20. Mark says:

    Global bogus

  21. Robert Leon says:

    Twenty years ago, climate scientists predicted that we would have more storms of greater power. We had less storms of far lesser power. Science requires that at theory either be confirmed by experimentation or by nearly perfect prediction of future events. So far, AGW has failed to do either.

  22. Sal says:

    By now I expected the USA to have been ravaged by hurricanes.
    What happened to Al Gore’s predictions over a decade ago?
    Hmmmm. And the Polar bear population is actually growing.
    Hmmmm. I guess Al and all the other people who became rich off the Global Warming scam won’t sell their beachfront houses which should be vulnerable to the ocean rising bought with the apocalypse scenario they pushed.

  23. Leonid Drayeniv says:

    …much to the chagrin of Al Gore and his AGW Quislings.

  24. Ron Hyatt says:

    So if Major Hurricanes are 11 years apart, then “Globull Warming” is a _good_ thing, I’ll take some more, please.

  25. Born in the uSa. says:

    all the scientists that are in agreement ?
    I prefer “”all the “scientists” on the government dole””. Welfare for all the high-faluttin, otherwise unemployable college boys who couldn’t figure out how to change a light bulb or flat tire to save their own keester.

  26. Burroughston Broch says:

    Due to your inattention and lack of preparation.

  27. RAH says:

    Why is it I’m doubting the sharp initial turn north that the models show and Joe Bastardi seems to pretty much agree Matthew will take? Is it because I’m not used to seeing such a radical track projection? Or is it that I really don’t see what would cause the storm to take a hard right at Albuquerque and track up over the Bahamas? Perhaps someone here with more knowledge could enlighten me?

    • nigel says:

      The site “Tropical Tidbits” has interesting explanations of how the storms are “steered.”

      • RAH says:

        Thanks for the link nigel. Great video explanation of why they believe Matthew will turn north. Obviously though there is some disagreement between the European and US models as to how quickly the storm will progress. I hope the US model is correct this time though the European generally has the better forecast record.

    • Ric Werme says:

      A few years ago (okay, probably several years ago), a hurricane was heading right for the mid-Florida coast. However, it was forecast to make a hard right turn, much as Matthew, but without stalling. The trough or front made it pretty obvious it had to turn, but there was a lot of relief when it finally did make the turn.

      Probably the biggest game of Chicken ever.

  28. NormB says:

    Every year, since hurricane Katrina devastated New Orleans (and the democratic leadership of the city under Mayor Ray Nagin failed to evacuate) our government’s National Hurricane Center, under the guidance of the best of the best of the best (sir!) meteorologists, computer programmers, using satellite data and “models” have repetitively predicted ten to twelve major named storms each year (or thereabouts).

    The very same government “scientists” want us to believe their computer models predicting a “global warming” crisis in 50, 100 years.

    But they haven’t gotten a single short-term hurricane prediction correct in 4,000 days.

    Hubris.

    • fonzarelli says:

      “(and the democratic leadership of the city under Mayor Ray Nagin failed to evacuate)”

      Oh, they evacuated all right. (they just left everybody else behind… ☺)

      • RAH says:

        Yep! Nagin told the citizens of his “Chocolate City” to go to the Superdome and then beat feet out of town as did a considerable number of police and other first responders. Said that there was no reason or means to evacuate while hundreds of school busses sat idle.

  29. Arnold says:

    Correct me if I’m wrong but Why do they keep calling it a hurricane when it’s in the Atlantic! Typhoons are in the gulf and super storms along the alantic coast and tropical storms are if they touchdown in a populated region. I’m not a meteorology major but I minored in basic weather sciences. With an B+ granted it was based on a curve. Hopellly this could help clear things up a bit:)

  30. Rick the Denier says:

    If a major hurricane hits the US and wipes out some of the gimmedats and I dindonuffins habitats. Maybe BLM will come in and help out instead of killing innocent police officers and chasing down people wearing Trump hats.

    We need a cleansing in that area of the country anyway.

  31. Joe says:

    4000 days? What would you call superstorm Sandy that hit the East coast?

  32. Kitcha says:

    Cracks me up… obama had been howling about there not being any hurricanes and a big one is coming. Well you know what pinnocchio, if you say it long enough, it will happen eventually.

  33. Steven Fraser says:

    Nice animation of a forecasted storm track and wind speeds for Matthew, from NOAA.

    http://polar.ncep.noaa.gov/waves/viewer.shtml?-multi_1-latest-NW_atlantic-u10-

    We’ll see how it pans out.

  34. Greg says:

    It’s explains it if you read the article

    • jimc says:

      I assume that heat is then rapidly radiated to space, resulting in a net cooling effect. Is the energy they carry away (or don’t in an inactive year) enough to effect global temperatures?

      • ren says:

        Certainly lower the temperature of the surface of the Caribbean Sea.

      • RAH says:

        If you look at the NHC site you will see there is another disturbance tracking behind Matthew and they show a low probability of development. This is because Matthew has sucked up the energy in the ocean and atmosphere in it’s path.

  35. ren says:

    Cuba and Florida should prepare.

  36. barry says:

    I was wondering what was driving this post, so I read down and…

    I do believe that many of the commenters here are overthinking the article.

    No large Hurricanes hitting the US for the past 4,000 days is an abstract reference to what all the scientists are in agreement that global warming was going to cause a dramatic increase of catagory 4 and 5 storms from impacting the US in a very short period of time.

    For the mathematically challenged thats just shy of 11 years.

    So if I have this straight, Dr Spencer is counting the days between hurricane landfall in the US and omitting other types of powerful storms because there is a scientific consensus that cat 4/5 storms will make landfall in the US more often, and this this should have been evident by now.

    Is there any reference for a claim this specific? I don’t recall such. I’m hoping to be shown something predictive that is clear on the timeline and location (ie, continental US).

    Otherwise all I’m aware of is a prediction that storms will, over the long term, increase in intensity, but not necessarily number, and no specifics as to where they will fall.

    Link? Cite? Reference?

    • Barry, you don’t remember 2005? The U.S. was clobbered with hurricanes, and the popular opinion was that this was going to be the new normal. Hurricane experts were interviewed, papers published. Even the weak hurricane that hit the FL panhandle this year was described by Obama as evidence of climate change. Whether any of this was ever justified is certainly questionable. But there’s no question that if we started getting more land falling major hurricanes, humans would be blamed. So, it’s significant that we have gone so long without a major hurricane strike.

      • RAH says:

        Roy

        I have yet to see evidence that Hermine was actually a hurricane when it made landfall other than NOAA NHC saying it was. I happened to be home at the time it approached and then made landfall. I was monitoring both buoys and land stations online and never saw 1 minute sustained winds approaching 74 mph measured or recorded by any of those sources. I presume the anemometers at these sources are at 10 meters or less above the surface.

    • An Inquirer says:

      Barry,
      I suppose you are not kidding. While you often seem to have valid points and citations, this type of post sinks your overall credibility.
      For decades, global warming activists have been claiming tremendous damage is coming from extra and more powerful hurricanes due to increased CO2 levels. Insurance companies used these warnings to increase insurance rates. Time and time again, with virtually every hurricane hitting land, there are articles that it is this bad because of CO2. If you need a cite, then you are not well-versed in global warming literature. Here is one example: http://time.com/4013637/climate-change-hurricanes-impact/

      Following the failure of increased hurricane activity to be observed, there have been a couple of papers that suggest hurricane activity will be less intense because the temperature differential between polar and tropical areas will be less. Nevertheless, the conventional wisdom among global warming activists is that increased CO2 means increased destruction from hurricanes.

      • David Appell says:

        Upward trends in North Atlantic storms and major hurricanes:

        http://policlimate.com/tropical/north_atlantic_hurricane.png

        Upward trend in North Atlantic ACE:

        http://policlimate.com/tropical/north_atlantic_ace.png

      • barry says:

        An Enquirer,

        I’ve asked below if Dr Spencer’s interest is because of scientific reports or because of media sensationalism. I tend to ignore news media on science issues, precisely because it is often ill-informed/sensationalist. That goes for any branch of science.

        If the interest here is in countering breathless media reporting then the issue is a bit too humdrum for me. In other news the pope is Catholic.

        My first few posts on this thread cited IPCC on Atlantic cyclones – the general view of the science community that investigate hurricanes. I may have been mistaken in assuming that the science was the focus of Dr Spencer’s article. Reconfiguring, that makes sense of his particular choice of metrics.

        • No question my article is as much about popular perception as it is science. But when it comes to global warming, as they say, perception is reality. Just look at how many people (including yourself) ask the question, “But what about Sandy”? Just because a strong storm (Cat 1) happened to hit a heavily populated area, their perception of climate change becomes exaggerated…even though there are studies of coastal features that reveal mega-storms of the past. People think tornadoes have gotten worse…they haven’t (but our ability to monitor them has). People think hurricanes have gotten worse (arguably, they haven’t…but our ability to monitor them since the early 1970s has, with satellites…which have improved over time). Even the National Hurricane Center personnel were fooled into over-forecasting intensification of systems in 2006 based upon their experience in 2005. (BTW, I’ve published on the estimation of hurricane intensity from satellites, and have given talks at NHC and the Joint Typhoon Warning Center). So, to counter popular misconception, I sometimes post an article like this. I think you are maybe reading too much into it.

          For example, here’s a quote from one of the paleo hurricane studies: “Data from Western Lake and adjacent lakes suggest that catastrophic hurricanes struck the Florida Panhandle much more frequently during the first millennium AD than the last 1000 years.” (Holocene History of Catastrophic Hurricane Landfalls along the Gulf of Mexico Coast Reconstructed from Coastal Lake and Marsh Sediments, Liu and Fearn, 2000)

        • barry says:

          I asked about Sandy because I saw it dismissed from consideration by you and others and then RAH produced an article for me which included Sandy when I questioned why you were using the metrics you are.

          I’ve become used to you doing science-only articles recently. I guess I didn’t tack with you when you moved on to popular perceptions.

          Looking forward to the Sept anomaly.

          • What do you mean Sandy was dismissed from consideration, Barry? It wasn’t a landfalling major hurricane, period. I said that in the original post. Others have pointed it out. I don’t make the definitions. It’s well known, recognized, accepted, end of story.

          • barry says:

            RAH tried to explain your interest with an article that included Hurricane Sandy. I pointed out to RAH that Sandy doesn’t fit with your metrics. Then you asked why I was mentioning Sandy.

            I’ve been trying to figure out WHY you set the bar at Cat 3 or greater US-landfalling hurricanes.

            I dont make the definitions.

            Obviously not, but your selection of Cat3+ hurricanes making US landfall is your own choice based on ‘public perceptions’, right?

            This is where the confusion was for me. I thought your specific metrics had a science-based provenance – based on some prediction one could cite. My mistake.

          • Barry, your obsession with this seems peculiar. I didn’t start the fire. You can find any number of news outlets that have been talking about a “drought” of Cat3+ hurricane hitting the U.S. for over a year: How about the Weather Channel a year ago?: https://weather.com/storms/hurricane/news/major-hurricane-us-landfall-drought-study

  37. barry says:

    First thing I found in IPCC AR5 – the chapter on near-term projections – was this:

    There is low confidence in basin-scale projections of changes in the intensity and frequency of tropical cyclones (TCs) in all basins to the mid-21st century. This low confidence reflects the small number of studies exploring near-term TC activity, the differences across published projections of TC activity, and the large role for natural variability and non-GHG forcing of TC activity up to the mid-21st century. There is low confidence in near-term projections for increased TC intensity in the North Atlantic, which is in part due to projected reductions in North Atlantic aerosols loading.

  38. barry says:

    In the AR4 chapter on regional projections, there is this for N America and cyclones.

    Tropical cyclones are not resolved by the MMD models and inferred changes in the frequency, intensity and tracks of disturbances making landfall in southeast regions remain uncertain.

    But I see above that we’re not supposed to be counting cyclones, only hurricanes.

    So could someone cite a reference that deal only with projections of hurricanes making landfall in N America?

    Or the article is meant to be more sarcastic than serious?

    • “Tropical cyclones” is the generic term for the regional names: hurricanes, typhoons, and cyclones.

    • barry says:

      Ike and Sandy apparently don’t make the list. Sandy because “it was not a hurricane” at landfall.

      So I don’t know what’s in and what’s out.

      Hurricane Irene 2911 was cat 3 in the Bahamas but cat 1 when it hit the US. Irene was the 7th costliest tropical storm in the US, reports said. In or out of the list?

      • It’s a very simple list. Cat 3+ hurricanes making landfall in the US. Even if Sandy was still categorized as a hurricane at landfall, it was Cat 1, 80 mph.

      • RAH says:

        Cost has nothing to do with it. That is a function of where the storm comes ashore and other factors.

        Here is the only reference that is being used in science/meteorology to determine if a hurricane was a Major storm or not:

        “The Saffir-Simpson Hurricane Wind Scale is a 1 to 5 rating based on a hurricane’s sustained wind speed. This scale estimates potential property damage. Hurricanes reaching Category 3 and higher are considered major hurricanes because of their potential for significant loss of life and damage.”

        http://www.nhc.noaa.gov/aboutsshws.php

        Using this scale the last Major Hurricane to strike the Continental US was Wilma that came ashore October 24, 2005 just south of Marco Island in Florida.

    • barry says:

      Your last reference includes Hurricane Sandy as being part of the metric, and yet it is rejected by commenters above, and obviously by Dr Spencer, as it made landfall in the US 1500 days ago.

      So, what, precisely, is the metric if Sandy doesn’t make the cut?

      Or does it? Are we going to bin your last link at this point?

      • Barry either 1) didn’t read the original post, 2) didnt read the comments where I and others answered his question, 3) is pulling our leg, 4) is on drugs he shouldnt be on, or 5) isn’t on drugs he should be on.

      • barry says:

        RAH is citing these articles as your reason/justification for the metrics you are using. But the articles include Sandy and Irene. Would you agree he errs citing these as the reason for your choice of metrics?

        RAH may be on drugs. I’m clean, your honour, but I can probably source something.

        • Sunsettommy says:

          Barry,

          you are looking bad here since Dr. Spenser is talking about Category THREE upward Hurricanes that have NOT made landfall since 2005.

          While you blabber about Sandy,that was NOT a Hurricane anymore when it made landfall. It was barely a Category 3 way off shore,days from America.

          Sandy was Strong Tropical Storm when it made landfall,in 2012.

          Wilma was Category 3,when it made landfall,in 2005.

          You understand?

  39. ren says:

    Now a Cat 5, 160 mph.

  40. RAH says:

    Not according to the NHC this morning ren. Still at Cat IV now with Kingston, Jamaica in the cross hairs according to the latest model runs. Staring to slow in it’s SW track which it was forecast to do before it starts the turn North.

    Levi at Tropical Tidbits now says there is no way it can continue west much longer and it must make a turn to the NW.

    It seems the real question for the US is how fast this storm moves Northward. The slower it tracks north the more likely it will come ashore somewhere along the Eastern seaboard of the US.

  41. ren says:

    The pressure in the center of the hurricane is still falling.

  42. Ross says:

    Bizarre or another alternative universe brought to you the flock or flocking of the climate deniers. Meanwhile the rest of the entire globe think in another alternative universe – the reality that Climate Change is increasing destruction to their countries.

    Cherry pickers all of you.

    Pick a low “fruit” something to do with counts of destructive hurricanes and deny deny deny deny. You guys seriously should join a special Church and wear a certain type of uniform. My don’t birds of a feather flock together. Together united for the “cause”.

    Shakes “me” head – bizarre completely bizarre.

    There are countless other lines of evidence hitting you over the head in YOUR own country that prove beyond a shadow of doubt climate change is deeply affecting your own economy NOW!

    • RAH says:

      Ross says: ………”There are countless other lines of evidence hitting you over the head in YOUR own country that prove beyond a shadow of doubt climate change is deeply affecting your own economy NOW!”

      How?

      The biggest effects I see are billions upon billions of dollars wasted on supposed mitigation attempts like alternative energy sources that are subsidized and others that take our tax dollars and then declare bankruptcy.
      Then there are the plethora of BS studies and papers funding with our tax dollars. And of course destroying the coal mining industry and shutting down fossil fuel electrical generation plants and such. Talk about economic impacts!

    • fonzarelli says:

      We don’t deny that climate has changed… only that humans are the cause of it. (cuz they ain’t)…

  43. RAH says:

    Doc, I’ve been thinking (always a dangerous thing).

    Based on the fact that every time hurricanes are discussed here we get posts from the misinformed claiming Sandy or some other past storm was a “Major Hurricane” perhaps every Hurricane or TS post should have a link to the NOAA description of the Saffir-Simpson scale included.

    http://www.publicaffairs.noaa.gov/saffir.html

  44. RAH says:

    Joe Bastardi is out with a new Saturday summary. He agrees with the European model which has Matthews track further east of the US model. I hope he is right. The further east this thing tracks the better off we are though the folks in the Bahamas would take a big hit if it follows what he and the European and showing now.

    http://www.weatherbell.com/

  45. David Appell says:

    “The Arbitrary Definition of the Current Atlantic Major Hurricane Landfall Drought,” Robert E. Hart et al, BAMS (May 2016)
    http://journals.ametsoc.org/doi/pdf/10.1175/BAMS-D-15-00185.1

    “Our work…makes evident that the existence or historical significance of the current period of inactivity varies substantially depending on the choice of metric used. Thus, the definition of drought is largely arbitrary, although the
    potential impacts of that drought (or lack thereof) are obviously not arbitrary or trivial.”

  46. RAH says:

    Of course David ignores the fact that sceptics did not “choose the metric” of hurricane strikes on the Continental US, Alarmists did!

    1. “Tenfold increase in hurricane frequency this century, research predicts”
    “By examining the frequency of extreme storm surges in the past, previous research has shown that there was an increasing tendency for storm hurricane surges when the climate was warmer. But how much worse will it get as temperatures rise in the future? How many extreme storm surges like that from Hurricane Katrina, which hit the U.S. coast in 2005, will there be as a result of global warming? New research from the Niels Bohr Institute show that there will be a tenfold increase in frequency if the climate becomes two degrees Celcius warmer.

    Read more at: http://phys.org/news/2013-03-tenfold-hurricane-frequency-century.html#jCp

    2. “More Extreme Weather Events Forecast
    01.16.13

    Get ready for more extreme weather and increasingly serious impacts on health, the economy and the environment, courtesy global climate change.”….

    “More Extreme Weather Events Forecast
    01.16.13

    Get ready for more extreme weather and increasingly serious impacts on health, the economy and the environment, courtesy global climate change.”…..

    “Climate change is leading to a greater number of high-intensity hurricanes. This is Hurricane Irene on Aug. 27, 2011, after making landfall at Cape Lookout, N.C. Credit: NASA/NOAA GOES Project”

    http://www.nasa.gov/centers/langley/science/climate_assessment_2012.html

    3. Hurricanes and Climate Change
    Increasingly destructive hurricanes are putting a growing number of people and structures at risk.

    Sandy. Katrina. Andrew. Ike.
    Wilma. Ivan. Charley. Irene.
    For coastal communities, the social, economic, and physical scars left behind by major hurricanes can be devastating.
    While hurricanes are a natural part of our climate system, recent research suggests that their destructive power, or intensity, has been growing since the 1970s, particularly in the North Atlantic region [1].
    A growing number of people and structures are at risk from the increasingly destructive potential of hurricanes, a trend exacerbated by sea level rise and rapid population growth……. ”

    http://www.ucsusa.org/global_warming/science_and_impacts/impacts/hurricanes-and-climate-change.html#.V-_xd4WcGUl

    4. Geophysicist: A Katrina hurricane will strike every two years

    http://sciencenordic.com/geophysicist-katrina-hurricane-will-strike-every-two-years

    Etc, etc, etc……

    The metric that was set in the articles above and by several others was the context of Dr. Spencer’s 4,000 day post. But other metrics were wrong to. Like the general predictions of more powerful Atlantic Hurricanes which has obviously also been falsified.

    • David Appell says:

      RAH wrote:
      “Like the general predictions of more powerful Atlantic Hurricanes which has obviously also been falsified.”

      Upward trends in North Atlantic storms and major hurricanes:

      http://policlimate.com/tropical/north_atlantic_hurricane.png

      Upward trend in North Atlantic ACE:

      http://policlimate.com/tropical/north_atlantic_ace.png

    • David Appell says:

      RAH wrote:
      Like the general predictions of more powerful Atlantic Hurricanes which has obviously also been falsified.

      Annual North Atlantic ACE(*) has increased by 17% per decade since 1970.

      data:
      http://models.weatherbell.com/global_ace_monthly.dat

      * ACE is a lousy metric, because it doesn’t include the size of storms. And it isn’t even an energy.

      • RAH says:

        And there is absolutely no correlation between ACE and Co2.

        And ACE is a lousy metric when one tries to misuse it. The fact stated was based on the claims made back in 2005 and after and you knew darn well it was.

        Besides the obvious fact that the stats show a decline in Major storms which is the bottom line in my statement above. A

        • David Appell says:

          RAH wrote: “And there is absolutely no correlation between ACE and Co2.”

          What did you get when you did this calculation?

          “And ACE is a lousy metric when one tries to misuse it. The fact stated was based on the claims made back in 2005 and after and you knew darn well it was.”

          The 17% per decade number is based on 1970-2015 data. I linked to it.

          One of the world’s hurricane experts told me is about the worst metric out there.

          For example, a mosquito and a hurricane, both moving at X miles per hour, have the same ACE.

          “Besides the obvious fact that the stats show a decline in Major storms which is the bottom line in my statement above.”

          Which stats are those? (I’m interested.)

          • Omg, what hurricane expert told you that? ACE is a 3 dimensionally integrated measure of total cyclone kinetic energy. How could any meteorologist compare that to a mosquito??

          • RAH says:

            A blind man can see the general decline in Majors since 2010 and it’s even more obvious if one starts at 2005 but that was a record year:

            https://en.wikipedia.org/wiki/Atlantic_hurricane_season
            Major Hurricanes:
            2005 – 7
            2006 – 2
            2007 – 2
            2008 – 5
            2009 – 2
            2010 – 5
            2011 – 4
            2012 – 2
            2013 – 0
            2014 – 2
            2015 – 2
            2016 – 2 (so far)

          • barry says:

            What would you say if the prediction of more intense Hurricanes was tied to warming North Atlantic SSTs, and that N Atlantic SSTs haven’t changed much since 2010, or 2005?

          • RAH says:

            Actually the during the last El Nino SSTs in the Equatorial Atlantic were cooler than normal most of the time during the traditional Atlantic hurricane season. This combined with the sheer resulting from the shifting of the Pacific trades during an El Nino to an easterly direction result in conditions that are not as conducive for TS formation or for sustaining them in the western equatorial regions of the Atlantic, Caribbean, or Gulf of Mexico.

            Would you not agree that among other factors, for storm formation, be it on land or over water, contrasts in temperature air masses are a prerequisite? In general the greater the contrast the stronger the storms produced?

            Corner stones of the hypothesis of Anthropological climate change/AGW called for increased temperatures in the Arctic and Temperate zones and the development of a “hot spot” in somewhere in the mid to upper troposphere of the equatorial regions. There has been some warming in the Arctic and Temperate zones of the NH but the hot spot has never shown so the temperature contrast between the zones decreased and so has the number and severity of Atlantic TS.

            Now that the El Nino is gone and its effects are dissipating with a La Nina of yet to be determined amplitude most likely to follow combined with the AMO shifting negative I suspect that next year and the following we will see a jump in temperature contrast resulting in both increased frequency and severity of Atlantic TS.

            The no Major Hurricanes striking the US metric and the general decline in the number and amplitude of Atlantic TS over the last few years is going to end starting late this season or during the next IMO. I also believe the tornado incidence and severity in N. America will also start ramping up at the same time from the record or near record lows we have seen the last few years. And when that happens there is no doubt in my mind the buffoons, like our current president that blamed Hermine on Climate Change recently, will be out singing their same old song of doom.

            There is one other factor that should be noted that applies to both the tornado count in N. America and the measure of numbers and amplitude of Tropical Cyclones world wide. As our technology continues to advance so do our abilities to detect and measure in detail. Quite simply we “see” much more now than we did even a decade ago. This has led to inflation of current values when compared to the historical record. Wind speeds in TS and the numbers of tornadoes highly susceptible to this inflation. And of course current counts and measurements of both TS and tornadoes in the pre Doppler and satellite days are not directly comparable to the more modern records except possibly at landfall. It is just like the reason why the sunspot count, the longest running data stream of scientific observations we have, has been adjusted. The NOAA Storm Prediction center has recognized this concerning the tornado counts and has been attempting to adjust for it.
            http://www.spc.noaa.gov/wcm/adj.html

            To my knowledge (admittedly limited) no such adjustments are being made to the measurements of Tropical Cyclones and the longer this condition remains in effect the less value comparisons of the historic record with more modern events will have as time goes by.

          • RAH says:

            I should have been clearer concerning the effects of the AMO. The record clearly shows that once the AMO is negative there is a decrease in Hurricane activity. But we are just at the beginning of the shift so with the passing of the El Nino we will see an increase.

            https://notalotofpeopleknowthat.files.wordpress.com/2011/12/image6.png

          • barry says:

            Would you not agree that among other factors, for storm formation, be it on land or over water, contrasts in temperature air masses are a prerequisite? In general the greater the contrast the stronger the storms produced?

            Among other factors, yes. Temp difference at altitude, for example, caused in part by the forming of the storm. Cyclones form over warm waters. Predictions of future cyclones are uncertain, but a fairly consistent theme is that they will become more intense if surface waters warm where they form and track. Frequency is much less certain.

            Also aware that observed intensity changes is a mixed bag, but that there is some indication of intensity tracking changes in SSTs over decadal periods.

            I checked N Atlantic SSTs against cyclone frequency/intensity for the basin. NA SSTs have not changed much from 2005 values, although there were high temps in 2010 which went along with a fairly intense season.

            There seems to be some correlation, and it makes sense when you consider SSTs during cyclone season, which is basically from the begining of NH summer to late Autumn. Warmer SSTs appear to produce cyclones.

          • RAH says:

            Sure it takes warm SSTs for TS development but it takes much more than that. TSs are really fragile beasts. It takes a combination of factors for them to develop and strengthen and the changing of any of those factors has pretty immediate effects. Right now Matthew, while remaining a Cat IV with 140 mph sustained is more likely to weaken than to strengthen because it is sucking in air from a dry air mass to it’s NW despite warm SSTs. Eventually the action of the storm it’s self should hydrate the air in it’s NW quadrant and then it can grow stronger.

    • barry says:

      If those articles set the metric, then I quote…

      Sandy. Katrina. Andrew. Ike.
      Wilma. Ivan. Charley. Irene.

      Sandy was the most recent, October 2012, making it about 1500 days since it hit the US.

      Now, either you accept Sandy in the list, as it is in the article on intense hurricanes according to ‘alarmists’, or you agree with skeptics’ comments above that Sandy doesn’t make it into the list, in which case you have cited the wrong metrics.

  47. ren says:

    2016 Atlantic, Caribbean & Gulf Of Mexico Hurricane Season Forecast (Updated On May 14)

    Summary: The 2016 Atlantic Hurricane Season is likely to be much more active than the 2015 Hurricane season. In fact, this season could be the most active hurricane season since 2012. In addition, it appears that we will see longer lasting tropical storm activity this year as well as more hurricane activity this season as compared to the last few years.

    With that said, the forecast for the 2016 Atlantic Hurricane season continues to be a very difficult one due to many factors that may be in favor for a very active season but other ones may cause it to be quite inactive.

    The Numbers: 11 more named storms (we have already seen the development of Alex back in January), 8 of those storms becoming hurricanes and 3 of those hurricanes becoming major hurricanes (Category 3 or higher on the Saffir-Simpson scale).
    http://crownweather.com/index.php/discussions/2016-atlantic-caribbean-gulf-of-mexico-hurricane-season-forecast/

    • RAH says:

      Ren

      This season will probably be active well past the peak. This is to be expected after an El Nino. I would be very surprised if next season is not much more active than this one will be and could be a very active one something like 2005.

      • ren says:

        La Nina has a problem in connection with the meridional jet stream. The next hurricane season may be too weak.

        • RAH says:

          La Nina years are associated with greater numbers and stronger hurricanes then El Nino years Ren.

          https://www.climate.gov/news-features/blogs/enso/impacts-el-ni%C3%B1o-and-la-ni%C3%B1a-hurricane-season

          “Simply put, El Nio favors stronger hurricane activity in the central and eastern Pacific basins, and suppresses it in the Atlantic basin (Figure 1). Conversely, La Nia suppresses hurricane activity in the central and eastern Pacific basins, and enhances it in the Atlantic basin” (Figure 2).

          Remember which way the wind is flowing during an El Nino. Those easterly winds extend into the Gulf and Caribbean and cause powerful sheer. It is also common to have lower than normal SSTs in the Atlantic during and El Nino.

  48. ren says:

    The hurricane could develop only in the Caribbean, because the equatorial Atlantic is cool.
    http://oi68.tinypic.com/34rbtcn.jpg

  49. ren says:

    You can see a lot of rain in the eastern United States.
    http://www.ssd.noaa.gov/goes/comp/ceus/wv-animated.gif

  50. sky says:

    Question for Roy: is Matthew really the result of cyclogenesis in the Caribbean, or did it originate as a cut-off low off Cape Verde?

  51. barry says:

    Just so I have this straight…

    Metric is Cat 3 cyclone/storm

    Has to be at that intensity when it hits the US

    So, if predictions are that there will be more intense storms, that could still be the case depending on the vagaries of where the storms track.

    There has been one link given specifically to more intense storms at US landfall, but the category is not given.

  52. barry says:

    RAH provided these links to help us identify why Dr Spencer has set his metrics as above.

    1) http://phys.org/news/2013-03-tenfold-hurricane-frequency-century.html#jCp

    From the referenced study;

    The surge index is not intended as a proxy for wind speed-derived metrics

    The paper doesn’t predict US landfall specifically. Data was taken worldwide, and comments and storm surge in S Americas, too. Cat ratings are not part of the metric. They’re looking at storm surge.

    2) http://www.nasa.gov/centers/langley/science/climate_assessment_2012.html

    US National report, but landfall not specified, only ‘more intense hurricanes’. If you read the draft report available at the time of the article, it speaks of Atlantic hurricanes. Landfall not specified.

    3) http://www.ucsusa.org/global_warming/science_and_impacts/impacts/hurricanes-and-climate-change.html#.V_BRAPn5iUm

    UCUSA says that hurricanes are becoming more intense but not necessarily more frequent. Data is Atlantic basin, not just US landfalling hurricanes.

    4) http://sciencenordic.com/geophysicist-katrina-hurricane-will-strike-every-two-years

    From the same study as 1). The author is quoted as predicting more hurricanes hitting the US East coast in a warming world, so this is perhaps the best (only) article that fits with Dr Spencer’s metrics. however, it’s a translated article, and there are discrepancies with 1).

    • RAH says:

      Add this one Barry:

      Tenfold increase in hurricane frequency this century, research predicts

      “By examining the frequency of extreme storm surges in the past, previous research has shown that there was an increasing tendency for storm hurricane surges when the climate was warmer. But how much worse will it get as temperatures rise in the future? How many extreme storm surges like that from Hurricane Katrina, which hit the U.S. coast in 2005, will there be as a result of global warming? New research from the Niels Bohr Institute show that there will be a tenfold increase in frequency if the climate becomes two degrees Celcius warmer.”

      Read more at: http://phys.org/news/2013-03-tenfold-hurricane-frequency-century.html#jCp

      And this one:

      Geophysicist: A Katrina hurricane will strike every two years

      Increases in Earths average temperature will result in far more hurricanes in the future, new study reveals.
      http://sciencenordic.com/geophysicist-katrina-hurricane-will-strike-every-two-years

      And then there is the media:
      http://www.drroyspencer.com/2016/09/matthew-to-arrive-4000-days-after-last-major-hurricane/#comments

      • barry says:

        The first 2 are already in my post.

        I think rather than chase up the 10 articles in the 3rd link you’ve googled in 1 minute, I challenge you to find one amongst them that makes a prediction about

        Cat 3 Hurricanes making landfall in the US

        This is the metric Dr Spencer is using, so we need to see an article/study using the same metric, thereby corroborating Dr Spencer’s precise choices here.

        Because so far the articles you’ve provided have much broader metrics that don’t compare with Dr Spencer’s.

        • RAH says:

          Then your not reading what I’m reading.

          Statements like:” A Katrina hurricane will strike every two years” are not indicating the US is the target? It think so.

        • barry says:

          I am reading what you are reading. I also read the study behind the article. Did you?

          Here is a quote from the article, by the author.

          With global temperatures being as they are today, we can expect to see a hurricane like Katrina every 20 years.

          The article is dated March 2013.

          http://sciencenordic.com/geophysicist-katrina-hurricane-will-strike-every-two-years

          And here is the Katrina-every-two-years quote in context:

          The UN climate panel estimates that Earths average temperature may rise by 3.4 degrees Celsius over the next hundred years. This, scientists say, will increase the frequency of extreme weather events.

          If this trend continues, it is realistic to expect a ten-fold increase in hurricanes like Katrina. That amounts to once every two years, says geophysicist Aslak Grinsted, of Copenhagen Universitys Niels Bohr Institute.

          So when is this supposed to happen? At the end of the century? After global temp rise of 3.4C? Article is unclear.

          So go read the paper behind the article. The title is ‘Projected Atlantic hurricane surge threat from rising temperatures’ easily found in full at google scholar.

          Wherein you will discover what I wrote above about it. Based on storm surge index, not Hurricane Category, and not specifically about US landfall.

          I ask again, what is the specific study or prediction that matches Dr Spencer’s use of US landfall only metric, and only Cat 3, rather than the more general Atlantic basin wide intensity?

          • There is no single accepted metric…it depends on what you are interested in. If a person is interested in the effect of global warming on tropical cyclones in general, then I would say a global ACE metric, or global number of major hurricanes, is the most useful. Or, if you are a coastal resident of the U.S. worried about property damage, then major hurricane strikes in the U.S. might be the most interesting to you.

          • Ross says:

            Roy Spencer: You have been caught out exaggerating the non-existence of low intensities increasing in a warming world. The least you could do is admit your metric is a high metric that distorts the true trends of data. You seem to take great satisfaction with ever increasing sarcasm at global warming climate scientists. You treat them like a bunch of idiots.

            Well it is on you this time. Caught out.

            This is so satisfying.

          • So, I’ve been “caught out exaggerating the non-existence of low intensities increasing in a warming world”?

            Oh, my! Besides how benign and silly that sounds, exactly where did I “exaggerate the non-existence of low intensities increasing”?

          • Ross says:

            Freudian stuff up plea Roy. The rest makes coherent sense.

  53. barry says:

    Why would a category 3 Atlantic Hurricane hitting Mexico/the Bahamas not count?

    Is this really in response to predictions made about hurricanes hitting the US only?

    Hurricane Dean was cat 5 when it made landfall in 2007. But because it hit Mexico I guess it is immaterial?

  54. RAH says:

    barry says:

    ‘Is this really in response to predictions made about hurricanes hitting the US only?”

    Yes! That is exactly what the 4,000 days is about Barry and rightfully so.

    • barry says:

      It seems to me that predictions have been made about greater intensity (not frequency) of Atlantic cyclones.

      Dr Spencer’s metrics don’t match the forecasts that I know of, and the links you provided to corroborate them clearly did not.

      Simply, I am aware that scientific projections are about intensity, not frequency, and are about the Atlantic basin, not specifically about hurricanes making US landfall. The predictions could be right, but Dr Spencer’s window of observation is narrower, so one could claim they have failed simply because it’s all about the US instead of basin-wide hurricanes.

      Mind you, I’m looking at the science. No doubt there have been a few sensational news reports. Is that what Dr Spencer could be responding to?

      • RAH says:

        It seems to me that you have a rather limited longer term memory. I can well remember all the hype about bigger and more powerful storms hitting the US more frequently after Katrina and for a few years after until it became evident that the US was in what someone termed a “hurricane drought”. Personally I view our record period with a strike by a major hurricane on the shores of the continental US as a hiatus and not a “drought”.

        But if you can’t understand or agree with what this thread was about by now you never will. So I have quit trying to show you.

        Anyway, it seems the probability of Matthew ending our respite is growing at this time.

  55. barry says:

    Looking for time series on N Atlantic hurricanes and storms this is the first thing that popped up:

    http://www.nhc.noaa.gov/climo/images/Atlantic_Storm_Count.jpg

  56. barry says:

    Anyone have a nice time series on N Atlantic SSTs?

    If hurricane intensity /(frequency?) is tied to SSTs, then it would be good to know if SSTs in the NA have changed much since 2005.

    • Bart says:

      Barry – you asked some questions here. Since that comment thread is closed, I am responding to you here.

      “The biosphere has been a net sink for our emissions.”

      We don’t know that, Barry. All we know is that the net left over after all inputs happens to be a figure which is roughly equal to half of the sum total of emissions.

      “Think of a bank balance.”

      Don’t. This is a very simplistic, and very flawed, analogy. The only way you could make it apply would be if you added interest and fees into the balance. You can adjust the interest and fees in a manner to make the outcome whatever you want it to be.

      It appears you have imbibed the silly pseudo-mass balance argument put forward by, among others, the SkS website. It is a very stupid argument.

      It goes like this. The change in atmospheric concentration is given by

      C = Ea + En – N

      where Ea is anthropogenic emissions, En is natural emissions, and N is natural sink activity. We know that C is approximately 1/2 of Ea, so we have En – N is negative. Hence, nature takes out more than it puts in, i.e., is a net sink hence, it is claimed, nature cannot be responsible for the observations.

      This is a very, very, very stupid argument. N is not all natural. Though the mechanisms are natural, a portion of it is brought into being by the pressure of the anthropogenic forcing. It is anthropogenically induced. Hence, in a very real sense, that portion of natural sink activity is, in fact, anthropogenic sink activity.

      That is to say, N is a dynamic response term. The natural sinks react to both the natural and the anthropogenic forcing in equal measure. As such, N can be expressed as

      N = alpha*(Ea + En)

      for some factor alpha between 0 and 1 to be determined. A value of alpha near zero would reflect sluggish sink activity. A value near 1 would reflect virulent sink activity.

      We have

      C := (1-alpha)*(Ea+En)

      The total net contribution of Ea to C is proportional to (1-alpha). Furthermore, we know that Ea is about 3% or less of En. Since C is proportional to the sum of Ea and En, that means that Ea can be contributing only about 3% or less to C.

      Consider the case where alpha is near unity, alpha = 1 – eps, where eps is a small number (this would be a case where sinks are very active). Then

      0.5*Ea := eps*(Ea + En)

      We see that Ea can only be contributing proportionately eps/0.5 of the total, which is small. But, En is large, so eps*En is not small, and is the major contributor.

      This is very basic feedback control stuff, Barry. Very basic. The guys at SkS are a bunch of computer scientists who have only ever dealt with virtual reality, not the real thing. They can spin a good yarn, but they don’t actually understand basic physics and mathematics, and are basically a bunch of cranks. You would do well to avoid them or, at least, take anything they tell you with a huge grain of salt. When they get something this basic so very, very wrong, it calls into question anything else they have to say.

      • Bart says:

        I cut off the quote of yours to which I was responding, and it’s not got the proper context. The full quote was:

        “The biosphere is a net sink for our emissions but it only sinks half of that which we emit.”

        We do not know that. As I detailed above, the Earth’s CO2 exchange systems are sinking nearly all of what we emit, fairly rapidly, as is indicated by the temperature to rate-of-change of CO2 relationship.

        That the net increase just happens to be a value roughly equal to half the sum total of our emissions is of no particular significance. That just happens to be how much the increase has been. It has to be something, 0.5X, 0.2X, 3.3X, whatever. There has to be some value – 0.5X just happens to be (approximately) it.

        The fact that it is less than the sum total of anthropogenic inputs does not in any way require that anthropogenic forcing is responsible for the observed increase, because those anthropogenic inputs are short lived, and rapidly sequestered out of the surface system. All inputs are, in fact. But, the natural inputs are so much larger that their impact is dominant.

        • ren says:

          During the last geomagnetic storm have occurred volcanic eruptions in Indonesia and Mexico as well as a swarm of tremors in the volcano Katla in Iceland.

        • barry says:

          Bart:

          You make $1000 a month
          You spend it all
          Over a year your bank balance is stable, fluctuating by $1000

          You get a raise of $50
          You spend $1025 bucks a month
          Now your bank balances increases by $25

          You now try to argue that the reason the bank balance is growing is because of your spending habits and not the raise

          This is the perfect analogy for the atmospheric carbon balance.

          CO2 fluctuates anaually with the seasons, but remains stable, as it did prior to the industrial revolution
          Then we started emitting it
          The excess year by year is half the amount we emit
          It HAS to be us

          It’s the raise, not the spending habits that causes the rise.

          • Bart says:

            Sorry, Barry. It’s a really stupid analogy. It is clear you have no experience with dynamic systems.

          • barry says:

            We have a steady state before the industrial revolution, ~ 280ppm.
            Then by some amazing coincidence atmospheric concentrations start rising at the same time we start emitting.

            Not only do concentration rise, but they rise as a fairly steadt fraction of the amount we put out.

            What you are suggesting is that the biosphere sinks all the anthro CO2 and that there just happens to be an ongoing natural release that is a fairly constant fraction of the amount we pump out.

            So if we pump out 10 Gt CO2 in a year, the biosphere sequesters all that and pumps out 5 Gt. If we pump out 30Gt in a year, the biosphere sequesters all the anthro and amazingly maintains the fraction increase by pumping out 15 Gt.

            And this has been going on for over a century. You just have to sit back in wonder at this extraordinarily fluke of nature – that the biosphere has, by coincidence, maintained that fraction of increase to our emissions, even as our emissions have increased through the years.

            That we emit CO2 faster than the biosphere can absorb the excess should be then end of the story.

            But this is not all the evidence we have. We also have changes in the isotopic ratios in atmos CO2 (and in oceanic CO2) consistent with the excess coming from fossil fuel burning.

            This part of the science really is settled. I didn’t get any of my understanding on this from SkS, by the way.

          • barry says:

            The last time atmospheric concentrations CO2 rose by 100ppm, it was over 5000 years while the temperature of the planet increased by 5C.

            We’re currently emitting at 4ppm per year on average. That’s 200 times faster than in the geological record of the recent ice ages. The atmospheric increase is 100 times faster than any time in the geological record of the recent ice ages.

            When you run the derivatives to CO2, do you notice the fraction of change? Have you run a trend line through the derivatives to see how much additional CO2 comes from changes in surface temperature?

            I’d be interested to see your results there.

          • Bart says:

            “We have a steady state before the industrial revolution, ~ 280ppm.”

            We don’t actually know that. It has been assumed on the basis of a single, unverifiable measurement source, that being the ice cores.

            We cannot verify it. No direct measurement of CO2 from 100s of years ago is around to compare it to. It is an experiment without a control.

            But, even if there were some way we could verify it, past performance is no indication of future results. So, it is both a leap of faith, and a moot point.

            “Then by some amazing coincidence atmospheric concentrations start rising at the same time we start emitting.”

            Not so amazing. Either they’re both rising in tandem, or they’re going in opposite directions. It’s 50/50. Not the kind of odds to bet the ranch on.

            “Not only do concentration rise, but they rise as a fairly steadt fraction of the amount we put out.”

            All the more reason to doubt our culpability. This is not how dynamic systems typically work. You do not generally get the same polynomial order going out as coming in.

            “What you are suggesting is that the biosphere sinks all the anthro CO2 and that there just happens to be an ongoing natural release that is a fairly constant fraction of the amount we pump out.”

            Meh. It’s just two low order polynomial time series data sets. It’s not difficult to match low order polynomials to one another if they happen to be going in the same direction (which, as stated, is a 50/50 proposition). All you have to do is perform a linear least squares fit using one of the data sets as the dependent variable and the other as the independent variable to get the coefficients that will generally provide a fairly good affine match.

            What is difficult to do is to match the high frequency components as well as the low. That is why this plot is so convincing:

            http://woodfortrees.org/plot/esrl-co2/derivative/mean:12/from:1979/plot/uah6/offset:0.6/scale:0.22

            The derivative matches in every nook and cranny, across the entire spectrum. Try differentiating the emissions data and matching it up. It doesn’t match:

            http://i1136.photobucket.com/albums/n488/Bartemis/nopause_zpscjndrosf.png

            It is particularly divergent over the recent “pause”. Emissions keep accelerating. Atmospheric concentration does not.

            “We also have changes in the isotopic ratios in atmos CO2 (and in oceanic CO2) consistent with the excess coming from fossil fuel burning.”

            Fudged data that does not compel a unique interpretation. This is nothing. Just hand-waving rationalization.

          • barry says:

            The steady-state CO2 for the few thousand years prior to the industrial revolution is not based on a single ice core.

            It’s based on numerous ice cores from both hemispheres.

            It’s also based on sediment cores, corals, tree rings, shells, fossilized leaves and other proxies.

            In the 60 years of measuring CO2 from the atmosphere with modern equipment we see a steady background state with the steady annual fluctuation. The only thing changing is the concentration, and that is going up very steadily, too.

            It’s going up at half the rate we are emitting, and it’s been doing that consistently for the last 60 years of the instrumental record, and longer from the proxy record.

            You have to do some artful denying to reject that much corroboration.

            Regarding the isotopic ratio you replied:

            Fudged data that does not compel a unique interpretation. This is nothing. Just hand-waving rationalization.

            And you speak of hand-waving? Pfft.

            The derivative matches in every nook and cranny, across the entire spectrum

            I asked you to give a value for the amount of CO2 propelled by global warming. I ran a linear trend over the derivative and got a very low number indeed – 0.002 ppm per year. That’s 1000 times less than the current annual increase. But I’m probably doing it wrong. How would you work it out? What’s the trend you get?

            If you can’t do that, can you provide some physics-based estimate for how much CO2 would be given off by the biosphere (say the oceans) for a global warming of 0.7C (this was the warming for the 20th century), and can you say whether that would be instantaneous, or whether there would be a lag, as there was with ice age transitions?

          • Bart says:

            “Its based on numerous ice cores from both hemispheres.”

            Still ice cores. Same unverifiable dynamics.

            “Its also based on sediment cores, corals, tree rings, shells, fossilized leaves and other proxies.”

            Which do not all agree. The magical thing about confirmation bias is, you tend to find the patterns you are looking for.

            “The only thing changing is the concentration, and that is going up very steadily, too.”

            Yes, it is going up very steadily, with the rate of change proportional to temperature anomaly with respect to an appropriate baseline.

            “Its going up at half the rate we are emitting, and its been doing that consistently for the last 60 years of the instrumental record, and longer from the proxy record.”

            Actually, no, it isn’t. As I showed above, emissions are not tracking concentration very well at all. There is no “pause” in emissions.

            “How would you work it out?”

            It is an integral relationship. Take the derivative plot I gave you in the first link above, and integrate it.

            http://woodfortrees.org/plot/esrl-co2/mean:12/from:1979/plot/uah6/scale:0.175/offset:0.142/integral/offset:337

            Such an integral relationship arises naturally from a continuous flow problem, where you continually have CO2 entering and exiting the surface system. A temperature dependent throttling of that flow results in a continuous accumulation.

            That has been the bane of Climate Science in the late 20th to early 21st century – too much static analysis, without taking account of the continuous flow nature of the problem. Too many inappropriate analogies to bank accounts and such, trying to solve a calculus problem using algebra.

          • barry says:

            Which do not all agree

            For the period of interest, they do very well. Certainly no excursions of 100ppm since the last deglaciation, where atmos concentration holds at around 280-300 ppm until the industrial revolution. Multiple independent proxies corroborate.

            Here’s one
            Here’s another

            You can go through the rest of the list yourself.

            There is a tiny amount of fluctuation in CO2 from surface temperature changes. I’ve asked you to work out the trend for the record (from 1979, perhaps?) based on the derivatives.

            While you’re at it, hHow much natural CO2 is emitted by the biosphere for every degree of warming? What is the physics on this and how verified?

            You are using UAH data, which has a slowdown in temps for the period 1998 to 2014. Yet this was the period of largest CO2 rise than any in the instrumental record.

            How do you explain that?

          • Bart says:

            “For the period of interest, they do very well.”

            All unverifiable, as there are no direct measurements. It’s like me saying, “prove Zeus is the leader of the gods”, and you say, “look, here’s literature on Hera and Athena and Apollo – it all points to Zeus.” It’s effectively primitive superstition, backed up by more primitive superstition.

            And, incidentally, fossilized leaves in particular provide highly divergent estimates.

            “…hHow much natural CO2 is emitted by the biosphere for every degree of warming?”

            Obviously, I am not getting through to you. You want a sensitivity in ppmv/degC. There is no such quantity. The sensitivity is in ppmv/degC/unit-of-time.

            “You are using UAH data, which has a slowdown in temps for the period 1998 to 2014. Yet this was the period of largest CO2 rise than any in the instrumental record.”

            I’ve explained over and over again. It is an integral relationship. It was also the period of the greatest temperature differential in the record, and the rate of change is proportional to temperature anomaly. Here is the match

            http://woodfortrees.org/plot/esrl-co2/mean:12/from:1979/plot/uah6/scale:0.175/offset:0.142/integral/offset:337

            It is a much better match than provided by the emissions correlation, because emissions have been accelerating, and there has been no acceleration in concentration

            http://i1136.photobucket.com/albums/n488/Bartemis/nopause_zpscjndrosf.png

            You keep asking the same question, I keep explaining, and then you ask it again. I think maybe you do not know calculus. Without that tool in your toolbox, you might as well be hammering nails with a banana.

          • barry says:

            All unverifiable, as there are no direct measurements. Its like me saying, prove Zeus is the leader of the gods, and you say, look, heres literature on Hera and Athena and Apollo it all points to Zeus. Its effectively primitive superstition, backed up by more primitive superstition.

            These are proxy records, not superstition. Your drift into rhetoric ill becomes the discussion. And then you say…

            And, incidentally, fossilized leaves in particular provide highly divergent estimates.

            But this is the same ‘superstition’ you’ve just decried.

            So you are arguing opportunistically, which has led you to blatantly contradict yourself here.

            Stomatal records have a wider variance than ice cores – but by 15ppm. The largest variations in stomatal records are on the order of 30ppm – per the review study linked at – guess where – WUWT.

            (BTW, if you’re going to reject Skeptical Science, you have to reject WUWT, or else you show your true colours. WUWT is even more patently biased than SkS. Please.)

            At no time do the stomatals record show an excursion of 100ppm for the current interglacial period.

            But let’s take it that the stomatal records are an excellent proxy for temperature excursions. This would mean that the period from 1960 to present has had the largest, fastest temperature rise in the record. A warmer and higher temperature rise than the medieval warm period, for example, where no stomatal record shows a significant jump in CO2 levels.

            At no time in the stomatal record of the current interglacial do CO2 levels rise above 330ppm. If CO2 levels are driven by temperature we may conclude that the period from 1975 is the warmest period in the current interglacial. Mann’s Hockey Stick was right, then, do you think?

            I don’t. But that’s the clear inference from your posit.

          • barry says:

            It is a much better match than provided by the emissions correlation, because emissions have been accelerating, and there has been no acceleration in concentration

            Here you are completely wrong. Atmospheric concentrations have been accelerating with a very regular ratio to emissions.

            https://scripps.ucsd.edu/programs/keelingcurve/2015/02/12/is-the-rate-of-co2-growth-slowing-or-speeding-up/
            https://www.co2.earth/co2-acceleration

          • barry says:

            The derivative of temperature has no trend, whereas the derivative of CO2 does. That’s because there has been acceleration in atmos CO2.

            http://tinyurl.com/jmasu95

            Now that you know the rate of atmospheric concentration rise over time matches (as a fairly constant ratio) the emissions acceleration, does that make you question your hypothesis that CO2 rise is temperature driven?

            You are studiously avoiding giving hard values to your calculus. You are showing correlation with interannual fluctuation, but you have not shown the temperature/time dependent accumulation with hard numbers. How would you figure the decadal increase of atmospheric CO2 just from the evolution of temperature?

          • Bart says:

            “So you are arguing opportunistically, which has led you to blatantly contradict yourself here.”

            No contradiction. I’m not arguing that the stomata evidence is reliable. I’m simply observing that the argument you have made is a cherry pick of proxies that appear to support your POV.

            It’s pretty easy to “prove” whatever you want to prove if you only admit evidence that tends to support your hypothesis, and ignore that which doesn’t.

            “Atmospheric concentrations have been accelerating with a very regular ratio to emissions.”

            Sorry, no. I gave you the plots. It’s not a question of what happened in 1959 compared to today. It is a question of what has happened during the “pause” in temperatures since the late 1990’s.

            Since the onset of the”pause” in temperatures, atmospheric concentration has increased at a steady rate with no acceleration, which is consistent with the proportionality of the rate of change to temperature anomaly.

            It is not consistent with emissions, which have continued relentlessly to accelerate over the same time interval.

            Again, look at the plots:

            http://i1136.photobucket.com/albums/n488/Bartemis/nopause_zpscjndrosf.png

            It’s right in front of your eyes.

            “The derivative of temperature has no trend, whereas the derivative of CO2 does.”

            CO2 is not proportional to temperature, so of course the derivatives are not proportional, either. The rate of change, a.k.a. the derivative, of atmospheric CO2 is proportional to temperature anomaly. The rate of change of CO2 has the same trend that the temperature anomaly has when it is scaled to match the variations. That is the whole point.

            You’re just not getting the argument. You’re trying to shoehorn it into your preexisting conception so you can dismiss it. But, it does not fit into your preexisting conception. You need to pay attention to the argument.

            There is no sensitivity of ppmv per degC. It is a sensitivity of ppmv per unit of time per degC. You don’t compare the rate of change of CO2 to the rate of change of temperature. You compare the rate of change of CO2 to temperature.

            And, that provides an excellent fit, both in the short term (which the emissions don’t come anywhere close to doing) and the long term (which means emissions are not needed to explain the rise in CO2).

            “…but you have not shown the temperature/time dependent accumulation with hard numbers.”

            Yes, I have. It is right here:

            http://woodfortrees.org/plot/esrl-co2/mean:12/from:1979/plot/uah6/scale:0.175/offset:0.142/integral/offset:337

            Atmospheric CO2 concentration is increasing with a sensitivity of 0.175 ppmv/month/degC to temperature anomaly with a baseline of -0.142/0.175 = -0.811 degC relative to the UAH temperature anomaly, starting with a baseline of 337 ppmv at the beginning of the record.

          • Bart says:

            IOW, you give me the UAH temperature anomaly as it is currently processed. I will add 0.811 degC to it, then multiply it by 0.175, then integrate it versus time in months, then add the initial starting point of 337 ppmv to it, and that will give me the level of CO2 that is in the atmosphere to a high degree of accuracy.

            You can’t do that with the emissions. You can only get a superficial number which appears to match somewhat during the time temperatures were increasing along with the emissions, but then falters and starts to diverge when the “pause” commences.

            Emissions are accelerating. Atmospheric CO2 concentration is not. When they’re not trying to deny it altogether, the climate establishment is scrambling to produce epicyclic explanations for the apparent increase in sink activity. But, there has been no increase in sink activity. Atmospheric concentration simply never depended significantly on anthropogenic emissions in the first place.

            I’m growing weary of going around and around with you on this topic. If you don’t get it by now, you’re probably simply not open to the message, and never will.

            If past is prologue, we are due an extended period of static or declining temperatures until the 2040’s. By that time, there will be such a divergence between the accelerating emissions and the steadily rising, or possibly decelerating, atmospheric concentration that nobody will be able to deny what is already obvious anymore. So, keep watching. In the end, you will see.

          • barry says:

            Emissions are accelerating. Atmospheric CO2 concentration is not.

            This is wrong and is clearly wrong. Of the nearly 6 decades since 1959 all but one has had a faster rate of atmospheric increase CO2 than the prior decade. (Mauna Loa data)

            The annual rate for 1959-1968 is 0.81ppm

            The annual rate for 2006-2015 is 2.17ppm

            ftp://aftp.cmdl.noaa.gov/products/trends/co2/co2_gr_mlo.txt

            From the institute that has collected the Mauna Loa CO2 data from day one:

            The rate of growth in carbon dioxide concentrations in the atmosphere has accelerated since the beginnings of the Keeling Curve. The rate has gone from about 0.75 parts per million (ppm)/yr in 1959 to about 2.25ppm/yr today.

            https://scripps.ucsd.edu/programs/keelingcurve/2015/02/12/is-the-rate-of-co2-growth-slowing-or-speeding-up/

            I do not understand how you can continue to get this wrong. It’s basic, easily discovered knowledge on the topic.

          • Bart says:

            You are totally and completely wrong.

            Look at the plots:

            http://i1136.photobucket.com/albums/n488/Bartemis/nopause_zpscjndrosf.png

            It’s right there. Look at the top plot that has the rate of change of atmospheric CO2, along with the temperature fit to it. Look at the yellow dashed line I drew. Over the past 20 or so years, it is flat.

            Then, look at the bottom plot for annual emissions. See the yellow dashed line? Not flat. Not even close to being flat.

          • barry says:

            Here’s the Mauna Loa data plotted against a linear trend line. the curve in the annual data is obvious.

            http://woodfortrees.org/plot/esrl-co2/mean:12/from:1979/plot/esrl-co2/from:1979/trend

            The rate has accelerated, even while there was a slowdown in temperature. CO2 accumulation tracks the increasing emissions.

            With a bit of fiddling you can get pretty much any data with a positive trend to fit to another with a rising trend.

            It is well known that small fluctuations in background CO2 occur with ENSO events. The derivative of CO2 may capture the small fluctuations of temperature but it doesn’t capture the growth over time. Not nearly. I got a trend of 0.002ppmv/yr for the period 1979 from the CO2 derivative. That’s nothing compared to the actual trend. The interannual temp fluctuations have a small but identifiable impact – the impact of temperature for the longer-term CO2 changes is insignificant.

          • barry says:

            Look at the top plot that has the rate of change of atmospheric CO2

            Let’s look at the values.

            You’ve not nominated the period for the ‘pause’ (why do your calcs lack numbers so often?) so I’m going by eyeball and calling it 1995 to present. Let’s use the actual Mauna Loa numbers and check. We’ll split the period into (1) 1995-2005 and (2) 2005-2015 and compare rates.

            (1) 1.9 ppm/yr

            (2) 2.2 ppm/yr

            The acceleration is clear, even with the uncertainty (0.11)

            The derivative of CO2 is giving you the infinitesimal changes year to year and showing that there is aceleration (why the derivative shows a rising pattern with CO2 but not with temperature, which has been more linear).

            What is abundantly clear is that anthropogenic emissions are more than enough to account for the atmospheric CO2 rise over time. As I remarked in my 2nd reply to you on the other thread, you’ve discovered that interannual temperature fluctuations can have a small impact on annual CO2. That’s what the derivative is showing you.

            Over time the biosphere has been a net sink for excess (anthropogenic) CO2 above the baseline. It can’t have also been a source for that increase over time.

            If you want to argue that the quick turnover of CO2 molecules (on the order of a few years) means that it doesn’t have to be anthro CO2 that is remaining in the excess CO2 in the atmos, then fine (though the science disagrees with you). Whether the biosphere favours sinking anthro CO2 over natural, the increase is still because of anthropogenic CO2.

            And the evidence is very, very simple. We have emitted twice as much over time as has increased in the atmosphere. One has to do some rather odd contortions to reject what Occam’s Razor would firmly conclude is the case.

          • Bart says:

            You’re flailing. It’s right here

            http://i1136.photobucket.com/albums/n488/Bartemis/nopause_zpscjndrosf.png

            No amount of hand waving, rationalization, or obfuscation is going to change it.

            “Over time the biosphere has been a net sink for excess (anthropogenic) CO2 above the baseline. It cant have also been a source for that increase over time.”

            Yes, it can, because the sinks respond elastically to total input, including anthropogenic input. This is that really dumb pseudo-mass balance argument all over again. It is dumb, dumb, dumb, dumb, dumb.

            What matters is whether nature would be a net sink if you removed the anthropogenic forcing. It wouldn’t. Without the added pressure of anthropogenic inputs, the sinks would shrink in size, and you would then see that nature, on its own, is a net source.

            I think we’ve gone about as far as we can. You have a really dumb misconception stuck in your head and will not, or cannot, let it go.

            Keep watching. Time will tell. Hasta la vista.

  57. ren says:

    Circulation in the lower stratosphere will delay the sliding of the hurricane.
    https://earth.nullschool.net/#2016/10/07/0000Z/wind/isobaric/70hPa/orthographic=-88.32,27.60,519

  58. ren says:

    Hurricane clearly very slowly moves west.
    http://www.goes.noaa.gov/HURRLOOPS/ir/1.jpg

  59. PhyteOn says:

    Katrina was Cat 3 in 2005 at land fall

  60. ren says:

    Hurricane probably October 6 will reach Florida.

  61. RAH says:

    It sure isn’t looking good. The ensemble tracks have shifted back west again putting Florida back into play. As things stand now Matthew still has the potential to strike anywhere along the eastern seaboard including now Southern Florida. Too many variables with this slow moving storm to make reasonable forecasts of it’s track days into the future. The western end of Haiti and eastern end of Cuba are still in the bulls eye and the thing could slowly crawl right up the Bahama chain. It sure isn’t in a hurry and it’s slow movement north bodes ill for the US and for any landmass it strikes. About the only good news is that there is a good chance it will be less than a CAT IV when it does so.

    http://www.tropicaltidbits.com/storminfo/

    http://www.weatherbell.com/

Leave a Reply