
 Home/Blog
November Temperature Up a Little from October; 2016 Almost Certain to be Warmest in 38 Year Satellite Record
NOTE: This is the twentieth monthly update with our new Version 6.0 dataset. Differences versus the old Version 5.6 dataset are discussed here. The paper describing the methodology has been accepted for publication.
The Version 6.0 global average lower tropospheric temperature (LT) anomaly for November 2016 is +0.45 deg. C, up a little from the October value of +0.41 deg. C (click for full size version):
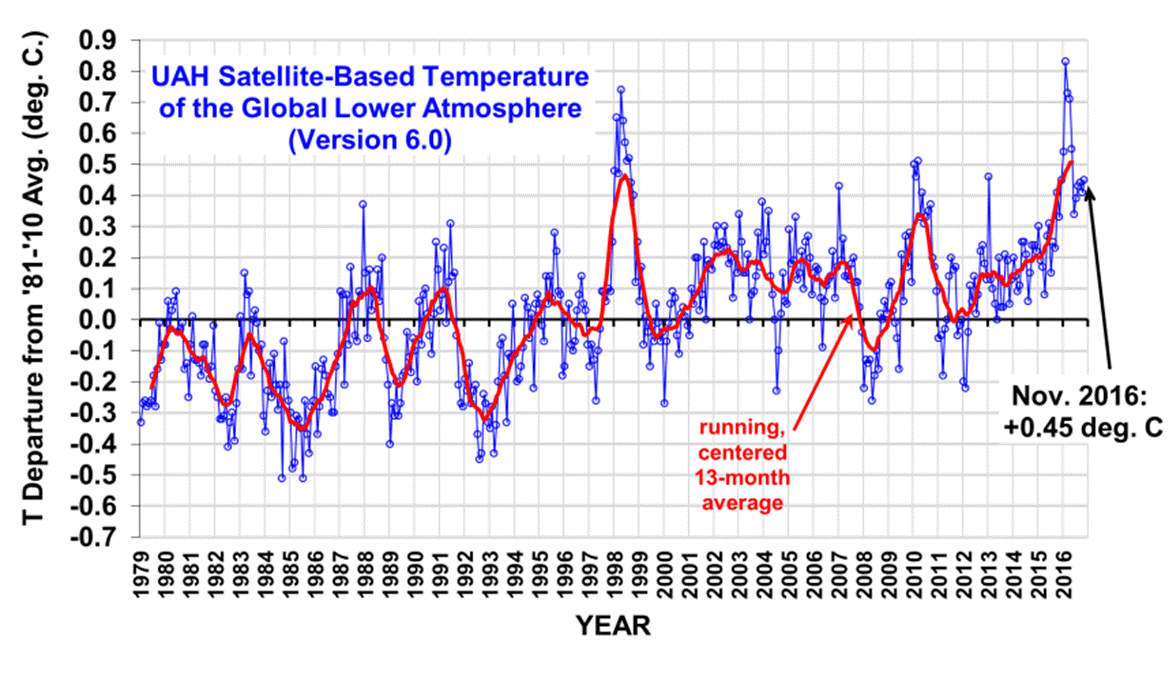
The global, hemispheric, and tropical LT anomalies from the 30-year (1981-2010) average for the last 23 months are:
YEAR MO GLOBE NHEM. SHEM. TROPICS
2015 01 +0.30 +0.44 +0.15 +0.13
2015 02 +0.19 +0.34 +0.04 -0.07
2015 03 +0.18 +0.28 +0.07 +0.04
2015 04 +0.09 +0.19 -0.01 +0.08
2015 05 +0.27 +0.34 +0.20 +0.27
2015 06 +0.31 +0.38 +0.25 +0.46
2015 07 +0.16 +0.29 +0.03 +0.48
2015 08 +0.25 +0.20 +0.30 +0.53
2015 09 +0.23 +0.30 +0.16 +0.55
2015 10 +0.41 +0.63 +0.20 +0.53
2015 11 +0.33 +0.44 +0.22 +0.52
2015 12 +0.45 +0.53 +0.37 +0.61
2016 01 +0.54 +0.69 +0.39 +0.84
2016 02 +0.83 +1.17 +0.50 +0.99
2016 03 +0.73 +0.94 +0.52 +1.09
2016 04 +0.71 +0.85 +0.58 +0.94
2016 05 +0.55 +0.65 +0.44 +0.72
2016 06 +0.34 +0.51 +0.17 +0.38
2016 07 +0.39 +0.48 +0.30 +0.48
2016 08 +0.43 +0.55 +0.32 +0.49
2016 09 +0.44 +0.49 +0.39 +0.37
2016 10 +0.41 +0.42 +0.39 +0.46
2016 11 +0.45 +0.41 +0.50 +0.37
To see how we are now progressing toward a record warm year in the satellite data, the following chart shows the average rate of cooling for the rest of 2016 that would be required to tie 1998 as warmest year in the 38-year satellite record:
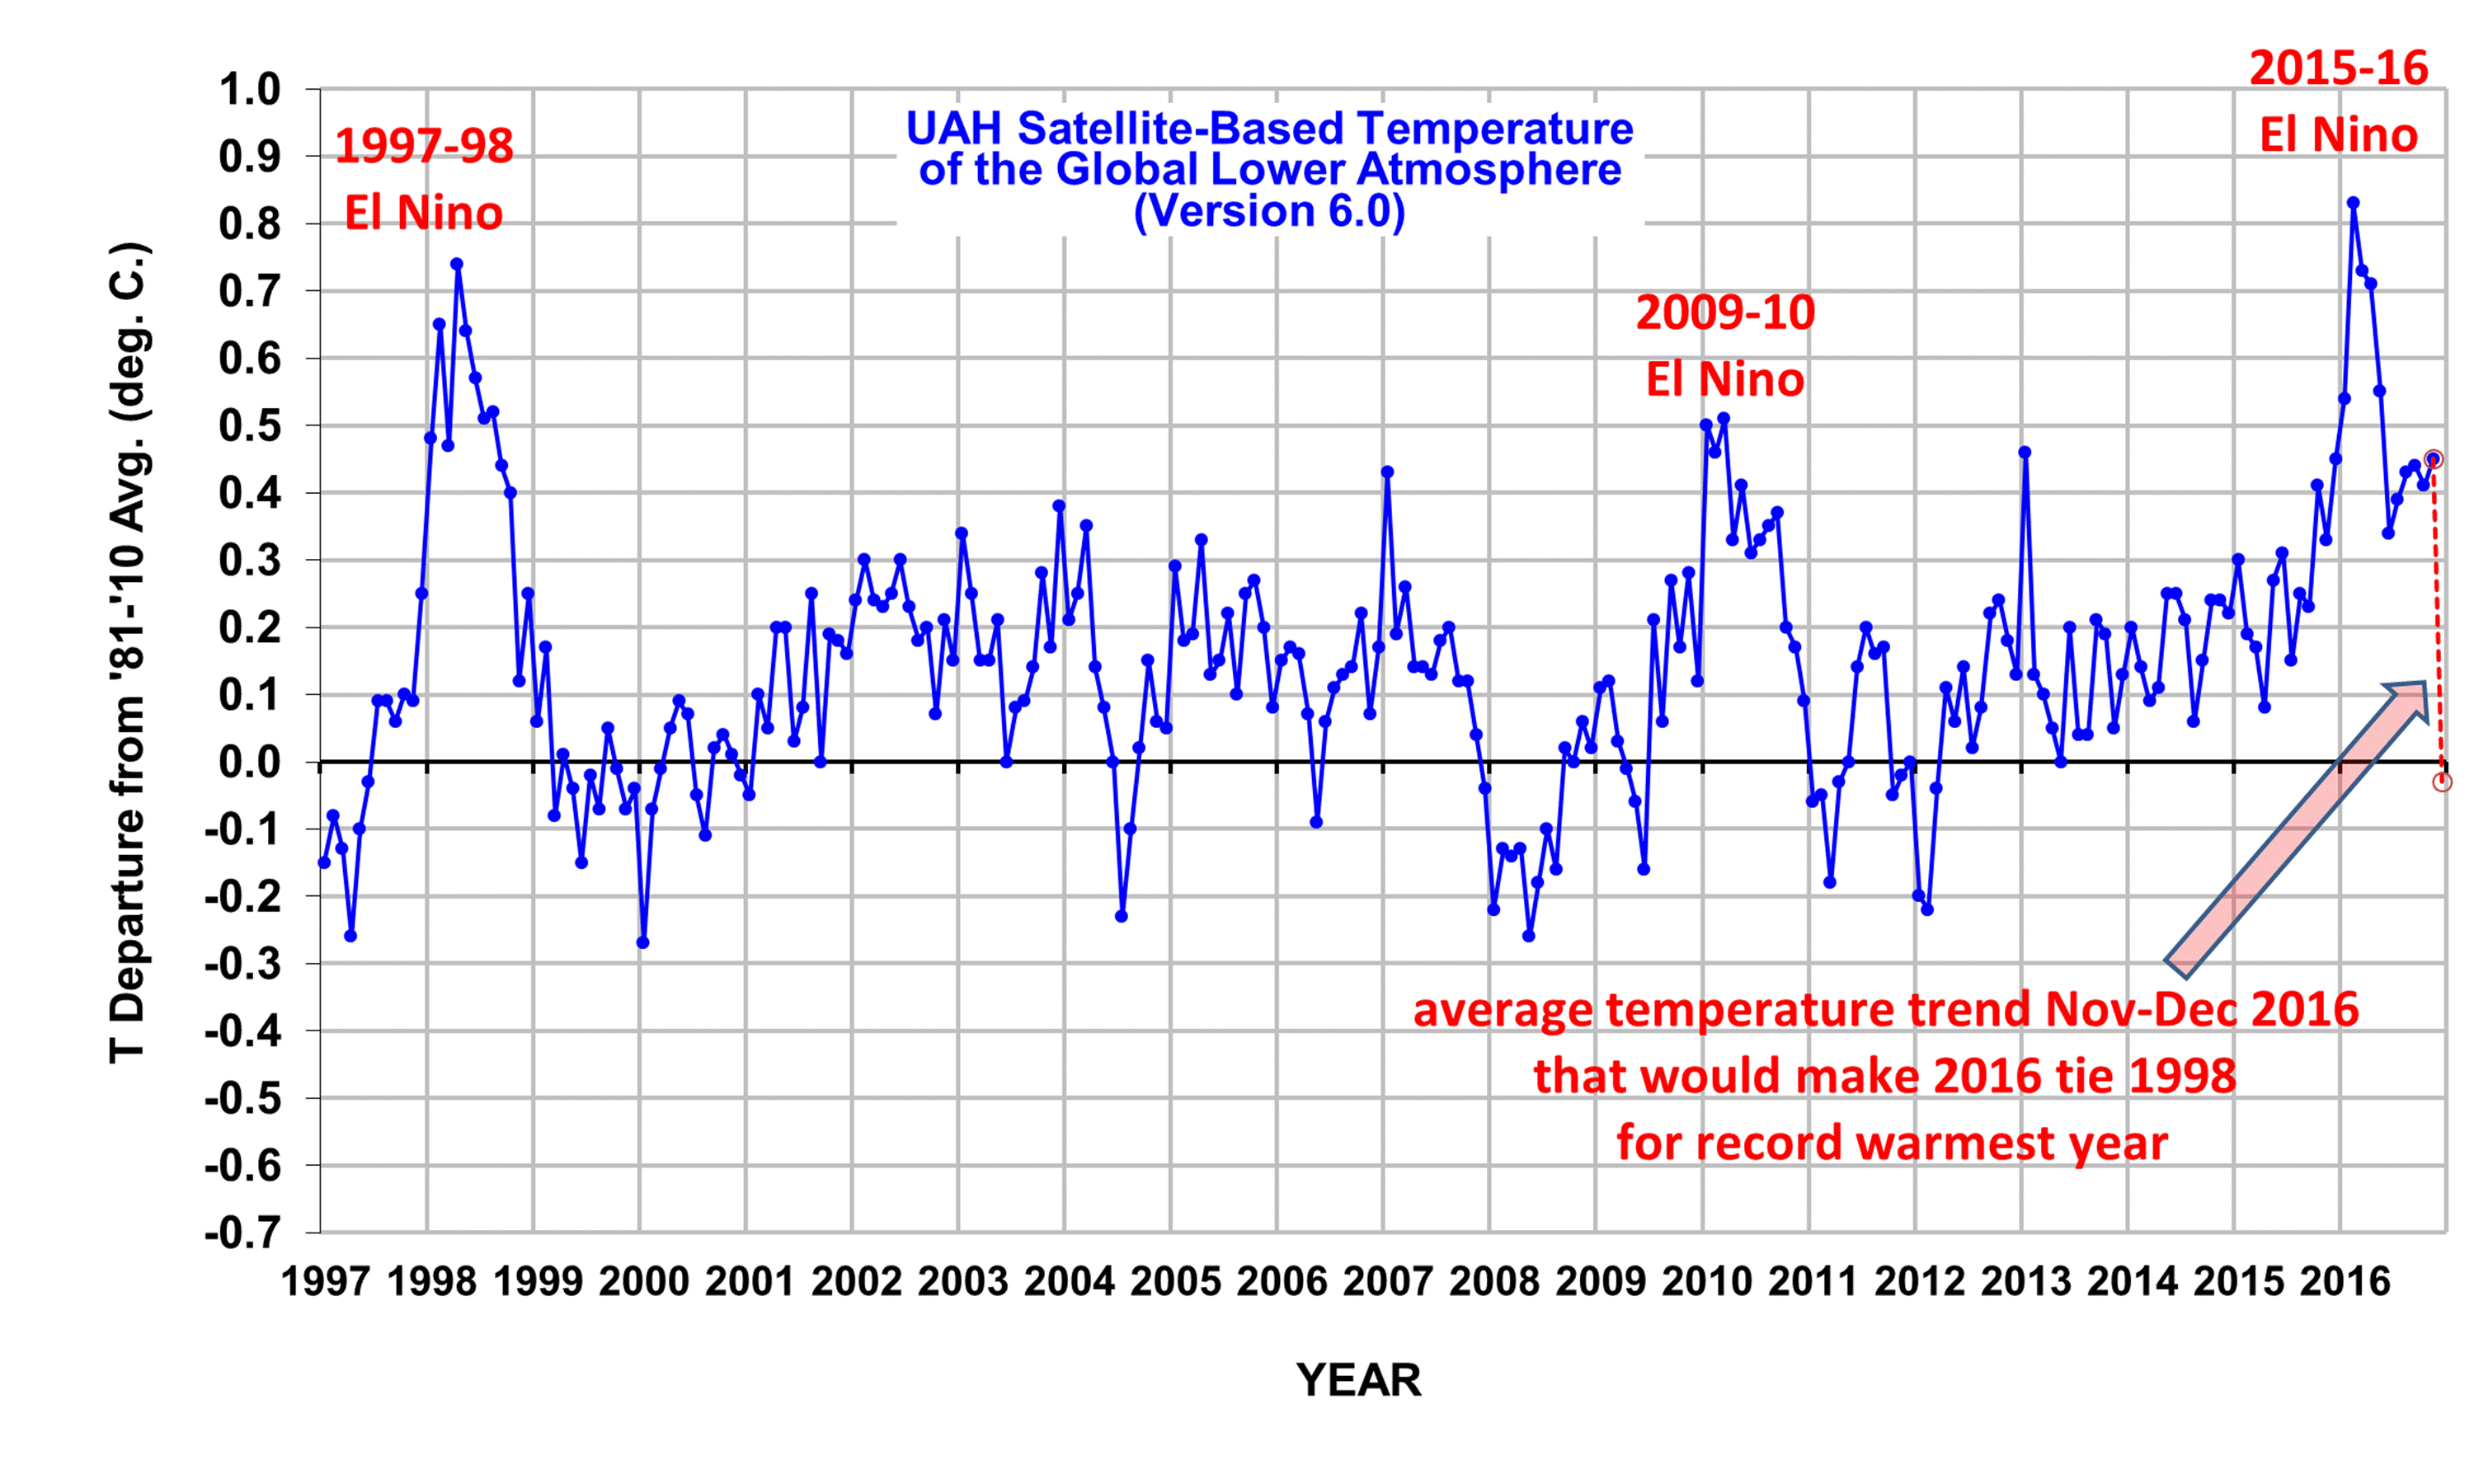
Based upon this chart, it now seems virtually impossible for 2016 to not be a record warm year in the UAH dataset.
UPDATE: It should be pointed out that 2016 will end up being 0.03-0.04 deg. C warmer than 1998, which is probably not a statistically significant difference given the uncertainties in the satellite dataset adjustments.
The “official” UAH global image for November, 2016 should be available in the next several days here.
The new Version 6 files (use the ones labeled “beta5”) should be updated soon, and are located here:
Lower Troposphere: http://vortex.nsstc.uah.edu/data/msu/v6.0beta/tlt/uahncdc_lt_6.0beta5.txt
Mid-Troposphere: http://vortex.nsstc.uah.edu/data/msu/v6.0beta/tmt/uahncdc_mt_6.0beta5.txt
Tropopause: http://vortex.nsstc.uah.edu/data/msu/v6.0beta/ttp/uahncdc_tp_6.0beta5.txt
Lower Stratosphere: http://vortex.nsstc.uah.edu/data/msu/v6.0beta/tls/uahncdc_ls_6.0beta5.txt


