
 Home/Blog
Strong December Cooling Leads to 2016 Being Statistically Indistinguishable from 1998
The Version 6.0 global average lower tropospheric temperature (LT) anomaly for December 2016 was +0.24 deg. C, down substantially from the November value of +0.45 deg. C (click for full size version):
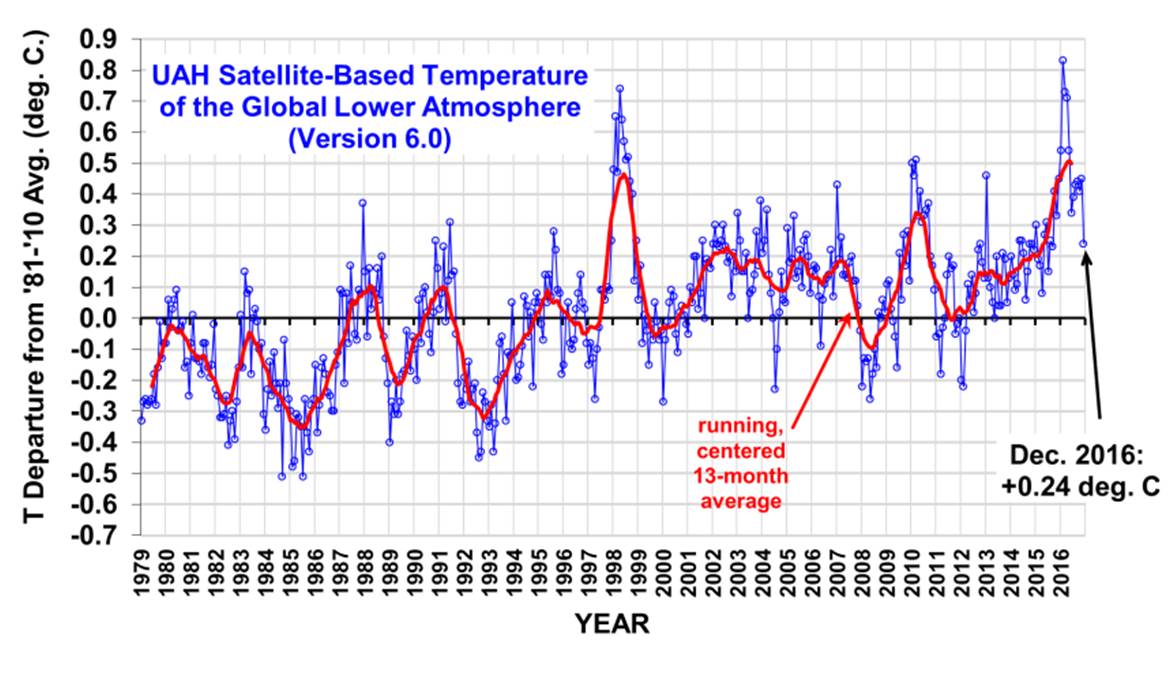
The resulting 2016 annual average global temperature anomaly is +0.50 deg. C, which is (a statistically insignificant) 0.02 deg. C warmer than 1998 at +0.48 deg. C. We estimate that 2016 would have had to be 0.10 C warmer than 1998 to be significantly different at the 95% confidence level. Both 2016 and 1998 were strong El Nino years.
The 38 years in the satellite record, ranked from warmest to coolest (and ignoring statistical uncertainty) are:
RANK YEAR deg.C.
01 2016 +0.50
02 1998 +0.48
03 2010 +0.34
04 2015 +0.26
05 2002 +0.22
06 2005 +0.20
07 2003 +0.19
08 2014 +0.18
09 2007 +0.16
10 2013 +0.13
11 2001 +0.12
12 2006 +0.11
13 2009 +0.10
14 2004 +0.08
15 1995 +0.07
16 2012 +0.06
17 1987 +0.05
18 1988 +0.04
19 2011 +0.02
20 1991 +0.02
21 1990 +0.01
22 1997 -0.01
23 1996 -0.01
24 1999 -0.02
25 2000 -0.02
26 1983 -0.04
27 1980 -0.04
28 1994 -0.06
29 2008 -0.10
30 1981 -0.11
31 1993 -0.20
32 1989 -0.21
33 1979 -0.21
34 1986 -0.22
35 1984 -0.24
36 1992 -0.28
37 1982 -0.30
38 1985 -0.36
The global, hemispheric, and tropical LT anomalies from the 30-year (1981-2010) average for the last 24 months are:
YEAR MO GLOBE NHEM. SHEM. TROPICS
2015 01 +0.30 +0.44 +0.15 +0.13
2015 02 +0.19 +0.34 +0.04 -0.07
2015 03 +0.18 +0.28 +0.07 +0.04
2015 04 +0.09 +0.19 -0.01 +0.08
2015 05 +0.27 +0.34 +0.20 +0.27
2015 06 +0.31 +0.38 +0.25 +0.46
2015 07 +0.16 +0.29 +0.03 +0.48
2015 08 +0.25 +0.20 +0.30 +0.53
2015 09 +0.23 +0.30 +0.16 +0.55
2015 10 +0.41 +0.63 +0.20 +0.53
2015 11 +0.33 +0.44 +0.22 +0.52
2015 12 +0.45 +0.53 +0.37 +0.61
2016 01 +0.54 +0.69 +0.39 +0.84
2016 02 +0.83 +1.16 +0.50 +0.99
2016 03 +0.73 +0.94 +0.52 +1.09
2016 04 +0.71 +0.85 +0.58 +0.93
2016 05 +0.54 +0.65 +0.44 +0.71
2016 06 +0.34 +0.51 +0.17 +0.37
2016 07 +0.39 +0.48 +0.30 +0.48
2016 08 +0.43 +0.55 +0.32 +0.49
2016 09 +0.44 +0.49 +0.39 +0.37
2016 10 +0.41 +0.42 +0.39 +0.46
2016 11 +0.45 +0.41 +0.50 +0.37
2016 12 +0.24 +0.19 +0.30 +0.21
The UAH global image for December, 2016 (and annual image for 2016) should be available in the next several days here.
The new Version 6 files should be updated soon, and are located here:
Lower Troposphere: http://vortex.nsstc.uah.edu/data/msu/v6.0/tlt/uahncdc_lt_6.0.txt
Mid-Troposphere: http://vortex.nsstc.uah.edu/data/msu/v6.0/tmt/uahncdc_mt_6.0.txt
Tropopause: http://vortex.nsstc.uah.edu/data/msu/v6.0/ttp/uahncdc_tp_6.0.txt
Lower Stratosphere: http://vortex.nsstc.uah.edu/data/msu/v6.0/tls/uahncdc_ls_6.0.txt


Great site you’ve got here.. It’s hard to find excellent writing like yours these days.
I really appreciate individuals like you! Take care!!
Feel free to visit my page :: qu semana es
Every weekend i used to pay a visit this site, for the reason that i want enjoyment, as this this web site conations actually
pleasant funny stuff too.
Hello. Your article is great because it was very helpful to me. Hope you will make many friends like this.
Thank you very much author.