UAH Global Temperature Update for January, 2017: +0.30 deg. C

February 1st, 2017 by Roy W. Spencer, Ph. D.

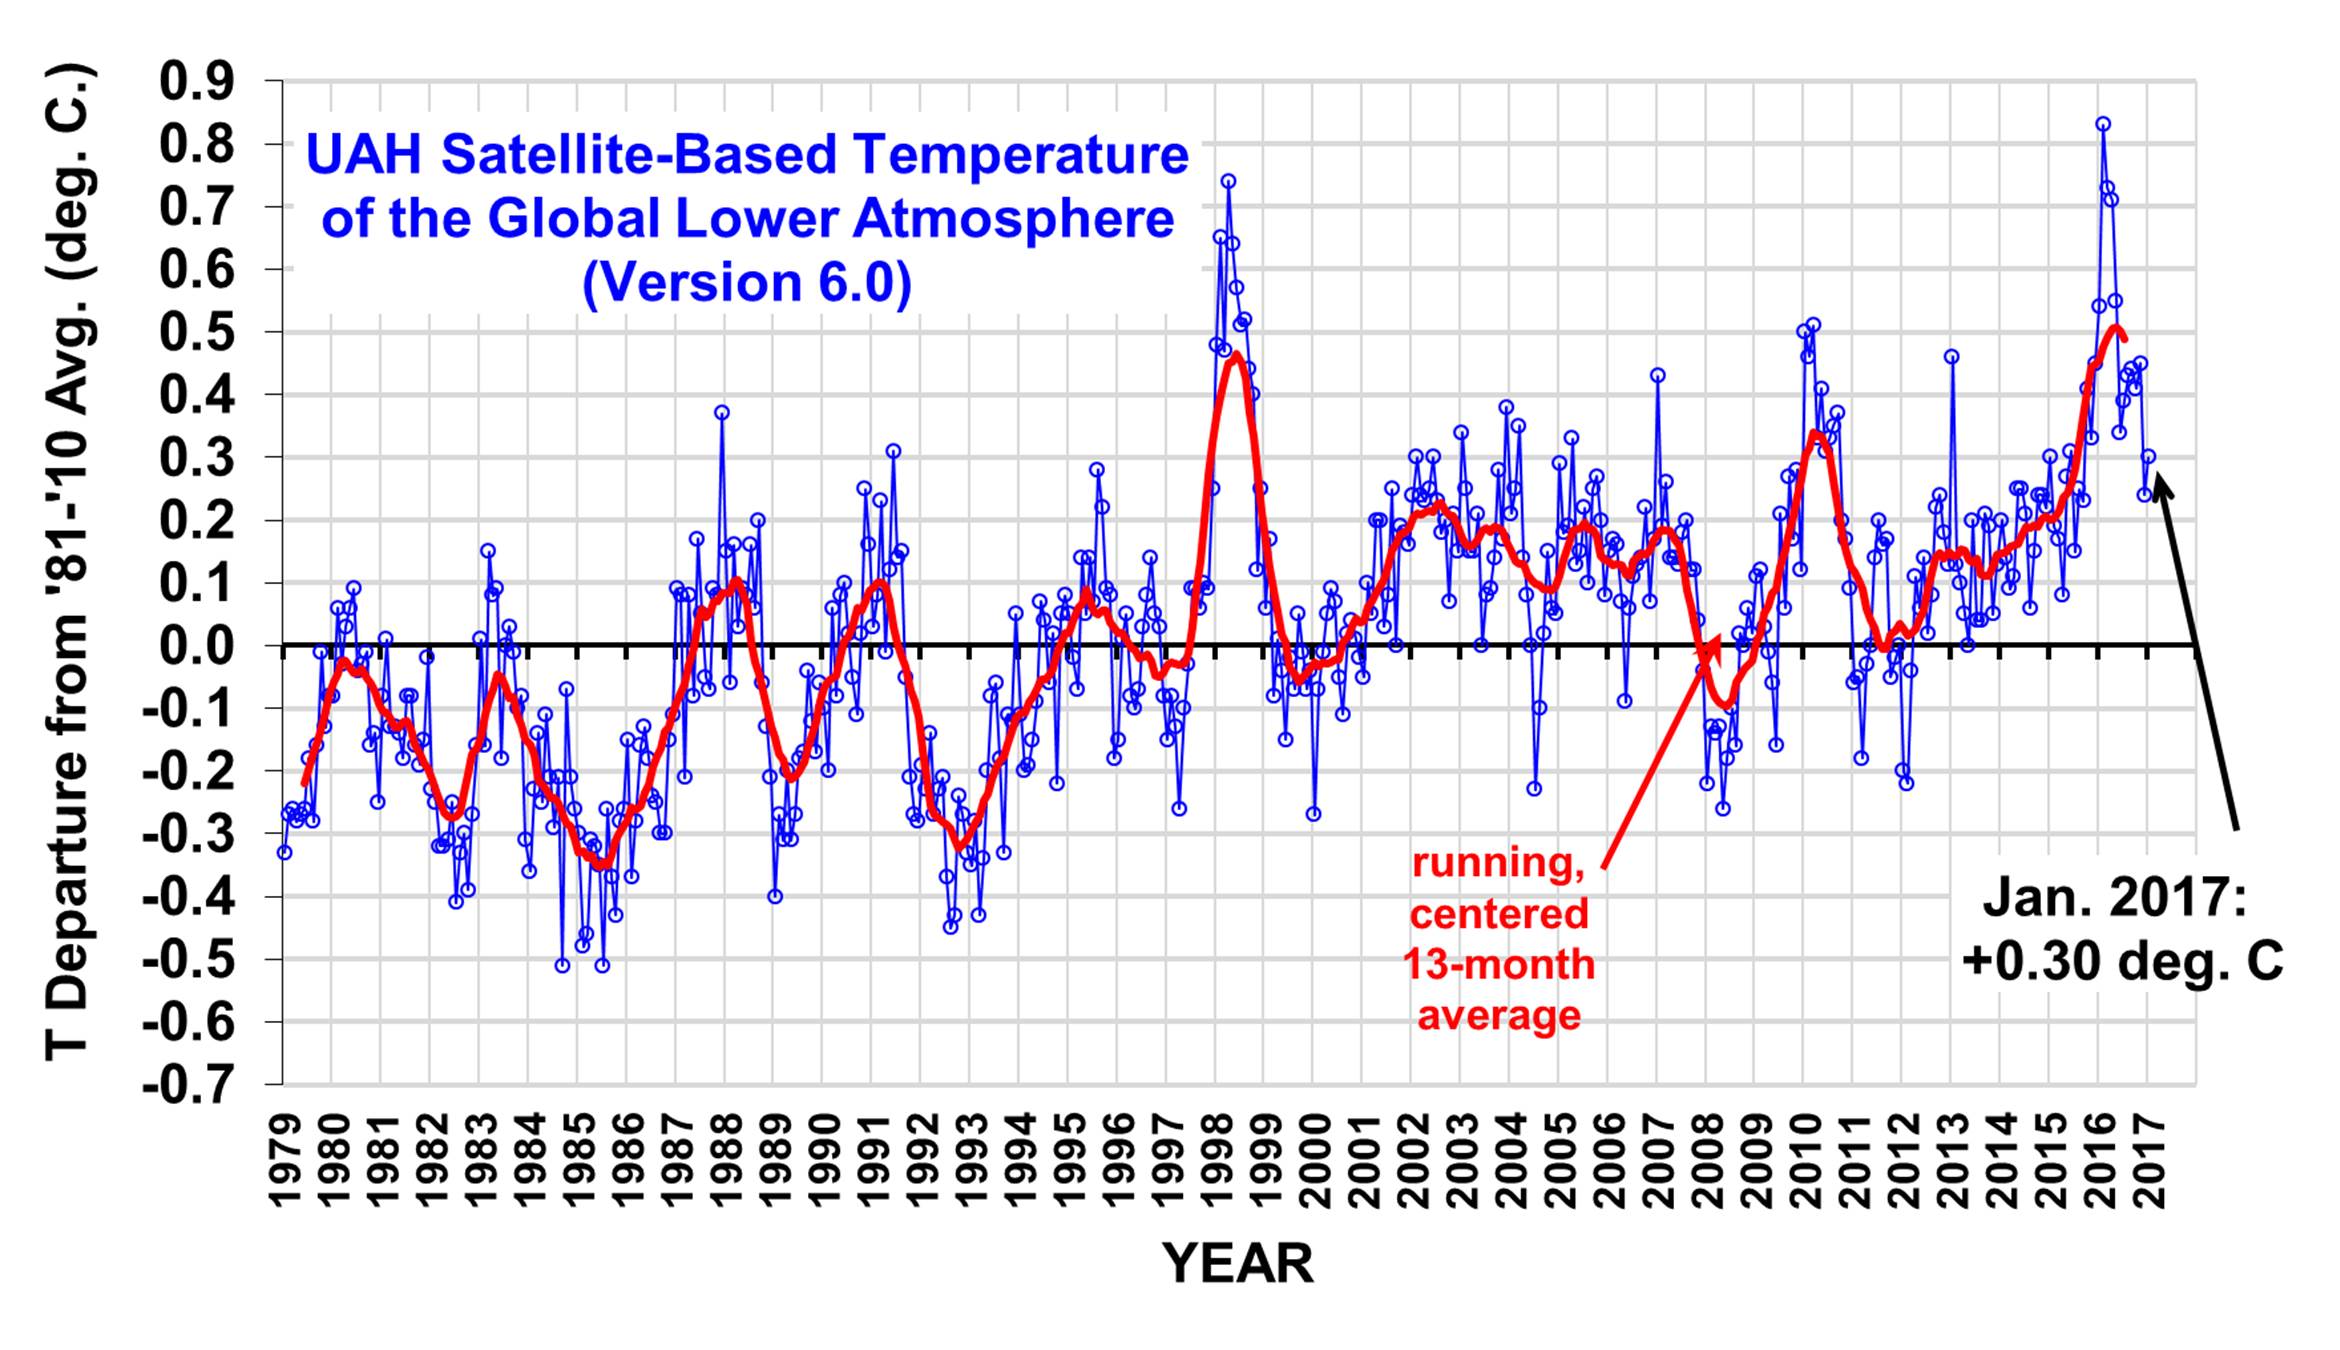
The Version 6.0 global average lower tropospheric temperature (LT) anomaly for January 2017 was +0.30 deg. C, up a little from the December value of +0.24 deg. C (click for full size version):

The global, hemispheric, and tropical LT anomalies from the 30-year (1981-2010) average for the last 25 months are:

YEAR MO GLOBE NHEM. SHEM. TROPICS
2015 01 +0.30 +0.44 +0.15 +0.13
2015 02 +0.19 +0.34 +0.04 -0.07
2015 03 +0.18 +0.28 +0.07 +0.04
2015 04 +0.09 +0.19 -0.01 +0.08
2015 05 +0.27 +0.34 +0.20 +0.27
2015 06 +0.31 +0.38 +0.25 +0.46
2015 07 +0.16 +0.29 +0.03 +0.48
2015 08 +0.25 +0.20 +0.30 +0.53
2015 09 +0.23 +0.30 +0.16 +0.55
2015 10 +0.41 +0.63 +0.20 +0.53
2015 11 +0.33 +0.44 +0.22 +0.52
2015 12 +0.45 +0.53 +0.37 +0.61
2016 01 +0.54 +0.69 +0.39 +0.84
2016 02 +0.83 +1.16 +0.50 +0.99
2016 03 +0.73 +0.94 +0.52 +1.09
2016 04 +0.71 +0.85 +0.58 +0.93
2016 05 +0.54 +0.65 +0.44 +0.71
2016 06 +0.34 +0.51 +0.17 +0.37
2016 07 +0.39 +0.48 +0.30 +0.48
2016 08 +0.43 +0.55 +0.32 +0.49
2016 09 +0.44 +0.49 +0.39 +0.37
2016 10 +0.41 +0.42 +0.39 +0.46
2016 11 +0.45 +0.40 +0.50 +0.37
2016 12 +0.24 +0.19 +0.30 +0.21
2017 01 +0.30 +0.27 +0.33 +0.07

The UAH LT global anomaly image for January, 2017 should be available in the next several days here.

The new Version 6 files should be updated soon, and are located here:

Lower Troposphere: http://vortex.nsstc.uah.edu/data/msu/v6.0/tlt/uahncdc_lt_6.0.txt
Mid-Troposphere: http://vortex.nsstc.uah.edu/data/msu/v6.0/tmt/uahncdc_mt_6.0.txt
Tropopause: http://vortex.nsstc.uah.edu/data/msu/v6.0/ttp/uahncdc_tp_6.0.txt
Lower Stratosphere: http://vortex.nsstc.uah.edu/data/msu/v6.0/tls/uahncdc_ls_6.0.txt


696 Responses to “UAH Global Temperature Update for January, 2017: +0.30 deg. C”

Toggle Trackbacks

  1. argus says:

    Round and round she goes, where she stops nobody knows. Dr Spencer’s on it this month, barely 8am.

    • Danny Braswell wrote and runs our new Version 6 code, more streamlined process now. Used to take three of us running separate codes sequentially.

      • Nate says:

        As a followup to your post on the temps in early January ‘The Frigid 48: U.S. Average Temperature 11 deg. F’ ,

        I noticed that for the month as a whole, the lower 48 was 3.5 F ABOVE average, according to NOAA.

  2. Preliminary surface global temperature anomaly estimates from UM CCI and WxBELL are up by 0.006C and 0.034C respectively from December to January. Last month the UM CCI estimate jumped up to match the WxBELL estimate after final daily estimates were posted and I expect this will likely happen again for January.

    I graphed the trends since 2014, including estimates from several other major sources:
    https://oz4caster.wordpress.com/2017/02/01/global-temperature-2017-january-preliminary/

    The above linked graph shows that the various global temperature estimates converged in early 2016 and then diverged considerably later in 2016. The convergence seems to be associated with the strong El Nino event that peaked in early 2016. It will be interesting to see what happens in 2017.

    • Nate says:

      I think it has to do with the fact that troposphere effect of el nino is amplified.

      Nice comparison of all data sets here: notice the much higher 1998 peak in UAH, RSS, which tends to obscure the underlying warming trends.

      https://bobtisdale.files.wordpress.com/2017/01/animation-1.gif

      • Gordon Robertson says:

        Nate…”which tends to obscure the underlying warming trends.”

        How many times does this have to be repeated? There has been no overall warming trend since 1998. The IPCC said so and so did UAH.

        The pre 1998 trend was in a negative anomaly range meaning it was a recovery from cooling. That is not a global warming trend.

        The only apparent warming was a 0.25C leap in 2001 that is still unexplained. Anthropogenic warming cannot act that quickly. A similar leap occurred in 1977 and it’s discovery lead to the discovery of the Pacific Decadal Oscillation.

        The oceans are playing havoc with global temperatures and Tsonis et al proved that. Tsonis wondered why we are so preoccupied with anthropogenic warming when the ocean oscillations are begging to be investigated. Their phase relationship has determined warming cooling over the past century.

        • barry says:

          How many times does this have to be repeated? There has been no overall warming trend since 1998. The IPCC said so

          The IPCC said that short-term trends (ie 1998-2012 in their latest report) do not reflect underlying trends. This accords with Nate’s statement which you quoted.

          UAH v6 trend from 1998 is positive at 0.04C/decade. The statistical uncertainty is larger.

          • Gordon Robertson says:

            barry…”The IPCC said that short-term trends (ie 1998-2012 in their latest report) do not reflect underlying trends”.

            Why do you keep talking around the fact they called the 15 year period from 1998 – 2012 a warming hiatus? That 15 years is now 18 years going on 20 years depending on how the 2016 EN flattens out.

            And what do you mean by trends underlying a flat trend? I have no argument against the fact that the planet has warmed less than 1 C since the 400 year Little Ice Age that ended in 1850.

            An 18 year hiatus suggests strongly the warming may have ended. Syun Akasofu has suggested a re-warming of 0.5C/century from the LIA and if he’s right we’re right on schedule.

          • barry says:

            They referred to the popular term ‘hiatus’ in the technical section, and also said what I have cited many times specially for you, which you always ‘talk around’.

            In addition to robust multi-decadal warming, global mean surface temperature exhibits substantial decadal and interannual variability (see Figure SPM.1). Due to natural variability, trends based on short records are very sensitive to the beginning and end dates and do not in general reflect long-term climate trends. As one example, the rate of warming over the past 15 years (19982012; 0.05 [0.05 to 0.15] C per decade), which begins with a strong El Nio, is smaller than the rate calculated since 1951 (19512012; 0.12 [0.08 to 0.14] C per decade).

            Summary for Policy Makers

            One day maybe you’ll acknowledge this part instead of selectively citing the AR5.

          • Crakar24 says:

            Barry its called summary for policy makers for a reason maybe some day you will acknowledge the significance of this

          • barry says:

            As the same comments also appear in the Chapter on observations, I’m not sure what your point is.

        • Nate says:

          Gordon,

          Look at the graphs from Bob Tisdale. Look especially at the three surface sets that have less variation than satellite data, due to enso. Do you, objectively, see a trend?

          • Gordon Robertson says:

            Nate…I have no interest in the graphs of Bob Tisdale. I looked at them and they are very course, lacking the detail of the UAH graph.

          • Nate says:

            Gordon,

            ‘Lacking detail’ . These sets are available in as much detail as you might want, such as monthly temps. But if you’re interested in the 20 y trends, that level of detail is not helpful.

            Just to be clear. You stated that ‘there has been no warming trend since 1998’. I asked you to look at data that, objectively, shows a warming trend. You’re response is ‘I have no interest in those graphs’.

        • David Appell says:

          Gordon Robertson says:
          “How many times does this have to be repeated? There has been no overall warming trend since 1998. The IPCC said so and so did UAH.”

          Please stop playing stupid. It makes you look like a fool.

          • So rotten-appell , NO WARMING in 18 years..AndyG55 says:

            “Please stop playing stupid. It makes you look like a fool”

            You don’t play STUPID.. you ARE STPID..

            and a brain-washed FOOL.. ALWAYS. !!

          • barry says:

            Creating multiple accounts – especially in order to harrass participants – is low and probably worth a banning.

  3. Crabby says:

    Now I only casually read Dr Roy because it seems much less alarmist than other sources (like the guardian). I did read something today that I’m curious about, claiming that the oceans show more proof of global warming than anything else. Is this something that Dr Roy tends to ignore? I am honestly not trying to come off snarky, I tend to be susceptible to alarmism of “we will be extinct in 30 years!” And I suppose I come here for reassurance that we hopefully won’t all be dead in 40 years.

    Sorry I know this is rambling from some random person with no science degree and just a casual reader. Just wondering why I never see ocean temperatures discussed!

    • Depends on what you mean by “ocean temperature”. There are sea surface temperatures (SST), which become part of the global-average surface temperature updates, and then there are deep-layer average ocean temperatures, sometimes called “ocean heat content” (but still based upon temperature measurements). The SST data have their own problems, due to changes in observation strategies over the years (buckets, ship-intake, buoys) and rather poor spatial sampling. The ocean heat content measurements are a much shorter record, using thousands of ARGO buoys that are globally distributed and now provide decent 3-month averages on a global basis. Bob Tisdale can comment in more detail. In any event, the satellite measurements of deep-layer atmospheric temperatures sould reflect what is going on with global-average surface temperature because they are convectively coupled together.

      • David Appell says:

        Roy W. Spencer, Ph. D. says:
        “The ocean heat content measurements are a much shorter record, using thousands of ARGO buoys that are globally distributed and now provide decent 3-month averages on a global basis. Bob Tisdale can comment in more detail.”

        I can comment in more detail – Bob Tisdale thinks, for some weird reason, that El Ninos are responsible for modern warming, a bizarre claim.

        Yes, ocean heat content is by far the best indicator of a planetary energy imbalance, since about 93% of the trapped infrared energy goes there.

        And ocean heat content has been increasing fast over the years:

        http://davidappell.blogspot.com/2017/01/ocean-heat-content-up-for-quarter-down.html

        These are the true measures of AGW, not the numbers here for the lower troposphere that depend on whether a moose calf in New Hampsire respired up to the vertial or down toward the ground.

    • John Hultquist says:

      Crabby says: “I tend to be susceptible to alarmism …

      I think I see the problem.
      My suggestion is to turn your computer and TV off.
      Then, drink a cup of hot chocolate, lean back and take a nap.

      Also, Crabby, when you write “the oceans show more proof of global warming than anything else” — you need to provide a link because I, and most folks, won’t respond to a vague notion (“hand waving”, some call it) such as this.
      Roy mentions Tisdale. Bob’s site is:
      https://bobtisdale.wordpress.com/

      • Crabby says:

        Thank you for the reply. I do spend more time looking up climate change effects than actual data and that is totally on me. I agree I should have posted a link but I was more in the moment saying something I glanced read in a TheGuardian article. I do apologize for posting here on a scientific website given I know nothing! My alarmism got the better of me sadly.

        • Gordon Robertson says:

          Crabby..,”I was more in the moment saying something I glanced read in a TheGuardian article”

          The Guardian used to be a paper with integrity but now it’s right up there with every other tabloid. Their coverage of climate science is uber-alarmist and abysmal.

          • David Appell says:

            Gordon Robertson says:
            “The Guardian used to be a paper with integrity but now its right up there with every other tabloid. Their coverage of climate science is uber-alarmist and abysmal.”

            Gordon is just like Trump — anyone that doesn’t agree with his extreme views is “failing” or “alarmist” or “abysmal.”

            As with Trump, it’s very easy to see through.

    • MarkB says:

      @Crabby, A couple of comments . . .

      1) You don’t identify the source of “oceans show more proof of global warming than anything else”, so one can only guess the context.

      a) One common argument is that the ocean heat content data does not show the so-called “hiatus” in the early part of this century, suggesting more of a redistribution of warming during that period rather than a meaningful pause.

      b) A second argument is that, since the oceans have much greater heat content and inertia, they are better indicator of global warming than the surface or troposphere indices. Dr Roger Pielke Sr, who most would consider on the “skeptical” side of the spectrum, advocates this position. Two issues with this are that there is significant uncertainty in such data prior to Argo deployment and the surface temperature is particularly relevant to humans because that’s where we live.

      c) Not really “ocean temperature”, but sea level rise is perhaps the most certain negative result of global warming. There is uncertainty in how quickly this will happen, largely hinging on the stability of the West Antarctic ice sheet.

      2) Re “I tend to be susceptible to alarmism of ‘we will be extinct in 30 years!'”, I don’t know of any credible science* that is suggesting human extinction** and certainly not in that time period. Global warming is a multi-generational issue which is, I think, why it is politically difficult.

      * In this context, I’m using the IPCC summary reports as the definition of “credible science”. I’m sure some here would disagree with that definition, but that’s not relevant to the argument, so save it.

      ** There is “credible science” to suggest that there will be (non human) species extinctions, perhaps on a very large scale, resulting from global warming over the coming centuries depending upon what we do.

      • Gordon Robertson says:

        MarkB…”the ocean heat content data does not show the so-called hiatus in the early part of this century…”

        Early part of the century??? The IPCC whom you claim to be ‘credible science’ has stated clearly that the 15 year period from 1998 – 2012 was a warming hiatus. UAH has shown the hiatus continuing till 2015. We are still waiting to see what happens to the 2016 EN to see if the hiatus continues to 20 years.

        • David Appell says:

          By now it’s clear that GR is simply lying about that data — all of it.

          Gordon, you’re becoming all the more easier to ignore.

          • Richard M says:

            Sorry David but you are the one in error. The trend from 1997-2017 for ENSO neutral months is only .01 C/Decade. IOW, completely flat. This means we are already at 20 years and counting with no warming. Your denial is hilarious.

          • barry says:

            ENSO neutral months account for 9 years worth of data from 1997. More than half the months have to be deleted.

            9 years of anomalies leaves the trend highly susceptible to other influences, and the uncertainty is very large.

            Can’t say warming, can’t say cooling, can’t say anything.

          • Richard M says:

            Barry, while half the data is lost the months are still spread out over 20 years. This is completely different than 9 years of data. Since ENSO is about the only short term, strong variation in the data there isn’t much else that could affect the temperature.

          • barry says:

            There are plenty of unknown factors that affect global temps on an inerannual basis (some knowns we could consider are aerosols, solar, clouds, vulcanism, ocean/atmosphere exchange beyond ENSO). There’s no such thing as a neutral year, and no need to assume that ENSO-neutral means nothing else is happening.

            There are other methods to remove ENSO influence that yield different results.

          • David Appell says:

            Richard M says:
            “The trend from 1997-2017 for ENSO neutral months is only .01 C/Decade.”

            Based on this, I simply don’t believe that:

            http://blogs.nicholas.duke.edu/thegreengrok/files/2013/03/201213-noaa.png

            Let’s see your data.

      • David Appell says:

        MarkB says:
        “2) Re I tend to be susceptible to alarmism of we will be extinct in 30 years!'”

        Me too. Very much so.

        Who do you see saying that?

    • barry says:

      If Crabby is trying to say that ocean heat content shows more evidence of global warming, here is the source.

      https://tinyurl.com/jbf2xco

      If he is trying to say that OHC is a better metric, that notion was made (semi)popular by AGW skeptic Roger Pielke Snr.

      “…the global average surface temperature trend has serious uncertainty and bias issues and is not the appropriate metric to use to assess global warming…

      This weblog presents a global warming litmus test which can be used over the next several years to compare with the IPCC projections; the question is

      What is the magnitude ocean heat storage changes each year?”

      https://tinyurl.com/hmajd8u

      I hope he has updated his view to look at longer-term rather than annual increase, as it is well-known OHC has annual variability unrelated to forcings.

      • barry says:

        Side note for regulars: attempting to post the above comment with the original URLs failed. When I converted them to ‘tinyurl’ web addresses, the post was admitted.

        If you’re having trouble posting and your post has links, convert them here…

        https://tinyurl.com/

        … and your post may go through.

      • Nate says:

        barry,

        The Pielke Litmus test is interesting. It seems to have been proposed in 2007.

        For those who have been constantly saying AGW is not falsifiable, Pielke seems to be proposing the continued rise of OHC as just that, a way to falsify AGW theory.

        Well, how do you think it came out? To me it looks like AGW passed the test. OHC has continued to rise at a high rate.

      • barry says:

        I think one has to squint quite narrowly, avoiding global sea ice, glaciers, ocean heat content and sea level and surface data sets to think that warming has not continued.

        It’s ‘global’ warming we’re talking about, not ‘trends in the lower troposphere’. Global is global.

  4. Tim Wells says:

    Roy. I wonder if you could point me in the direction of the lastest AMO oscillation graph. The last one I found shows figures for Sept last year, but a lot could have changed in three months. The Atlantic winds tend to keep the UK warm. Kindest regards Tim

  5. Crabby says:

    Oh wow thank you for the detailed reply. Had to slow read it a few times before I understood it but that does make sense. I suppose I tend to nitpick things and look for worst case scenarios in even the least “alarmist” news of climate change. Thanks again for the details!

  6. Werner Brozek says:

    Just to put this into perspective: 2016 beat 2015 by a statistically insignificant 0.02 C leaving 2016 and 2015 statistically tied for first place. 0.30 would rank it in fourth place if it stayed that way for the rest of 2017. Naturally it won’t. Being more than 0.1 below the 2016 average of 0.505, it will not be statistically tied for first place either.

    • Crabby says:

      Should 2017 be much lower or about as low as 0.30 C? Given how 1998 spike looked (I can barely understand graphs) it should be a lot lower than 0.50 C this year globally?

      • If I had to guess, I’d say 2017 should be around 0.20. But forecasting is difficult, especially of the future.

        • Dave says:

          … and for some, forecasting is even difficult of the past! 😉

        • Jon A says:

          Realizing this data focuses on global temperatures, is there any insight into regional variability, particularly the recent strong arctic temperature anomalies? This has been an area of popularity in the popular press recently. Any thoughts around reasons for these anomalies, and when they might return to more nomal readings?

          • mandrewa says:

            The big issue with talking about arctic temperature anomalies is that there are almost no measurements of arctic temperatures. UAH does not cover the arctic because their satellites do not go over the arctic.

            There are very few stations in the arctic where temperatures have been measured in the past or are being measured now. And the very few stations that are there are all on land.

            This means that for most of the region “measurements” of temperature are a crude guess.

            The climate models predict that the most dramatic changes in temperature should occur in the arctic and antarctic. But no one is even making current temperature measurements in most of the arctic let alone comparing them to the non-existent measurements from the past.

          • Gordon Robertson says:

            mandewa…”The climate models predict that the most dramatic changes in temperature should occur in the arctic and antarctic.”

            That proves what a load of pseudo-science they have programmed into them.

            The reasoning behind that is CO2 supposedly predominates in cold, dry air because the water vapour is lower. First they have to prove that CO2 has any effect at all never mind predominate. An 18 year global warming hiatus does not look to good for that theory.

          • barry says:

            UAH covers the Arctic region from N60 to N85. Anomalies and overall trend can be seen on this UAH page:

            https://tinyurl.com/jrx6wcn

            The October anomaly for the Arctic Ocean was 1C warmer than any other month in the record. So was the January anomaly. Annual temps for the Arctic ocean were 0.5C hotter than any previous year.

            (Crabby may be referring to news reports of particular days in the Arctic which were very warm – the anomalies are monthly averages)

          • mandrewa says:

            barry, thank you. You make a good point. The satellites do cover the great majority of the arctic.

            Technically the arctic is north of 66 degrees and 33 minutes latitude. That might seem like a small difference from 60 degrees latitude but if we assume a flat map then that 6 degree difference covers 36 percent of the area between 60 and 90 degrees. But this 36 percent is only an approximation, the real percent being smaller, because the actual map is spherical and not flat. Still good enough for a quick estimate.

            The point remains that NoPol column data in the UAH temperature table covers a larger area than the actual arctic.

            The five degrees of latitude between 85 and 90 that are not covered by the satellites are only about 5 percent of the area of the arctic.

            Scanning through the 60 to 90 degrees northern ocean data I find two months that really stand out for high temperatures. October 2016 at 2.61 degrees higher than reference and January 2016 at 2.33 degrees higher than reference. No other months are close to these two.

            The trend for 60 to 90 north ocean for the last 38 years is +0.27 degrees Celsius per decade.

          • barry says:

            The Arctic zone has a few different definitons, most commonly North of 66.33′.444″N and North of 60N.

            As Crabby’s comments are not specific it’s impossible to make direct comparisons. But the satellite record for the region corroborate reports of very warm surface temps there. Yes, the Arctic trend is higher than global in the satellite record.

          • mandrewa says:

            Jon, thinking about this further. The satellite data shows that the rise in temperature is disproportionately occurring in the arctic and nearby regions.

            Thus for 60 to 85 degrees latitude north there is a trend of +0.24 degrees Celsius per decade for the last 38 years.

            While for 60 to 85 degrees latitude south there is a trend of -0.00 degrees Celsius per decade for the last 38 years.

            What a huge difference between what is happening in the north and the south!

            Meanwhile for the tropics, from 20 degrees north to 20 degrees south, the trend is +0.12 degrees Celsius per decade, or less than half the change occurring in the north.

            Perhaps you already knew this.

            Going through the climate model logic there are good reasons why they predict more warming in the arctic and antarctic than in the tropics.

            But the climate models are being contradicted by the data. Not only is the lack of warming in the antarctic a huge problem for these models but the rate of warming in the arctic is far short of what was predicted.

            I would speculate that as the area of ice covered ocean in the arctic shrinks more energy is absorbed by arctic ocean and this is part of what is warming the region overall.

            While on the other hand as the area of ice covered ocean in the antarctic expands less energy is absorbed by the ocean around the antarctic and this explains a good part of why the antarctic is not warming.

          • barry says:

            A small signal in the Antarctic is not such a big problem. The IPCC 2nd Assessment Report stated that under greenhouse warming there would be by 2100:

            a minimum warming around Antarctica and in the northern North Atlantic which is associated with deep oceanic mixing in those areas

            and

            maximum warming in high northern latitudes in late autumn and winter associated with reduced sea ice and snow cover

            There has actually been cooling in the Northern Atlantic over the 20th century, and a small warming for Antarctica since 1979.

            But one has to be specific about these things. What was the IPCC projection for Antarctica? How long was the projection? What was the rate of warming projected for Arctic, for which period, and how does it disagree with projections?

            Period of projection matters, because one can’t assume that rates of change will be linear (can’t assume a 25-year trend will be the same after 100 years).

          • mandrewa says:

            barry, this is kind of a side note. But I’m curious about your reaction. So I went to look up the IPCC 2nd assessment that you mentioned. First thing I find is, https://www.ipcc.ch/pdf/climate-changes-1995/ipcc-2nd-assessment/2nd-assessment-en.pdf .

            That seems right. It’s at the IPCC website. And it’s called the “2nd Assessment”. But when I download it, it’s not really the assessment. It’s the ‘summary’ of the assessment.

            Does that bother you? It would bother me if I had been a contributor.

            The real IPCC 1995 report is 52 or so chapters long. With each chapter having a working group of scientists responsible for it. The names of the authors and contributors and the titles of the chapters appear as an appendix to the summary. I’m sure those authors and contributors worked quite hard to try to accurately represent the state of the science or at least the majority opinion in each of their areas.

            From the way the ‘summary’ is organized one would think this long list of authors and contributors had written it or had at least reviewed the summary before it was published. But that wasn’t the case, was it.

            Getting back to responding more directly to what you commented. I think the subject is climate models, not the IPCC assessments. If you know of a climate model that in this approximate time frame was predicting approximately what we are seeing now, especially the part about little or no change in the antarctic but concentrated warming in the arctic, please name it.

            There are a lot of models. It’s my understanding that for most of them what has been observed is over a standard deviation from what they predicted. But for some it’s still within that standard deviation even though it’s at the lower edge.

          • barry says:

            Well I’m confused, then mandrewa. You described briefly some problems with the projections of models for the poles. I went to a primary source of information for this, choosing to go back more than 20 years so we could look at what they were saying then. Surely we can’t use projections from the last report of 3 years ago.

            Maybe it would be better if you cited some work. The IPCC is a summary of the then current modeling, amongst many other things.

            Where are you getting your information from on modeling and the poles?

          • mandrewa says:

            I’m sorry, Barry. I should look this up myself.

            The question I asked was:

            “If you know of a climate model that in this approximate time frame was predicting approximately what we are seeing now, especially the part about little or no change in the antarctic but concentrated warming in the arctic, please name it.”

            The “approximate time frame” I meant was ideally from before the last 39 years of UAH data. But I also meant to be generous and allow anything that predicted ahead of time what we have seen even if it was already half way through this time period, like say from 20 years ago.

            If you stand back a moment, it’s odd, that we don’t already know the answer to this question without having to look for it. And that’s true for both of us. Clearly you are deeply into this topic; your name appears all over these comments. And yet you don’t have on the tip of your tongue some climate model that’s your favorite.

          • barry says:

            mandrewa, the Third Assessment report (2001) has easy to view anomaly maps of warming at different latitudes for a variety of periods. As you can see from the maps, near-term projections show a minimal warming in the Antarctic, while enhanced warming in the Arctic. Based on modeling.

            https://www.ipcc.ch/publications_and_data/ar4/wg1/en/spmsspm-projections-of.html

            Does this respond to your question?

            There was little to no modeling done prior to the satellite period, but the minimal warming Antarctic, maximum warming Arctic was the quote I found in IPCC 1995 report (based on models) that seemed to speak to your queries

            Favourite model? I have none. They are tools for investigating stuff, each with their own strengths and limitations.

            (I don’t have this stuff ‘at my fingertips’. I have checked out more topics on the general subject than I remember. But I know where to look – which is most often a second or third, fourth look etc – for a given topic)

          • barry says:

            Checked the very first assessment report of the IPCC (1990), and this is the quote:

            Models predict that surface air will warm faster over land than over oceans, and a minimum of warming will occur around Antarctica and in the northern North Atlantic region…

            Seems IPCC expected Antarctica to warm more slowly from the beginning.

          • barry says:

            mandrewa, by the way, you can get the full reports for each IPCC assessment since 1990 from here:

            https://www.ipcc.ch/publications_and_data/publications_and_data_reports.shtml

          • barry says:

            mandrewa, I see where you got your IPCC link from – it’s the fourth one along in the 1995 2nd assessment report, which summarizes the three working groups at the links to the left of it. Those 3 working groups contain the large number of chapters. For the question you’re asking, you’ll want the first link, which is to working group 1 – the science basis. That document is 10 times larger than the summary assessment.

            https://www.ipcc.ch/publications_and_data/publications_and_data_reports.shtml

        • David Appell says:

          Gordon Robertson says:
          “mandewaThe climate models predict that the most dramatic changes in temperature should occur in the arctic and antarctic.
          That proves what a load of pseudo-science they have programmed into them.
          The reasoning behind that is CO2 supposedly predominates in cold, dry air because the water vapour is lower.”

          No — Arctic amplification is expected for any type of warming, because of the ice-albedo feedback. It has nothing to do with CO2.

  7. Norman says:

    Two years and the global temperature is exactly the same. No net change.

    I like your global numbers of around 0.3 C warming as they seem to make more sense with equilibrium of radiant energy that is actually reaching the surface.

    David Appell kindly informed me that the forcing Climate scientists talk about is forcing at the Tropopause. Because of its very cold temperatures a 3.7 W/m^2 increase in radiant energy would warm this part of the atmosphere by 1.2 C.

    I still have not been able to find out how a slight increase in temperature in a very cold region (Tropopause) would raise the surface temperature. The logic should be that the only way the surface will warm based upon the energy it receives and at surface temperatures you need a lot more W/m^2 to raise the surface by 1 C.

    GISS data shows much more warming than your graphs but your information seems more scientifically based.

  8. Steven Fraser says:

    The number that is stunning to me is the one for the tropics.. it’s now dropped a whole degree since March of ’16, to a level not seen since April of 2015.

    • Ron Clutz says:

      Steven, that struck me also. Comparing Roy’s table above with HadSST3 for the last two years, we see the same thing: dramatic warming and cooling in the tropics, additional warming in NH. Even Jan. 2015 and 2017 are the same 0.30, it is only the SH keeping it that high. Here is the HadSST3 graph:

      https://rclutz.wordpress.com/2017/01/20/oceans-make-2015-2016-climate/

      • Steven Fraser says:

        Ron, thanks for your reply and thoughts. This is my first time to watch an El Nio decay, and I am not sure what the pattern of heat dissipation should look like. My guess is that the heat works its way to the upper latitudes, moisture-laden like the storms that just finished in California, and then progresses off the NE coast to funnel up past Greenland (dropping mondo snow) and then off to higher latitudes to radiate into space.

        Watching, and learning.

    • barry says:

      A 1 C drop in temps in the tropics, especially after an el Nino, is normal. It’s taken 10 months for that to happen since March 2016.

      Check out the data. 2010, for example. 1C drop in the tropics in 6 months. 1.3 in eight.

      http://tinyurl.com/jrx6wcn

      Be thorough, see if I’m making it up.

  9. James Perry says:

    As a lay person,I look for information about things I see popularly reported that concern me like 2016 is the third year in a row for record temperatures.I am not sure what the +.3C anomaly represents.I hate to ask,but will you enlighten me?

  10. Lubos Motl says:

    Great that those of you who live globally are still enjoying some leftovers of global warming. Meanwhile, Prague has seen the coldest January since 1940. Click my name for details. Switzerland and many other countries had the coldest January in 30 years etc., you may find those things via Google News.

    • Gordon Robertson says:

      Lubos…”Meanwhile, Prague has seen the coldest January since 1940″.

      Hey Lubos. Vancouver and local region on the Southwest coast of Canada had the coldest December on record. That continued into January for 2 weeks and although it has moderated it’s still uncommonly chilly outside at night.

      • Lou Maytrees says:

        “Vancouver … had the coldest December on record.” LOL. Well if you consider only records back to 2009 that would be true. December 2008 had same tied lowest Dec temp as 2016. December 1993 was colder and that Dec does not come close to the coldest Vancouver December on record.

        • Gordon Robertson says:

          Lou Matrees…”December 1993 was colder and that Dec does not come close to the coldest Vancouver December on record”.

          You can take your argument up with Environment Canada, they were the ones who declared December 2016 as the coldest December in the Vancouver area history.

          Having lived here most of my life, I concur. It was brutal with the moisture-laden air.

          I played soccer most of my life and my criterion is not scientific but notable. I am going on the number of times soccer games were canceled during my career in December due to frozen and/or snow-covered ground. I could count one week periods on one hand but never an entire month.

          The sub-zero temperatures in the Vancouver area extended to mid-January from the beginning of December. That is unheard of in our area. We only get sub-zero temps when Arctic air descends upon us and that seldom extends longer than 2 weeks.

    • barry says:

      We’ve had heatwaves in Sydney. Stupidly warm nights which are hard to sleep in. Please borrow some of the energy and warm yourselves up North.

      • Gordon Robertson says:

        barry…”Weve had heatwaves in Sydney”.

        The record for heatwaves in North America occurred in the 1930’s.

        I am tempted to come down to Sydney and have a go at you over a pint of Foster’s lager.

        When I lived in New Zealand back in the 1970’s I had an Aussie mate I worked with. The language between us was often acerbic, with lots of blue air, but it was all in good fun.

        I seriously doubt that he’d have been a climate alarmist.

      • barry says:

        Come on down, Gordon. I’ve a touch of the blue in person.

    • David Appell says:

      Prague is a very tiny fraction of the globe, and not very relevant to warming of the globe.

  11. Kevin White says:

    It’s amazing what a freefall from last January this marks, it will be absolutely priceless to see how alarmists react at how much colder 2017 turns out to be than either of the two preceding years. Given how deranged leftists already are I don’t know they have any minds left to lose.

    • Lewis says:

      Kevin,
      Since the purpose of the alarmists is to alarm, you should expect something similar to this.

      2017 was the ‘x’ hottest year on record. Since ‘x’ (year) ‘n’ years have been hotter than…. etc.

      There will be no reference to 2017 being cooler than the immediately preceding years. That would invoke negative press about the hockey stick predictions and CO2 being a ‘bad’ thing.

      In all, not to worry. The alarmist will try to alarm. They’ve got money and control involved.

    • barry says:

      Temperatures decay after an el Nino. This should not be a surprise to anyone, though it appears some skeptics are excited about it.

      • Gordon Robertson says:

        barry…”Temperatures decay after an el Nino. This should not be a surprise to anyone, though it appears some skeptics are excited about it”.

        What we’re excited about is the prospect of 20 years with no warming.

      • barry says:

        Oh, clearly, You want that trend line to flatten again.

        What do you make of the fact that in the same period ocean heat content has risen fairly steadily, global sea ice has diminished, mass balance of global glaciers has diminished and sea level has risen?

        If global warming is truly global, do you account for these factors or ignore them as inconvenient to the notion of ‘no warming since x’?

        • Richard M says:

          The trend for ENSO neutral months over the past 20 years is already essentially zero.

          OHC is based on manipulated Argo data (removing buoys that show cooling). I suspect that will get fixed very soon.

          • David Appell says:

            Richard M says:
            “OHC is based on manipulated Argo data (removing buoys that show cooling). I suspect that will get fixed very soon.”

            Ah, when the science doesn’t go your way, just claim the data are wrong. Problem solved every time!

        • barry says:

          Not sure what ENSO neutral months has to do with it. ENSO is not the only source of variability. Still, it’d be good to see a reference or something for the claim.

          OHC not warming? Then you’ll need to explain why sea level has risen if not from thermal expanson. Melting glaciers running into the sea?

        • barry says:

          I’d like to know how you worked this out. Did you offset by a few months from ENSO indices, as lower trop records the effects a few months later?

          Which indices?

    • Snape says:

      Kevin:

      Last January’s anomaly, influenced by a strong El Nino, was +0.54 C. This January’s anomaly, influenced by La Nina conditions, was +0.30 C.

      This is what you consider an amazing freefall? Amazing.

  12. AaronS says:

    http://www.eldersweather.com.au/climimage.jsp?i=nino34

    Is La Nina already weakening?

    Also curious if anyone knows if the Nino 3.4data has been manipulated in the last decade? Im curious if this is the same data measurements and integration method I used 5 yrs ago? This looks like a weak la nina.

    • Snape says:

      Nino region 3.4 is currently – .4 C This is considered neutral. Oddly, region 1+2 is now +2.0 C.

      • Snape says:

        It should be noted that La Nina conditions need to be present for at least 5 consecutive months before it’s considered a true La Nina I don’t think we’ve seen that since 2012.

      • barry says:

        ENSO Metrics are slightly different depending on which monitoring institute.

        NOAA Nina metric is 5 consecutive 3-months running means of less than -0.5C anomaly for the NINO3.4 region.

        http://www.cpc.ncep.noaa.gov/products/analysis_monitoring/ensostuff/ensoyears.shtml

        November and December were 0.93C and 0.72C respectively. NOAA Calling la Nina is practically a dead cert when the January anomaly comes in.

        JMA uses the NINO3 region with a higher bar on the temporal provisions.

        “JMA defines that the El Nio (La Nia) is such that the five-month running mean SST deviation for NINO.3 continues +0.5C (-0.5C) or higher (lower) for six consecutive months or longer.”

        http://ds.data.jma.go.jp/tcc/tcc/products/elnino/elmonout.html#table

        Their reports are confusing, because while they do not yet have a full blown la Nina by their metric, they have been saying ‘la Nina conditions are present’ for months, and their most recent outlook mentions a current la Nina ‘event’.

        The Australian Bureau of Meteorology has a stricter threshold of -0.8C for the NINO3.4 region, and does not (to my knowledge) specify how many months, just ‘sustained.’

        http://www.bom.gov.au/climate/updates/articles/a020.shtml

        NOAA’s alternative index, the Multivariate ENSO index combines 6 different metrics, like surface pressure, wind direction and speed as well as temperatures to derive its index. La Nina conditions have not been present under that index.

        https://www.esrl.noaa.gov/psd/enso/mei/table.html

        (Values 1 and greater indicate el Nino conditions, values -1 and less, la Nina)

        The MEI index has two forms. Here is the other.

        https://www.esrl.noaa.gov/psd/enso/mei/rank.html

      • Steven Fraser says:

        And the Anchovie fishermen have their own criteria.

    • AaronS says:

      Thanks. Yea by any measure 2016 appears to be a weak la nina compared to 97 98 equivalent. Have the actual DATA measurements or processing changed since 2002? Was this data part of the GISS updates? In other words are we comparing apples to apples with past ENSO.

  13. Ken Stewart says:

    Dr Spencer, would it be possible for you to add dataseries for Temperate regions i.e. 20 – 60 degrees N&S. I have calculated estimates for these derived from polar and extra-tropical data. This shows the north temperate land region has zero trend from February 1998 to December 2016. It would be good to have the ‘real’ data rather than relying on estimates for parts of the world that have the bulk of population, agriculture , industry, and emissions. Extra tropical data includes polar as well.

  14. JPZippi says:

    O.3C above the Global average (somewhere between 0.5F and 0.6F)? When natural climate variability is 120F over an entire year in any given year, why does it not matter that we don’t have “on-time” measuring across the globe on a 24-hour basis?

    Too focused on CO2 warming I think.

    • barry says:

      Natural weather variability is that much in specific locations, but global variations are 10 times less.

      As it stands, the satellite record has 97% coverage of the globe, but values are derived from swathes at any moment rather than the whole globe continuously.

      I’m sure researchers would love to get the funding for a more comprehensive monitoring system, but to establish what you’re asking for would cost an enormous amount of money. Somehow I think that US research centers will not be getting the funding for such mammoth projects any time soon.

      • Gordon Robertson says:

        barry…”the satellite record has 97% coverage of the globe, but values are derived from swathes at any moment rather than the whole globe continuously”.

        Those swaths of coverage involved bazillions of oxygen molecule that give a far more accurate average temperature measurement in a region than thermometers spaced up to 1200 miles apart and with hardly any covering the 70% of the surface covered by oceans.

      • barry says:

        Would you also endorse spending gazillions on a more comprehensive surface monitoring system, as Zippi seems to think is a good idea?

        The satellites don’t measure temperature and your claim about their accuracy is pure assertion. Of all the well-known data sets, UAH has had the largest adjustments, indicating some serious challenges.

        • David Appell says:

          I’ve heard it claimed that only 50-100 surface stations are needed to get a usable measure of global mean temperature.

        • barry says:

          I’ve read that, too. Done by sub-sampling over and again and coming up with a minimum number of well-spread stations that give the same answers as the larger set regardless of which subset.

  15. JPZippi says:

    With a middle latitude variance of 120F in any given year and a daily variance of 10F to even 30F at any given point and at any given time, I don’t see how they can accurately depict past variability let alone current variability. Temperature moves up and down and all around. I can’t ever see NOAA, NASA, or even Dr. Roy getting it right within a +/- 0.3C variability factor.

    Does NASA/NOAA still hold to their accuracy of +/- 0.3C as stated in their anomalous values qualifier?

  16. Vincent says:

    I’m also puzzled as to how it is possible to get a meaningfully accurate global temperature considering the huge variability of temperatures over the entire surface of the earth, including the surface of the oceans, and the huge variability in temperatures according to the height of the atmosphere where temperatures are measured and the depth of the oceans where temperatures are measured.

    The Urban Heat Island effect is just one problem that has been given some publicity recently. There must be many more.

    I can’t help wondering how much variation in average temperatures I would get using just one thermometer in the very small area (by global standards) of my house, placing the thermometer in different locations in my house.

    Even assuming my house was not exposed to artificial heating and cooling through the presence of air-conditioners, fridges, stoves and fires etc, I imagine the average temperature would vary significantly depending on the position of the thermometer in the house.

    For example, a thermometer placed near a window which was exposed to direct sunlight for a certain period on many days, would give a significantly higher average reading over a period of a year than a thermometer placed in the middle of a room, or a thermometer placed under the bed.

    The surface of the earth and oceans, and the depth of the oceans and the height of the atmosphere, cover an immense area and volume which is constantly in motion transferring heat in all directions.

    How on earth is it possible to get an accurate, average global temperature?

    • MarkB says:

      This is one reason why anomaly values are used. The analogy is not a thermometer placed in different locations in the same house, rather, it is the offset in value of a particular thermometer relative to its own history.

      To get a household anomaly one would average the offsets (anomolies) of a number of thermometers distributed throughout the house, but each is baselined against its own history.

    • Tom Dayton says:

      Nick Stokes wrote a post about errors of measurement: https://moyhu.blogspot.com/2017/01/global-anomaly-spatial-sampling-error.html

    • Tom Dayton says:

      Scott Johnson wrote an excellent post on how temperature indices are created: https://arstechnica.com/science/2016/01/thorough-not-thoroughly-fabricated-the-truth-about-global-temperature-data/

    • Snape says:

      To Vincent:

      Placing a few thermometers around you’re house would give a good ballpark estimate of your homes average temperature. These household “temperature stations” could be used as a reference to detect future warming or cooling. The exact temperature of your house is not what we’re interested in. What’s of interest are how the readings of these stations change over time.

      • Norman says:

        Snape

        Good point on the thermometers around Vincent’s house. With the thermometers you could tell if the house was warming, cooling or staying the same temperature.

        If Vincent wanted to see a view similar to a satellite view of his house he could set up a FLIR camera and monitor the IR energy leaving the house (unless he had perfect insulation). The FLIR could determine if the house was warming or cooling based upon the amount of IR detected leaving the house.

    • FRANCK says:

      Good evening Vincent,
      We are going to present two of them here, and comment on them.

      Calculation of average temperature

      *Thermal mean

      All bodies, whatever their state (solid, liquid or gas) emit electromagnetic radiation, which
      travels in a straight line at the speed of light and is made up of rays.
      The Stefan-Boltzmann law enables us to link the luminosity emitted by a black body with a surface area.

      By definition, a black body absorbs all the radiation it receives. However, the Earth is not a black body, because some of the Suns
      rays are reflected by the oceans and ice sheets, and also by land masses.
      It is impossible to use this method to determine global temperature.

      *Thermodynamic mean

      As we explained earlier, temperature is a representation of the oscillation of molecules. It is possible to use statistical models to find a correlation between temperature and energy.
      The difference between the two is that temperature isan intensive variable, while energy is an extensive variable.
      This means it is possible to add the energies together and obtain an average.
      The difficulty is in taking account of the many relations that make it possible to link temperature and energy, which vary depending on the system being studied (solid,liquid or gas).
      Although it is possible to make an energy assessment of the planet and determine an average energy, it is, by contrast, impossible to
      reach a temperature value without making an aberrant hypothesis:
      “Earth is an ideal gas”.

      Cordially,

      • FRANCK says:

        Oversight
        As we explained earlier.
        A system comprises particles (atoms, molecules and ions) which are in perpetual motion (chaotic motion in the case of fluids and gases;
        oscillations around a point of equilibrium in the case of a crystal lattice).
        Temperature is a macroscopic measurement of the molecular agitation of the system. It represents the average energy of a molecule.
        The higher the temperature, the greater an atoms oscillations around its average position. But this definition is not quantitative.
        Sorry sorry for forgetting.
        Cordially

        • David Appell says:

          FRANCK says:
          “The higher the temperature, the greater an atoms oscillations around its average position.”

          No. The temperature of a gas is proportional to the average kinetic energy of its molecules. For an ideal gas

          kT = (2/3)*

          http://hyperphysics.phy-astr.gsu.edu/hbase/Kinetic/kintem.html

          Air molecules or atoms don’t “oscillate around an average position,” they travel until they collide with another molecule or atom.

          Greenhouse warming is, of course, different than this.

          • David Appell says:

            Hmm, the browsers stripped out part of my equation because it was in “”, representing an average. It should have been

            kT = (2/3)*(average kinetic energy of a gas molecule)

            Same conclusion applies.

      • Gordon Robertson says:

        Frank…”temperature is a representation of the oscillation of molecules. It is possible to use statistical models to find a correlation between temperature and energy.
        The difference between the two is that temperature isan intensive variable, while energy is an extensive variable.
        This means it is possible to add the energies together and obtain an average”.

        Temperature is a man-made scale that measures relative levels of thermal energy. Thermal energy is the average kinetic energy of ‘atoms’, not molecules. Do you understand the difference between an atom and a molecule?

        When you talk about a correlation between temperature and energy, which energy are you talking about? There is a definite correlation between temperature and thermal energy because s temperature device is averaging the kinetic energy of atoms, which is heat.

        If you are inferring there is a correlation between temperature and electromagnetic energy, you are being incredibly general. EM traveling through space has no thermal energy associated with it whatsoever. Heat is not a property of EM.

        Temperature is not energy, it is a measure of thermal energy. You cannot add thermal energy and electromagnetic energy. They have far different properties.

        Some alarmists are claiming infrared energy radiated from GHGs can be added to solar energy which is a direct contravention of the 2nd law of thermodynamics and suggests perpetual motion.

        • David Appell says:

          “Some alarmists are claiming infrared energy radiated from GHGs can be added to solar energy which is a direct contravention of the 2nd law of thermodynamics and suggests perpetual motion.”

          Back to that myth, are we?

          The atmosphere or surface are not closed systems. So they are consistent with the Second Law.

          • Greven says:

            They don’t seem to get that the lower atmosphere can warm as the higher atmosphere cools due to heat retention increasing at lower altitudes.

    • Tom Dayton says:

      Vincent, you can compute global mean temperature yourself! Instructions and examples: http://variable-variability.blogspot.com/2017/01/some-programing-skills-compute-global-temperatures.html

  17. Elephant in the Room says:

    Temperatures rise during an El Nino, which is to be expected. Alarmists sure got excited about it last year.

    • Elephant in the Room says:

      That was supposed to be a reply to Barry brushing off temperatures seeming to be on the path to pre 2015 levels.

    • barry says:

      Maybe you should be addressing excitable alarmists with your concerns. I’ve followed the rise and decay of the el Nino with some interest – mainly because of predictions about it. Didn’t matter to me if it was the biggest el Nino or resulted in the warmest year.

      • Elephant in the Room says:

        Okay, that’s fair.

        Sorry, I just find myself frustrated after seeing how people reacted to the peak last February, as if El Nino was the lesser player in temps reaching the levels they did.

        Granted, the record nature of it was due to the underlying trend. You and I would probably disagree on how strong that underlying trend is, but that is beside the point.

        I recall Gavin Schmidt claiming on Twitter last Feb that El Nino was responsible for only .07C of the warmth, but now MET Office claims that it was responsible for .2C, significantly more than Gavin and other alarmist’s original estimates. In other words, according to the MET Office, without El Nino temps for 2015 and 2016 would have been basically the same as 2014, which really wasn’t all that spectacular.

        So, if you truly did not have the same reaction as those that I stated above, then I apologize for lumping you with them.

        I agree that this past El Nino was interesting. What is even more interesting is that there are predictions of us having another one THIS YEAR. Though I guess it is expected to be more of a Midoki than a traditional El Nino.

        • Gordon Robertson says:

          elephant…”I recall Gavin Schmidt claiming on Twitter last Feb that El Nino was responsible for only .07C of the warmth..”

          Schmidt is a mathematician who programs climate models. He is also an uber-alarmist. If your interest is solid, observable science it’s safe to ignore Schmidt. Richard Lindzen studies the real atmosphere and has published over 200 papers in a 40+ year career. He is a skeptic.

          Right here at UAH, you have Roy with a degree in meteorology and John Christy with a degree in climate science. Why listen to a mathematician?

          • David Appell says:

            Gordon Robertson says:
            “Right here at UAH, you have Roy with a degree in meteorology and John Christy with a degree in climate science. Why listen to a mathematician?”

            What makes you think a mathematician can’t learn climate science?

            Edward Witten majored in history, minored in linguistics. Yet he won a Fields metal in mathemstics and has long been the premier theoretical physicist in the world.

            Have you watched any of Schmidt’s lectures on YouTube?

            He knows a whole more about climatology — and about mathemetics — than you do, GR.

            You’re only focusing on his degree because you can’t disprove his science.

        • barry says:

          Elephant, do you have cites for the different contributions to 2016 temps from el Nino? While differences of opinion is to be expected, I just want to see if the different values were based on the same metrics – apples to apples. I’ve read Schmidt saying that el Nino added 0.05 or 0.07 above 2015 temps, and am not sure that the Met Office value refers its value to 2015 also. Schmidt said that el Nino added 0.12 to 2015 temps, and 2016 added 0.05 above that. Dunno if it’s right or not to add them up to get the full figure for 2016 (1.7C), which is why the cites would be helpful.

        • barry says:

          Oops, decimal point in the wrong place. 0.17, of course.

      • Nate says:

        Elephant,

        I think the large El Nino should be considered, not disregarded, when judging if the warm year was significant.

        Similarly the two strong La Ninas during the last 10 y should be considered, and not disregarded, when trying to determine if there was an actual ‘hiatis’.

        If we are entering an El Nino heavy period than i would expect the trend to increase, just as it was high in the 80s and 90s.

        • Elephant in the Room says:

          Thanks for the comment, Nate.

          I actually do agree with that. We very well could be becoming more El Nino heavy, though it is a little early to say that for sure.

          If this does become the case, I think it will actually help mine and Dr. Spencer’s point that natural forces, both known and unknown, have been and will continue to be significantly more relevant in what happens with the earth’s temperature than what at least some have anticipated, and the climate may not be as sensitive to CO2 as thought.

          I have to say, I really appreciate you and the others I have talked to being respectful to my comments. I have been reading this blog for a few months, but this is my first day commenting. All this time I have worried about being heckled by “warmists,” or whatever you prefer that I call you, but so far you have all been pretty fair. I geuss I have been mainly worried about how my patience would fare when dealing with Sod or David Appell. XD

          • Snape says:

            To elephant in the room:

            Midoki?? Sorry, couldn’t resist a small heckle.

          • Snape says:

            I think you made some good observations regarding El Nino and La Nina. These throw a monkey wrench into the whole climate debate.

          • Elephant in the Room says:

            Lol I will let that one slide, Snape.

            Yeah, it’s mOdoki. And to think, I want to learn Japanese, and yet can’t get one of their few words we English speakers use right!

          • Elephant in the Room says:

            And yeah, these ENSO events sure don’t make things easy for us. And it definitely doesn’t help that both sides will use the same event to try to prove their case beyond a shadow of a doubt.

            It will be really interesting to see whether El Nino, in any form, returns this year.

          • Snape says:

            I would be really surprised to see much of an El Nino develop. How could “the pacific warm pool” have had enough time to recharge so soon? (I haven’t checked the metrics on this – just speculating).

          • Gordon Robertson says:

            elephant…”the climate may not be as sensitive to CO2 as thought.”

            18 years of no warming have pretty well proved CO2 has no effect.

          • Snape says:

            Gordon:

            I think we’ve been through this before. Without an increase in Co2 levels, we may have seen 18 years of cooling instead of “no warming”, right? When you take into account the natural fluctuations in global temperature, less cooling is the same as warming.

            This is why the main evidence for AGW, or not, is in the long term trend.

          • Snape says:

            When discussing the atmosphere, global “warming/less cooling” might be more accurate.

            When you consider oceans + atmosphere, there is, IMO, constant warming do to AGW (excepting volcanic events like Mt. Pinatubo)

          • David Appell says:

            Gordon Robertson says:
            “18 years of no warming have pretty well proved CO2 has no effect.”

            UAH LT v6.0 18-yr trend = (0.12 +/- 0.04) C/decade.

          • Nate says:

            Elephant,

            Thank you for respectful discussion.

            Agree that natural variations are important. It is generally not recognized here, though, how much such natural contributions have long been incorporated into climate modeling. At least volcanos, aerosols, solar cycle, el nino. Multi-decadal ocean oscillations more recently.

            But while AGW makes quantitative predictions, I dont believe the natural variation models (anomalous solar, clouds) can make any such predictions. Until they do it is just hand waving, IMO.

          • David Appell says:

            Gordon Robertson says:
            “18 years of no warming have pretty well proved CO2 has no effect.”

            Gordon is lying.

            UAH LT v6.0 18-year change = (0.22 +/- 0.07) C (via it linear trend)

          • barry says:

            David, those values appear to be the wrong way around. Since 1998 TLT temp trend is 0.04C /decade (+/- 0.18).

          • David Appell says:

            No Barry, the 18-yr linear trend (1999-2016) of UAH LT is 0.12 C/decade.
            ,
            Note that I calculated the *change*, in the comment you replied to, not the trend.

            change = trend*interval

          • barry says:

            I see, Gordon was referring to the trend since 1998, and you are referring to the last 18 years.

            It’s worth making it clear, then, that you have excised 1998 from the calculation. To avoid confusion.

            I was responding to this comment.

            UAH LT v6.0 18-yr trend = (0.12 +/- 0.04) C/decade.

        • David Appell says:

          In a media conference call on 1/18, Deke Arndt of NOAA estimated that the El Nino was responsible for about 1/4th-1/3rd of the new NOAA surface record for 2016 (which was 0.04 C above 2015).

    • MarkB says:

      If you were a betting man, would you take any of the following bets?

      a) UAH LT 2017 average will be below 0, that is, lower than the average 1981-2010. This would be an fair bet if there were no warming trend.

      b) UAH LT 2017 average will not be in the 10 of the 38 year record. This would be a particularly good bet if there were no warming trend, but would have to be below 2013 at 0.13 C.

      c) UAH LT 2017 average will be at or below 0.20 C (Dr Spencer’s guesstimate earlier in the thread). This approximately corresponds to linear trend projected since 1998, that is, the “hiatus” continues after the El Nino event.

      d) UAH LT 2017 average will be below 0.25 C. This approximately corresponds to the linear trend projection from the complete data set.

      • Elephant in the Room says:

        Notice in my reply to Barry that I acknowledged that there is a warming trend. We just disagree on the strength of it. If I were to bet on anything, it is that temps will more or less return to pre 2015 levels, especially considering what MET Office has reported.

        But I do not think that will happen in 2017, because we may be getting a new El Nino, or at least a Midoki. Perhaps in 2018.

      • barry says:

        Betting man or no, the next year’s annual anomaly is too hard to predict. I can only say that it will be warm if there is an el Nino, and likely in the top 10 if so.

        I can remember some predictions about where 2016 would end up….

      • Nate says:

        I think the best measure of whether the climate is changing is to look at how the climatological mean is evolving. Usually a 30 y average is used to define the climatological mean.

        I would be willing to bet that the climatological mean global surface temperature will be higher at the end of 2017-compared to end of 2016.

        Specifically the 30 y mean global surface temp (hadley, giss, or noaa, your choice) measured in 12/2017 (1/88-12/17) will be larger than the previous year (1/87-12/16).

        I would go further and bet that the 2018, 2019, and 2020 climatological means (as defined above) will each be larger than the previous year?

        I would bet $100, each year not trying to send anyone to the poor house. Or something non-monetary perhaps?

        Anyone?

      • barry says:

        Nate, you will almost certainly lose. There was a drop in annual temp anomaly of 0.2C from 1988 to 1989. If that is not offset with a 0.2C increase from 2016 to 2017, you will get a lower 30-year average. 2017 is extremely unlikely to be warmer than 2016, and certainly not by 0.2C.

        I’ll take your bet, paid in January 2018. 🙂

        • Nate says:

          Its 87 to think about, and I am still very confident. Are you quite sure?

        • barry says:

          Nate, yes, you wrote,

          Specifically the 30 y mean global surface temp (hadley, giss, or noaa, your choice) measured in 12/2017 (1/88-12/17) will be larger than the previous year (1/87-12/16).

          So I’ll correct the years.

          Moving the 30-year average to start from 1987 (->2016) to 1988 (->2017): There was a drop in temps from 1987 to 1988 of 0.01C (UAH data.

          For the 30-yr ave ending 2017 to be warmer than the one ending 2016, 2017 will have to be more than 0.01C warmer than 2016.

          Slightly more possible than what I stated previously, but still unlikely.

          What, do you think, are the chances of 2017 being warmer than 2016?

          A warmer 30-yr average ending in 2018, though, has a bigger hurdle to overcome.

        • MarkB says:

          “barry: There was a drop in annual temp anomaly of 0.2C from 1988 to 1989. If that is not offset with a 0.2C increase from 2016 to 2017, you will get a lower 30-year average.”

          Maybe I’m misunderstanding the premise, but to get a monotonic year-to-year increase for the 30 year average, each subsequent year (e.g. 2017) has to be greater than the year 30 years previous (e.g. 1987). Breaks in multi-year runs are going to be pretty rare on current trend.

        • barry says:

          We’re both a bit wrong, though your thinking will give a better result than mine. Removing the beginning year when moving the 30-year average forward a year will change the average before adding the new year (now you’ll have a 29 year average).

          So: 30-year average 1987-2016) is 0.082

          29 year average (1988-2016) is 0.081

          2017 needs to be 0.083 or higher to raise the average. That seems likely after all. Wouldn’t bet on it, though!

          • MarkB says:

            “…has to be greater than the year 30 years previous (e.g. 1987)…” should read “31 years previous”.

            Avg2017 = (sum of T1988 to T2017)/30
            = (sum of T1987 to T2016)/30 – T1987/30 + T2017/30
            = Avg2016 – T1987/30 + T2017/30

            Therefore

            (Avg2017 > Avg2016) if (T2017 > T1987)

            or generally

            (Avg[Year_n+1] > Avg[Year_n]) if (Year_n+1 > Year_n-30)

            Using constant warming trend for GISSlo based on last 30 years, the expectation value for 2017 is about 0.54 C greater than 1987 which is quite large relative to the year to year uncertainty. The late 70s are the last time this bet would have lost.

          • barry says:

            We’re using the UAH TLT database for this, which starts 1979, so this bet doesn’t come into play any time before 2008, the first 30 years of the record.

            Got my hands dirty doing trial and error.

            If the annual anomaly for 2017 is

            0.05

            The average for the 30-yr periods* 1987-2016 and 1988-2017 will be the same.

            Definitely within the realm of possibility 2017 will be lower than that.

            If you want to check it out, Mark, data is at the following link, first column.

            http://www.nsstc.uah.edu/data/msu/v6.0/tlt/tltglhmam_6.0.txt

            * Calendar years

          • barry says:

            Not sure what you mean by monotonic warming. That’s not the case year by year.

          • MarkB says:

            I get 0.5 C as well, which is also the annual value for 1987 as above.

            By monotonic, I mean the moving plot of the 30-year mean has positive slope at all points that meet Nate’s criteria.

            If links work: http://www.woodfortrees.org/plot/uah6/mean:360

          • barry says:

            Gotcha. Looking closely at that graph reveals a few points where the slope dips for a mo’? I would have expected this mid last century with the flattish trend from the 40s to the 70s.

          • MarkB says:

            Right, that plot is UAHv6 data, so it doesn’t go back far enough to capture mid 20th century. Link below is the same thing with GISS data and one can see negative slope on the 30 year average from the middle 50s to the middle 60s. Note that the plot appears to be a centered average, that is the X axis date is the middle of the 30 year period.

            http://www.woodfortrees.org/plot/gistemp/mean:360

          • Nate says:

            Barry, Mark. Giss looks good. Would bet on that one. Not sure if id bet on UAH. Has much bigger y to y variations.

          • barry says:

            Mark, I think I’ve found a way to plot 30-year averages from annual averages increments rather than monthly increments. This corroborates better (visually) that each year bring a higher 30-year average than the last. It’s a smoother smooth.

            http://www.woodfortrees.org/plot/uah6/mean:12/mean:360

            Compared to your graph…

            http://www.woodfortrees.org/plot/uah6/mean:360

  18. Dear Dr. Spencer:

    Is this image (http://www.drroyspencer.com/wp-content/uploads/UAH_LT_1979_thru_January_2017_v6.jpg) published on your blog here a public domain image? I am trying to get some additional images included in the Wikipedia Global Warming article (http://en.wikipedia.org/Global_warming) which at present relies virtually entirely on NASA GISS images and data. If it is public domain, what is the proper citation for the graph and the data? WIkipedia requires that the graph come from a “reliable source” (http://en.wikipedia.org/wiki/Wikipedia:Identifying_reliable_sources).

    Thank you for all of your outstanding work in this field. I have been a long-time admirer of your work, your integrity, and your willingness to stand up in the face of the continuing onslaught of politically motivated nonsense that unfortunately pervades this field

    FYI, I tried emailing to the email address listed at the bottom of your blog [email protected], but it bounces back as an invalid email address.

    Best regards,
    Jonathan Cohler

    • Gordon Robertson says:

      Jonathan Cohler…”I am trying to get some additional images included in the Wikipedia Global Warming article…”

      Jonathon….let me save you some time. Look on the ‘Talk’ tab at the top of the article and search for the name William Connolley. He is an editor on the Wiki page and he is a known uber-alarmist who hangs out at realclimate, run by Gavin Schmidt of NASA GISS.

      Connolley will not allow input that contradicts NASA GISS.

      Here’s a quote from Connolley on the ‘Talk’ page which is typical of him:

      “UAH6 is still in beta; so no, we should not use it”

      Translated…there is no way UAH data will ever get on a Wiki page as long as I am an editor.

      Connolley is a computer programmer who tries to pass himself off as a climatologist.

      • David Appell says:

        I think that was a reasonable position. Most groups publish a peer reviewed paper when introducing a new dataset, explaining how the data are calculated. UAH did not do that, for some reason.

    • barry says:

      It’s appropriate to use data that has been formally published. I’m sure UAH6.0 will be included at various papers once the methods paper has been released into the public domain.

      I mean, would you honestly accept using any data if there was no publicly accessible methodology?

  19. GW says:

    Dr. Spencer, you and Dr. Christy (among other colleagues) should aggressively lobby the Trump administration for a new satellite to replace the channel which failed long ago to measure temperatures near and/or on the earths surface. I would be shocked to learn that the administration would not support a rapid deployment of such a program.
    Best regards,

  20. Stevek says:

    Another month where models are out running reality.

  21. Vincent says:

    Snape says:
    February 2, 2017 at 12:52 PM
    To Vincent:

    Placing a few thermometers around youre house would give a good ballpark estimate of your homes average temperature. These household temperature stations could be used as a reference to detect future warming or cooling. The exact temperature of your house is not what were interested in. Whats of interest are how the readings of these stations change over time.
    ———————————————

    Thanks to all for your replies to my question. If it’s true that we’re not interested in the exact temperature of my house, and therefore, by analogy, the exact temperature of the planet, but we’re only interested in the average of the changes in the readings at specific locations on the planet, then that at least partially explains the reason for my puzzlement.

    Provided there are a sufficient number of weather stations evenly placed around the globe, and provided such weather stations are not contaminated by the presence of other human constructions in the vicinity (UHI effect), I can appreciate that the results could provide a reasonably accurate trend.

    • barry says:

      They test coverage in multiple ways. One way is to take subset samples and see if much changes. It doesn’t, as long as the coverage is still global rather than regional. Eg, use half or quarter or an eighth the number of stations, with the provision that all the continents are covered with as wide as possible distribution. The results are not significantly different.

    • barry says:

      Testing using only rural, only airport, only coastal is done, again with little difference. There are also alternatives to the GHCN global data used by the major institutes, such as GSOD, which has more stations.

      https://moyhu.blogspot.com.au/2010/07/global-landocean-gsod-and-ghcn-data.html

  22. Werner Brozek says:

    For both UAH and RSS, 2016 beat 1998 by a statistically insignificant 0.02 C leaving 2016 and 1998 statistically tied for first place.
    UAH’s 0.30 in January and RSS’s 0.409 in January would rank both in fourth place if they stayed that way for the rest of 2017. Naturally this will not happen. And with both January anomalies being more than 0.1 below their 2016 averages, they would not then be statistically tied for first place either.

  23. barry says:

    Since the el Nino rose last year there have been many predictions here that a la Nina would form shortly afterwards and once again return the trend since 1998 to a flat line or cooling. I decided to check the change in trend from 1998 to each month past the el Nino peak (determined by warmest month last year in UAHv6 data).

    I’m about to do the trend analyses. My prediction is that for each month added past the el Nino peak the trend will be ever so slightly warmer, also when including December and January values in UAHv6 TLT data. This would be my assumption against many claims last year that the trend would flatten with la Nina. I think it’s a safe assumption. Here goes…

    • Gordon Robertson says:

      barry…”Im about to do the trend analyses”.

      You’re wasting your time. Roy has already given a good graph with a running average on it. I don’t need to check his running average because it fits visually.

      You have indicated from your arguments that you don’t understand how to apply statistics to data. You seem to be feeding the data blindly into a black box that represents a statistical function. There is far more to it than that.

    • Richard M says:

      I used a different approach. I computed the trend of only ENSO neutral months since 1997 (20 years). The trend is .01 C/decade. Insignificant.

    • barry says:

      Richard, which ENSO index did you use, and can you link to the results or data so I can check for myself?

  24. barry says:

    The warmest month of last year was February in the UAH dataset. I’ll start with that as the benchmark and see how the trend evolved from 1998 to then, with each successive month of cooler temps.

    Feb 2016: 0.011 /decade
    Mar 2016: 0.020 /decade
    Apr 2016: 0.028 /decade
    May 2016: 0.034 /decade
    Jun 2016: 0.036 /decade
    Jul 2016: 0.038 /decade
    Aug 2016: 0.041 /decade
    Sep 2016: 0.045 /decade
    Oct 2016: 0.047 /decade
    Nov 2016: 0.050 /decade
    Dec 2016: 0.050 /decade (higher to 4 decimal places than Nov)
    Jan 2017: 0.054 /decade

    Even with la Nina conditions over the last few months, the trend has increased slightly month by month since the peak in Feb last year.

    • barry says:

      Testing to see how cool Feb would need to be to make the trend flatline….

      -5C

      You read right – not -0.5, but -5C.

      What would the trend since 1998 be if 2017 annual was the same as January 2017 (0.30)?

      0.063C /decade – warmer than current trend.

      What would the annual anomaly of 2017 need to be to get a flatline trend since 1998?

      -0.16

      • barry says:

        Note: the trends were calculated using ordinary least squares regression, which doesn’t account for autocorrelation. Results will be slightly different using linear regression models that do.

        • Gordon Robertson says:

          barry…”Note: the trends were calculated using ordinary least squares regression…”

          In engineering classes on probability and statistics we were taught to look at the source of the data (the context) before applying equations. Blindly apply least square regression to numbers tells you lies, often as not.

          If you look at the circumstances that produced the UAH data you can’t possibly arrive at the conclusions you have reached.

          In calculus, you learn to check the continuity on a curve. If there is a discontinuity you must divide the curve into ranges and you have to specify those ranges.

          It’s the same with statistics and you have obviously not done that. You must break the data into at least two ranges: from 1979 – 1997 and 1998 – present. Otherwise the trend has no meaning.

        • Nate says:

          Barry, Should these be x10?

      • Gordon Robertson says:

        barry…”Testing to see how cool Feb would need to be to make the trend flatline. -5C”

        More of Barry’s alarmist math. You should apply for a job at one of the British tabloids. You pull these numbers out of a hat, just like NOAA and GISS.

        • barry says:

          No, I simply tried a few different values for February and ran the regression for each. -5 was the highest value that produced a flat line trend. I didn’t pull it out of a hat.

        • barry says:

          I have no idea what is ‘alarmist’ about what I’m doing. It’s merely asking questions and doing some basic averaging and a few regressions to find out the answers. Do I ever say the sky is falling?

        • Nate says:

          Gordon, ‘alarmist math’ what is that? Different from regular math how? Last time i was in excel i didnt see an ‘alarmist slope’ function. In any case, I think Barry used the regular slope function. You can check his results yourself just to be sure…

    • barry says:

      How likely is it that 2017 would have an annual anomaly of -0.16C?

      Coolest years post 1998:

      2008: -0.10
      2000: -0.02

      Before 1998 there were 8 years of average annual anomaly less than -0.16. Starting from the most recent year where this was so:

      1993: -0.20
      1992: -0.28
      1989: -0.21
      1986: -0.22
      1985: -0.36
      1984: -0.24
      1982: -0.30
      1989: -0.21

      ENSO conditions relevant to the above were:

      2008 – nina
      2000 – nina
      1993 – neutral
      1992 – nino
      1989 – nina
      1986 – nino
      1985 – nina
      1984 – nina
      1982 – nino
      1989 – nina

      With predictions of a ENSO-neutral or Nino 2017, that would make it unlikely that the annual anomaly would go as low as -0.16C, and thus unlikely that the trend since 1998 would flatten.

      • Gordon Robertson says:

        barry…”Before 1998 there were 8 years of average annual anomaly less than -0.16. Starting from the most recent year where this was so:”

        Yet you have claimed those years as a warming trend. UAH have made it clear they were due to aerosols from two major volcanic eruptions.

        Unfortunately we don’t have a satellite record prior to 1979 with which to compare them.

        Even your claim of 8 years is misleading. If you look at the UAH graph, following the red running average curve, it is plain that about 90% of the temps over the 18 years from 1979 – 1997 were below the baseline.

        Why did you pick 0.16C?

        • David Appell says:

          GR says: “If you look at the UAH graph, following the red running average curve, it is plain that about 90% of the temps over the 18 years from 1979 1997 were below the baseline.”

          linear trend of UAH LT from 12/78 to 11/96 (18-years) = (0.09 +/- 0.04) C/decade

      • barry says:

        You may not remember, Gordon, but there were many comments last year that the trend line since 1998 would flatten again when the la Nina ran its course. mpainter specifically said that would happen by the end of 2017.

        I am following up on those comments now. For the trend since 1998 to flatten by the ned of 2017, the annual anomaly would have to be at least -0.16C.

        You seem to think the premise of these predictions from last year is unsound, and perhaps you mentioned it then. Nevertheless, I choose to take them seriously and see how they are playing out.

    • Richard M says:

      A better approach is to remove the noise altogether by only using ENSO neutral months. That way no one can use ENSO to affect the result. As I stated earlier this technique shows essentially no warming since 1997. I suspect that won’t change as we progress through 2017.

      • barry says:

        Which ENSO index did you use?

      • barry says:

        And why not then remove for volcaoes and solar?

        Deleting months for any reason loses information beyond ENSO. Using only ENSO neutral months, I get a total of 104 months out of 228 – less than half, amounting to 9 years worth of data since 1998.

        Another way of doing it would be to work out the average anomaly from 1998 to Dec 2016, and substituting that values for ENSO months. Still have to offset against the ENSO indices, as there is a lagged response to ENSO events in the lower troposphere.

        Eg, 1997/8 el Nino peak by NOAA indices was Nov 1997, but the peak temp in the UAH v6 lower trop occurred 5 months later, in April 1998.

        • Richard M says:

          There were no big Volcanic events during the 20 years I looked at and solar changes are very small. Since all I was looking for was a trend unaffected by ENSO, clearly the biggest source of noise, it didn’t make sense to complicate the effort. I was trying to eliminate objections of cherry picking.

          I thought about putting in the average value but why. Making up data is generally not a good idea.

          I also think a lagged approach would be better but I doubt it would give a different answer. I thought about removing the months 4 months after a non-neutral month. OTOH, the lags should tend to cancel each other out. Again, a possible refinement but not likely to give a different answer.

        • barry says:

          Offsetting by 5 months gives a lower trend.

  25. barry says:

    A quick review of UAH6 data (and ENSO forecasting) leads me to some qualified predictions to December 2107:

    2017 will very likely not be as warm as 2016.

    The long-term trend (since 1979) will not change much, but if there is an el Nino again, then the change will be positive – to about 0.13C/decade.

    It is very unlikely that, without a super strong la Nina, the trend since 1998 will go flat (or negative) by December 2017.

    (ENSO forecasting groups see neutral or Nino conditions for 2017)

    • barry says:

      Should add: a massive volcanic eruption in the next few months could also reduce global temps considerably by the end of the year, resulting in a possible flatline trend since 1998.

      • Werner Brozek says:

        Thank you very much for the above 7 posts! Have you thought of combining them to submit as an article for WUWT? I think it would make a good article.

      • barry says:

        Cheers, Werner. You are welcome to pinch as much of the above as you like and post to WUWT.

        • Werner Brozek says:

          Thank you! In that case, I would likely make you a co-author of my next article. I may run this past Justthefacts. Should I list you as Barry for personal reasons or do you wish to give me your last name?
          Since we do not have your email address, please see this space for further communication with you. Thanks!

          • David Appell says:

            Articles??

            They’re just blog posts.

          • Lewis says:

            David, see the definition

            Article:

            : a distinct often numbered section of a writing
            b : a separate clause
            c : a stipulation in a document (such as a contract or a creed)
            d : a nonfictional prose composition usually forming an independent part of a publication (such as a magazine)

            So Werner used the term correctly.
            Also, the comments were going back and forth, very politely, I might add. There was no cause or request for your boorish additions.

          • barry says:

            No credit for me. I do this for fun.

          • David Appell says:

            Lewis, they’re certainly not articles that met the standards of journalism, magazines or journals. Watts will pretty much put up anything as long as it’s denying.

          • barry says:

            ‘Article’ is not the correct term for a blog post.

            “Such as a magazine” – usually a price on the published product is a prerequisite for it being lofted into the ‘article’ category. This is about journalism. WUWT is not a formal journal. There’s no formal editing process for blog posts. Newspaper articles are vetted by editors for example.

            But this is a quibble over validity. With blog posts, it’s encumbent for readers to vet them themselves.

    • Gordon Robertson says:

      barry…”The long-term trend (since 1979) will not change much, but if there is an el Nino again, then the change will be positive to about 0.13C/decade”.

      Your so-called long-tern trend is based strictly on numbers, the worst kind of statistical analysis. You have not specified a context.

      For example, UAH makes it clear that the first 18 years of the trend since 1979 was affected by aerosols from two major volcanoes. Therefore the trend from 1979 – 1997 was a re-warming, not global warming.

      In late 1997, the infamous El Nino struck, the most powerful EN of this era since it began at the baseline, unlike the 2016 EN that began near 0.3C.

      Following that EN, a La Nina drove temps down into an extended trough that essential average the EN warming to zero. Then, for what ever reason, the temperatures rebound in a spurt in 2001 to about 0.25 C where they remained till 2008. No one has explained that spurt.

      Following 2008 we saw a nice cosine wave (running average) with it’s max during the 2010 EN, and as we know, the average of a cosine wave is zero. Therefore there was no warming trend for another 15 years from 1998 – 2012.

      The IPCC have confirmed that lack of trend, calling it a warming hiatus.

      Your claim of a 0.13C/decade trend is purely statistical smoke and mirrors. The only trend was a rewarming trend from 1979 – 1997. The other warming in 2001 was essentially a step function leading to a 7 year flat trend.

      • barry says:

        Do you know that there have been attempts to remove the influence of volcanos and ENSO (and solar) from the data to see what trend is underlying?

        As you think these components are responsible for all the warming, would you be interested in seeing the result if you remove their influence from the record?

        And what do you make of increased ocean heat content, higher sea level, melting glaciers and global sea ice in the same period? Do these not constitute warming – if we consider ‘global warming’ to be actually global and not restricted to satellite retrieval of a 4 kilometer slice of the troposphere?

        • Lewis says:

          I find the idea of eliminating the influence of volcanoes a bit amusing. As they are an ongoing natural occurrence, it seems there is no reason to subtract them out. The problem, which is alluded to by the attempt, is that their influence makes it more difficult to determine what other influences cause.

          Along that line, the more I learn, the more I understand this is hardly a settled science.

          • Snape says:

            Lewis,

            Obviously ENSO events and volcanoes are “natural occurrences”. They are also temporary, and ultimately temperature neutral, and therefore have little effect on the long term trend.

            This doesn’t stop people like Gordon Robertson from fixating on the spikes these events can create on a temperature graph. Folks like this may need a less confusing graph in order to spot what’s really go on (long term warming).

          • Snape says:

            In other words, simplified temperature graphs are available to those with difficulty seeing the big picture. These were what Barry was referring to.

          • Richard M says:

            Nope, there is no evidence they are “temperature neutral”. We don’t have near enough information to make that claim.

          • David Appell says:

            I think what Snape means is the ENSOs neither create or destroy heat.

          • Richard M says:

            David, since the oceans have 1000+ times the heat capacity of the atmosphere it really doesn’t matter when the heat was created. It could have been created centuries ago and just now getting released at an uneven rate.

            There is no way to say they are temperature neutral over periods of a few decades or even centuries. You have to accept there are many things we don’t understand.

          • barry says:

            As the oceans have been gaining heat they’re an unlikely source for atmospheric heat.

          • Richard M says:

            Barry, do you really think we know the oceans are gaining heat? We only sparsely measure some the upper half and then throw away any measurements that show cooling. LOL.

            On top of that the only study I saw that looked at how ocean heat was changing found the heat was moving up, not down. Although this sounds strange it is likely due to a reduction in upwelling cold water.

          • barry says:

            We have good coverage of the first 750 meters, and sparser for the 2000 meter depth, but they correlate very closely.

            Sea level is an extremely good proxy for ocean heat content with millions of data points. Unless you think the world’s ice sheets and glaciers are melting faster than estimated…

            Corroboration of oceans gaining heat is excellent.

          • David Appell says:

            Richard M says:
            “David, since the oceans have 1000+ times the heat capacity of the atmosphere it really doesnt matter when the heat was created. It could have been created centuries ago and just now getting released at an uneven rate.”

            Umm, that’s not how thermodynamics works.

            If you put a pot of water on the stove and bring it to a certain temperature, then turn the heat off, does the pot stay at that temperature until some later time when it releases its heat?

            Of course not.

            Besides, in recent decades both the ocean and the lower atmosphere are gaining heat.

          • David Appell says:

            barry says:
            “As the oceans have been gaining heat theyre an unlikely source for atmospheric heat.”

            I don’t see why.

            Why can’t the ocean be absorbing heat, but still be giving some of that heat to the atmosphere?

          • David Appell says:

            Richard M says:
            “Barry, do you really think we know the oceans are gaining heat? We only sparsely measure some the upper half and then throw away any measurements that show cooling. LOL.”

            Of course, no one throws any studies away, and Richard M has no proof that that’s happening. It’s a claim with no merit whatsoever — that is to say, a lie.

            There are studies about the deep ocean, > 2000 m depth:

            Deep ocean heat content changes estimated from observation and reanalysis product and their influence on sea level change
            Kouketsu et al, GRL v116 (March 2011)
            http://onlinelibrary.wiley.com/doi/10.1029/2010JC006464/abstract

            Carl Wunsch and Patrick Heimbach, 2014: Bidecadal Thermal Changes in the Abyssal Ocean.J. Phys. Oceanogr.,44, 20132030.
            http://dx.doi.org/10.1175/JPO-D-13-096.1
            “For 1992-2011…. In the global average, changes in heat content below 2000 m are roughly 10% of those inferred for the upper ocean over the 20-yr period.”

            “NASA Study Finds Earths Ocean Abyss Has Not Warmed,”
            NASA 10/6/14
            http://www.nasa.gov/press/2014/october/nasa-study-finds-earth-s-ocean-abyss-has-not-warmed

        • barry says:

          I find the idea of eliminating the influence of volcanoes a bit amusing. As they are an ongoing natural occurrence, it seems there is no reason to subtract them out.

          They add interannual noise to any underlying trend. we want to see the underlying trend.

          People here often attribute warming to ENSO events, and Gordon in this thread put down the trend to volcanic influence.

          So one way of testing his thesis is to remove these influences to see if that changes the trend for a given period.

    • barry says:

      Whether you think the premise is right or wrong, those are my predictions.

    • barry says:

      The IPCC have confirmed that lack of trend, calling it a warming hiatus.

      Once again, Gordon, the IPCC in the same document said that that short-term trend does not necessarily reflect the long-term trend. You are being stubbornly selective about IPCC remarks on the period.

      • David Appell says:

        Gordon also knows newer/better data has come out since then, but is too stubborn to admit it.

        • Gordon Robertson says:

          DA…”Gordon also knows newer/better data has come out since then, but is too stubborn to admit it”.

          What Gordon has seen is egregious fudging of data using statistical methods.

          NOAA has had the temerity to go over the historical record and change temperatures they regarded as wrong.

          For SST, they compared the old method of raising a bucket of ocean water from a ship by bucket, then sticking a thermometer in the bucket, to the newer method of measuring the temperatures at the water intake valves on the ship. They found that the temperatures at the water intake valve was warmer by 1.6C so they scrapped the bucket temperatures and went with the water intake temps.

          Why?? An arbitrary decision made by warmists.

          NOAA is corrupt and you still back them. They have found warming in an arbitrary measurement of ocean temperatures by selecting a method of water retrieval for measurement that was warmer than the tried and true bucket retrieval system. Rather than find out why one temperature was 1.6C higher than the other they used the higher temps because it suited their catastrophic warming agenda.

          Why does that so-called newer data out-weigh the many papers reviewed by the IPCC that suggest no warming from 1998 – 2012.

          • Nate says:

            Gordon,

            Your description of what was done can only be characterized as ‘alternative facts’ . It is chock full of misinformation. Please try to stick to facts.

          • David Appell says:

            Gordon Robertson says:
            “NOAA has had the temerity to go over the historical record and change temperatures they regarded as wrong.”

            So does UAH.

            So do all groups. That’s called “science.”

          • David Appell says:

            Gordon: Let’s see you defend UAH, for doing the same things NOAA did.

            Though UAH’s changes were about 3 times larger than NOAA’s.

          • barry says:

            I doubt Gordon would have the temerity to castigate Dr Spencer for the many (some very significant) adjustments to the UAH record over the years.

          • David Appell says:

            barry, clearly you were right about Gordon.

      • Gordon Robertson says:

        barry…”Once again, Gordon, the IPCC in the same document said that that short-term trend does not necessarily reflect the long-term trend. You are being stubbornly selective about IPCC remarks on the period”.

        You are not that stupid. Selecting a statement from the IPCC indicating a warming hiatus, as opposed to your selection that the hiatus is irrelevant because they also inferred it does not necessarily reflect the long-term trend, has nothing to do with being stubborn.

        I have made my opinion clear that an 18 year warming hiatus is significant in itself, never mind what preceded it. The IPCC has a mandate to find only proof of anthropogenic warming and no mandate to investigate whether the current hiatus suggests the anthropogenic theory is wrong.

        You are judging my reference to the IPCC’s warming hiatus based on your belief that a warming trend currently exists and that it is caused by CO2. I think an 18 year hiatus proves once and for all that the atmosphere is not sensitive to CO2.

        • David Appell says:

          GR wrote:
          “I have made my opinion clear that an 18 year warming hiatus is significant in itself, never mind what preceded it.”

          Why is it significant?

          When you include autocorrelation, most 18-yr trends are not statistically significant…..

        • barry says:

          The period in question fails statistical significance by a large margin, whether regression models are that cope with autocorrelation or not.

          This means that for the period it cannot be said that there is warming cooling or a flatline. The uncertainty is too large.

          From the lower troposphere data alone I could not say that any warming cooling or otherwise has occurred.

          So I look at a larger data pool that includes the oceans, the near surface temps, global sea ice, global glaciers and sea level. All of these are in the warming direction for the whole period, which indicates to me that warming has continued globally.

          Only if I ignore all the other data, ignore the surface data sets, and use only one slice of the atmosphere (satellite temps), and ignore statistical uncertainty can I say there has been a pause (which appears to have ended last year).

        • barry says:

          Selecting a statement from the IPCC indicating a warming hiatus, as opposed to your selection that the hiatus is irrelevant because they also inferred it does not necessarily reflect the long-term trend, has nothing to do with being stubborn

          If you have seen the other quote (cited a dozen times specifically for you) and you don’t wish to tackle it, then I think it’s fair to say you are stubbornly ignoring or downplaying bits of the IPCC that don’t corroborate your opinion.

        • Nate says:

          Gordon, you are undermining your own previous arguments here that people should think for themselves and not bow to authority. But here you constantly referring to IPCC authority as the ultimate judge of trends. Meanwhile when i offer you the chance to look at data and judge for yourself the trend, you demur and refer back to IPCC authority.

  26. More of the same. Wait and see.

  27. Manfred says:

    Predictable ad hom. Sad, but well within confidence limits.

  28. Neville says:

    Dr Spencer, would it be possible for you to add data -series for Temperate regions i.e. 20 60 degrees N&S. Ken Stewart has calculated estimates for these derived from polar and extra-tropical data. This shows the north temperate land region has zero trend from February 1998 to December 2016. It would be good to have the real data rather than relying on estimates for parts of the world that have the bulk of population, agriculture , industry, and emissions. Extra tropical data includes polar as well.

    Here is Ken’s latest post graphing the trends and explanation.

    https://kenskingdom.wordpress.com/2017/02/01/dig-and-delve-part-iii-temperate-regions/

    • ren says:

      Climate change has hit the Arctic worse than ever over the past few years, but that doesn’t mean the Northern Hemisphere is going to be experiencing a mild winter this year.

      In fact, a new study shows that the polar vortex is shifting, and it’s going to make winters on the east coast of the US and parts of Europe even longer, with exceptionally cold temperatures expected during March.

      The polar vortex is that lovely zone of cold air that swirls around the Arctic during winter. When parts of the vortex break apart and splinter off, it can cause unseasonably cold conditions in late-winter and early-spring in the Northern Hemisphere.

      This happened in early 2014 – as you can see in the satellite image above – and caused an extreme weather event in the northern US and Canada.

      But not many people realise there are actually two polar vortices: the stratospheric polar vortex, which is about 19,800 metres (65,000 feet) above the surface of the Earth; and the tropospheric polar vortex around 5,500 to 9,100 metres (18,000 to 30,000 feet) above the surface.

      Usually, when the weather forecasters are talking about the polar vortex, they’re referring to the tropospheric vortex, which is the one that rips apart and plunges cold air towards mid-latitude cities, such as New York.

      But this study looked at the stratospheric polar vortex, which can have a bigger, but more subtle effect on mid-latitude weather.

      After looking at satellite data over the past three decades, the team showed that the stratospheric polar vortex has gradually been moving towards the Eurasian continent, and getting weaker over the past 30 years.

      That might sound like a good thing for warm weather lovers, but a weaker polar vortex means a vortex that’s more likely to break, and those breakages are what send unseasonably late winter blasts of cold air down to the rest of the world.

      When the polar vortex is strong, on the other hand, all that cold air gets contained nicely in the Arctic circle where it traditionally is at that time of year.

      The weakening of the polar vortex isn’t necessarily new – it’s something several studies have shown over recent years. But this study also shows that the vortex is moving away from North America and towards Europe and Asia during February each year – and that could cause the east coast of the US to get even colder.
      http://www.sciencealert.com/satellite-data-shows-the-polar-vortex-is-shifting
      http://www.cpc.ncep.noaa.gov/products/stratosphere/strat-trop/gif_files/time_pres_TEMP_ANOM_JFM_NH_2017.png
      http://www.solen.info/solar/images/swind.png

      • Gordon Robertson says:

        ren…”Climate change has hit the Arctic worse than ever over the past few years…”

        You need to be more specific, ren. Climate change in the Arctic is basically an Arctic summer phenomenon. There’s no way the Arctic winter has seen much of a change in anything.

        • Bindidon says:

          ‘Climate change in the Arctic is basically an Arctic summer phenomenon.’

          Aha.

          Well, Gordon Robertson: this might be true if you solely consider absolute temperatures (or: absolute sea ice extents).

          It is evident that in this case, the temperatures will be highest in the summer, and the sea ice extent will be the lowest one or two months later.

          But if you consider the differences wrt a reference period, the situation radically changes.

          Here is a list of the 20 highest UAH6.0 anomalies for the Arctic:

          2016 : 1 : 2.44
          2016 : 4 : 1.90
          1981 : 1 : 1.77
          1980 : 2 : 1.67
          2016 : 10 : 1.63
          2016 : 2 : 1.51
          2012 : 6 : 1.44
          2016 : 3 : 1.44
          2010 : 5 : 1.42
          1995 : 4 : 1.39
          2007 : 4 : 1.36
          2014 : 2 : 1.27
          2010 : 4 : 1.25
          2011 : 1 : 1.24
          2016 : 9 : 1.24
          2006 : 9 : 1.23
          1996 : 11 : 1.22
          2003 : 10 : 1.22
          2005 : 12 : 1.16
          2010 : 1 : 1.16

          ‘Theres no way the Arctic winter has seen much of a change in anything.’

          Aha.

        • David Appell says:

          Gordon Robertson says:
          “Climate change in the Arctic is basically an Arctic summer phenomenon. Theres no way the Arctic winter has seen much of a change in anything.”

          Don’t know where you got that notion, but it’s wrong. Here, for example, is the average Arctic temperature since the first of the year — about 10 C above the 1958-2002 average:

          http://ocean.dmi.dk/arctic/meant80n.uk.php

          • Gordon Robertson says:

            DA…”Dont know where you got that notion, but its wrong. Here, for example, is the average Arctic temperature since the first of the year..”

            You are confusing temperature with climate. The Arctic climate in the winter is obviously ice and snow. That’s not going to change unless a way is found to tilt the Earth so it gets solar energy all year round.

            During the brief Arctic summer, where the Sun shines 24/7 at times, there is melting of the ice and a brief change in climate but that ends quickly as the next Arctic winter arrives.

          • David Appell says:

            Gordon Robertson says:
            “You are confusing temperature with climate.”

            Temperature is probably *the* main way climate is classified.

            “The Arctic climate in the winter is obviously ice and snow. Thats not going to change unless a way is found to tilt the Earth so it gets solar energy all year round.”

            Wrong, it’s been changing since the 1970s, because of AGW and the ice-albedo feedback. Over 10 trillion tons of Arctic ice have melted since the late
            ’70s:

            http://psc.apl.uw.edu/wordpress/wp-content/uploads/schweiger/ice_volume/BPIOMASIceVolumeAnomalyCurrentV2.1.png

        • barry says:

          The trend of temp change in Winter is higher than that of summer in the Arctic.

          There’s a handy tool at NOAA to check this with satellite data.

          https://tinyurl.com/ho4bkkn

          Choose Arctic region, 3-month (season), and use the last month of the season to establish which season you want. Then hit plot.

          Note: this is using UAHv6.5. It also shows RSSv3 data, which is very similar to UAH6.0.

          The results are clear. Arctic Winter has warmed about twice as fast as Arctic Summer.

  29. ren says:

    The near term response of the tropospheric atmospheric circulation is the easier part and anticipating the long term impacts if any on the tropospheric circulation are more difficult. The Global Forecast System (GFS) has been predicting for the most part a relatively quick recovery of the polar vortex. However I believe that the PV weakening could persist for longer than currently predicted by the GFS. That belief is based on the more disruptive nature of the PV weakening above 10 hPa and our own PV forecast model. But even if the GFS is correct, I consider the PV weakening to be significant that could influence the atmospheric circulation for multiple weeks. It typically takes about two weeks from the peak for the impacts from the stratospheric PV weakening to reach the surface so it could still be a while before a pattern forced by the PV weakening to be fully established.

    Therefore longer term, I anticipate that the SSW/weak PV event does favor colder weather in the Eastern United States (US). My thinking for why the Eastern US will turn more persistently colder in the coming weeks is based on the strong ridging/positive geopotential height anomalies predicted centered near Alaska in the stratosphere. That feature looks to be relatively persistent and in my opinion should favor downstream troughing over the Eastern US. Some model forecasts continue to predict the Eastern US trough to be transitory with the pattern transitioning to a trough in the Western US with ridging in the Eastern US. This has been the dominant pattern this winter resulting in relatively cold temperatures for western North America and mild temperatures for eastern North America. It is certainly plausible that this pattern continues to dominate for the remainder of the winter, especially with the cold sea surface temperatures persisting across the mid-latitudes of the North Pacific. But I expect that even if this pattern does return, it will not be persistent but rather transitory with the pattern returning once more to one that favors cold temperatures in the Eastern US.
    https://www.aer.com/science-research/climate-weather/arctic-oscillation

  30. ren says:

    Because solar activity is very poor, also in the south polar vortex in the winter will be weak.
    http://files.tinypic.pl/i/00866/l8fwbze85k7d.gif

  31. Gordon Robertson says:

    I don’t know if Roy still reads these comments but I’d appreciate his input on this. I am becoming rather suspicious of the anomaly method of recording temperatures. I am particularly focused on the apparent and sudden rebound warming following the 1998 El Nino circa 2001.

    From 1979 – 1997, UAH anomalies were showing temps relative to the baseline as being cooler than average. That was explained as the result of volcanic aerosols. In late 1997, a massive El Nino struck, followed by a La Nina trough that essentially canceled it out, then following the La Nina, temperatures suddenly shot up in 2001 by 0.25C.

    There is no rhyme or reason why that warming should be there. It strikes me as being an artefact of the averaging used to determine anomalies. It’s as if the sudden relatively massive spike of the 98 EN skewed the global temps relative to the baseline.

    I think John Christy described something similar using a see-saw (teeter-totter) analogy.

    I was thinking back to 1979 when the record began. How was a baseline determined, and when? The same would apply to the surface record baseline. In 1979, how was the baseline determined and how did the sudden, relatively brief 98 EN spike affect the baseline?

    Also, how are raw temperatures derived from the satellite AMSU unit? When you receive the signal from the AMSU unit is it in absolute temperature? Is it possible to get the actual raw, absolute temperatures?

    • Bindidon says:

      Roy Spencer and Bob Tisdale have explained ad nauseam that anomalies are intended to remove annual cycles.

      For monthly time series, this consists of
      – building, for each month, the average value of all values originally collected for that month in the reference period (the climatology);
      – subtracting, for each month of each year in the entire time series, that monthly average value from the values originally collected.

      If you have 36 latitude zones of 5 deg each, you will have such a 12 month vector for each zone, because using the same baseline values in 0N-5N and 80N-85N makes no sense.

      And if in addition you have e.g. 13 different atmospheric pressure levels as is the case for radiosondes, you will also have such a 12 month vector for each level, because using the same baseline values at 850 hPa and 300 hPa makes no sense.

      Thus asking ‘In 1979, how was the baseline determined and how did the sudden, relatively brief 98 EN spike affect the baseline?’ is not very meaningful.

      1. The baseline isn’t determined year by year, so there is no procedure difference between 1979 and any subsequent year.

      2. The 98 spikes (there were two, in february and in april) only affect the baseline averaging of those months in which they occured.

      3. These spikes are no measurement: they are (simplified) themselves the result of averaging the monthly values for 144 x 66 = 9,504 UAH 2.5 deg grid cells.

      *

      ‘Is it possible to get the actual raw, absolute temperatures?’

      Oh yes, there is a beautiful file for you: ‘tltmonacg_6.0’.
      Everything there is in absolute K.

      • Gordon Robertson says:

        Bindidon…”1. The baseline isnt determined year by year, so there is no procedure difference between 1979 and any subsequent year”.

        Obviously in 1979, when the data sets were first produced, there was no baseline established. What global average were the anomalies based on if the average had not yet been established?

        It would take 10 years to establish a meaningful baseline based on the acquired data.

      • barry says:

        UAH have had at least two baselines. They announced the change a few years ago. This changed all the anomalies, but had no effect on trends.

        Of course, it’s easier to maintain the same baseline to compare through the years, but sometimes there are good reasons to improve it. UAH extended their baseline, IIRC from a 21 to 30 year baseline, where 30 years is a standard for global climate indices.

        Obviously in 1979, when the data sets were first produced, there was no baseline established.

        IIRC, Christy and Spencer first produced the UAH data set in the late 1980s.

    • Neville says:

      Can Gordon Robertson or anyone else help me with this problem? In 2010 Phil Jones had an interview Q&A with the BBC and listed the warming trends from 1850 to 2009. This during their Climategate fiasco.
      First trend was 1860 to 1880 0.163 c/ decade
      Second trend was 1910 to1940 0.150c
      Third trend was 1975 to 1998 0.166 c
      Fourth trend was 1975 to 2009 0.161 c.

      But now using the York uni tool the trends are——-

      1860 to 1880 0.113 c/dec
      1910 to 1940 0.129 c/dec
      1975 to 1998 0.172 c/dec
      1975 to 2009 0.188 c/dec

      Why have the two earlier trends dropped and particularly the first trend 1860 to 1880 has dropped from 0.163 c to 0.113c ?
      I’m using HAD 4 L&O, but there is a global HAD 4 Krig and that shows a higher trend for 1860 to 1880 of 0.167 c.
      Just for interest I checked the trend from 1910 to 1945 and found it to be 0.140 c/dec or higher than Jones’s second trend is now. BTW HAD 4 global Krig was 0.151 c/ dec for 1910 to 1945. What is going on?

      Here’s Jones’s 2010 BBC Q&A link.

      http://news.bbc.co.uk/2/hi/science/nature/8511670.stm

      And here is the York Uni data-base tool. Note that Cowton etc allowed RSS V4 TTT but not UAH V6, but only UAH V 5.6. Of course RSS V 3.3 TLT included.

      http://www.ysbl.york.ac.uk/~cowtan/applets/trend/trend.html

        • David Appell says:

          The paper was peer reviewed by Science magazine.

        • Gordon Robertson says:

          Norman…”Maybe this current article can explain what you are seeing”.

          I expect to hear more from Bates in the near future. NOAA is definitely corrupt and Bates is backed by Judith Curry who was also a prominent figure at NOAA. She devised their archiving system which NOAA leader Karl avoided with his paper on the hiatus.

      • barry says:

        Neville, the differences are probably a result of adjustments to the data / more data being added in for early years. Jones was using the then current version 3 data set, which had far fewer stations in the Arctic than version 4, for example.

        None of the differences are statistically significant. They’re all within error bounds.

        Quoting from the article:

        Temperature data for the period 1860-1880 are more uncertain, because of sparser coverage, than for later periods in the 20th Century.

        The 1860-1880 period is also only 21 years in length. As for the two periods 1910-40 and 1975-1998 the warming rates are not statistically significantly different (see numbers below).

        I have also included the trend over the period 1975 to 2009, which has a very similar trend to the period 1975-1998.

        So, in answer to the question, the warming rates for all 4 periods are similar and not statistically significantly different from each other.

        None of the trends are statistically different from the other, even after adjustments or whatever, and even comparing Jones’ trend estimates to the current data used at the York uni tool. All the error bounds overlap.

        York Uni will very likely include UAH v6 when the methods paper is formally published, which I imagine will be soon, as Roy has advised it had been approved for publication (passed peer review).

    • David Appell says:

      GR says:
      “Its as if the sudden relatively massive spike of the 98 EN skewed the global temps relative to the baseline.”

      UAH’s baseline is 1/1981-12/2010. (That’s the only 30-yr, decade-by-decade interval available in their dataset.)

      So, yes, the 1997-98 temperatures are part of that baseline.

      PS: Trends are independent of the choice of baseline.

      • Gordon Robertson says:

        DA…”UAHs baseline is 1/1981-12/2010. (Thats the only 30-yr, decade-by-decade interval available in their dataset.)

        So, yes, the 1997-98 temperatures are part of that baseline”.

        That’s not the point I was trying to make. The baseline, as you say, is the 1981 – 2010 global average. As such, the baseline (global average) evolves with time. The baseline is also affected by each instantaneous temperature recorded in a range. I want to know how a sudden relatively massive spike like the 1998 EN affected the baseline.

        Did the spike affect the baseline in such a manner as to skew the sudden rise in temperature in 2001? The following La Nina managed to average the EN spike to an extent but not enough to return things to normal. When the smoke had cleared following the LN, the global average had risen by 0.25C and it remained there, albeit with a flat trend.

        That’s suspicious.

        It’s just a thought, not an opinion or assertion.

        I would like to see that tested independently in a model. McIntyre and McKittrick used such a methodology to show that the hockey stick shape acquired by MBH98 could be reproduced using noise in the algorithm employed by MBH98.

        I’d like to see significant data replicated in a model to represent the UAH 35 year range WITHOUT the 98 EN spike then insert a sudden spike in the data to see how it responds.

        I know one thing. If you created a model of an electronic circuit that had no provisions for noise cancellation, and you introduced a sudden massive spike on the input signal, you’d see a weird and wonderful response. However, the response would dampen quickly, and provided nothing blew, the circuit would return to normal.

        The surface-atmosphere interaction on the planet behaves differently and we have no idea what effect that 98 EN spike had, especially not to anomalies that depend on a short term average.

        • David Appell says:

          Gordon Robertson says:
          “The baseline, as you say, is the 1981 2010 global average. As such, the baseline (global average) evolves with time.”

          No, it doesn’t, unless UAH’s past anomalies change (slightly) as a result of corrolating between all the satellites that have been used over time.

        • David Appell says:

          GR says:
          “The surface-atmosphere interaction on the planet behaves differently and we have no idea what effect that 98 EN spike”

          It was caused by an El Nino, taking extra heat out of the ocean and putting it into the atmosphere.

      • barry says:

        Gordon, you might be overthinking the baseline.

        Whatever the baseline, the absolute differences between anomalies will remain the same. The trends, thus, will remain the same.

        97/98 used in the baseline will make the baseline a little higher than without it. But 1997/98 will still have the same numerical difference to every other anomaly.

    • David Appell says:

      GR wrote:
      “Also, how are raw temperatures derived from the satellite AMSU unit? When you receive the signal from the AMSU unit is it in absolute temperature?”

      The satellite receives microwaves, not temperatures. UAH (and RSS) use a model to convert microwave readings into tempertures.

      • Gordon Robertson says:

        DA…”The satellite receives microwaves, not temperatures. UAH (and RSS) use a model to convert microwave readings into tempertures”.

        Microwaves are electromagnetic energy. In the same way, thermometers receive thermal energy from atoms/molecules in the gases in the room’s air or via infrared, which is also EM.

        Oxygen radiates microwave energy that corresponds in frequency to its temperature. What proof do you have that UAH or RSS use models to convert those frequencies to temperature readings?

        The AMSU units receive microwave energy in different frequency bands. Who is to say the units themselves don’t do a direct conversion to temperature?

        My question was geared at ascertaining whether the raw data from the AMSU units are in absolute temperatures or whether those absolutes are recovered later. If so, are they available?

        • David Appell says:

          Gordon Robertson says:
          “The AMSU units receive microwave energy in different frequency bands. Who is to say the units themselves dont do a direct conversion to temperature?”

          Physics says.

          UAH uses a model to convert microwaves into regional average atmospheric temperature. For crying out loud, learn something about UAH actually does before opining about it.

          • Gordon Robertson says:

            DA…”UAH uses a model to convert microwaves into regional average atmospheric temperature”.

            If you don’t mind, I’ll go with an expert opinion. Roy has already covered the issue.

            http://www.drroyspencer.com/2010/01/how-the-uah-global-temperatures-are-produced/

            He describes how the AMSU unit converts microwave radiation to a voltage which is compared to set point temperature-dependent voltages gathered from semiconductor devices.

            Therefore, the microwaves have nothing to do with climate models nor does the conversion of the voltages to temperatures.

            Your understanding of models is primitive. A model is called a model because it synthesizes hypothetical data from programmed code. The satellite data does not need to be synthesized, it’s a genuine representation of atmospheric temps.

            As Roy points out, he wrote programs to convert the digitized voltages transmitted from the sat AMSU units in Fortran, a language that runs on a computer, not a model.

          • barry says:

            As Roy points out in the article, these measurements are not perfect, and undergo adjustments for orbital drift, diurnal drift and instrument heating. The data come from different satellites over time, which have to be adjusted to stitch them together.

            You seem to think that the raw satellite data is a perfect representation of the entire record. It certainly isn’t, which is why there are a dozen or so UAH revisions.

            In truth, UAH satellite data has seen bigger changes from revision than any other data set. Even now some of the past data changes when you the latest month’s data is added. Like other groups, Spencer and Christy are constantly trying to improve their data set.

            Some people think this reprocessing is suspect. Seems they would prefer no improvement be attempted.

          • barry says:

            From Roy’s article.

            Because of various radiometer-related and antenna-related factors, the absolute accuracy of the calibrated Earth-viewing temperatures are probably not much better than 1 deg. C.

            Does this seem like perfect raw data to you, when anomaly values are given by UAH at tenths and hundredths of a degree?

            The law of large numbers comes into play…

            While this sounds like it would be unusable for climate monitoring, the important thing is that the instruments be very stable over time; an absolute accuracy error of this size is irrelevant for climate monitoring, as long as sufficient data are available from successive satellites so that the newer satellites can be calibrated to the older satellites measurements.

            Hopefully it’s clear to you that UAH, like other data sets, have to reprocess the raw data and overcome significant challenges.

          • David Appell says:

            Gordon Robertson says:
            “If you dont mind, Ill go with an expert opinion. Roy has already covered the issue.
            http://www.drroyspencer.com/2010/01/how-the-uah-global-temperatures-are-produced/
            He describes how the AMSU unit converts microwave radiation to a voltage which is compared to set point temperature-dependent voltages gathered from semiconductor devices.”

            That’s exactly what I wrote, Gordon — UAH uses a model to get temperatures from microwave.

            “Therefore, the microwaves have nothing to do with climate models nor does the conversion of the voltages to temperatures.”

            UAH does not use a “climate model,” they use a data model.

            “Your understanding of models is primitive. A model is called a model because it synthesizes hypothetical data from programmed code. The satellite data does not need to be synthesized, its a genuine representation of atmospheric temps.”

            Computer code is merely instructions TO EVALUATE A MODEL.

            “As Roy points out, he wrote programs to convert the digitized voltages transmitted from the sat AMSU units in Fortran, a language that runs on a computer, not a model.”

            Jeez…. A “model” is an abstract idea. The code numerically implements an algorithm (model).

            “Without models, there are no data.”
            – Paul N. Edwards, “A Vast Machine”
            http://pne.people.si.umich.edu/PDF/Edwards_2009_A_Vast_Machine_Introduction.pdf

        • Bindidon says:

          Gordon Robertson says:
          February 5, 2017 at 5:37 PM

          ‘If so, are they available?’

          I told you recently that you can find it in the file ‘tltmonacg_6.0’.

          I can’t give you the complete UAH link, the comment doesn’t pass thru.

          Directory path: data, msu, v6.0, tlt.

          There you see absolute temperatures in K (around 250).

          • Bindidon says:

            Aha. The comment was accepted, and thus it’s time to explain you what you find in the file 🙂

            UAH gives us month by month a 2.5 grid of readings, i.e. 144 longitude x 72 latitude cells.

            The 3 bottommost and topmost latitude stripes, located at the poles, do not contain valuable data (all cells -9999).

            Having such data, you can produce out of it all you want (global or zonal averages and trends).

            But that file I don’t use, there is luckily a level of higher abstraction, containing latitude-corrected anomalies wrt 1981-2010.

          • Bindidon says:

            A little correction: this file imho does not contain measurement data (if this was the case, there would be one file per year, like for the group ‘tltmonamg.1978_6.0’ till ‘tltmonamg.2017_6.0’).

            It will probably be the baseline period file containing, for each of the 9,504 UAH grid cells, the absolute average value computed for the period 1981-2010.

    • Kristian says:

      Gordon Robertson says, February 4, 2017 at 4:33 PM:

      In late 1997, a massive El Nino struck, followed by a La Nina trough that essentially canceled it out, then following the La Nina, temperatures suddenly shot up in 2001 by 0.25C.

      There is no rhyme or reason why that warming should be there. It strikes me as being an artefact of the averaging used to determine anomalies.

      That warming is completely natural, Gordon. It simply follows the progression of ENSO states:
      https://okulaer.files.wordpress.com/2017/01/trinn-3.png

      As you can see, the step-up in global temps (blue) relative to the NINO3.4 SSTa (red) occurred in 1998, not in 2001:
      https://okulaer.files.wordpress.com/2016/10/gl-vs-nino3-4-ssta.png

      Watch how tightly global temps track NINO3.4 between 1999 and mid 2013 (when “The Blob” phenomenon appeared).

      • Gordon Robertson says:

        Kristian…”That warming is completely natural, Gordon. It simply follows the progression of ENSO states…”

        In that case, all ENs should cause a progressive warming and there is no need for the anthropogenic theory.

        The warming to which I referred in 2001 rose from the baseline to about +0.25 C and remained there till 2008. I am referring to the red running average on Roy’s graph.

        The hiatus to which the IPCC referred in 2013 regarding the 1998 – 2012 global average is based on that approximate +0.25 C. That level was established following the 1998 EN and was maintained through the 2010 EN.

        Prior to 1998, the average global warming was below the baseline and trending upward. That was not true global warming but a recovery from warming. The UAH 33 year report refers to true warming as the warming produced by the EN that drove temps above the baseline.

        The 1998 EN drove the average above the baseline, establishing a new average global warming around the +0.25C mark. That +0.25C represents a step function that cannot be explained by EN alone.

        Warming came from somewhere between 1998 and 2015 and it is far to large in magnitude to be explained by anthropogenic warming since it came in one year, 2001.

        • Gordon Robertson says:

          correction….”That was not true global warming but a recovery from warming”.

          should read:

          “That was not true global warming but a recovery from cooling”.

          The cooling has been explained in the UAH 33 year report as being caused by volcanic aerosols from two major eruptions.

        • David Appell says:

          Gordon Robertson says:
          “In that case, all ENs should cause a progressive warming and there is no need for the anthropogenic theory.”

          No. Because there are also La Ninas.

          The ENSOs shift heat around between ocean and atmosphere, they don’t create heat.

          However, since there is now ever more heat in the ocean as a result of greenhouse warming, the El Ninos can be expected to create warmer surface and LT temperatures, and the La Ninas getting warming as well. Both these are found in the observations.

          https://cdn0.vox-cdn.com/thumbor/pouk9bL5kjar4N4OAcQEWYBwuTA=/1400×0/filters:no_upscale()/cdn0.vox-cdn.com/assets/4357789/gistemp_nino_100.jpg

        • Kristian says:

          Gordon Robertson says, February 5, 2017 at 5:25 PM:

          Kristian…”That warming is completely natural, Gordon. It simply follows the progression of ENSO states…”

          In that case, all ENs should cause a progressive warming and there is no need for the anthropogenic theory.

          The warming to which I referred in 2001 rose from the baseline to about +0.25 C and remained there till 2008. I am referring to the red running average on Roy’s graph.

          Gordon, it appears you didn’t bother to look at my two links … Global temps simply track NINO3.4 from 1998/99 to mid 2013.

      • barry says:

        In that case, all ENs should cause a progressive warming and there is no need for the anthropogenic theory.

        Extrapolating the ENSO indices, there are at least 30 el Ninos every 100 years.

        Let’s say they cause a temp rise of 0.02C every time (the difference between 1998 and 2016 el Ninos vis UAH v6, the lowest increase of all global temp data sets.

        That means every hundred years the temp rises by 0.6C.

        Thus during the Medieval Warm Period global temps would have been -6C lower than today. That’s a bit lower than the temps at the bottom of the last glacial period 20K years ago.

        No MWP?

        • Gordon Robertson says:

          barry…”Extrapolating the ENSO indices, there are at least 30 el Ninos every 100 years”.

          I honour the 2nd law of thermodynamics, I don’t think an EN could generate heat from within itself.

          For purposes of your thought experiment, the warming would be in the neighbourhood of 0.2C per EN, not 0.02C.

          We have seen evidence of something going on. In 1977, a mysterious 0.2C warming appeared and was explained away as the Great Pacific Climate Shift, later to become the Pacific Decadal Osccillation.

          I am sure NOAA has expunged it from their records as not masking sense even though many papers were written on it. The other 0.25C is the mysterious 2001 surge to which I have referred. That’s 0.45C of unknown warming.

          You cannot claim the 0.25C from 2001 is due to anthropogenic warming. Allegedly it takes an entire decade for anthropogenic warming of that extent to develop.

          • David Appell says:

            Gordon Robertson says:
            “I am sure NOAA has expunged it from their records as not masking sense even though many papers were written on it.”

            You don’t know any such thing.

            Prove the science wrong instead of cowardly accusing anyone you disagree with as fraudulent or corrupt. You’re even worse than Judith Curry.

        • barry says:

          I honour the 2nd law of thermodynamics, I dont think an EN could generate heat from within itself.

          Nor I, and that’s not the point. You said,

          In that case, all ENs should cause a progressive warming and there is no need for the anthropogenic theory.

          So I tested that assumption working backwards. I lowballed the rise as much as a I could so I wouldn’t be accused of exaggerating.

          But you’ve given me a new figure, ten times as much as mine: 0.2C rise from el Ninos.

          At 30 Ninos a century, that’s 6 degrees of warming.

          Which means 100 years ago the Earth should have been cooler than the bottom of the last glacial period -6C cooler than now.

          Going back to 1000AD, around the time of the MWP, this would have temps at -60C cooler globally than now.

  32. Norman says:

    David Appell

    The Editor of Science (magazine that published the paper) stated this: “Jeremy Berg, Sciences editor-in-chief, said: Dr Bates raises some serious concerns. After the results of any appropriate investigations we will consider our options. He said that could include retracting that paper.NOAA declined to comment.”

    • David Appell says:

      Those are almost all social studies papers or medical papers with small sample sizes.

      Sorry, Norman, CO2 is a heat-trapping gas, and this will never change.

    • David Appell says:

      Norman, doesn’t that Economist article show that science is, indeed, self-correcting?

      • Norman says:

        David Appell

        I may but it would show you can’t trust a single article in a peer reviewed source as it may be incorrect. Peer review helps but does not make something automatically valid.

        • David Appell says:

          No one ever said peer review makes a paper automatically valid, least of all me.

          Peer review ensures:

          1) a paper is not obviously wrong
          2) it meets the journal’s scholarly standards

          • Norman says:

            David Appell

            With your current view of climate change, if you were selected as one of the peer reviewers of two articles. One in which the authors conclude doubling of carbon dioxide in the atmosphere would only raise the Earth’s surface by 0.5 C (climate sensitivity) and the other who determines a rise of 3 C. Would you give both the same balanced treatment? Or would you analyze the lower number much more closely and really try and look for flaws while for the other you would look it over for obvious glaring mistakes but not go so much into the way the data were derived?

            You may be able to do this but can you expect all scientists and reviewers to hold to an integrity that most humans do not possess? I think most people carry around some bias that will cloud their thought process.

          • David Appell says:

            Norman, I resent your implication that I would be dishonest. That paper you like that found a 0.43 C climate sensitivity was junk and I pointed out its flaws to you more than once.

            Since you’re the one who falls for any paper ouside the consensus, you’d be better off asking the same questions of yourself.

          • Lewis says:

            David,

            You jump too quickly to wrong conclusions.

            Norman never said what you accused him of saying.

            Please, pay attention.

            Lewis

          • Norman says:

            Lewis

            Thank you. You seem to understand my point. David Appell I was not
            implying you would be a dishonest peer reviewer. I was stating people including scientists have a bias and will favor some things over others, just human nature. Sorry if that post offended you.

          • David Appell says:

            Norman, thanks. Everyone has biases. In science you’re trained to be as objective as possible, always skeptical, and always critical. No one just goes along in science — scientists argue among themselves all the time, usually friendly, sometimes not, and occasionally one goes after another’s work with sharp knives.

            Let’s face it: people here go for your kind of accusations that it all comes down to bias and “pal review” ONLY BECAUSE YOU CAN’T PROVE THE SCIENCE WRONG.

          • Norman says:

            David Appell

            Your ALL CAPS COMMENT: “ONLY BECAUSE YOU CANT PROVE THE SCIENCE WRONG.”

            But please be specific, what is the science? How much is the Earth’s surface supposed to warm from mankind’s emission of carbon dioxide? What does the science say? Anywhere from 1 C (unlikely) to over 6 C. That is quite the range of global temperatures with considerable effects.

            I am far from done with researching the topic. Your input is of value to me.

          • David Appell says:

            Norman says:
            “How much is the Earths surface supposed to warm from mankinds emission of carbon dioxide? What does the science say? Anywhere from 1 C (unlikely) to over 6 C.”

            First you have to specify what path CO2, CH4, N2O etc human emissions will take.

            And what changes will take place in solar insolation.

            Any huge volcanoes in the future? Tambora-like….

          • Norman says:

            David Appell

            I think you missed my point.

            Your response was: “First you have to specify what path CO2, CH4, N2O etc human emissions will take.

            And what changes will take place in solar insolation.

            Any huge volcanoes in the future? Tambora-like.”

            That does not in any way clarify the “SCIENCE”. What does the science say? It says the range is quite large so there is no specific answer at this time. There is some guesses, that is not science at all. Science is the concrete, the measured the provable.

            Art is the guessing part, the uncertainty, the possible.

            Your very post proves my point. Climate science, with its vast range of predictions for surface temperature warming, is not a science but an art a guess. We are to make policy that effects the world based upon guesses and possibilities? I have seen many graphs of the conglomeration of predictions of climate models of future warming and they end with large ranges in a mess of values at the end point.

            So what does the Science say the warming will end up being with a doubling of carbon dioxide?

          • MarkB says:

            @Norman re two climate sensitivity estimates

            Any paper that makes claims outside of the commonly accepted understanding is going to get more scrutiny than one which agrees with current understanding. I’m not sure that’s so much a matter of bias as there being a heavy burden of proof on claims that run counter to the existing body of evidence.

            If, for instance there is a claim that climate sensitivity is 0.5 C per doubling, that is very difficult to reconcile with mainstream understanding of paleo evidence suggesting a much higher climate sensitivity.

            Dr Spencer has indicated that he believes climate sensitivity is on the low side of the IPCC range. He’s entitled to his opinion of course, but the burden of proof of a low climate sensitivity is higher than that of a broad sensitivity which includes that low range, simply because it is a more specific claim.

          • Norman says:

            MarkB

            Thanks for the reply. I am not sure Paleo research is valid if they assume all the warming and cooling are caused by Carbon Dioxide levels.

            Since I have not had any really attempt to explain my concerns on climate sensitivity, maybe you will give it a go.

            The calculated amount of increase in energy from a doubling of carbon dioxide is given as 3.7 W/m^2. The claim is that this energy alone, added to the Surface/atmosphere coupled system, would raise the Earth’s surface temperature by 1.2 C. With the other feedbacks the estimate for surface temperature increase is 3 C.

            I cannot logically understand how this small of amount of energy could raise the surface temperature 1.2 C. With the Stefan-Boltzmann law you need to add over 5 watts/m^2 to get a blackbody to raise its equilibrium temperature 1 C. This would be an ideal situation. On our Earth’s surface a lot of energy is removed from the surface and transported higher in the Troposphere to raise the temperature of the overall atmosphere at the expense of surface heating (evaporation and thermals).

            I have already pointed this out. You have a backradiation (downwelling IR)) that averages 340 W/m^2 over the entire Earth surface (more in some areas less in others). This entire backradiation then will sustain a surface temperature 33 C above what it would be without such energy input.

            If you take the 33 C and divide into 340 W/m^2 you get that at this rate you would have to add about 10 W/m^2 to raise the surface by 1 C.

            I do not grasp the math and when I look at links David Appell supplies, all the temperature for the surface is what a model run spits out and I have no clue how it is arrived at. It just seems an impossibility as there is not enough energy available with carbon dioxide downwelling IR to raise the surface by 3 C.

          • David Appell says:

            Norman says:
            “I am not sure Paleo research is valid if they assume all the warming and cooling are caused by Carbon Dioxide levels.”

            Paleo research certainly doesn’t assume that.

          • David Appell says:

            Norman says:
            “The calculated amount of increase in energy from a doubling of carbon dioxide is given as 3.7 W/m^2. The claim is that this energy alone, added to the Surface/atmosphere coupled system, would raise the Earths surface temperature by 1.2 C.”

            No. Again you’re taking a value that’s true at the tropospause and applying it to the surface.

            So you are ignoring convection.

            Again, the big advance of the Manabe Wetherald 1967 paper was to add a convection process into their radiative model. In that way they were the first to calculate Earth’s actual average surface temperature.

          • David Appell says:

            Actually everyone here should read the famous Manabe & Wetherald 1967 paper. It’s very well written and unusually clear about what they did:

            “Thermal Equilibrium of the Atmosphere with a Given Distribution of Relative Humidity,” Syukuro Manabe and Richard T. Wetherald, Journal of the Atmospheric Sciences, v24 n3 (May 1967) pp 241-259.
            https://www.gfdl.noaa.gov/bibliography/related_files/sm6701.pdf

        • David Appell says:

          Norman says:
          “Climate science, with its vast range of predictions for surface temperature warming, is not a science but an art a guess.”

          Norman, obviously, no one can calculate future warming without knowing future emissions.

          I’m surprised you don’t get this.

          • Norman says:

            David Appell

            YOU: “Norman, obviously, no one can calculate future warming without knowing future emissions.”

            You should certainly be able to get a very accurate calculation of surface warming without needing to know future emissions for the doubling of carbon dioxide. This would not matter the rate of emission since the end point is doubling, emission rate would only determine the time it took to double. What is the scientific number for surface temperature with a doubling of carbon dioxide?

          • Norman says:

            David Appell

            Convection acts as a surface cooling mechanism in all the global energy budgets, it is not a surface warming mechanism. It removes energy from the surface and warms the overall Troposphere.

            If not for latent heat and thermals the Tropopause would be much colder or at the same temperature but a lot closer to the surface, I am not exactly sure how the dynamics would play out. If it did not change distance from the surface the temperature would be -85 C instead of -51.

            http://www.srh.noaa.gov/srh/jetstream/atmos/layers.html

            The energy taken from the surface by evaporation and thermals warms the troposphere. Also without this added energy the downwelling IR value of 340 W/m^2 would be a lot less since the temperature of the emitting GHG would be a lot less in a cooler atmosphere.

          • David Appell says:

            Norman says:
            “What is the scientific number for surface temperature with a doubling of carbon dioxide?”

            You know that — from the 5AR:

            “Equilibrium climate sensitivity is likely in the range 1.5C to 4.5C”

            That number included the “pause” we now know didn’t exist, so now its probably back up to 2.0C to 4.5C. And limiting warming to 2.0C is now looking very unlikely.

            Anything in this range is a lot of warming — remember the average surface temperature change between a glacial maximum and interglacial is only about 5C.

            Why do you think the CO2 climate sensitivity number has to be more accurate before action should be taken? At this point the science & computing power doesn’t allow more accuracy, and that could well stay true no matter how much computing power is available (see Roe and Baker, Science 2007, http://earthweb.ess.washington.edu/roe/GerardWeb/Publications_files/RoeBaker_Science07.pdf).

            There is an inherent uncertainty involved. But the warming that we know is already at hand is bad enough, and emissions continue unabated. We as a society make decisions all the time in the face of risk and uncertainty. What good is knowing climate sensitivity to three decimal places going to do at this point?

          • David Appell says:

            Norman says:
            “Convection acts as a surface cooling mechanism in all the global energy budgets, it is not a surface warming mechanism.”

            When surface air convects upward, cooler air sinks to the surface. It in turn is heated by the surface, convects upward, etc.

            GHGs (and the Sun) are the surface warming mechanism.

    • David Appell says:

      “Factcheck: Mail on Sundays astonishing evidence about global temperature rise,” Zeke Hausfather, Carbon Brief, 2/5/17

      https://www.carbonbrief.org/factcheck-mail-sundays-astonishing-evidence-global-temperature-rise

      “I recently led a team of researchers that evaluated NOAAs updates to their ocean temperature record. In a paper published last month in the journal Science Advances, we compared the old NOAA record and the new NOAA record to independent instrumentally homogenous records created from buoys, satellite radiometers, and Argo floats. We found that the new NOAA record agreed quite well with all of these, while the old NOAA record showed much less warming.”

    • David Appell says:

      Also see

      “David Rose’s alternative reality in the Daily Mail,” Victor Vehema, 2/5/17
      http://variable-variability.blogspot.com/2017/02/david-roses-alternative-reality-noaa-Karl.html

      • Norman says:

        David Appell

        Thanks for the song link, it was entertaining. Did you go over to the link ren provided that deals with the same issue? Judith Curry takes a stab at it and she is a trained and qualified climate scientist.

        • David Appell says:

          Victor Venema and Zeke Hausfather are also scientists, and neck deep in the data in a way that Curry certainly is not.

          Did you read the recent Hausfather et al paper that verified the SST changes that went into Karl et al?

          Did you notice that David Rose didn’t even even adjust the time series he compared to be on the same baseline. Amateur hour.

          I now longer read ren’s comments because he writes about meaningless things.

        • David Appell says:

          “What he fails to mention is that the new NOAA results have been validated by independent data from satellites, buoys and Argo floats and that many other independent groups, including Berkeley Earth and the UKs Met Office Hadley Centre, get effectively the same results.”

          – Zeke Hausfather, Carbon Brief, 2/5/17

          https://www.carbonbrief.org/factcheck-mail-sundays-astonishing-evidence-global-temperature-rise

          Their paper was:

          “Assessing recent warming using instrumentally homogeneous sea surface temperature records,” Zeke Hausfather et al, Science Advances, 1/4/2017.

          http://advances.sciencemag.org/content/3/1/e1601207

        • Norman says:

          David Appell

          I do appreciate your research and links. You do want to go deeper into things and to me that is a good quality.

          I looked at your Peter Thorne link about Dr. Bates (he has a PhD).

          He claims Dr. Bates was not involved in the area of concern: Quote: “The ‘whistle blower’ is John Bates who was not involved in any aspect of the work. NOAA’s process is very stove-piped such that beyond seminars there is little dissemination of information across groups. John Bates never participated in any of the numerous technical meetings on the land or marine data I have participated in at NOAA NCEI either in person or remotely.”

          But if you look at John Bates bio on Judith Curry site it makes a different claim.
          “John Bates received his Ph.D. in Meteorology from the University of Wisconsin-Madison in 1986. Post Ph.D., he spent his entire career at NOAA, until his retirement in 2016. He spent the last 14 years of his career at NOAAs National Climatic Data Center (now NCEI) as a Principal Scientist, where he served as a Supervisory Meteorologist until 2012.”

          It seems he spend 14 years working in the very division NCEI

          Also: “He was awarded a U.S. Department of Commerce Gold Medal in 2014 for visionary work in the acquisition, production, and preservation of climate data records (CDRs).”

          Seems he would be directly connected to climate data from this source.

          • David Appell says:

            Bates bio *doesn’t* say he worked on the reseaech team behind the Karl et al study. That was what Peter Thorne wrote.

          • Norman says:

            David Appell

            Roy Spencer speaks well of John Bates on WUWT (they have a really long discussion on the Article in the Daily Mail).

            Roy Spencer: “Ive know John Bates for many yearshe spearheaded the archival of long-term satellite datasets at NOAA. As others have pointed out, note that people like him (and me) tend to speak out only after resigning/retiring from government service. Otherwise its career suicide.”

          • David Appell says:

            So?

            Science magazine *independently* analyzed the Karl et al data and methodology, independent of any office politices are NOAA. They took *longer* than usual to peer review the paper, and found it worth publishing.

            And then there’s this:

            “There may also be something beyond simple engineers vs. scientists tension behind Bates decision to go public with his allegations. Two former NOAA staffers confirmed to Ars that Tom Karl essentially demoted John Bates in 2012, when Karl was Director of NOAAs National Centers for Environmental Information. Bates had held the title of Supervisory Meteorologist and Chief of the Remote Sensing Applications Division, but Karl removed him from that position partly due to a failure to maintain professionalism with colleagues, assigning him to a position in which he would no longer supervise other staff. It was apparently no secret that the demotion did not sit well with Bates.”

            https://arstechnica.com/science/2017/02/article-names-whistleblower-who-told-congress-that-noaa-manipulated-data/

  33. ren says:

    When in the winter increases the speed of the solar wind, the temperature drops in the Arctic.
    http://umtof.umd.edu/pm/pm_2week.imagemap?326,123
    http://ocean.dmi.dk/arctic/plots/meanTarchive/meanT_2017.png

  34. ren says:

    Dozens of people in Afghanistan and Pakistan were killed after heavy snow and avalanches hit over the weekend.

    In eastern Afghanistan, at least 50 people died and dozens more were missing on Sunday after an avalanche buried a village in Nuristan, provincial governor Hafiz Abdul Qayum said.
    http://www.reuters.com/article/us-afghanistan-snow-idUSKBN15K081

  35. ren says:

    Is this the global warming in North America?
    http://files.tinypic.pl/i/00866/s0b8njd74pgg.png

  36. ren says:

    “In the following sections, I provide the details of how Mr. Karl failed to disclose critical information to NOAA, Science Magazine, and Chairman Smith regarding the datasets used in K15. I have extensive documentation that provides independent verification of the story below. I also provide my suggestions for how we might keep such a flagrant manipulation of scientific integrity guidelines and scientific publication standards from happening in the future. Finally, I provide some links to examples of what well documented CDRs look like that readers might contrast and compare with what Mr. Karl has provided.”
    https://judithcurry.com/2017/02/04/climate-scientists-versus-climate-data/

    • Gordon Robertson says:

      ren….excellent article on NOAA corruption by a leading climate scientist, Judith Curry.

      Tom Karl of NOAA seems to be the James Hansen of NASA GISS. Scientists have no business politicizing science or acting on behalf of eco-alarmists. They can do what they like on their own time but during business hours they need to do science that is beyond politics.

      I hope the Trump admin deals with Karl appropriately, hopefully by firing him.

    • barry says:

      Gordon…

      Judith Curry did not write the article.

      I hope all your other comments are based on a higher level of perspicacity than this.

      I trust that, like a proper skeptic, you will read the opposing opinions and rebuttals. The Bates article may be well overblown.

      • Gordon Robertson says:

        Barry..”Judith Curry did not write the article”.

        I stand corrected, it was John Bates. I presumed incorrectly that it was Judith since it was on her site.

        All the same, Judith endorses John Bates as having high integrity and that’s good enough for me. The article did serve to reveal the corruption at NOAA, a corruption that needs to be fixed. Tom Karl should be fired.

        Not interested in the opposing cover ups and propaganda. I regard the sources as immature idiots. I have tried to read them in the past and I know how much they lie. The Climategate emails is full of them.

      • barry says:

        Not interested in..

        Reading anything that might shine a brighter light on the matter. You will assume anything alternative could only be invalid, and never bother yourself to find out.

        Thank you for your candour.

        • David Appell says:

          GR says:
          “Not interested in the opposing cover ups and propaganda. I regard the sources as immature idiots.”

          Rarely do you see such an admission of rawa and extreme bias.

          This statement of Gordon’s, admitting he’s unwilling to consider both sides, invalids anything he says here, and in the future.

    • barry says:

      Trump can’t fire him. Karl retired last year.

  37. Harry Cummings says:

    I can hear DA down under

    Regards
    HC

  38. ren says:

    As you can see below CO2 does not have the ability of accumulation and heat abstraction, such as water vapor.
    https://earth.nullschool.net/#current/chem/surface/level/overlay=co2sc/equirectangular

  39. ren says:

    Again, over the California atmospheric river.
    http://files.tinypic.pl/i/00867/bq1pelymnsn6.png

  40. barry says:

    Gordon, since it’s a recurring issue, I looked more closely at what the IPCC said about the ‘hiatus’ in the technical summary. Here is the quote:

    Despite the robust multi-decadal warming, there exists substantial interannual to decadal variability in the rate of warming, with several periods exhibiting weaker trends (including the warming hiatus since 1998) (Figure TS.1). The rate of warming over the past 15 years (19982012; 0.05 [0.05 to +0.15] C per decade) is smaller than the trend since 1951 (19512012; 0.12[0.08 to 0.14] C per decade). Trends for short periods are uncertain and very sensitive to the start and end years. For example, trends for 15-year periods starting in 1995, 1996, and 1997 are 0.13 [0.02 to 0.24] C per decade, 0.14 [0.03 to 0.24] C per decade and 0.07 [0.02 to 0.18] C per decade, respectively.

    So, even from the technical summary, where you source your ideas, there is not ‘no trend’ there is a small trend consistent with commentary in other parts of the IPCC report.

    Again, the technical summary emphasises that short-term trends are highly uncertain, sensitive to changing the period by only a year, and do not necessarily reflect long-term trends.

    Which is what I said months ago when you started saying IPCC ‘agrees there has been no warming since 1998.’

    It seems you have ignored everything IPCC says about the issue and except for your exclusive fcus on the word hiatus.

    • barry says:

      Link to IPCC 2013 technical summary here:

      https://www.ipcc.ch/report/ar5/wg1/

      • Gordon Robertson says:

        barry…on page 5 of the technical summary at the link you provide states:

        “Despite the robust multi-decadal warming, there exists substantial interannual to decadal variability in the rate of warming, with several periods exhibiting weaker trends (including the warming hiatus since 1998) (Figure TS.1). The rate of warming over the past 15 years (19982012; 0.05 [0.05 to +0.15] C per decade…”

        Wonder how the -ve sign got omitted from the -0.05 on the error margin?

        • David Appell says:

          Gordon Robertson says:
          “Wonder how the -ve sign got omitted from the -0.05 on the error margin?”

          The negative sign is in the IPCC document.

          IPCC 5AR TS section TS.2.1 pg 37.

        • Gordon Robertson says:

          barry…I just found out. Roy’s site is removing the -ve sign. The site also omitted the hyphen between 1998 and 2012.

        • barry says:

          Fair cop.

          Yeah, the 1998-2012 trend is positive, flat or negative to 95% confidence limits. Why I never claim, based on that data alone, that there has been a trend or no trend. Not enough information, too much uncertainty.

    • Gordon Robertson says:

      barry…”So, even from the technical summary, where you source your ideas, there is not no trend there is a small trend…”

      The trend is stated as 0.05 [0.05 to +0.15] C per decade in your quote. That error bars should read {-0.05 to +0.15). I agree there’s an insignificant trend the question arises, based on the error margins, whether it is a warming trend or a cooling trend.

      I don’t care either way since 5/100ths of a degree C is insignificant in my books. The significant things is that it has persisted for 18 years.

      This is the link and quote I posted before. The quote is on page 6.

      “Despite the robust multi-decadal timescale warming, there exists substantial multi-annual variability in the rate of warming with several periods exhibiting almost no linear trend including the warming hiatus since 1998. The rate of warming over 19982012 (0.05C [0.05 to +0.15] per decade)…”

      http://www.climatechange2013.org/images/uploads/WGIAR5_WGI-12Doc2b_FinalDraft_Chapter02.pdf

      • Gordon Robertson says:

        note Roy’s site is removing -ve signs and hyphens.

        This “The rate of warming over 19982012 (0.05C [0.05 to +0.15] per decade)”

        should read:

        “The rate of warming over 1998 to 2012 (0.05C [ -0.05 to +0.15] per decade)”

      • David Appell says:

        Gordon Robertson says:
        “The significant things is that it has persisted for 18 years.”

        1998 to 2012 is not “18 years.”

      • barry says:

        You’re citing a pre-publication draft which was revised before the government reps, corporate reps and NGOs signed off on it.

      • barry says:

        Other points well taken.

        I maintain that the period is too short to make any extrapolation out to the future. The period since 1998 does not tell us what to expect in the future.

  41. ren says:

    The map above is fake. NOAA has almost no temperature data from Africa, and none from central Africa. They simply made up the record temperatures.

  42. jimc says:

    “Exposed: How world leaders were duped into investing billions over manipulated global warming data”

    “In an exclusive interview, Dr Bates accused the lead author of the paper, Thomas Karl, who was until last year director of the NOAA section that produces climate data the National Centers for Environmental Information (NCEI) of insisting on decisions and scientific choices that maximised warming and minimised documentation in an effort to discredit the notion of a global warming pause, rushed so that he could time publication to influence national and international deliberations on climate policy”.

    http://www.dailymail.co.uk/sciencetech/article-4192182/World-leaders-duped-manipulated-global-warming-data.html

  43. barry says:

    Gordon, I believe you mentioned above that a purported step-jump in atmospheric temps 2001/2 might have come from the oceans.

    However, in about 2002 the oceans had a massive spike in heat content, and we’d expect to see the opposite if oceans gave up heat to the atmos then.

    http://tinyurl.com/jbf2xco

    • David Appell says:

      Perhaps, but the ocean has 1,000 times the heat capacity of the atmosphere, so it only takes a little ocean heat to warm the atmosphere.

    • barry says:

      Sure, but the sign of ocean heat content over time is incompatible with atmospheric warming. It jives, however, with the notion that oceans have been pulling heat from the atmosphere.

      • David Appell says:

        Not true at all.

        Ocean heat content is increasing rapidly. So is the lower atmosphere.

        • Norman says:

          David Appell

          Your comment: “Ocean heat content is increasing rapidly. So is the lower atmosphere.”

          Is that really the rapid increase you indicate?

          This article puts things into a little perspective.

          https://scripps.ucsd.edu/news/distinct-rise-global-ocean-temperatures-detected

          From the article: “Researchers led by Dean Roemmich, a physical oceanographer at Scripps Institution of Oceanography, UC San Diego, found that the top 2,000 meters (6,500 feet) of the worlds oceans warmed at a rate of 0.4 to 0.6 watts per square meter (W/m 2) between 2006 and 2013. The rate translates to a warming of roughly 0.005 C (0.009 F) per year in the top 500 meters of ocean and 0.002 C (0.0036 F) per year at depths between 500 and 2,000 meters.”

          0.4 to 0.6 W/m^2 over 7 years is not a huge increase. With the ocean warming at the furious rate of 0.005 C a year it will take 200 years at this rate to increase the ocean temperature 1 C which then can only warm the air above the same 1 C. Not sure what the drastic threat is in this data. The large number of joules is because the ocean mass is so great.

          • Norman says:

            David Appell

            To demonstrate in another fashion that this ocean heat content rise is not as significant as some would want it to seem.

            The upper atmosphere receives 174,000 Terawatts of power from the Sun.

            https://en.wikipedia.org/wiki/Solar_energy

            In barry’s ocean content graphs it shows an increase in ocean heat content (OHC) of close to 35 x 10^22 joules in 35 years for ocean water from 0-2000 meters.

            This seems like a lot to you from your posting.

            So the Earth’s upper atmosphere would receive
            192,054,240,000,000,000,000,000,000 joules in the same 35 year time frame (1.92 x 10^26 joules).

            This amounts to the OHC is only 0.18% of the energy received by Earth’s upper atmopshere. Or 1 part in 548. It is not a lot of the total energy streaming in.

          • David Appell says:

            Norman, I don’t know what you’re trying to calculate here.

            Almost all the energy from the sun and greenhouse gases goes into the ocean — about 93% on average.

          • David Appell says:

            Norman says:
            “….it will take 200 years at this rate to increase the ocean temperature 1 C which then can only warm the air above the same 1 C.”

            Umm, no.

            Try again. delta(Q)=mc*delta(T)

          • Norman says:

            David Appell

            YOU: “Norman, I don’t know what you’re trying to calculate here.

            Almost all the energy from the sun and greenhouse gases goes into the ocean — about 93% on average”

            I was trying to point out most the energy the Earth receives from the Sun is also leaving the system via radiant heat loss.

          • Norman says:

            David Appell

            I am not sure what the symbols are in your equation.

            YOUR equation: “Try again. delta(Q)=mc*delta(T)”

            How could 30 C ocean water warm the atmosphere above to a temperature greater than 30 C? I would need a better explanation than an equation. I do not understand your point here.

          • David Appell says:

            Norman says:
            “How could 30 C ocean water warm the atmosphere above to a temperature greater than 30 C? I would need a better explanation than an equation. I do not understand your point here.”

            Are you seriously telling me you can’t calculate mc for the atmosphere and for the ocean?

          • Norman says:

            David Appell

            Please don’t evade my question with a question.

            I asked the question of how can 30C ocean water heat the atmosphere above grater than 30 C?

            Your response was a question: “Are you seriously telling me you cant calculate mc for the atmosphere and for the ocean?”

            David you can put an aluminum bar in 25 C water.

            https://en.wikipedia.org/wiki/Heat_capacity

            Even though the heat capacity of the aluminum is much less than water the aluminum bar in the water will not warm above 25 C.

            Not sure what you are trying to describe. It does not make sense to me. It does not matter if water can hold 1000 times the heat as air, a 30 C temperature water will not raise the air temperature above 30 C.

        • David Appell says:

          Norman says:
          “With the ocean warming at the furious rate of 0.005 C a year it will take 200 years at this rate to increase the ocean temperature 1 C which then can only warm the air above the same 1 C.”

          It’s not the ocean warming, it’s the ocean heat. All of it doesn’t stay in the ocean in the long run.

          You should calculate how much, say, 1e22 J of ocean heat would warm the atmosphere. You’ll be surprised.

          BTW, do you know what the difference in global mean SST was between today and the peak of the last glacial maximum? Only 2 C.

          • Norman says:

            David Appell

            If I did my math correctly I would get a temperature rise of 1.87 K with an addition of 10^22 joules. Is this correct? That is if no losses took place.

          • David Appell says:

            Norman, yes, I also get an atmo warming of about 1.9 K per 1e22 J.

            In the last 10 years, the 0-2000 m region of the ocean has gained 108 ZJ of energy, or about 10*(1e22 J).

            So that would be, in the atmosphere, a change of about 19-20 K. Huge.

        • David Appell says:

          Normann says:
          “0.4 to 0.6 W/m^2 over 7 years is not a huge increase.”

          It sure is.

          I get 0.50 W/m2 for their time period, so I believe their number.

          Do you know the radiative forcing for the Milankovitch factor that affects solar insolation is equivalent to a radiative forcing of -0.45 W/m2?

          https://www.skepticalscience.com/Milankovitch.html

          And look what that accomplishes. (Here I’m being loose about comparing an RF to an energy input.)

          How long does it take for 0.5 W/m2 to warm the top 2000 meters of the ocean by 2 C? Several centuries, probably. So humans are doing in a few centuries what nature takes about 10,000 years to do (interval between last glacial maximum and the start of the Holocene).

          • Norman says:

            David Appell

            Your Skepticalscience link is limited. Globally the Milankovitch cycyles are very small but they are quite large at in the upper Northern Hemisphere.

            http://www.climatedata.info/forcing/milankovitch-cycles/

            The greatest differences in July solar energy to the Arctic is about 100 W/m^2. Quite significant to keep ice from melting during the Arctic summer and accumulating.

          • Norman says:

            David Appell

            A 0.5 W/m^2 energy difference will only warm the water until the water reaches an radiant equilibrium with the incoming energy.

            The 0.5 Watt difference: Note at 288 K the ocean surface would be emitting 390.08 W/m^2 (for simplicity I am assuming a blackbody radiator it really does not matter as long as the emissivity is not changing in either case and since both cases are ocean water the emissivities will be the same).

            In order to have an imbalance of 0.5 W/m^2 you would have to have a total energy (Net in – net out) of 390.58 W/m^2. Once the ocean temperature reaches the temperature that it radiates at 390.58 W/m^2
            it will no longer have an energy imbalance and will no longer heat unless the input energy goes up.

            The equilibrium ocean surface temperature for 390.58 W/m^2 will be reached when the ocean surfce increases by 0.09 C (or K).

            The rate of ocean warming is given as 0.005 C/year. In 18 years of the current imbalance the ocean will have reached an equilibrium temperature with the incoming imbalance and stop gaining energy at that point. It will be losing energy at the same rate it had been gaining energy.

          • David Appell says:

            Norman, yet again, an energy imbalance at a certain latitue is not the same as a global radiative forcing.

            When are you finally going to get this??

          • David Appell says:

            Norman says:
            “In order to have an imbalance of 0.5 W/m^2 you would have to have a total energy (Net in net out) of 390.58 W/m^2. Once the ocean temperature reaches the temperature that it radiates at 390.58 W/m^2
            it will no longer have an energy imbalance and will no longer heat unless the input energy goes up.”

            Norman, I’m really getting tired of your half-assed conjectures.

            Your numbers are 0th-order calculations and not reality.

            The ocean doesn’t warm without the atmosphere warming too.

            Seriously, have every taken a physics course in your life?

            Ever studied any climate science? If so, what?

            No comment on my reply about convection at the surface? You always ignore comments that prove your previous comment wrong, like everyone else here.

          • David Appell says:

            Norman says:
            “The rate of ocean warming is given as 0.005 C/year.”

            No, it isn’t. That’s for some subregion of the ocean.

            Did you yet calculate dQ/dT (=mc) for the ocean and for the atmosphere?

  44. barry says:

    NOAA now have 5 consecutive 3-month Nina conditions, and have officially called a la Nina for the consecutive 3-month periods July/Aug/Sep to present.

    http://www.cpc.ncep.noaa.gov/products/analysis_monitoring/ensostuff/ensoyears.shtml

  45. ren says:

    Is this the global warming in North America?
    http://images.tinypic.pl/i/00867/vjcelp64hfr0.png

  46. ren says:

    Many people still believed trapped under heavy snow and avalanches that have killed more than 100 people in Afghanistan and Pakistan. In the deadliest incident, at least 50 people died in one village after an avalanche in Nuristan, a northeastern Afghan province on the Pakistan border. Bilal Sarwary has more from Kabul.
    https://www.youtube.com/watch?v=72mmRTesLC8

    • Snape says:

      Barry:

      Just realized there’s a small complication in trying to calculate UAH trend for ENSO neutral years. Remember the approximately 4 month lag time between ONI and lower troposphere?

      Don’t know how much difference this makes but it’s something to consider.

      • ren says:

        http://www.cpc.ncep.noaa.gov/products/analysis_monitoring/ensostuff/detrend.nino34.ascii.txt
        YR MON TOTAL ClimAdjust ANOM
        2016 7 26.98 27.37 -0.39
        2016 8 26.39 27.02 -0.63
        2016 9 26.20 26.94 -0.74
        2016 10 26.04 26.91 -0.87
        2016 11 25.96 26.88 -0.93
        2016 12 26.08 26.80 -0.72
        2017 1 26.07 26.61 -0.55

      • barry says:

        I mentioned the lag above, Snape. I’ve seen work with a 5-month offset.

        I deleted all ENSO months with a 5-month lag and got a slightly negative trend since 1998. I also replaced all ENSO months (with 5-mo offset) with the average anomaly for the period. Same result.

        • Snape says:

          Oops. I skipped over a bunch of posts. You’re very thorough!

          The bigger problem is without El Nino/La Nina years, and without Pinatubo years, the remaining UAH record is really short. (Guessing you already mentioned this as well).

        • Snape says:

          Well, this would seem to support Bob Tisdale’s belief that El Nino’s are responsible for the warming trend. (As wacky as it sounds). Tamino, on the other hand, made similar calculations with surface records and the results were opposite. Warming)

          • David Appell says:

            Tisdale’s idea is whacked. Where does the heat from the El Ninos come from?

          • barry says:

            As I posted above, if el Ninos are responsible for all the warming, work backwards to see what temps should have been 100 and 1000 years ago.

            If Ninos add 0.2C on average, then the globe should have been 0.6C cooler 100 years ago (which is actually less than what happened), and -6C cooler during the MWP.

            Seems unlikely. Last time global temps were that cold North America was half covered in ice sheets hundreds of meters thick and the oceans were 100 meters lower (20k years ago, bottom of the last glacial period).

          • Kristian says:

            David Appell says, February 7, 2017 at 12:05 AM:

            Tisdale’s idea is whacked. Where does the heat from the El Ninos come from?

            Where do you think it comes from? Perchance heard of that big shiny thing in the sky?

          • Kristian says:

            barry says, February 7, 2017 at 3:03 AM:

            As I posted above, if el Ninos are responsible for all the warming, work backwards to see what temps should have been 100 and 1000 years ago.

            If Ninos add 0.2C on average, then the globe should have been 0.6C cooler 100 years ago (which is actually less than what happened), and -6C cooler during the MWP.

            *Sigh*

            I’ve discussed this exact subject with you here on this blog before, barry.

            El Ninos aren’t responsible. The ENSO process, fuelled by the Sun, is. Since 1976/77 (The Great Pacific Climate Shift) it has worked towards warming. Between the 40s and the mid 70s it worked towards cooling. How hard is this?

            No one ever said or claimed or suggested that ENSO always warm the Earth and only that. This is a stupid, stupid straw man.

            Get over it. And move on.

          • barry says:

            You think I comment on this apropos of nothing? Gordon posited just that above, and, apparently, Bob Tisdale. I’ve also seen it posited elsewhere.

            If no one had mentioned it, neither would I, to rebut the notion.

            Climb off your high horse, eh?

          • Kristian says:

            So you’ve completely forgotten about how the two of us discussed this very subject only a couple of months ago on this blog?

            Because here you’re at it again about how you don’t buy that El Ninos can cause warming, because if they did, then the global temp during the MWP would necessarily have been 6 degrees lower than today!? As if anyone has ever claimed that El Ninos have always caused constant global warming ever since the phenomenon first started operating …!

            You still don’t know about the Great Pacific Climate Shift of 1976/77? Never heard of it? Not interested?

          • barry says:

            No, I remember, and now I’m talking about what other people have said.

            Snape: Well, this would seem to support Bob Tisdales belief that El Ninos are responsible for the warming trend.

            Gordon: In that case, all ENs should cause a progressive warming and there is no need for the anthropogenic theory.

            As if anyone has ever claimed that El Ninos have always caused constant global warming

            Gordon’s comment above prompted my first response on it here. The remark is exactly what you claim no one proposed.

            Don’t know if Gordon actually believes it, I just picked up on the comment and followed through. Now you’re making a big deal out of it.

            I looked up the phrase. As I thought, it’s tied to the PDO.

            The shift in the climate regime now is known to have coincided with a shift in the phase of the Pacific Decadal Oscillation (PDO).

            Hartmann & Wendler (2005)

            PDO effect is essentially neutral after a few phases. Temps a few years ago should have been the same as in 1900. That is not the case. PDO is not responsible for long-term warming since the beginning of last century. How could it be?

            Look at the PDO phase around 2010:

            http://www.woodfortrees.org/plot/jisao-pdo/mean:12/plot/jisao-pdo/mean:120/plot/jisao-pdo/mean:360

            That phase of PDO was even cooler than 1900-1910. Allow a little lag and we should have seen temps of the last few years the same as the early 20th century – unless something else is at play over the long term.

            If I am supposed to have simply fallen in line with what you’ve said previously, and abandon discussing similar with others, sorry, I missed my cue.

          • barry says:

            I’ll be damned, Gordon and I agree on something.

            We have seen evidence of something going on. In 1977, a mysterious 0.2C warming appeared and was explained away as the Great Pacific Climate Shift, later to become the Pacific Decadal Osccillation.

          • barry says:

            El Ninos aren’t responsible. The ENSO process, fuelled by the Sun, is. Since 1976/77 (The Great Pacific Climate Shift) it has worked towards warming. Between the 40s and the mid 70s it worked towards cooling. How hard is this?

            ENSO process fueled by the sun? What, more directly than the sun being the engine for all weather on Earth?

            You have a more specific thesis?

            Out of curiosity, I compare solar indices with PDO.

            [Plot]

            Don’t see a whole lot of correlation there.

          • David Appell says:

            Kristian says:
            “Where do you think it comes from? Perchance heard of that big shiny thing in the sky?”

            Except average solar insolation has been slowly decreasing since the 1960s:

            http://spot.colorado.edu/~koppg/TSI/TIM_TSI_Reconstruction.png

          • David Appell says:

            Kristian says:
            “Because here youre at it again about how you dont buy that El Ninos can cause warming, because if they did, then the global temp during the MWP would necessarily have been 6 degrees lower than today!?”

            Your calculation?

          • Gordon Robertson says:

            barry…”Ill be damned, Gordon and I agree on something”.

            Can we agree that Fosters Lager is fair dinkum?

          • Gordon Robertson says:

            Kristian…”El Ninos arent responsible. The ENSO process, fuelled by the Sun, is. Since 1976/77 (The Great Pacific Climate Shift) it has worked towards warming. Between the 40s and the mid 70s it worked towards cooling. How hard is this?”

            In case there’s any doubt, I agree with you. The study by Tsonis et al showed that oscillations like ENSO, the AMO, and the PDO, working in sync and out of sync were causing both warming and cooling.

            Besides, the 2nd law wouldn’t like it too much if a source of heat could generate additional heat. It has to cool sometime, and balance out.

        • barry says:

          El Ninos arent responsible. The ENSO process, fuelled by the Sun, is. Since 1976/77 (The Great Pacific Climate Shift) it has worked towards warming. Between the 40s and the mid 70s it worked towards cooling. How hard is this?

          Easy to comprehend, impossible to swallow. ENSO process fueled by the sun? What, more directly than the sun being the engine for all weather on Earth?

          “The Great Pacific Climate Shift?” Do you mean the fluctuations of the PDO (in which case there should be no warming over the 20th century)? Or have you discovered or invented a term to assert something beyond its original meaning?

          I don’t believe your thesis can explain the long-term warming trend from the beginning of the 20th Century. If it’s internal fluctuations, temps should be about the same now as they were in 1900. Current solar intensity is about the same as then, too.

          • barry says:

            Here’s a plot of the PDO since 1900.

            http://www.woodfortrees.org/plot/jisao-pdo/mean:12

          • Gordon Robertson says:

            barry…”The Great Pacific Climate Shift? Do you mean the fluctuations of the PDO (in which case there should be no warming over the 20th century)?”

            At the time of the GPCS the PDO was yet to be discovered. The sudden uptick of 0.2C in 1977 tipped them off since it was unexplained. One scientist wanted to erase it as an anomaly lacking sense but it’s not clear if her worked for NOAA or GISS.

            Since the 1950s – 1970s were generally cooler than what came before or after, it lends credence to the claims of Tsonis that oceanic oscillations working in sync and out of sync are causing the warming/cooling.

            “ENSO process fueled by the sun?”

            I don’t think it’s all that odd. Syun Akasofu, an astronomer, did pioneer work on the solar wind. He claimed the plasma in the wind, made up of protons and electrons, interacts with the Earth’s magnetosphere and induces electrical currents in the atmosphere, the land, and the oceans.

            Who’s to say those electrical currents don’t affect the weather and climate?

          • Snape says:

            Barry, David, Kristian:

            It makes sense that El Ninos/La Ninas cancel each other out, but what’s the time frame? 10 years, 80 years, who knows? I’m guessing it varies and is mostly random. Has this ever been studied?

          • David Appell says:

            Snape: Decades. Several decades? It’s not exact, and it doesn’t really matter, because the ocean and atmosphere are exchanging heat all the time. It’s just more noticable during ENSOs. Other cycles like the PDO and AMO can also lead to enhanced heat exchange. And more situations, I’m sure.

          • barry says:

            Whos to say those electrical currents dont affect the weather and climate?

            A first step would be to show correlation. Otherwise we’re just going fishing.

            4X and Cooper’s are also fair dinkum. But I don’t drink beer. More for you, then.

          • Kristian says:

            barry says, February 7, 2017 at 11:20 AM:

            “The Great Pacific Climate Shift?” Do you mean the fluctuations of the PDO (in which case there should be no warming over the 20th century)?

            No, I mean the “Great Pacific Climate Shift”. As described by multiple researchers:
            https://okulaer.wordpress.com/2014/06/23/how-the-world-really-warmed-part-ii-step-1/

            Global temps do not track PDO, barry. PDO is an index tracking one certain SSTa pattern (of several) appearing in the North Pacific. The Great Pacific Climate Shift involved a lot more than just a shift in the PDO.

            Try reading about it, barry.

          • barry says:

            You refer to Nathan Mantua’s research. In a 2002 paper he wrote:

            Taken together, these pieces of evidence support the view that There is new and stronger evidence that most of the warming observed over the last 50 years is attributable to human activities

            The GPCS may be more than just the PDO. The causes for the PDO are not well known. Same for the GPCS. But how do you suppose these fluctuations add heat to the atmosphere over the long term (since 1900)? They shift heat around internally, they don’t create energy.

          • barry says:

            Global temps do not track PDO, barry

            There seems to be a correlation with multidecadal global fluctuation.

            http://tinyurl.com/h6ymuoj

            If the global temp record were detrended (in segments, before and after the recent warming from 1976), the correlation would be easier to see.

            As PDO is linked to ENSO regimes, and considering the profound impact ENSO has on global temps during ENSO events, such a correlation wouldn’t seem too surprising.

          • David Appell says:

            Kristian says:
            “Global temps do not track PDO, barry”

            That doesn’t mean they don’t have an influence. Kevin Trenberth, for one, thinks the ~1980-~2000 positive phase of the PDO had a warming influence.

          • Kristian says:

            But how do you suppose these fluctuations add heat to the atmosphere over the long term (since 1900)? They shift heat around internally, they dont create energy.

            barry,

            Heard of The Sun?

            Again, we’re going in circles. We followed the exact same course last time we discussed this subject.

          • Kristian says:

            barry says, February 8, 2017 at 6:53 PM:

            The GPCS may be more than just the PDO. The causes for the PDO are not well known. Same for the GPCS.

            True. That doesn’t mean it didn’t happen. Are you saying CO2 caused it?

            barry says, February 8, 2017 at 7:01 PM:

            There seems to be a correlation with multidecadal global fluctuation.

            PDO is an index of ONE particular SSTa pattern (out of several different ones) in the North Pacific, barry. It is NOT equal to NP surface temps. Hence, it will fluctuate around a mean, essentially flat in the long term. And so I’m not very surprised when not seeing any consistent correlation in long-term trends between the PDO index and global temps.

            Drop the PDO lead. It goes nowhere. And we wouldn’t expect it to.

            As you can see from my previous link, at least three major things happened in the Pacific Basin in 1976/77:
            1) The SOI dropped abruptly from a relatively high to a relatively low mean level.
            2) The ENSO sequence changed from a general westward to a general eastward-propagating progression.
            3) The Pan-Pacific PDV/IPO pattern (which includes the PDO in the North Pacific) switched from a ‘negative’ to a ‘positive’ phase.

            From Mantua & Hare, 2002:
            ftp://ftp.atmos.washington.edu/home/ftp/pub/mantua/PDV/2002_Mantua_Hare_JO.pdf

            “Climate records from around the Pacific Basin contain evidence for strong interannual to interdecadal variability, in special cases with remarkably large-scales (…) of spatial coherence (…). El Nino/Southern Oscillation (ENSO) has long been known to be the prominent source for hemispheric-scale interannual climate variations for the Pacific and the global tropics (…). In the last two decades of the 20th Century, the extratropical Pacific Ocean was in an almost continuous El Nino-like state despite the absence of tropical El Nino events in a majority of those years. This situation, which originated with a strongly anomalous winter in 19761977, has been termed a “climatic regime”, following a regime shift in 1977.”

          • David Appell says:

            Kristian says:
            “Heard of The Sun?”

            What is the evidence that the Sun is responsible for modern warming?

          • barry says:

            “Ever heard of the sun?”

            I have heard the legend while sitting around the campfire after hunting bison.

            Barry: But how do you suppose these fluctuations add heat to the atmosphere over the long term (since 1900)? They shift heat around internally, they don’t create energy.

            Kristian: Ever heard of the sun?

            Seems to imply that the sun is responsible for these ‘shifts’ “adding heat to the atmosphere over the long term.”

            But I think you’re saying something less specific – that the sun is the source of energy for the planet, aren’t you? Which would be a complete non-sequitur.

            But assuming you weren’t making a non-sequitur statement our remarks could be woven together like this.

            “The sun is the cause of the regime shifts adding (/taking) heat from the atmosphere.”

            So how does the sun cause these regime shifts to release/take up atmospheric heat. It would be good to correlate solar variation with these regime changes.

          • barry says:

            PDO is an index of ONE particular SSTa pattern (out of several different ones) in the North Pacific, barry. It is NOT equal to NP surface temps. Hence, it will fluctuate around a mean, essentially flat in the long term. And so Im not very surprised when not seeing any consistent correlation in long-term trends between the PDO index and global temps.

            PDO values are detrended – because it is assumed, as you and I do, that these processes are fluctuations, not causes of warming.

            So you wouldn’t expect to see trend correlation. I was saying that the (multidecadal) fluctuations seem to correlate with global temp (multidecadal) fluctuations.

            Here’s the graph again.

            http://tinyurl.com/h6ymuoj

            It seems we’re agreed that internal processes shift heat around in the short term, and cannot be sources of heat themselves.

            When I’ve queried you on this, you tend to refer to the sun.

            Am I supposed to understand that the sun causes the regime shifts? That the extra heat comes from the sun?

            No, I think you’re referring to the sun as the source of energy for in-system fluctuations, not the cause of of the regime shifts specifically.

            Leaving a great big hole where a mechanism is supposed to be that explains the long-term warming since 1900.

          • Nate says:

            Kristian,

            When you say its the sun, do you mean that more solar energy is being absorbed into the oceans? Do you mean that it is really albedo is changing, e.g. via clouds?

            I guess during el ninos there are changes in where the clouds are over the pacific, and so changes in where the solar heating is occuring. Is this what you are talking about?

          • Nate says:

            Nice presentation of Trenberth’s views on PDO effect on GW rates is here:

            http://blog.hotwhopper.com/2015/08/global-warming-and-pacific-kevin.html

          • Nate says:

            He attributes the changes in GW rates to changes in ocean currents (due to PDO) that cause more or less heat to be sent to the deep ocean.

          • Kristian says:

            barry says, February 10, 2017 at 12:46 AM:

            I have heard the legend while sitting around the campfire after hunting bison.

            Good for you. Now apply to that knowledge some curiosity. Some interest in what the Sun might have been up to lately. Like, checking out some observational records, for instance. You only seem interested in preserving the vague notion that a rise in atmospheric CO2 is apparently doing all of these things to the climate system, when there is no shred of evidence it’s doing anything anywhere, at the same time all too eager trying to bury/dismiss all signs pointing to the Sun and the Ocean being the actual climate controllers.

            Seems to imply that the sun is responsible for these ‘shifts’ “adding heat to the atmosphere over the long term.”

            See, this is what I’m talking about. No, barry. The Sun is the energy provider. The coupled Ocean/Troposphere system is what determines what happens to that energy.

            The solar input to the Earth system hasn’t increased because of a change in TSI, but because of a change in albedo (refl SW). Remember, ASR (solar HEAT) is TSI minus refl SW.

            What specifically causes those sudden regime shifts (towards warming OR cooling) described in the literature, no one really knows. That doesn’t mean they’re not there. They happen. And it’s obviously somehow to do with ocean/troposphere dynamics. Whether or not the Sun somehow ultimately pulls the strings here, we don’t know. But it can’t be ruled out.

            But I think you’re saying something less specific that the sun is the source of energy for the planet, aren’t you? Which would be a complete non-sequitur.

            Not if you move just ONE step further in your thought process and realise that the dynamic (not static) Ocean/Troposphere system is what determines what will happen, in the short and in the long term, to that energy constantly provided by the Sun. You’re unnecessarily dumbing yourself down, barry.

  47. WizGeek says:

    Such bloviated trolling over a simple reporting of a month’s temperature is beyond absurd.

    • Snape says:

      I tend to agree, although most of the comments have little to do with this month’s report. Also, IMO, global warming is a topic that needs to be discussed more, not less.

      • WizGeek says:

        Discussed more? I’ll agree if it means learned scientists measure, research, analyze, publish, and discuss. The armchair, sideline, and secondarily-connected fanatics here need to take their non-related, opinionated rants elsewhere where supposition and presupposition are properly taken with a grain of salt…or an aptly placed cognitive two-by-four. TJMOICBW.

        • Snape says:

          Want real science? Most of these “rants” are supported with links to research. Go for it!

          • Snape says:

            WizGeek
            “….where supposition and presupposition are properly taken with a grain of salt”

            That’s a weird comment. You think the positions of David Appell or Gordon Robertson, for example, are too often accepted as fact? Quite the opposite is true. On this thread, almost every viewpoint, right or wrong, gets vigorously challenged. (Usually wrong in the case of Gordon…lol!)

    • barry says:

      Yes, we’re terrible people.

  48. ren says:

    Is California still raining and whether it is “climate change”?
    http://pics.tinypic.pl/i/00867/d8za1v31g5xd.png

  49. ren says:

    Strong heavy snow will be on the north-eastern United States and in eastern Canada.
    February 10 threatens flooding in California.

    • Gordon Robertson says:

      ren…”Strong heavy snow will be on the north-eastern United States and in eastern Canada”.

      West coast of Canada as well. We set a record at Vancouver International Airport for snow the other day. More snow is expected Wednesday night although a warmer front is due that will hopefully bring rain.

  50. Gordon Robertson says:

    Things are heating up for NOAA.

    http://www.foxnews.com/science/2017/02/07/federal-scientist-cooked-climate-change-books-ahead-obama-presentation-whistle-blower-charges.html

    “Karls neglect of the IPCC data was purposeful, according to John Bates, a recently retired scientist from the National Climactic Data Center at the NOAA. Bates came forward just days ago to charge that the 2015 study selectively used misleading and unverified data effectively putting NOAAs thumb on the scale”.

    In this article, Bates has only covered the SST, in which he claimed NOAA discarded cooler data from buoys and used the warmer temps from ship intake ports. Even the older method of retrieving a bucket of water directly from the ocean and inserting a thermometer showed cooler temps.

    That has not touched on their more dubious practice of slashing 75% of the reporting surface stations in recent times. Since the remaining stations are seriously far apart, NOAA has used climate models to interpolate and homogenize the data. They have omitted cooler stations in their culling while emphasizing warmer stations.

    • David Appell says:

      GR says:
      “In this article, Bates has only covered the SST, in which he claimed NOAA discarded cooler data from buoys and used the warmer temps from ship intake ports.”

      Bates is wrong about that.

      “…the new NOAA record puts more weight on higher-quality buoy records and less weight on ship records (versus the old NOAA record which treated ships and buoys equally).”

      – Zeke Hausfather, 2/5/17, https://www.carbonbrief.org/factcheck-mail-sundays-astonishing-evidence-global-temperature-rise

      Note that Hausfather et al, Science Advances 2017 independently confirmed NOAA’s new record:

      http://advances.sciencemag.org/content/3/1/e1601207

      • Gordon Robertson says:

        DA,…”Note that Hausfather et al, Science Advances 2017 independently confirmed NOAAs new record…”

        So, you expected them to say what? That Bates is right? Somebody is lying and Judith Curry speaks highly of the integrity of Bates.

        I would expect someone who has corroborated a lie to back the lie. Bates is in front of a House hearing committee testifying. They don’t take perjury lightly.

        NOAA’s own satellites, from which UAH makes their data sets, has confirmed the lie.

        It’s like with the Mann hockey stick. The only people who confirmed it were his students and his associates.

        In his assessment of the hockey stick, statistician Wegman claimed that Section 9 of the IPCC review was nepotic. They cited only the works of colleagues and they were all cozy with Mann.

        When Susan Solomon, an IPCC poobah, instructed section 9 to investigate the use by MBH98 of pine tree bristle cone, they ignored her. NAS had already told them it was inadmissible and their 20th century warming was based on it.

        When Bradley of MBH98 went after Wegman he charged him with plagiarism not with a faulty assessment. The nerve. Wegman was investigating MBH98 and Bradley charged him with plagiarism.

        • David Appell says:

          Gordon Robertson says:
          “So, you expected them to say what? That Bates is right?”

          Hausfather et al was published a month BEFORE Bates spoke to David Rose.

          Sheesh.

    • ren says:

      An active storm track returns to the West over the next five days. Two storm systems are lined up. In the Northeast, I’m forecasting light snow accumulations through the weekend.

      California: This is where the heaviest snow accumulations will occur over the next five days. Two different storm systems are lined up for Tahoe south to Mammoth. The first storm delivers 1-3 feet of snow accumulation between Thursday and Saturday morning. The second storm system delivers another 1-2 feet between Sunday night and Tuesday. Both storm systems are quite warm and windy, so the heaviest snow will stay above 7,000 feet in elevation.
      http://www.onthesnow.com/news/a/624694/2-2-snow-before-you-go–storm-surge-returns-to-west

    • David Appell says:

      By the way, Gordon, it wasn’t even Karl et al that calculated the new SSTs, it was a prior study.

      Huang et al, JCLI, Feb 2015.
      http://journals.ametsoc.org/doi/10.1175/JCLI-D-14-00006.1

      The following is from a blog post by Peter Thorne, a member of NOAA’s team:

      “BATES: 6. ‘They had good data from buoys. And they threw it out […]'”

      “THORNE: v4 actually makes preferential use of buoys over ships (they are weighted almost 7 times in favour) as documented in the ERSSTv4 paper.”

      http://journals.ametsoc.org/doi/10.1175/JCLI-D-14-00006.1

    • David Appell says:

      Finally, here are the YUGE changes NOAA made:

      https://www.carbonbrief.org/wp-content/uploads/2017/02/NOAA-other-group-comparison-1024×819.png

      These adjustments REDUCED the long-term warming trend.

      • WizGeek says:

        And then there’s Dr. John Bates and the subversive Karl Study of 2015. And the deflating IPCC ARs. And the inappropriately placed temperature monitoring stations. And the missing China stations. And East Anglia CRU emails. And the missing “hockey stick”. The rest of the “ClimateGate” events are easily found via your favorite search engine. The so-called “settled science” is going from mildly agitated to significantly destabilized at an ever increasing rate. The writing is on the wall, so to speak.

  51. ren says:

    Anomaly pressure in the stratosphere over the polar circle reached the troposphere.
    http://www.cpc.ncep.noaa.gov/products/stratosphere/strat-trop/gif_files/time_pres_HGT_ANOM_JFM_NH_2017.png

  52. ren says:

    Distribution of ozone shows the course of the jetstream. Visible is a blockage of circulation in the region of Hudson Bay.
    http://images.tinypic.pl/i/00868/46d8ijolctxs.gif

  53. Dr No says:

    2017 will almost certainly start with the weakest, thinnest, smallest arctic ice pack in recorded history. So we are one step closer to living with an ice-free arctic in the summer, and probably sooner than we think.

    “The number of freezing degree days is far lower than any other period on record. Eric Holthaus, a meteorologist and science writer who first posted the chart to Twitter, remarked it illustrated a stunning lack of freezing power over the Arctic. This is happening now, he added. Not in 50 or 100 years now.

    https://www.washingtonpost.com/news/capital-weather-gang/wp/2017/02/01/beyond-the-extreme-scientists-marvel-at-increasingly-non-natural-arctic-warmth/?utm_term=.533ae81304ae

  54. Norman says:

    David Appell

    I looked through your linked article.
    http://geosci.uchicago.edu/~archer/warming_papers/manabe.1967.rad_conv_eq.pdf

    I can’t find the calculations on how they arrived at the value of 2.3 C surface temperature increase with a doubling of Carbon Dioxide.

    I see tables and graphs stating this increase but I do not see how they derived that value in the article. I was looking to find some of their sources that they reference like a paper by Boltz and Falkenberg but was not successful.

    What am I missing. I looked at the math at the end of the article and did not see anything to support their conclusions. Still wondering about it.

    It still seems antiscience to have a given energy input increase a surface to a temperature that a perfect blackbody could not achieve.

  55. Norman says:

    David Appell

    Have you seen this graphic yet. Dustiness may very well explain why both hemispheres got cold during ice ages. Notice that it is most dusty during the coldest periods which can block a lot of incoming solar energy from reaching the surface suppressing temperatures.

    https://upload.wikimedia.org/wikipedia/commons/thumb/b/b8/Vostok_Petit_data.svg/1024px-Vostok_Petit_data.svg.png

    The increase in dustiness can be explained since the summer solar energy in the Arctic was around 100 W/m^2 less (Milankovitch cycles link in a post above). The Arctic got much colder during ice ages. This would create a strong temperature gradient between the Equator and poles, much stronger than now. As you pointed out the ocean temperature did not cool much during the ice age but the polar Arctic would be cold all year round leading to much more intense winds and dustiness that would block out the Sun over the entire globe sinking the global temperatures.

  56. Norman says:

    David Appell

    One of your older points:

    YOU: “That number included the pause we now know didnt exist, so now its probably back up to 2.0C to 4.5C. And limiting warming to 2.0C is now looking very unlikely.

    Anything in this range is a lot of warming remember the average surface temperature change between a glacial maximum and interglacial is only about 5C.”

    I am not sure where you got the only 5C from. All the graphs I look at show a global change of around 12C.

    https://www.google.com/search?q=graph+of+ice+age+temperatures&espv=2&biw=1164&bih=756&tbm=isch&tbo=u&source=univ&sa=X&ved=0ahUKEwi2yIy-_IHSAhUC7YMKHWmQAYsQsAQIHA

    Here is a gob of them. Most I looked at show a range of around 3C above to -9C below or a total of about 12C.

    • David Appell says:

      Those graphs are not sufficiently labeled — I can’t tell what any of them are showing on the y-axis.

    • David Appell says:

      “As the Earth moved out of ice ages over the past million years, the global temperature rose a total of 4 to 7 degrees Celsius over about 5,000 years.”

      http://earthobservatory.nasa.gov/Features/GlobalWarming/page3.php

      • Norman says:

        David Appell

        I think you must be kidding me. You can’t read a clear y-axis label?

        Here is your favorite website and they clearly label the y-axis and it is clearly about 12 C between peak and trough.

        https://www.skepticalscience.com/heading-into-new-little-ice-age.htm

        The last 5000 years were not the peak of the last glaciation. That would be about 18,000 years ago.

        • Norman says:

          David Appell

          You can’t read determine the temperature swings from the first graph in your link? Please!

        • David Appell says:

          Norman says:
          “I think you must be kidding me. You cant read a clear y-axis label?”

          Norman, learn to read an f-ing graph.

          That charge shows the temperature change in *ANTARCTICA*.

          That’s not the change in the global mean.

          Jeez.

          • Norman says:

            David Appell

            Maybe I am wrong in how I read the graph and maybe it is not global but I am not alone in thinking this was the case.

            https://www.technologyreview.com/s/416786/global-warming-vs-the-next-ice-age/

            In this link the writer states: ” Analyses of air trapped in glacial ice over the last 800,000 years show that atmospheric carbon dioxide generally ranged between 200 and 300 parts per million by volume (ppmv); increases in these levels were slightly preceded by increases in temperature caused by natural orbital shifts. During this period, global temperature varied by about 12 oC. Now, carbon levels are approaching 400 ppmv as the burning of fossil fuels pumps more and more carbon dioxide into the atmosphere.”

            The claim in this article is that “Global” temperatures varied by 12 C. I guess the change in carbon dioxide level was the proxy they use to determine global temperatures from the ice cores.

            I could be incorrect and you may be right. I was only indicating I was not alone with my opinion.

          • David Appell says:

            Norman, this guy didn’t specify if “global temperature,” meant the mean global temperature, but if he did, he’s wrong — it did not vary by 12 C.

            Obviously the global mean temperature change is going to be less than the polar mean temperature change. He may well have made the same mistake you did.

            The global mean temperature varies by about 5 C from the last glacial maximum to the start of the Holocene.

          • David Appell says:

            Norman says:
            “I guess the change in carbon dioxide level was the proxy they use to determine global temperatures from the ice cores.”

            Wrong, Norman.

            They look at the variance in the oxygen isotope 18O, called “delta18(O).” Its ratio to 16O is a proxy with with a well-known dependence on temperature.

          • David Appell says:

            Norman says:
            “The claim in this article is that Global temperatures varied by 12 C.”

            Again, he’s wrong. I suspect he made the same mistake you did and assumed changes in Antarctica are the same as the average global change.

  57. Snape says:

    Harry says: “didn’t we here that in 2016, 2015, 2014, 2013, 2912, etc.?”

    More or less. The arctic keeps getting warmer and sea ice is on on a downward spiral.

  58. CO2isLife says:

    Dr Spencer, do you have data on the diurnal temperature variation of the upper troposphere and stratosphere? If CO2 does trap enough outgoing IR to increase temperatures, shouldn’t there be a gradual warming at night of the upper troposphere and stratosphere?

  59. Norman says:

    David Appell

    Some of your older points: “Norman, yet again, an energy imbalance at a certain latitue is not the same as a global radiative forcing.

    When are you finally going to get this??”

    Okay I look up radiative forcing:
    https://en.wikipedia.org/wiki/Radiative_forcing

    Article quote: “A positive forcing (more incoming energy) warms the system, while negative forcing (more outgoing energy) cools it.”

    True enough but what system and how much warming?

    So moving into the article:

    “Radiative forcing can be used to estimate a subsequent change in equilibrium surface temperature (ΔTs) arising from that forcing via the equation:
    {\displaystyle \Delta T_{s}=~\lambda ~\Delta F} \Delta T_{s}=~\lambda ~\Delta F
    where λ is the climate sensitivity, usually with units in K/(W/m2), and ΔF is the radiative forcing.[5] A typical value of λ is 0.8 K/(W/m2), which gives a warming of 3K for doubling of CO2.”

    So where do they get the 0.8 K/(W/m^2)?

    • Norman says:

      David Appell

      Moving from this to the link on sensitivity:
      https://en.wikipedia.org/wiki/Climate_sensitiviy

      In the article the claim is made:
      “CO2 climate sensitivity has a component directly due to radiative forcing by CO2, and a further contribution arising from climate feedbacks, both positive and negative. “Without any feedbacks, a doubling of CO2 (which amounts to a forcing of 3.7 W/m2) would result in 1 C global warming, which is easy to calculate and is undisputed.”

      So where is the easy undisputed calculation that 3.7 W/m^2 will result in a 1 C global warming?

      If you use the most simple model. An isolated blackbody in space with nothing but radiative balance to effect the surface tempearture. At 288 K you need over 5 W/m^2 increase in radiant energy to increase this surface to 289 K (a 1 C increase). I really want to know what the easy to calculate equations are and the undisputed nature of such calculations.

      • Norman says:

        David Appell

        Maybe you think me dense and if this be the case help out my thick skull with an equation that shows how 3.7 W/m^2 can raise a surface at 288 K to 289 K. Thanks in advance.

      • David Appell says:

        Norman, there is no equation — it requires a numerical solution from a model, first accomplished by Manabe and Wetherald.

        But I’m sure, Norman, that you know better than all the thousands of scientists and their thousands of papers that have come beforehand.

        Can’t wait to read your paper. Please send a PDF.

        • Gordon Robertson says:

          DA…”Norman, there is no equation it requires a numerical solution from a model, first accomplished by Manabe and Wetherald”.

          So it’s a fictitious number. The model had to get the ability to calculate the number and it got it from the minds of humans via a program. If the minds are faulty the model is faulty.

          • David Appell says:

            Gordon, you don’t know crap. It shows in every comment you make, and you are utterly unworthy of criticizing a learned scientist like Manabe.

          • Dr No says:

            “The model had to get the ability to calculate the number and it got it from the minds of humans via a program. If the minds are faulty the model is faulty.”

            Gordon, you have out-stupided your earlier comment on sea ice.
            Seriously, have you stopped taking your medications? You sound delirious.

      • David Appell says:

        Norman says:
        “If you use the most simple model. An isolated blackbody in space with nothing but radiative balance to effect the surface tempearture.”

        A model without an atmosphere?

        Automatically precludes convection.

        • Norman says:

          David Appell

          YOU: “Automatically precludes convection”

          What is your point? Convection cools a surface (hot car in sun example when convection is prevented).

          I think you are not understanding. If you add convection you will need even more than 5 W/m^2 to warm a surface.

          So a model makes the claim that and imbalance of energy of 3.7 W/m^2 at the Top of the Atmosphere (Tropopause) will raise the air temperature near the surface by over 1 C and you believe it without any physics links on how this is possible? That means if you have an energy input of less than what it would take to warm a body 1 C it will be possible because of a model output? Really? I think I would need more than that to convince me. I do not understand why you are so solid in your acceptance of a great temperature increase at the surface if it is all based upon a model output and you have no grasp of where this value came from or why it was spit out of the machine.

      • Kristian says:

        Norman,

        The +3.7 W/m^2 of “radiative forcing” is actually 3.7 W/m^2 LESS OUT through the ToA.

        If you increase the surface temperature of a blackbody from 254 to 255 K, its overall radiative output flux would increase by about 3.7 W/m^2. And that’s where that number is from.

        So what is supposed to happen when doubling the atmospheric CO2 content overnight is this: The atmosphere gets a little bit more opaque to outgoing IR from the surface, and so Earth’s effective radiating level (ERL) to space is raised, apparently by about 154 metres on average. Since the average global tropospheric temperature fall-off rate with altitude is allegedly ~6.5 K/km, this means that the ERL, when moving up 154 metres, drops in temperature by 1 Kelvin (6.5K/km*0.154km = 1K).

        Which means that Earth’s T_e (effective radiating temperature) drops from 255 to 254 K, thus emitting to space 3.7 W/m^2 LESS on average than before the doubling. Leading to a positive radiative imbalance at the ToA (because more now all of a sudden comes IN from the Sun than goes OUT from Earth). Leading to warming.

        This imbalance somehow needs to be remedied. Which means that the new and higher ERL needs to warm by 1 degree, from 254 back to the old 255 K, which means that – down via the lapse rate – the old and 154m lower ERL will have to warm from 255 to 256 K. And so on. All the way down to the actual surface. Which will have to warm from 288 to 289 K. That 1 degree simply propagates all the way down to the surface and all the way up to the tropopause. Via the lapse rate. As long as it (and the solar input) stays constant.

        Like this:
        http://www.climatetheory.net/wp-content/uploads/2012/05/greenhouse-effect-held-soden-2000.png

        Completely stupid and unrealistic, of course. But that is how it’s supposed to work. According to “AGW theory”.

        • Norman says:

          Kristian

          Thank you for the explanation. Much more than either David Appell or Dr. No would offer.

          What you describe sounds exactly the idea that C*o*t*t*o*n would bring up. The temperature of the upper atmosphere sets the surface temperature via the lapse rate and not the other way around. My view is that the only way it works is to find out how much the surface would warm and then start your lapse rate up from that which will tell you how much the Tropopause will warm from an addition of incoming energy.

          • Ball4 says:

            Norman: My view is that the only way it works is to find out how much the surface would warm and then start your lapse rate up from that which will tell you how much the Tropopause will warm from an addition of incoming energy.

            Yes, thats correct basic meteorology Norman, additional surface energy though not ASR which is constant.

            Double CO2 too fast for system equilibrium time constant, the OLR at first reduces which is what the latest paper on the subject from CERES team shows us for the longest useful observing period (back to ~2003). Eventually on way to equilibrium with no further added CO2, the OLR would rise back to equilibrate with constant ASR brightness temperature 255K at TOA. The rise forced as a result from the increase in global surface T; follow the standard rise in global T( z) up the trop. lapse from global T( 0) and find the effective emission layer thermometer measured 255K is higher than before the added CO2.

            This (atm. optical depth science) should not be difficult, but too many make it so.

          • Norman says:

            Kristian or Ball4

            If that is correct what you are stating, that the Climate models increase the surface temperature because of an increase in upper atmosphere temperatures and use the lapse rate to figure how much warmer the surface will get, then the science is wrong.

            Here is empirical evidence that proves this idea totally false.

            https://createarcticscience.wordpress.com/2013/03/12/temperature-inversion-in-the-arctic/

            It shows normal inversions in the Arctic in winter. The temperature above is much warmer than surface and not just by 1 C but 20 C! The warmer air aloft does not increase surface temperature. It stops convection.

            I certainly hope that is not how Climate Scientists have determined surface warming.

            Maybe Dave Appell or the mysterious Dr. No would still like to answer how the “science” determines 0.8 K/(W/m^2).

          • Ball4 says:

            Norman: “because of an increase in upper atmosphere temperatures and use the lapse rate to figure how much warmer the surface will get, then the science is wrong.”

            No. The trop. avg. midlatitude lapse rate is a standard slope. All you need to do is use 1LOT energy balance at any one atm. layer along that slope (such as the surface) to then determine standard T(z) at any z (in the standard troposphere). It is easiest to do the energy balance at the surface (as text books explain) since there the input data needed is extensively measured & readily available. You should run thru that process.

            Once you know T(0) and the measured avg. lapse you compute any T(z) up to tropopause. Similarly you can also determine T(tropopause) by energy balance and find standard T(0) from the standard lapse (this is harder as the input data is not as well measured or available).

            What you cannot do is find the actual T(z) & lapse on any given day, that takes more complex radiative transfer energy balance calculations performed at all altitudes above the surface to find T(z) accurately to within CI of sounding results. There are many papers from the decades in which that process was a research interest for your study (if you have the pre-req.s to find them and read/understand them).

          • Kristian says:

            Ball4 says, February 9, 2017 at 4:26 PM:

            Double CO2 too fast for system equilibrium time constant, the OLR at first reduces which is what the latest paper on the subject from CERES team shows us for the longest useful observing period (back to ~2003).

            Ball4, OLR at the ToA is only supposed to be observed to reduce in the purely hypothetical case of an instant doubling, and specifically NOT in the real-world case of an incremental increase.

            And so, if we observe a reduction in OLR over some period of time, we KNOW that it’s not because of the gradual increase in atmospheric CO2 during that same time. It has to be caused by something else.

            And in the case of the OLR going down from 2002/2003 to 2013/2014, we KNOW the cause: Tropospheric temps went down!
            https://okulaer.files.wordpress.com/2017/02/ebaf-ed4-0-vs-uahv6-0.png
            https://okulaer.files.wordpress.com/2017/02/ebaf-ed4-olr-vs-uahv6-tmt.png

          • David Appell says:

            Norman says:
            “Maybe Dave Appell or the mysterious Dr. No would still like to answer how the science determines 0.8 K/(W/m^2).”

            How many times do you need me to repeat the answer?

            2? 5? 20?

            Just give me a number.

          • Ball4 says:

            Kristian: “OLR at the ToA is only supposed to be observed to reduce in the purely hypothetical case of an instant doubling, and specifically NOT in the real-world case of an incremental increase.”

            You have twisted this pretzel basically wrong Kristian, as I wrote, atm. optical depth theory (and OLR observation) is not that difficult. Stick to discussing, linking your pretty temperature graphs, leave OLR, ASR and CI discussion to the CERES experts et. al.

          • Norman says:

            David Appell

            YOUR words: “Where else climate models.”

            For the answer to my question of where the 0.8 K/(W/m^2) came from.

            That is not a science answer. There is no way to follow the trillions of calculations run on a super climate computer program with many complex involved equations.

            You have not “really” answered my question even one time let alone
            2? 5? or 20?

            A blanket answer like “climate models” is not scientifically satisfactory. Do you have an alternative explanation?

          • Norman says:

            Ball4

            I will continue to think on the subject. I will try and read through the long article barry linked to which may have some answers.

            Kristian, I do believe that logically if the Outgoing TOA radiation was less than the incoming then something will heat up. More energy in than out. My concern is what is heating (entire troposphere or more on the surface) and by what amount. I have not been convinced that the climate models are the end of argument answer. I do like your work with graphs. I checked out your links. You seem to have a talent for graph manipulations. I like this talent. Not sure if I agree with your understanding of physics.

          • Kristian says:

            Ball4 says, February 10, 2017 at 7:56 PM:
            “(…) as I wrote, atm. optical depth theory (and OLR observation) is not that difficult.”

            Well, clearly it’s too difficult for you to understand. You talk about reduced OLR over a specific time period AS IF this was somehow evidence of an “enhanced GHE”, when the “theory” on the “enhanced GHE” specifically points out that we do NOT expect to see a reduction in OLR as the “GHE” strengthens incrementally, only in the case of a sudden doubling.

            “Stick to discussing, linking your pretty temperature graphs, leave OLR, ASR and CI discussion to the CERES experts et. al.”

            Finally we can safely put this whole discussion about the validity of the Ed2.8 OLR data to rest. Because now the “CERES team experts” have published the new Ed4.0 data on their website. As a frequent user, I got an email recently (Feb 3) notifying me of this auspicious event. It said in full:

            Dear EBAF-TOA User,

            The CERES team announces the release of Edition 4.0 of the Energy Balanced and Filled (EBAF) Top-of-Atmosphere (TOA) data product. EBAF-TOA Ed4.0 leverages off of the many algorithm improvements that have been made in the Edition 4 suite of CERES level 1-3 data products. EBAF Ed4.0 also includes a limited set of MODIS imager-based cloud parameters alongside the EBAF-TOA fluxes.

            This initial release covers the period March 2000 June 2015. Additional months (through September 2016) will become available later this month.

            For users interested in EBAF surface radiative fluxes, we anticipate releasing EBAF-Surface Ed4.0 in May 2017.

            For more information, please refer to the CERES EBAF Ed4.0 Data Quality Summary:
            https://ceres.larc.nasa.gov/documents/DQ_summaries/CERES_EBAF_Ed4.0_DQS.pdf

            CERES EBAF-TOA Ed4.0 data are available from the CERES Ordering Tool:
            https://ceres.larc.nasa.gov/order_data.php
            which also provides subsetting and visualization capabilities.

            And that’s where I got the global OLR data for those plots from, Ball4.

            This new release builds directly upon, but ultimately supersedes, “the latest paper on the subject from CERES team (…) for the longest useful observing period (back to ~2003)”.

            And so the full global CERES EBAF Ed4.0 OLR at the ToA dataset, as now published and publically available on the CERES site, is what we will need to address from now on.

            And guess what, Ball4. I was right all along, and you were wrong.

          • Kristian says:

            Norman says, February 10, 2017 at 10:51 PM:

            Kristian, I do believe that logically if the Outgoing TOA radiation was less than the incoming then something will heat up. More energy in than out.

            But of course. However, the current positive radiative imbalance at the ToA was caused, not by a reduction in the OUTGOING heat from the Earth (OLR at the ToA), but by an increase in the INCOMING heat from the Sun (ASR at the ToA). The OLR has simply followed tropospheric temps over time, primarily a mere radiative EFFECT of tropospheric temperatures. And so here’s the causal chain as actually observed in the Earth system:

            +ASR -> +T -> +OLR

            There is no trace of an “enhanced GHE” causing warming (accumulation of energy within the Earth system) anywhere in the available radiation flux data (ERBS+CERES). The net accumulation of energy appears to be solely caused by the Sun (+ASR: TSI minus refl SW (albedo)), and rather countered by the OLR increasing with the temps overall.

            I do like your work with graphs. I checked out your links. You seem to have a talent for graph manipulations. I like this talent.

            “Manipulations.” Strange choice of word.

            You can easily reproduce those graphs for yourself. (The OLR data is easily available on the CERES data page.) In the first one I simply took the UAHv6 TLT data from the KNMI Climate Explorer site, where it is possible to change the baseline of the data, so as to match the TLT normal period with the OLR one. I then scaled down the OLR data to sort of match the flux (W/m^2) with the temp (K) (if you raise a blackbody temp from 254 to 255 K, you raise the outgoing radiation flux by ~3.74 W/m^2 (1/3.74 = 0.268), and so this should basically pretty much connect the OLR flux at the ToA and the mean tropospheric temp, the effect and the cause).

            In the second plot I used the UAHv6 TMT data, and there I had to use the 1981-2010 baseline (you could of course spend some time and create your own normals, to make it absolutely correct), but as you can see it’s still a very good match …

          • Ball4 says:

            Kristian: “You talk about reduced OLR over a specific time period AS IF this was somehow evidence of an “enhanced GHE””

            I do, huh? Show me where exactly. Those are your words Kristian, I discuss what the CERES Team writes, has published.

            “And that’s where I got the global OLR data for those plots from, Ball4.”

            Fine, now add proper CIs to your plots so we know which data is meaningful to draw proper OLR conclusions and discuss which early data CERES team writes is not calibratable to within useful CI just as they do.

            “And guess what, Ball4. I was right all along, and you were wrong.”

            No one can tell if Kristian is right as no one has ever seen Kristian apply proper confidence intervals (CI) to the CERES Team data as they do. In fact, Kristian nicely charts & uses early data that CERES team describes as not possible to apply meaningful CIs. And Kristian STILL purports to draw meaningful OLR conclusions – sometimes opposite to CERES Team conclusions (at least up until I pointed their work out to Kristian).

            Very well twisted pretzel Kristian that produces nice non-meaningful charts; truth is CERES Team does better, is meaningful and draws proper OLR conclusions. Again, Kristian, stick to discussing, linking your pretty temperature graphs, leave OLR, ASR and CI discussion to the CERES experts et. al. Learn about OLR nature from them.

          • Ball4 says:

            Norman: “I will try and read through the long article barry linked to which may have some answers.”

            You will find it does, Norman. Keep a copy, refer back when needed. Compare what Kristian et. al. write here to that paper (Kristian should have already so) and certain of its basic. ref.s. Many posters here clearly have not caught up (or do not have the pre-req.s accomplished) to understand that radiative-convective 1978 paper “…to cope with this complex problem,…”.

          • Kristian says:

            Ball4 says, February 11, 2017 at 7:51 AM:

            Kristian: “You talk about reduced OLR over a specific time period AS IF this was somehow evidence of an “enhanced GHE””

            I do, huh? Show me where exactly. Those are your words Kristian, I discuss what the CERES Team writes, has published.

            Hehe, yeah, sure. Here’s what you said (my emphasis):

            Double CO2 too fast for system equilibrium time constant, the OLR at first reduces which is what the latest paper on the subject from CERES team shows us for the longest useful observing period (back to ~2003). Eventually on way to equilibrium with no further added CO2, the OLR would rise back to equilibrate with constant ASR brightness temperature 255K at TOA. The rise forced as a result from the increase in global surface T; follow the standard rise in global T( z) up the trop. lapse from global T( 0) and find the effective emission layer thermometer measured 255K is higher than before the added CO2.

            http://www.drroyspencer.com/2017/02/uah-global-temperature-update-for-january-2017-0-30-deg-c/#comment-237014

            Why did you feel the need to point out that what the “AGW theory” says about reduced OLR “is what the latest paper on the subject from the CERES team shows us for the longest useful observing period (back to ~2003)” if you didn’t intend to suggest that this is somehow evidence confirming what the “AGW theory” is claiming?

            “And that’s where I got the global OLR data for those plots from, Ball4.”

            Fine, now add proper CIs to your plots so we know which data is meaningful to draw proper OLR conclusions and discuss which early data CERES team writes is not calibratable to within useful CI just as they do.

            This is getting tedious. You’re acting like an obstinate child, Ball4. If you doubt the data and plots published by the CERES team itself, on their official website, specifically for the public to use, mind you, all you need to do is write Norman Loeb and ask him whether they are indeed valid or not. I’m sure he’ll be more than willing to help you out. Ask him to produce the CIs. After all, they’re not publically available. However, the CERES team members do discuss at length the high precision (stability) of the CERES instruments over time, and so the confidence in how the flux anomaly data progresses from 2000 to 2016 (as seen in those plots) is surely pretty high, much higher than any temperature record covering the same period. Read the data quality summary.

            “And guess what, Ball4. I was right all along, and you were wrong.”

            No one can tell if Kristian is right (…)

            Yes, the plots above tell us I’m right and you’re wrong, Ball4. Simple as that. The new Ed4 now officially published on the CERES website (with the data quality summary for everyone (including you) to read) finally puts this discussion to rest. In my favour. I know you don’t like that fact. But it’s still a fact.

            Case closed.

            In fact, Kristian nicely charts & uses early data that CERES team describes as not possible to apply meaningful CIs.

            No, Ball4. That’s the new Ed4 data plotted. No “early data”. New, officially endorsed data.

            Sorry about that. You lost.

          • Ball4 says:

            As usual, Kristian circles back, unable to make progress.

            if you didn’t intend to suggest that this is somehow evidence confirming what the “AGW theory” is claiming?”

            I intended to show Kristian’s claims of increasing OLR from CERES data were unfounded, incorrect & that the CERES team showed otherwise (Loeb 2016).

            When that was pointed out Kristian realized he was wrong & changed his claims (at least on this site). Kristian continues making non-meaningful claims on OLR, ASR from CERES Team data as he still does not show conclusions based on proper CIs. Again, Kristian, either make progress or stick to discussing, linking your pretty temperature graphs, leave OLR, ASR and CI discussion to the CERES experts et. al. Learn about OLR nature from them.

      • David Appell says:

        Norman, your model is completely unrealistic.

        “So where is the easy undisputed calculation that 3.7 W/m^2 will result in a 1 C global warming?”

        Who said that calculation must be easy?

        You must solve the Schwarzschild equations with actual CO2 spectra. And you must add convection.

    • David Appell says:

      “…to estimate….”

    • David Appell says:

      Norman says:
      “So where do they get the 0.8 K/(W/m^2)?”

      Where else — climate models.

      • Norman says:

        David Appell

        So it is just a make believe number that has no foundation in physics. An abstract notion that everyone accepts as fact based upon the power of blind belief in the authority of science. That sounds more like a new age religion than a science.

        Why does the article make the claim that the value is easy to calculate and without dispute?

        • David Appell says:

          Norman says:
          “So it is just a make believe number that has no foundation in physics.”

          No, it comes from climate models.

          Do you even understand what a climate model is, Norman? Because I see no evidence that you do….

        • David Appell says:

          Norman says:
          “Why does the article make the claim that the value is easy to calculate and without dispute?”

          What article says that?

        • David Appell says:

          Norman says:
          “An abstract notion that everyone accepts as fact based upon the power of blind belief in the authority of science. That sounds more like a new age religion than a science.”

          Stop acting like Gordon Robertson.

          • Dr No says:

            Norman, your frustration is the same as that of a child in school who cannot grasp the information the teacher is trying to impart. The child eventually learns, but I am afraid you are probably too old to understand the science. Why not take up a hobby such as lawn bowls and where you will hopefully not embarrass yourself like you do here.

        • Massimo PORZIO says:

          Hi Norman,
          there is a big problem discussing with these kind of “scientists”: they are deeply believers.

          They believe in pure statistical models built above simplistic laws of classical physic.

          You are perfectly right asking them where they get the 0.8 K/(W/m^2). Most of them probably knows where, but surely they prefer don’t tell you about it, because in case they reveal it to you, you and probably any other “non statistical scientist” easily would point out the circular arguments they used to get it out.

          Also for that, I suggest you to don’t spend you precious time arguing with people that consider you “a child in school who cannot grasp the information the teacher is trying to impart” and that are afraid that “you are probably too old to understand the science”.
          They are of the very same kind of that “scientist” from the “Politecnico di Torino” who last saturday night went on TV claiming that he where able of measure the different concentrations of PM2.5 and PM10 along the streets of Turin to compute the total amount of them one inhales during a jogging session, just using his smartphone linked to some marvellous “particulate measuring satellites”!!!!!
          So should we have a satellites network flying thousands kilometers above us capable of discerning the PM2.5 and PM10 concentration at ground level with a sampling resolution of few meters?

          Great!

          I found that hilarious, don’t you?

          Someone should tell him that such spatial resolution at ground is a chimera even if he use the latest and smartest software he invented to massage the satellite data.

          Have a great day.

          Massimo

          • Norman says:

            Massimo PORZIO

            Thanks for you post. I guess if a scientist calculated it we are not allowed to question this or ask exactly how did they arrive at that.

          • Gordon Robertson says:

            Massimo…”They believe in pure statistical models built above simplistic laws of classical physic”.

            That would be nice if it was true. The classical physics they pretend to use often does not exist as they portray it.

            There are at least two major errors used in climate models. The first is that CO2 in the atmosphere has nearly the warming effect they claim, which is 9 to 25%. No one has explained why a gas that accounts for 0.04% of the atmosphere could have such an effect.

            Secondly, the models presume a positive feedback by which the scant amount of anthropogenic CO2 can add infrared energy to solar energy to allegedly super heat the surface beyond what it is heated by solar energy alone.

            We cannot included water vapour as a source of IR because it has been there all along and temperatures have not risen based on the existing water vapour level. The theory goes that increasing the surface temperature will evapourate more water vapour.

            Don’t these rocket scientists get it that down-dwelling IR from GHGs are part of a cycle that features losses? If IR could behave like that we would have a perpetual motion machine.

            Surface IR radiation allegedly warms the GHGs in the atmosphere based on an experiment in a lab. No one has measured the surface IR doing that, and the concentration of CO2 in the lab is not specified. It’s a presumption in models.

            The IR doing the alleged warming represent a loss of heat at the surface. That loss must be made up before down-dwelling IR could possible have a warming effect when added to solar energy. Losses of energy in the cycle between surface and atmosphere make that impossible.

            Thirdly, the 2nd law makes it clear that heat cannot be transferred from a colder region to a warmer region without some kind of external compensation applied. It’s simply not possible for the longer frequency IR from cooler GHGs back-radiated to the surface to raise the kinetic energy of surface atoms. To cause heating the IR would have to be of a specific frequency and intensity which cooler GHGs do not possess.

            Using a hypothetical value for the effect of CO2 on warming and a positive feedback is pseudo-science.

          • David Appell says:

            I’m not allowed to post any details here.

          • David Appell says:

            Gordon Robertson says:
            “Secondly, the models presume a positive feedback by which the scant amount of anthropogenic CO2 can add infrared energy to solar energy to allegedly super heat the surface beyond what it is heated by solar energy alone.”

            Wrong — they don’t “presume” anything — they calculate feedbacks. All the major ones have already been observed.

          • David Appell says:

            Gordon Robertson says:
            “The theory goes that increasing the surface temperature will evapourate more water vapour.”

            Here’s the evidence for an increase in atmospheric water vapor:

            IPCC 5AR WG1 Ch2 Figs 2.30 & 2.31 documents positive trends in water vapor in multiple datasets.

            “Attribution of observed surface humidity changes to human influence,”
            Katharine M. Willett et al, Nature Vol 449| 11 October 2007| doi:10.1038/nature06207.

            “Identification of human-induced changes in atmospheric moisture content,” B. D. Santer et al, PNAS 2013.
            http://www.pnas.org/content/104/39/15248.abstract

            “How much more rain will global warming bring?” F.J. Wentz, Science (2007), 317, 233235.
            http://www.sciencemag.org/content/317/5835/233

          • David Appell says:

            Gordon Robertson says:
            “Dont these rocket scientists get it that down-dwelling IR from GHGs are part of a cycle that features losses? If IR could behave like that we would have a perpetual motion machine.”

            Wrong — the atmosphere is not an adiabatic system.

          • David Appell says:

            Gordon Robertson says:
            “Surface IR radiation allegedly warms the GHGs in the atmosphere based on an experiment in a lab. No one has measured the surface IR doing that”

            Wrong — it doesn’t warm molecules. The molecules’ IR warms the surface. THis has been absorbed:

            “Observational determination of surface radiative forcing by CO2 from 2000 to 2010,” D. R. Feldman et al, Nature 519, 339343 (19 March 2015)
            http://www.nature.com/nature/journal/v519/n7543/full/nature14240.html

            Press release for Feldman et al: “First Direct Observation of Carbon Dioxides Increasing Greenhouse Effect at the Earths Surface,” Berkeley Lab, 2/25/15
            http://newscenter.lbl.gov/2015/02/25/co2-greenhouse-effect-increase/

    • David Appell says:

      Norman, all your comment does is recognize that climate sensitivity is defined as

      lambda = dT/dF

  60. Dr No says:

    Welcome to hell on Earth: Heatwave builds across eastern Australia

    http://www.smh.com.au/national/welcome-to-hell-on-earth-heatwave-builds-across-eastern-australia-20170208-gu8nip.html

    Not anywhere near as hot as the fires of hell that await denialists.

  61. ren says:

    Back in Oroville, state engineers spent Wednesday trying to figure out how much water they could send down the dams damaged spillway.

    The state planned to make test releases, knowing the flows likely will enlarge the 30-foot-deep hole in the concrete spillway of Californias second-largest reservoir.

    Workers discovered the erosion a day earlier and stopped the high releases the state was making from the reservoir to maintain required space for runoff from an upcoming weekend storm.

    To partially counter the spillway shutdown, they increased releases through Orovilles power plant on Wednesday. But there is a limit to that tactic.

    That leaves the state with a difficult choice: keep sending water down the spillway, which will worsen the damage, or let the reservoir fill, which would send flows gushing down a separate emergency spillway that is not paved or gated.

    Department of Water Resources officials want to avoid doing that if possible, but as a precaution, workers are clearing trees and debris from downstream areas. Engineers also are looking for ways to bolster the spillway.

    The dam is sound, and no imminent threat to the public exists, the department emphasized in a news release.

    Oroville is the key reservoir in the State Water Project, which sends Northern California supplies to the urban Southland.

    The recent parade of storms that have pounded Northern California filled reservoirs to above-average levels for this time of year, forcing managers to ramp up releases to make room for more inflow.

    After the state halted spillway releases Tuesday, so much runoff continued to flow into the reservoir that Oroville went from 80% full to 84% overnight.

    At this point, they have to be prepared to use the broken spillway, said Ron Stork, who has studied Oroville operations as a policy staffer for Friends of the River, an environmental group. If they dont, the reservoir is going to rise, and there is no place to put a big inflow.

    Typically, reservoir releases are made through Orovilles power plant, and the spillway is used only for high releases. The last time managers opened the spillway valves was in 2011.
    http://www.latimes.com/local/lanow/la-me-ln-drought-emergency-regulations-20170208-story.html
    http://cdec.water.ca.gov/cdecapp/resapp/getResGraphOiginal.action?resid=ORO&waterYears=1976&waterYears=1982&waterYears=2016&waterYears=1977

  62. Gordon Robertson says:

    Here on the southwest corner of Canada, just above the US border on the Pacific Ocean, we have been alerted to expect a severe storm with high winds that was supposed to start Wednesday afternoon (Feb 8, 2017). We were told to expect snow at first which would turn to a high volume of rain.

    I was out in it Wednesday afternoon changing a tire and there was very light snow. Later in the evening I was out in it again for a 40 minutes walk. There was a mix of light rain and snow falling without a hint of wind.

    Thursday, the Sun is shining and there’s no rain anywhere and no wind.

    This is not a knock on meteorologists. I am aware of the difficulties they face with the dynamics and unpredictability of weather systems and I think they do a good job for the most part.

    My beef is with catastrophic climate predictions that come from climate models. If meteorologists with sophisticated real data sources cannot predict weather accurately 24 hours in advance how can climate models programmed with wild guesses ever predict future climate states?

    Obviously they can’t and the IPCC has taken to calling climate model output a projection after it was pointed out by an expert that unvalidated models can predict nothing.

    Not one model projected the 18 years of no warming trend since 1998.

    • David Appell says:

      Climate models don’t make predictions.

      They make projections.

      • Gordon Robertson says:

        DA…”Climate models dont make predictions. They make projections”.

        Projections as in educated guesses. At least meteorologists use real data to get their guesses close.

        BTW…as of 6 PM Thursday I am still awaiting the severe storm predicted for Wednesday afternoon. I was just out for a walk in it enjoying the Sun.

      • barry says:

        Projections as in educated guesses. At least meteorologists use real data to get their guesses close.

        Nope, that’s not what projections are.

        Projections refer to the fact that they cannot be sure of what humanity will do in the future. So they offer a range of different scenarios, which also include different CO2 anthro emissions/rates up to 2100.

        So climate modelers do not predict the future, they project different scenarios and estimate the long-term results (with error bounds) under each scenario.

        A prediction is usually a single value. It’s the wrong word.

    • David Appell says:

      GR says:
      “My beef is with catastrophic climate predictions that come from climate models. If meteorologists with sophisticated real data sources cannot predict weather accurately 24 hours in advance how can climate models programmed with wild guesses ever predict future climate states?”

      In physics there are many things that are unpredictable on a short time and length scale but predictable on a long time scale.

      If you’re in a swimming pool of water, you encounter various hot and cold spots. The location of those fluctuations is very hard to predict, as is how long they will last or where they will appear or disappear next.

      But the average temperature of the pool is much easier to predict — it will slowly cool as the day cools and night comes. You can calculate it via very basic thermodynamics.

      The first instance is like weather. The second is like climate.

      • Gordon Robertson says:

        DW…”In physics there are many things that are unpredictable on a short time and length scale but predictable on a long time scale”.

        It’s not as much time scales in physics as it is measuring at an atomic level. At an atomic level, such as in gases, no one can predict the actions of a single atom or molecule. The bulk actions of atoms and molecules can be predicted using averaging techniques.

        On a macro level, I’d venture to say that most basic physical principles can predict outcomes on both the short term and long term.

        The problem is that climate models are not based on pure physics. They are based on generalized differential equation theory applied to uncertainties. Where there are gaps in the certainties climate modelers have filled the gaps with guesses and presumptions.

        If they freely admitted that and claimed to be a work in progress I could cut them some slack. However, many of them are seriously arrogant and claim their models are valid.

        John Christy of UAH related a story in which he took real data acquired from NOAA satellites and presented it to a modeler. The modeler, in typical arrogance, claimed his model was essentially right, implying the real data was wrong.

        Modelers have far over-reached their capabilities and the IPCC has made it worse by claiming in 2001 that future climates cannot be predicted then ‘projecting’ future climates states based on unvalidated models.

        They are silently revising their projections from 4C to 6C by 2100 down to nearly a degree C. Maybe one day soon they will correct the models and get them in line with the real data as presented by UAH.

        Meantime, I’d like to see them drop the arrogance.

        • David Appell says:

          Gordon Robertson says:
          “The bulk actions of atoms and molecules can be predicted using averaging techniques.”

          That was exactly my point, thanks.

          “The problem is that climate models are not based on pure physics. They are based on generalized differential equation theory applied to uncertainties.”

          Ha.

          Of course, physical laws are expressed as differential equations.

          But, wrong, they aren’t applied to uncertainties, they’re applied to physical quantities like field strengths, kinematic variables, temperatures, and more.

          Gordon, your understanding of physics is very weak. You step in it all the time.

        • David Appell says:

          GR wrote:
          “Modelers have far over-reached their capabilities and the IPCC has made it worse by claiming in 2001 that future climates cannot be predicted then projecting future climates states based on unvalidated models.”

          Tell us, Gordon: how would you predict a future state — say, climate in the year 2085?

        • David Appell says:

          GR wrote:
          “Modelers have far over-reached their capabilities and the IPCC has made it worse by claiming in 2001 that future climates cannot be predicted then projecting future climates states based on unvalidated models.”

          Prove the models are “unvalidated.”

          I can’t wait to see this.

        • David Appell says:

          Gordon Robertson says:
          “Meantime, Id like to see them drop the arrogance.”

          That’s rich, coming from someone who arrogantly dismissed Manabe without even reading his work.

    • David Appell says:

      “Not one model projected the 18 years of no warming trend since 1998.”

      Prove it.

      When given historical forcings, climate models are quite accurate:

      http://blogs.reading.ac.uk/climate-lab-book/files/2014/01/fig-nearterm_all_UPDATE_2017.png

  63. Ross Brisbane says:

    Record setting heatwaves after heatwaves hits the Australian Continent with more to come.

    The hellish heatwave will break even some of the FORMER recent heatwave records over the next few days.

    http://www.businessinsider.com.au/maps-a-horrifying-three-day-heatwave-is-coming-for-australias-east-coast-2017-2

    • Gordon Robertson says:

      Ross…”Record setting heatwaves after heatwaves hits the Australian Continent with more to come”.

      Yes…temperatures tend to get high in a sub-tropical climate (Sydney) in summer and hotter the further you go north.

      Don’t know about heat waves but extremes in temperature are nothing new to Sydney. Hope you’re not relating those heat waves to global warming.

      It’s amazing to hear an Aussie complaining about heat waves when we have a desert climate in Canada, 150 miles NW of Vancouver, which is a temperate rain forest, with summer temperatures day after day in the 40C range.

      Even here in Vancouver, it’s not unusual during summer to get heat waves with temps as high as 30C.

      Seems to be related to solar energy and a lack of convection.

      The record for heat waves in North America occurred in the 1930s. I’m sure if you look carefully you’ll find your current heat waves are not unprecedented.

      https://en.wikipedia.org/wiki/Climate_of_Australia

      For New South Wales:

      “The highest maximum temperature recorded was 49.8 C (121.6 F) at Menindee in the state’s west on 10 January 1939”.

      It seems your entire east coast has encountered extreme temperatures at one time or another.

      The article also points out that Australia is particularly prone to the droughts and flooding produced by ENSO.

      • Ross Brisbane says:

        No Gordon. The record breakers we are talking about exceed 45 degrees Celsius. I know I live here. We attended a funeral on Last Saturday – temperature was 39 degrees Celsius at 12 noon. Records are being broken. Australia is experiencing heat waves that exceed duration and intensity since colonial occupation! The Coral sea to the North Eastern sector is super hot at moment.

        Temperature globally will remain very high for 2017.

        • Norman says:

          Ross Brisbane

          The cause of the heat wave is a blob of hot air that is not moving because of upper level wind patterns. These happen every year somewhere on the globe.

          Based upon the temperature map in the video it looks like the extreme heat does not cover all of Australia just a portion.

          Don’t feel too hot, the US had this occur in the 1930’s which broke many records and many records set during these years have not yet been broken and that was way before anyone was talking about Climate Change or Global Warming.

          Watch the video and learn some meteorology.

          http://www.abc.net.au/news/2017-02-09/when-will-the-heatwave-end/8255994

          • Ross Brisbane says:

            They do not happen every year to this extent in Australia. This pattern of heat waves has broken ALL RECORDS since OCCUPATION of whites in Australia continental wise. It is more to do with heat bubble phenomenons that have manifested over other parts of the globe including India and and of all Russia’s Siberia. We can say with certain reserve that this just cannot manifest itself as if by magic in an implied global cooling world. The extra energy of heat is being caused by something other then just wind or weather events.

            Records will be broken. Coastal fringe areas of Australia expecting up to 40 degrees at this time of year are roughly 12 degrees Celsius above normal. The meteorological anomaly is a very sticky fly in ointment for cooling advocates of Global Warming who are trying to imply things will return to normal.

            JUST WHAT IS NORMAL??

          • ren says:

            February 13 atmospheric front will bring relief to eastern Australia, later the wind will be from the south. Nights will be cooler already.
            http://www.bom.gov.au/fwo/IDG00074.gif?2017-Feb-10-00:39:32

          • Norman says:

            Ross Brisbane

            Maybe look and read this article to get a historical perspective.

            https://climatism.wordpress.com/2014/01/21/shock-news-australia-has-always-had-heatwaves/

            Whenever the media brings up something about climate change causing terrible weather I start looking into the past to see. Also look for the underlying cause of extreme heat or cold or excessive rain and see if Climate Change seems responsible. It could be if scientists can prove changing global wind patterns. So far I have not found a convincing study.

          • Norman says:

            Ross Brisbane

            This article basically explains the “heat-wave” phenomena.

            A high pressure cap in the upper atmosphere prevents convection (which is a cooling process for the surface) causes temperatures to rise far above the average. The situation is very similar to a car in hot sun. Convection cannot remove the interior surface heating and the air becomes very warm inside.

            Also with convection restricted the moisture in the air cannot rise high enough to create clouds to shut off the solar input and this also intensifies the heating.

            These domes can persist for days or much longer even months before a system can move them off. Not much to do with Climate Change as these patterns have been taking place for recordable history of weather.

            http://www.citylab.com/weather/2016/07/a-punishing-heat-dome-is-building-in-the-us/491894/

            Historical perspective on heat waves.
            https://en.wikipedia.org/wiki/List_of_heat_waves

          • David Appell says:

            Norman: So a warmer world doesn’t affect the character of heat waves.

            Interesting. Also, not every believable.

            Very warm events are exponentially more probable in a warmer world:

            http://davidappell.blogspot.com/2015/07/why-very-warm-events-are-much-more.html

          • Norman says:

            David Appell

            I looked at your work on the link you posted. Interesting. I did not take statistics in my higher education (though I now wish I had). I can understand most the terms I read about but do not have much ability at the mathematical manipulations.

            I argued the point on Skeptical Science a few years ago. There was a post with similar reasoning as your own. My counter-point was that a normal curve relies upon a random events.

            https://en.wikipedia.org/wiki/Normal_distribution

            and

            https://en.wikipedia.org/wiki/Random_variable

            I am of the understanding that heat waves or cold snaps do not follow a random process. Heat waves build based upon the previous temperature.

            A bell curve could not be fashioned from a dice where the next outcome depended upon the current outcome (coupled response). Coupled outcomes are not statistically random events.

            Heat waves are caused by stagnant upper level high pressure domes that limit convection (limiting a cooling effect). These take place all the time somewhere but a heat wave is caused when one of these high pressure regions stalls and sits over the same area, the heat starts to build. The Sun heats the surface, convection is suppressed so only a small layer of air is circulated so the heat builds. The day is hotter, the night does not cool as much and it gets hotter and hotter until the upper air system is broken apart.

            What makes the high pressure system persist. They persisted before the globe warmed a degree (you can see it in the history of heat waves, some very intense). Does your math prove that more high pressure areas will form and persist longer because of an increase in air and ocean temperature?

            Also in your blog did you look at Mark Albright’s links showing that Salem, Oregon mean temperatures have been declining?

          • David Appell says:

            Norman says:
            “My counter-point was that a normal curve relies upon a random events.”

            No, it requires that the data be normally distributed, i.e. described by a Bell Curve.

            This is sometimes applicable to some random variables, as Wikipedia notes, but many physical processes result in normal distributions.

          • David Appell says:

            Norman says:
            “Also in your blog did you look at Mark Albrights links showing that Salem, Oregon mean temperatures have been declining?”

            I didn’t look, but that’s wrong. 2015 was Salem’s warmest year in the records (they start in 1948); 2016 was 2nd warmest, and 2014 3rd warmest.

            data source:
            http://data.giss.nasa.gov/gistemp/stdata/
            (scroll to bottom of page)

            http://data.giss.nasa.gov/cgi-bin/gistemp/stdata_show.cgi?id=425726940000&ds=5&dt=1

          • David Appell says:

            Again, Norman, you gotta read the titles of graphs. Albright’s graph is for “Annual Mean Daily Max Temperature,” not the annual mean temperature or daily average temperature.

            The data I see show clear warming in Salem, OR.

          • David Appell says:

            But my data source does have some gaps, notably 2004-2009 and 1977-1999.5.

            Source:
            http://data.giss.nasa.gov/gistemp/stdata/
            (scroll to bottom of page)

            http://data.giss.nasa.gov/cgi-bin/gistemp/stdata_show.cgi?id=425726940000&ds=5&dt=1

          • Norman says:

            David Appell

            Since you have an extensive knowledge of statistics my question is would a coupled dice generate a normal distribution?

            The dice would be like this (which are how heat waves and cold snaps behave). If you roll a 2 the odds of getting a 1 are higher than any other number (cold generates more cold). If you roll another one the odds of rolling another one are even higher. A roll of 3 and a 2 or 1 is more likely than 4,5, or 6.

            On the Heat wave side it would be a roll of 4 makes a 5 and 6 much more likely than a 3,2, or 1 with 1 being the least likely in the next roll.

            I am not certain that a coupled system will develop a bell curve, it may make an entirely different graphic since rolls influence the next rolls probabiltiy.

            I thought a normalized distribution requires equal probability to all the states without any state effecting the next event. I could easily be wrong so I am not making a strong argument. I am trying to learn with this post. Thanks.

          • David Appell says:

            Norman, I have no idea if your proposed system would generate a normal distribution, and I’m not even going to spend time thinking about it.

          • David Appell says:

            Norman says:
            “I thought a normalized distribution requires equal probability to all the states without any state effecting the next event.”

            I’m not talking about “next events,” I’m simply saying that temperatures are usually normally distributed about their mean.

          • David Appell says:

            Hi Norman. I downloaded Mark Albrights’ data for Salem, OR, for both daily maximums from 1926-2014, and daily minimums. I calculated the average temperature as the average of the daily_max and the daily_min. Then I took the average of each daily average temp by month.

            I get a 10-yr trend (ending in 2014) of +0.81 C/dec, a 20-yr trend of +0.08 C/dec, and a 30-yr trend of +0.23 C/dec. (The trend for 22 years is zero.) The trend from 1928-2014 is +0.07 C/decade.

            So I conclude that Salem is warming.

          • David Appell says:

            Norman, I wrapped all this Salem data up here:

            http://davidappell.blogspot.com/2017/02/yes-salem-oregon-is-warming.html

            Bottom line: While this is a slight cooling trend in the annual average daily maxima, there is a definite warming trend in the annual average daily average:

            http://davidappell.blogspot.com/2017/02/yes-salem-oregon-is-warming.html

            In fact, in the last 30 years this warming is +0.41 F/decade.

            Lesson: daily minimums are increasing more than daily maximums are slightly decreasing.

          • Norman says:

            David Appell

            It looks like you did some good research on the Salem, Oregon temperatures.

      • Dr No says:

        Poor GR.
        The heat wave is setting records – yes – records. Do you understand what that means?
        A record means a value exceeding a previous recorded value in the historical record.
        Please don’t embarrass yourself with your “alternative” facts and interpretations.

        Remember to say your prayers tonight and remember that hell is much hotter than Australia at the moment.

  64. RW says:

    “The +3.7 W/m^2 of radiative forcing is actually 3.7 W/m^2 LESS OUT through the ToA.”

    And it’s only the instantaneous reduction out the TOA.

    I already pointed out to David Appell that this is entirely upward IR additionally absorbed, but he still denies it.

    • David Appell says:

      RW: I don’t recall ever hearing of you before.

      In any case, radiative forcing is defined and measured at the tropopause, not the TOA and not the surface.

    • RW says:

      David,

      I’ve emailed you on this before.

      “In any case, radiative forcing is defined and measured at the tropopause, not the TOA and not the surface.”

      The 3.7 W/m^2 can be considered through the TOA after the so-called ‘stratospheric adjustment’, which BTW is less than 0.1 W/m^2 (and really just a fudge factor). The 3.7 W/m^2 is still all that of upwelling IR additionally captured/absorbed by the atmosphere, and is instantaneous, i.e. before the system has responded to the change.

  65. barry says:

    This Bates story has two very different narratives. Bates himself seems to have contradicted himself depending on which interviewer he’s talking to.

    On Judith Curry’s blog he wrote that the authors of the report put a “thumb on the scale in the documentation, scientific choices, and release of datasets in an effort to discredit the notion of a global warming hiatus and rush to time the publication of the paper to influence national and international deliberations on climate policy.”

    But in an interview with E&E he said, “The issue here is not an issue of tampering with data, but rather really of timing of a release of a paper that had not properly disclosed everything it was.”

    Bates said to the Associated Press that there was “no data tampering, no data changing, nothing malicious.”

    “It’s really a story of not disclosing what you did. It’s not trumped up data in any way shape or form.”

    Looks like a big kerfuffle over very little, but it’s keeping the regulars buzzing.

  66. ren says:

    Southern California also gets his portion of the water.
    http://pics.tinypic.pl/i/00868/0lcngsnqyaj1.png

    • ren says:

      But with this weeks storms dumping more runoff in the reservoir and pushing the lake closer to the level that would trigger releases down a separate emergency spillway, officials decided they had no choice but to use the eroded structure.

      Thursday afternoon the reservoir level was 884 feet, 17 feet below the emergency release point of 901 feet. Croyle said managers hoped that if they could get more water out of the reservoir in coming hours they could keep the lake below the critical level.

      But if that doesnt work, Croyle said it was possible water would start flowing over the unpaved emergency spillway sometime Saturday.

      It will be pretty amazing to see what happens, he said. It will be a thin veneer of water flowing over the crest into ravines and into the river.

      Crews were clearing trees and brush from the emergency pathway Thursday. The state also moved a couple of million fish out of the downstream Feather River Hatchery because water from the eroded spillway is too muddy for hatchery use.

      Officials do not know what caused the collapse of a section of the spillway, gouging a hole that was 45 feet deep and 250 feet long. The cavity has since doubled in size.
      http://www.latimes.com/local/lanow/la-me-oroville-spillway-damage-20170209-story.html

  67. barry says:

    All those discussing how models work (and those looking for equations of radiative transfer) should read a seminal paper from 1978, which goes into great detail.

    Ramanathan and Coakley (1978)

    • Dr No says:

      Barry,
      you are talking to pygmy-brains here. They are incapable of reading a scientific paper and understanding it.

      • Norman says:

        Dr No

        Now you are insulting pygmies? What is wrong with their brains? They are very adapt in surviving and learning the art and abilities to maintain their life with minimum damage to the world they live in. I thought you would consider their brains to be a little above the destructive European brain.

      • Gordon Robertson says:

        dr no…”Barry, you are talking to pygmy-brains here. They are incapable of reading a scientific paper and understanding it”.

        If we are pygmy brains what does that make you, a troll who cannot distinguish a scientific response from an ad hom? Even worse, you are an Australian troll, likely from Botany Bay.

        No insult to Barry, who tries to deal in the science, like the rest of us pygmy brains.

    • barry says:

      Norman, was it you upthread asking for calculations about atmospheric changes? You will see a lot of that in the paper I linked just above.

    • Gordon Robertson says:

      barry…”All those discussing how models work (and those looking for equations of radiative transfer) should read a seminal paper from 1978, which goes into great detail”.

      On a first quick read through several things stand out.

      1)no explanation of the relationship between heat and EM.

      In one part they failed to distinguish the kinetic energy due to mechanical processes from the kinetic energy of atoms, which is heat.

      2)no explanation of the sensitivity of atmospheric heating to CO2.

      In fact, Manabe et al used another model to predict the sensitivity.

      3)a lot of generalized conjecture

      • barry says:

        1) – Relationship between heat and EM is more basic than the topics considered by the paper. This paper was built on others that built on others.

        People were talking about seeing equations used for climate modeling. This paper is a very detailed early work.

        In one part they failed to distinguish the kinetic energy due to mechanical processes from the kinetic energy of atoms, which is heat.

        You’ll have to be more specific. What page/paragraph?

        2) Much of the paper is about things affecting CS. there is a section on feedbacks, and a section on warming from CO2 increase (p482).

        3) – Generalized? That’s a very detailed paper. It also references previous work (which you mentioned in your reply).

        I think you skimmed it a little too quickly. Norman is going to give it a proper look.

      • barry says:

        1)no explanation of the relationship between heat and EM.

        Equation 37 is specifically about converting transmission to temperature at different layers of the atmosphere. Contained in section D, p 472.

        Other work on EM/temps is referenced in the paper.

        A lot of reading to catch up with the science.

      • David Appell says:

        Gordon Robertson says:
        “On a first quick read through several things stand out.
        1)no explanation of the relationship between heat and EM.”

        It’s a paper written for scientists — they’re not going to explain every basic thing.

        “In one part they failed to distinguish the kinetic energy due to mechanical processes from the kinetic energy of atoms, which is heat.”

        One type of heat. And not the type of interested in climate change.

        “2)no explanation of the sensitivity of atmospheric heating to CO2.”

        Not their goal in this paper, obviously.

        David

  68. ren says:

    The predicted amount of rainfall in millimeters of water in California from 02/10/2017 to 02/11/2017.
    https://www.ventusky.com/?p=37.8;-119.8;5&l=rain-ac&t=20170211/15&m=gem

  69. Werner Brozek says:

    Hello Barry

    I hope you are still reading this. Justthefacts liked what you wrote and encouraged me to write a blog post. I will clearly distinguish between what is your material and what is mine. Expect a blog post on WUWT in about 4 days. What is the ideal time and day for this blog post to be published so you have at least 6 hours to respond to any comments or questions on your part of the post? Thanks!

    • barry says:

      Very considerate of you, Werner. I’m on call, so hours are random. By all means give me a heads up here when you’ve posted.

      And please check my work, if you haven’t already, so I don’t make an ass of either of us!

  70. ren says:

    “Winter is back in a big way.”
    https://www.bostonglobe.com/metro/2017/02/09/snow-high-winds-and-maybe-thundersnow/fUJ9cnEpfVED2eFO1nKtUK/story.html?p1=Article_Related_Box_Article
    From Sunday afternoon to Monday evening, another powerful winter storm set to deliver blizzard conditions is on the way for portions of New England hit hard by snowfall this past Thursday, AccuWeather Meteorologist Kyle Elliott said.
    https://accuweather.brightspotcdn.com/dims4/default/7f33f91/2147483647/resize/590x/quality/90/?url=http%3A%2F%2Faccuweather-bsp.s3.amazonaws.com%2F55%2F04%2F8902700b409fafb397f6677b8157%2Fstatic-blizzard-sun-mon-3pm.jpg

  71. barry says:

    There have been a few comments above on daily/monthly heat records being broken.

    Of course, these are weather reports, not an assessment of climate. You need long-term averages for climate analyses.

    To whit: globally, more hot records have been broken than cold every year for the past 15 years at least.

    http://www.mherrera.org/records.htm
    http://www.mherrera.org/records1.htm

    • David Appell says:

      This data is begging to be summarized, say, by year.

    • barry says:

      Easy enough to do by copying and pasting each year’s list to Word and doing a word count on ‘max’ and ‘min’.

    • barry says:

      Using the word replacement function, in 2002 there were 204 maximum records, and 22 minimum records.

      For example.

    • barry says:

      Here’s the way to use Word to count the number of instances.

      http://word.tips.net/T001833_Generating_a_Count_of_Word_Occurrences.html

    • barry says:

      As there were nearly 10 times as many max records broken than min is 2002, I figured I’d do the rest of the years.

      It’s kind of obvious there would be more max than min records broken for every year thereafter, as these are among the hottest years in the whole temp record – globally.

      2002 record-breaking local temps
      Maximum 204
      Minimum 22

      2003 record-breaking local temps
      Maximum 394
      Minimum 20

      2004 record-breaking local temps
      Maximum 113
      Minimum 13

      2005 record-breaking local temps
      Maximum 120
      Minimum 29

      2006 record-breaking local temps
      Maximum 145
      Minimum 20

      2007 record-breaking local temps
      Maximum 297
      Minimum 17

      2008 record-breaking local temps
      Maximum 90
      Minimum 32

      2009 record-breaking local temps
      Maximum 138
      Minimum 21

      2010 record-breaking local temps
      Maximum 505
      Minimum 44

      2011 record-breaking local temps
      Maximum 169
      Minimum 39

      2012 record-breaking local temps
      Maximum 296
      Minimum 16

      2013 record-breaking local temps
      Maximum 405
      Minimum 16

      2014 record-breaking local temps
      Maximum 217
      Minimum 19

      2015 record-breaking local temps
      Maximum 328
      Minimum 14

      2016 record-breaking local temps
      Maximum 323
      Minimum 21

      • Richard Barraclough says:

        Well done, and what a great list. It successfully wasted a couple of hours of my time!

        Any idea how the records are collated in the first place?. It would be interesting to see the actual dates as well as the year, especially as I was close by for some of them.

    • barry says:

      Richard,

      The home page lists the resources. The compiler also has a large list of people who contribute. See bottom of the page.

      http://www.mherrera.org/temp.htm

  72. Werner Brozek says:

    Hello Barry

    Your portion of the next blog post is here:
    https://wattsupwiththat.com/test/comment-page-1/#comment-2423362

    If you wish to make any changes, copy and paste what I have put together and make the changes and submit as a new comment. Walter Dnes has verified that your important numbers are in the ball park.

    • David Appell says:

      Without uncertainties, and the degree of statistical significance, these numbers are meaningless.

      They’re easy to calculate via Excel.

      Ideally you should calculate them including autocorrelation.

    • barry says:

      Added a note, Werner. Good luck.

    • barry says:

      Trends were calculated with ordinary least squares, David, as I said when I did it. Different regression methods that include autocorrelation would give slightly different answers. I guess that would be worth noting.

      The uncertainty could be discussed in the comments at WUWT. I was commenting here based on people’s interest (fixation?) on the mean trend estimates.

  73. David Overton says:

    Please Dr. Spencer consider what you are doing. Time is getting short. The time for pretending we don’t have a huge problem ended long ago, and I think you realize that. This is no longer funny – it is not about clever statistics and arguments anymore, it is about survival. Just look at your own graph. Anyone can see where this is going, and it is serious. Please consider your role in this, which will be documented for all time. What legacy do you want to leave the world? Do you really want to be remembered as the smart guy who was dead wrong and contributed to our failure to act? Please think about this and do the right thing. You know what that is. Confront your own truth.

    • Ross Brisbane says:

      Add David’s concern to mine. Roy you are wrong to continue assert we are not heading for trouble with global warming over the the next 50 years. The time to present inaction to your government heads is over. You said if you saw trends continuing beyond your soft landing predictions for global warming you would change your mind. The next five years will bury your mild out comes of global warming. As it begins to sink in about the effects of CO2 through energy conservation, I hope (and pray) we finally come to some commonsense from you. Your turning away from denial that the warming trends are far greater then you ever anticipated would be greatly appreciated.

  74. Werner Brozek says:

    Hello Barry

    I hope you are still reading here. The article at WUWT will be scheduled for 8:00 AM Mountain time Sunday, February 19.

    Werner

Leave a Reply