UAH Global Temperature Update for March, 2017: +0.19 deg. C

April 3rd, 2017 by Roy W. Spencer, Ph. D.

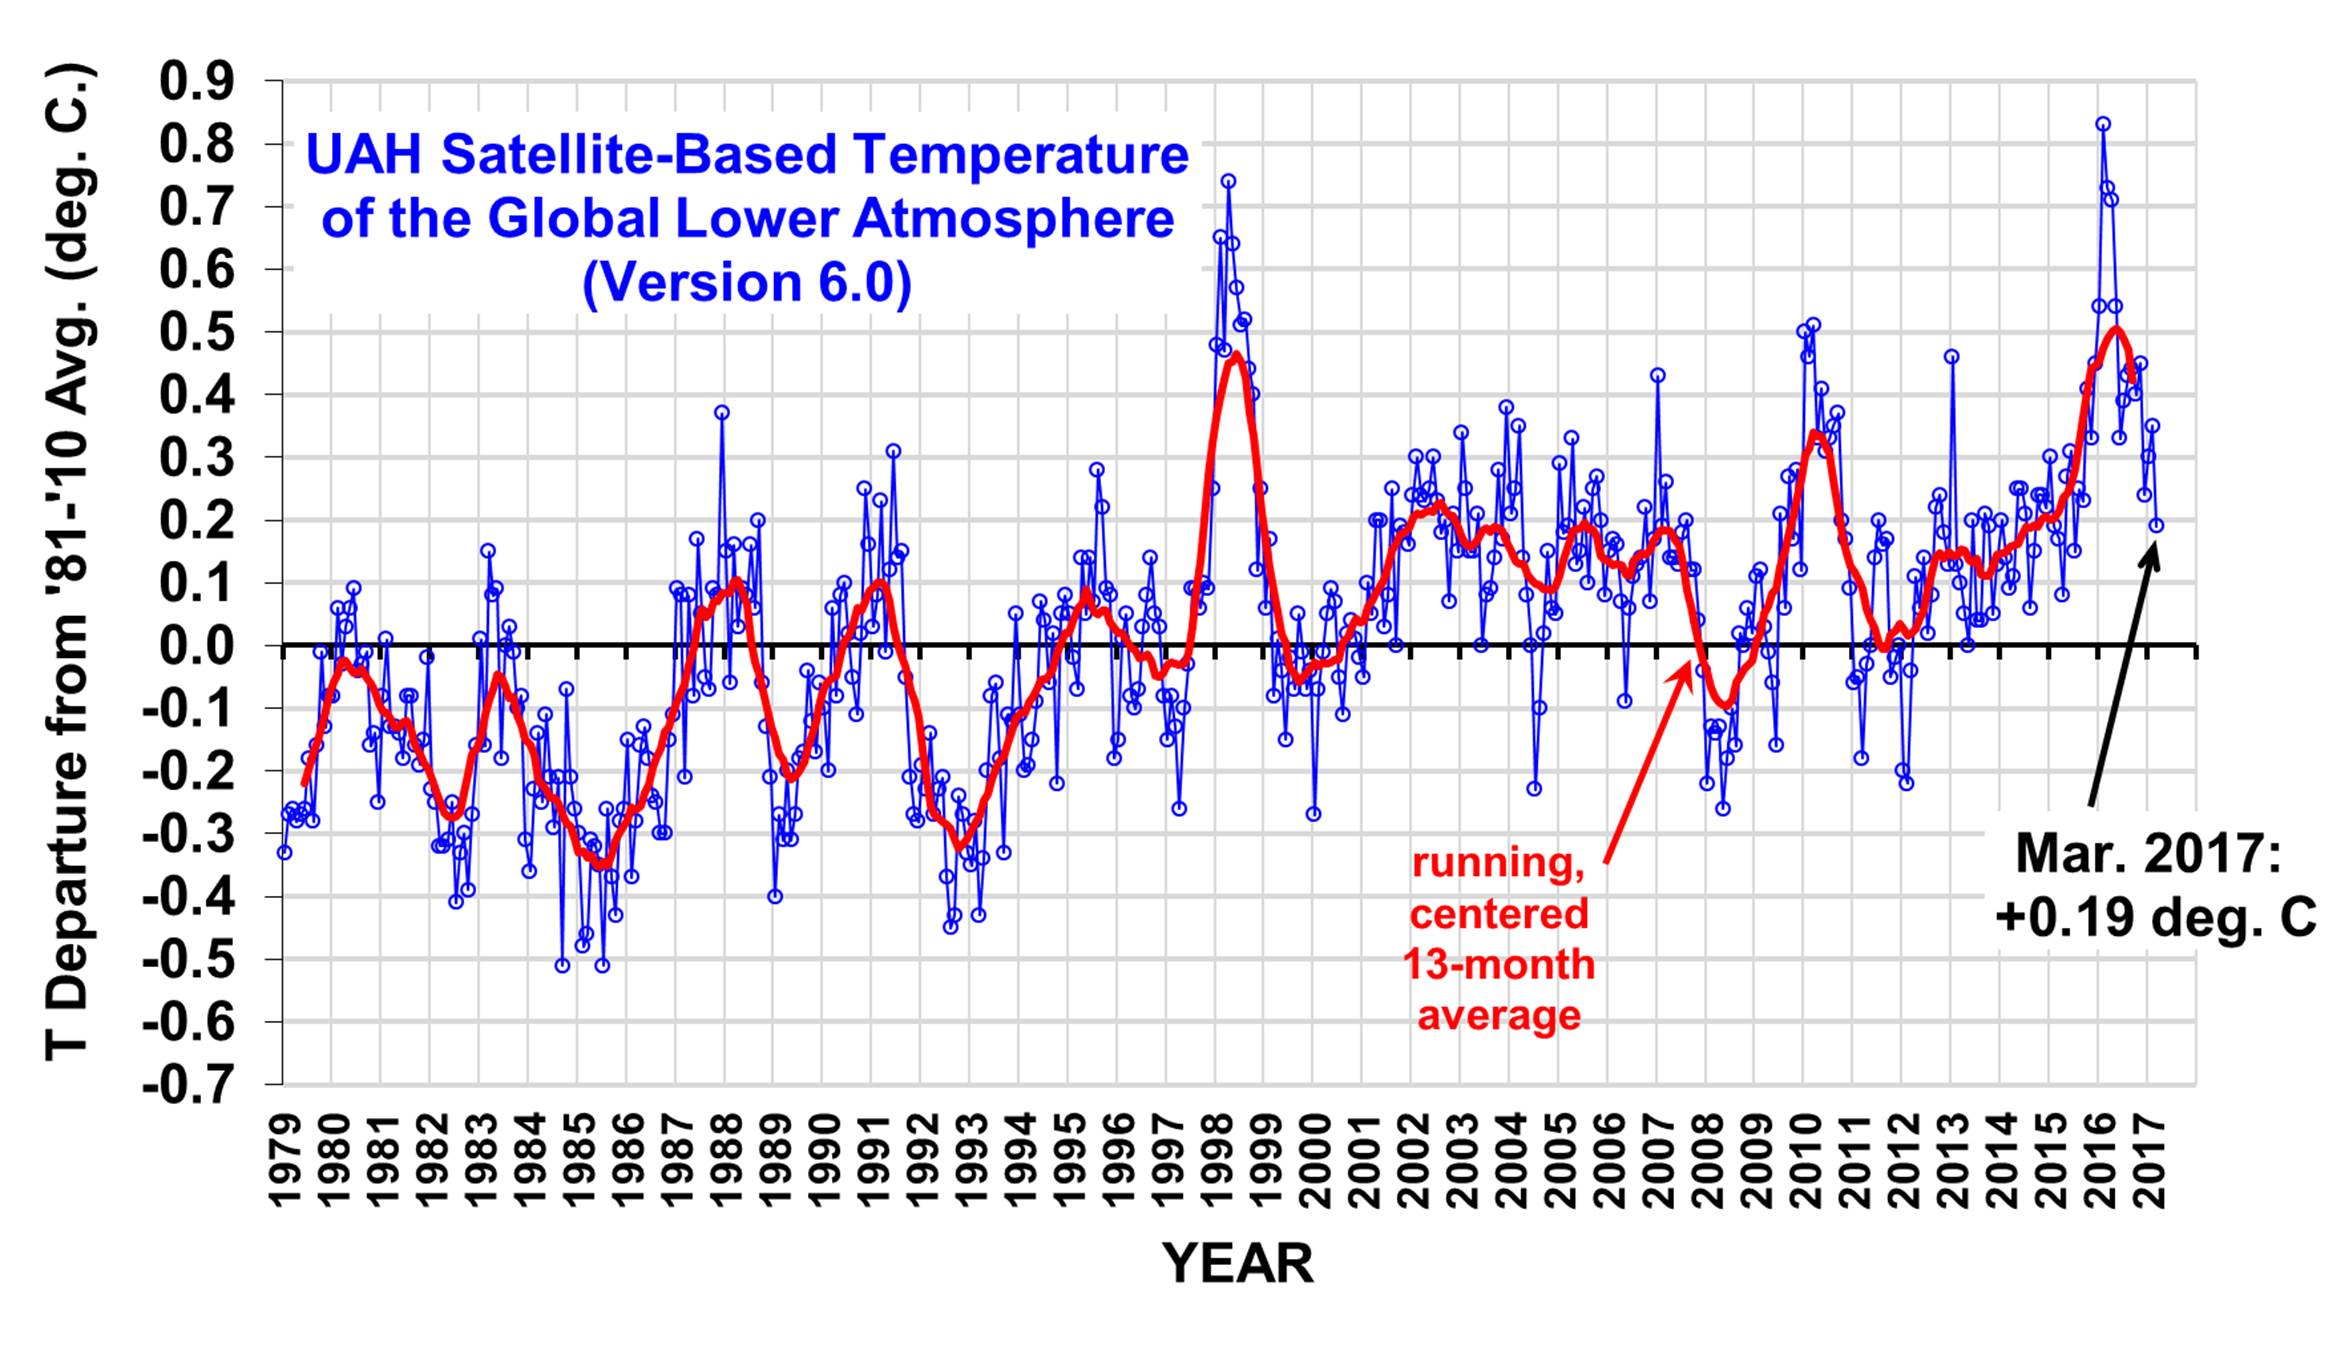
The Version 6.0 global average lower tropospheric temperature (LT) anomaly for March, 2017 was +0.19 deg. C, down from the February, 2017 value of +0.35 deg. C (click for full size version):

The global, hemispheric, and tropical LT anomalies from the 30-year (1981-2010) average for the last 15 months are:

YEAR MO GLOBE NHEM. SHEM. TROPICS
2016 01 +0.54 +0.69 +0.39 +0.84
2016 02 +0.83 +1.16 +0.50 +0.98
2016 03 +0.73 +0.94 +0.52 +1.08
2016 04 +0.71 +0.85 +0.58 +0.93
2016 05 +0.54 +0.64 +0.44 +0.71
2016 06 +0.33 +0.50 +0.17 +0.37
2016 07 +0.39 +0.48 +0.29 +0.47
2016 08 +0.43 +0.55 +0.31 +0.49
2016 09 +0.44 +0.49 +0.38 +0.37
2016 10 +0.40 +0.42 +0.39 +0.46
2016 11 +0.45 +0.40 +0.50 +0.37
2016 12 +0.24 +0.18 +0.30 +0.21
2017 01 +0.30 +0.26 +0.33 +0.07
2017 02 +0.35 +0.54 +0.15 +0.05
2017 03 +0.19 +0.30 +0.07 +0.03

The cooling in March occurred virtually everywhere, with 23 of the 26 subregions we track having cooler anomalies than in February.

The UAH LT global anomaly image for March, 2017 should be available in the next few days here.

The new Version 6 files should also be updated soon, and are located here:

Lower Troposphere: http://vortex.nsstc.uah.edu/data/msu/v6.0/tlt/uahncdc_lt_6.0.txt
Mid-Troposphere: http://vortex.nsstc.uah.edu/data/msu/v6.0/tmt/uahncdc_mt_6.0.txt
Tropopause: http://vortex.nsstc.uah.edu/data/msu/v6.0/ttp/uahncdc_tp_6.0.txt
Lower Stratosphere: http://vortex.nsstc.uah.edu/data/msu/v6.0/tls/uahncdc_ls_6.0.txt


1,616 Responses to “UAH Global Temperature Update for March, 2017: +0.19 deg. C”

Toggle Trackbacks

  1. aaron says:

    Nearly back down to pre-el Nino temp and without a strong la Nina. It’ll be interesting to see if there is a significant step up this time around. Not looking like much of one right now.

    • Bindidon says:

      aaron says:
      April 3, 2017 at 7:16 AM

      Nearly back down to pre-el Nino temp…

      What do you mean with ‘el Nino temp’, aaron?

      Last year I had the opportunity to download and evaluate Roy Spencer’s gridded TLT data, and a few weeks ago I read a very interesting comment at WUWT:

      https://wattsupwiththat.com/2017/01/18/berkeley-earth-record-temperature-in-2016-appears-to-come-from-a-strong-el-nino/#comment-2401985

      The comment’s author showed us that a selection of no more than 18 points out of the grid gave a time series pretty good near to that constructed by averaging the full grid.

      I did the same with only four points:
      http://tinyurl.com/k3q2d87

      The four points (or better: grid cells) are
      – 60S-90W: near Cape Horn and the Antarctic Peninsula;
      – 20S-90E: between Madagascar and Australia;
      – 20N-90W: in Guatemala;
      – 60N-90E: in eastern Siberia near Tula.

      Look how averaging laughable four grid cells gives, for the 1997/98 El Nino, the same data as what is obtained from the 9,504 cells!

      But the more interesting point is the difference, in the blue 4-point-plot, between 1998 and 2016: while the 4 points are very near to the whole average in 1998, they moved quite a lot above it in 2016.

      The reason was quickly found: while in 1998 the fourth cell in Siberia showed a temperature far below that of the 3 others, all 4 cells showed equivalent warmth for 2016.

      Whenever something looks warm in a satellite record, you soon hear ‘Thats El Nio!’. But in 2016, El Nio was weaker than in 1998 and thus hardly could be the differences origin.

      My humble guess: El Nio isnt the origin of warming: it is rather one of its many sentinels.

      • Richard M says:

        El Nino was only partially responsible for the 2016 warming. The other major part was the Arctic warmth driven by the AMO reduction in sea ice.

        It’s all natural as far as I can tell. This will become even more obvious as we move into the summer months where the lack of sea ice has a lower impact.

        • Bindidon says:

          You did not understand half a line of the comment (I know why: as is perfectly visible at WUWT, you are only interested in propagating your AMO stuff).

          Reread my comment, concentrate on the cell coordinates, and try to understand.

          • Richard M says:

            LOL. I understood perfectly. The influence of the Arctic is not limited to the Arctic but reaches down into much of the NH especially as high as 60. You are obviously in denial.

        • aaron says:

          By sea surface temp, el Nino was strong. But I think you may by right that it wasn’t as strong (wasn’t as high in the 1 region) and there was probably less heat transferred to the atmosphere than 98 (warm water not making it as far east suggest less westerly winds–>less energy transfer,and if the skies weren’t as clear, that’d also mean less atmospheric impact), at least early on.

      • Gordon Robertson says:

        Bindidon…”El Nio isnt the origin of warming: it is rather one of its many sentinels”.

        The 98 El Nino produced an after-effect globally of 0.15C. That occurred in 2001 and CO2 warming could not possibly act that quickly. Furthermore, once the 0.15C spike occurred the global average remained flat around 0.15 C from 1998 – 2015.

        According to the UAH 33 year report, global temps from 1979 – 1997 were below the average (baseline) from 1979 – 1995. Suddenly, with the 1998 EN, global temps went above the average and have remained there to date.

        Again, CO2 warming would not be below average for 17 years then suddenly be above average for the next 17 years with a flat trend.

        CO2 warming just doesn’t make sense. As I tried to explain using the ideal gas equation, warming is related to the partial mass of gases in the atmosphere. Based on it’s relative mass, CO2 has an insignificant warming effect. Most warming must come from N2 and O2.

        • barry says:

          There are swings as large and larger throughout the record, both hot and cold. I see nothing special about 2001. Looks just like other variability throughout the record.

          Go on, have a look at the rest of the record.

          I’ll even provide the numbers to prove it. No fancy linear trends, just the overall change in global temperature over a period of months or a year.

          • Gordon Robertson says:

            barry…”I see nothing special about 2001. Looks just like other variability throughout the record”.

            Barry… I referred to the UAH 33 year report in which they refer to no ‘true’ warming occurring in the entire record till the 1998 EN. If you look at the record prior to late 1997, it is generally in the negative anomaly range. One might expect it to continue above and below the baseline as it did the past 17 years.

            After 98, it dipped briefly below the baseline then rose above it in 2001 to around 1.5C, maybe a bit more. The IPCC reports a flat trend from 1998 – 2012. I am claiming that flat trend is centred around the level that it warmed post-98 (about 1.5C.

            There is no physical explanation for that rise of 1.5C, especially when it levels of at that degree above the baseline. That’s not natural variability it’s a step rise in global warming similar to the step rise in 1977 due to the PDO.

            There has to be a physical explanation and I refuse to accept the explanation is anthropogenic CO2.

          • Gordon Robertson says:

            sorry…I wrote 1.5C, that would be some step rise. I meant, of course, 0.15C. Just got back from a 2 hour power walk and I seem to be in oxygen debt.

          • barry says:

            If you look at the record prior to late 1997, it is generally in the negative anomaly range

            The baseline (the zero line) is a semi-arbitrary choice. A linear trend of the data pre-1998 yields a warming trend, though not statistically significant (which is a statistical concept, not equivalent to “significant,” as an everyday adjective).

            You get the same trend no matter where the baseline (zero line) lies. Raise the zero line high enough that every anomaly is negative, and what do you learn about temperature? Nothing. The trend, however, remains the same, as do the positions of the anomalies relative to each other. Change the position of the zero line and every anomaly changes by the exactly the same value.

            The IPCC reports a flat trend from 1998 2012.

            A flat trend is 0.0 C/decade. That is not the value that the IPCC gives.

            There is no physical explanation for that rise of 0.15C

            But you see rises and falls of this magnitude and greater throughout the record. You see even larger changes in some years (whether cooler or warmer than the year before). Even with no el Nino or volcano.

            2001 was preceded by a double la Nina in 1999 and 2000. La Nina finished, global temps went back up from the short-term dip.

            Is this unusual? Hell no! Let’s look right at the data and just compare year on year changes.

            1980 was 0.15C warmer than 1979. A brief el Nino crossed through the last few months of 1979 and the first 2 months of 1980.

            1986 was 0.15C warmer than 1985, which was a la Nina year.

            1990 was 0.2C warmer than 1989, which was a la Nina year.

            1994 was 0.15C higher than 1993, which was a neutral year.

            2009 was 0.2C warmer than 2008, which was a la Nina year.

            And so on.

            We see this magnitude of change fairly regularly. Often after a la Nina, but sometimes even when the previous year has been ENSO neutral, no massive volcanic eruption and no following el Nino.

            Those are the facts. The 0.15C through 2001 occurred after a two-year la Nina. That is not in any way, shape or form unusual.

            If you want to see for yourself, here is the data, direct from the UAH website. First column.

            http://www.nsstc.uah.edu/data/msu/v6.0/tlt/tltglhmam_6.0.txt

            And just to be thorough, here is the change in temp from 2000 to 2001:

            0.14C (0.136 to three decimal places)

            Less than all the examples above.

            That’s not at all abnormal nor unexplainable. Everyone here knows that la Ninas depress global temps. 2001 was a neutral year after la Nina. That’s your answer.

          • Kristian says:

            barry says, April 4, 2017 at 4:43 AM:

            There are swings as large and larger throughout the record, both hot and cold. I see nothing special about 2001. Looks just like other variability throughout the record.

            There’s nothing special about the year 2001. There is however something very special indeed about the years 1988 and 1998. You need to know where and how to look in order to find out, though. You can see it if for instance you correlate the global TLT timeseries (UAHv6.0) with that of NINO3.4 SSTa (OIv2), properly scaled and lagged:
            https://okulaer.files.wordpress.com/2017/04/nino-uah-1.gif

            Watch how there are two clear and abrupt upward steps in global temp anomalies relative to the NINO3.4 SSTa occurring in 1988 and 1998. In between the steps, global temps simply tag along with the NINO3.4 (there’s a little bit of interannual noise plus two large volcanic eruptions disturbing the overall visual impression somewhat, but at least from 1998 onwards the lockstep relationship becomes pretty evident).

            Those two steps are very much process-related (ocean-troposphere dynamics), both being firmly and swiftly established in the direct aftermath of large and solitary El Ninos (the 1987/88 and 1997/98 events). We can readily track the after-effects of these ninos, the extra-NINO (‘global’) warming, through the data. We can see how, when and where it spread and took hold. All we need to do is look at regional data. Bob Tisdale has written extensively on these two conspicuous upward shifts in global temperature anomaly. I’ve done the same.

          • barry says:

            No argument from me that ENSO events temporarily – and strongly – influence global temps.

            If you are alluding to some “step-jump” owing to el Ninos, that’s where I don’t agree. ENSO effects – physically – are temporary events.

          • Kristian says:

            barry says, April 8, 2017 at 7:04 PM:

            If you are alluding to some “step-jump” owing to el Ninos, that’s where I don’t agree. ENSO effects – physically – are temporary events.

            Now see this is where it seems you lack some basic understanding of the ENSO process and how it works and manifests itself.

            First of all, this is something you NEED to bear in mind at all times:
            The ENSO process is NOT equal to the SSTa in the NINO3.4 region. NINO3.4 ≠ ENSO.

            I urge you to read Trenberth et al.’s paper from 2002 called “Evolution of El Nino-Southern Oscillation and global atmospheric surface temperatures”. Here’s a pertinent quote, the corollary of which would normally be overlooked by most readers, especially since the authors themselves never take their time to elaborate on it and/or actually try to follow their own lead:
            http://www.cgd.ucar.edu/cas/papers/2000JD000298.pdf

            “Although it is possible to use regression to eliminate the linear portion of the global mean temperature signal associated with ENSO, the processes that contribute regionally to the global mean differ considerably, and the linear approach likely leaves an ENSO residual.”

            Trenberth’s “ENSO residual” is what makes those steps, barry.

            The ENSO process operates across the entire Pacific basin, not just inside the narrow NINO3.4 region. Plus it pulls the strings via atmospheric bridges on the SSTa evolution in ocean basins such as the Indian and North Atlantic.

            Trenberth himself points out the very plateaus and steps in global temperature that I have highlighted above:
            https://www.rmets.org/weather-and-climate/climate/has-global-warming-stalled
            (…) while the overall warming is about 0.16C per decade, there are 3 10-year periods where there was a hiatus in warming. From 1977 to 1986, from 1987 to 1996, and from 2001-2012. But at each end of these periods there were big jumps:
            https://www.rmets.org/sites/default/files/content_images/weather/trenberth-gwt.jpg

            Trenberth is of course a firm advocate of “human-induced global warming”, so he will definitely not agree (not on record, at least) with my interpretation of those “big jumps” and “hiatuses”. But he does confirm and underscore the fact that they’re all there. They’re real features of the global temperature anomaly evolution since the 70s.

            The question is then, how did they come about?

            The obvious answer: Through the ENSO process.

          • Kristian says:

            The funny thing is this, global temps simply track NINO3.4 SSTa all the way from 1970 to about 2013/2014, EXCEPT at three specific instances, three abrupt upward shifts, all occurring within the span of less than a year. That’s 1979, 1988, and 1998.

            The ENTIRE rise in the mean global temp during the modern era of ‘global warming’ is to be found within those three steps alone (leaving out the last 3+ years for now).

            What’s even funnier is how easy it is to see where and how the ‘global’ warming took place in each instance.

            The 1979 ‘global’ warming all took place in the East Pacific basin, the result of an abrupt and substantial flattening of the east-west thermocline (a sudden drop in the mean SOI level) occurring a couple of years prior, in 1976/77:
            https://okulaer.wordpress.com/2014/06/23/how-the-world-really-warmed-part-ii-step-1/

            The 1988 and 1998 ‘global’ warmings, on the other hand, both firmly originated in the West Pacific basin (mainly the result, it would seem, of the major 1976/77 switch in the direction that El Ninos evolve, from east-west before 1977 to west-east after; this, among other things, left huge pools of non-dissipated warmer-than-normal water at and below the surface in the far east of the tropical Pacific even after the demise of the El Nino, which would then, as the trade winds turned, and also via giant oceanic, subtropical Rossby waves, be brought back to the west IN ADDITION TO (on top of) the new solar-heated La Nina waters, and eventually sprawled out over the subtropical and – significantly – extra-tropical surface of the West Pacific), and from there were forced – to a varying degree – upon the North Atlantic and Indian Ocean basins as well:
            https://okulaer.wordpress.com/2014/07/11/how-the-world-really-warmed-part-iii-steps-2-3/

            It’s all in the data.

            However, one should never forget where the energy ultimately comes from. The ENSO process is naturally fuelled by the Sun, but at the same time it is to a large extent what determines how much solar heat will actually be taken up by the Earth system, and how much of it will be released, in the first place. The coupled ocean-troposphere system is a highly DYNAMIC one, not at all a mere non-variable receptacle of ‘heat’, as too many people seem to believe.

            We know (from official ToA radiation flux data, ERBS+CERES, ISCCP FD) that the mean level of solar heat input to the Earth system (the ASR, which is ‘net SW’, TSI minus reflected SW (albedo)) has gone up considerably since at least the mid 80s, and is the sole cause of our current positive ToA radiative imbalance (over the same period, after all, the OLR at the ToA, Earth’s heat output to space, has simply gone up with the tropospheric temperatures).

          • Ball4 says:

            “..the OLR at the ToA, Earth’s heat output to space, has simply gone up with the tropospheric temperatures..”

            For as long as CERES Team has meaningful observed data, Earth system OLR energy is found to decrease at TOA and Kristian has been informed (Loeb 2016 Table 4).

          • Ball4 says:

            Self cites are not convincing, cite the experts Kristian.

          • barry says:

            Now see this is where it seems you lack some basic understanding of the ENSO process and how it works and manifests itself.

            I think I’m pretty familiar with it.

            For the purposes of our discussion, during El Ninos heat is transferred from the ocean to the atmosphere and during la Ninas the opposite happens. Such a large amount of heat is transferred that ENSO events evident in the global surface record.

            In a warming world these spikes (el Ninos) sometimes combine with other fluctuations to give the impression of step-jumps in the temperature record. But ENSO doesn’t create heat of itself – el Ninos are not responsible for the long-term warming of sea surface temperatures.

            They cannot be, because we’ve had hundreds over the last thousand years, and if you work backwards through time on this premise, the globe should have been at least 10C colder 1000 years ago.

            Trenberth does not agree with you, as you know, and you also know that your quoting him is a specious tactic.

            These ‘jumps’ are not matched in the global sea level record or ocean heat content. They have their own short-term fluctuations at different times. You’re resting your case (whatever it might be) on a thin slice of atmospheric temps. Sea level and OHC show a steadier rise during the periods you think are flat between the ‘jumps’. They also rose during the period 1998 to 2012. Arctic and global sea ice declined in that tine, too, so the system warmed even if the slice of the atmosphere looked like it didn’t.

          • barry says:

            Self cites are not convincing, cite the experts Kristian.

            Some credit is due for doing the work at all.

            Then one can compare with expert views.

          • Kristian says:

            barry says, April 9, 2017 at 10:27 AM:

            Now see this is where it seems you lack some basic understanding of the ENSO process and how it works and manifests itself.

            I think I’m pretty familiar with it.

            Apparently not on a broad scale. Again, there is much more to the ENSO process than what is going on in the central and eastern equatorial Pacific Ocean. You might very well be aware of this, but in what you write about it, I’m afraid it doesn’t appear that way.

            For the purposes of our discussion, during El Ninos heat is transferred from the ocean to the atmosphere and during la Ninas the opposite happens.

            You’re right about the first, wrong about the second. Heat is NOT transferred from the atmosphere to the ocean during La Ninas. That is NOT how the Earth system works. Hint: The Sun is the ocean’s heat source, not the atmosphere.

            Such a large amount of heat is transferred that ENSO events evident in the global surface record.

            This is true. But now you’re talking about the NINO (equatorial East Pacific) signal specifically, not the full ENSO signal. Which includes several other parts of the world’s ocean as well.

            In a warming world these spikes (el Ninos) sometimes combine with other fluctuations to give the impression of step-jumps in the temperature record.

            No, barry. The surface of the world ISN’T warming outside those jumps. That’s the whole point. The whole warming, the general upward trend, is because of those steps only. It’s not the other way around.

            What “other fluctuations” did you have in mind? There are no independent “fluctuations” within the Earth system that I can think of capable of dominating the ENSO process and make its own signal ever outweigh that of ENSO. Can you?

            It appears you are not looking at the data to see what’s actually going on, how things are connected, what leads what. You’re just speculating for the sake of speculating, of not wanting the things I point out to be correct. It seems.

            But ENSO doesn’t create heat of itself (…)

            I described quite explicitly how this works, didn’t I? Here it is again, in case you missed it:
            However, one should never forget where the energy ultimately comes from. The ENSO process is naturally fuelled by the Sun, but at the same time it is to a large extent what determines how much solar heat will actually be taken up by the Earth system, and how much of it will be released, in the first place. The coupled ocean-troposphere system is a highly DYNAMIC one, not at all a mere non-variable receptacle of ‘heat’, as too many people seem to believe.

            We know (from official ToA radiation flux data, ERBS+CERES, ISCCP FD) that the mean level of solar heat input to the Earth system (the ASR, which is ‘net SW’, TSI minus reflected SW (albedo)) has gone up considerably since at least the mid 80s, and is the sole cause of our current positive ToA radiative imbalance (over the same period, after all, the OLR at the ToA, Earth’s heat output to space, has simply gone up with the tropospheric temperatures).

            (…) el Ninos are not responsible for the long-term warming of sea surface temperatures.

            True. The large-scale Pan-Pacific climate regime is. It switched from a negative (net cooling) to a positive (net warming) phase in 1976-77. This involves the ENSO process (including SOI), pressure and wind systems, and cloud cover.

            They cannot be, because we’ve had hundreds over the last thousand years, and if you work backwards through time on this premise, the globe should have been at least 10C colder 1000 years ago.

            Still with this argument? Look, ENSO works towards multi-decadal warming in positive Pan-Pacific climate regime phases, NOT in negative ones. The ENSO process fundamentally changes when these phases switch. You can read about it in the scientific literature.

            Trenberth does not agree with you, as you know, and you also know that your quoting him is a specious tactic.

            I know. But the DATA agrees with me and not with him. So that’s HIS problem, not mine. In fact, I suspect he DOES agree with me. But he’s bound to The Cause, to his “global warming by CO2” agenda, so he would never come out and admit it.

            And in what way is it “a specious tactic” to quote an expert on ENSO when discussing the topic?

            These ‘jumps’ are not matched in the global sea level record or ocean heat content. They have their own short-term fluctuations at different times. You’re resting your case (whatever it might be) on a thin slice of atmospheric temps. Sea level and OHC show a steadier rise during the periods you think are flat between the ‘jumps’.

            Actually, no. OHC has flat periods too, but at different times. That’s because OHC (and sea level) depends much more directly on the ToA radiative imbalance than do the surface (and tropospheric) temps. There is no inconsistency. The overall warming is a result of a general increase in solar input to the Earth system since the 70s, causing a positive ToA imbalance. However, this positive imbalance wasn’t there constantly for 45 years. There are periods of no general increase in OHC from 1970 till today. The Earth system is all the time struggling to catch up.

        • Bindidon says:

          Gordon Robertson says:
          April 4, 2017 at 1:59 AM

          The 98 El Nino produced an after-effect globally of 0.15C. That occurred in 2001 and CO2 warming could not possibly act that quickly.

          1. I did not mention CO2 at any time in the comment you replied to.

          2. Like Richard M, you did not understand my comment.

          Recall: El Nino is known (in its simplest form like NINO3+4 or ONI) as an SST temperature average over 5S-5N–170W-120W.

          What I tried to show is that if averaging four completely independent cells of a world grid gives in 1998 a good estimate for the global average of nearly 10,000 cells, then it is very unlikely that the El Nino phenomenon is the source of the temperature data, whose source must then be of much more global character.

          So I repeat: El Nino is an associated climate phenomenon, and not a climate driver. The same remark should be valid for other phenomena like the AMO (I speak here of its non detrended variant).

          • Gordon Robertson says:

            Bindidon…”So I repeat: El Nino is an associated climate phenomenon, and not a climate driver”.

            The 1998 EN drove the global average, not a local average, to 0.8C above the baseline in a few months. I would definitely call that a climate driver. EN and it’s partner LN are related to flooding and droughts over the entire planet.

          • barry says:

            Global climate is a multidecadal phenomenon. ENSO is an interannual weather fluctuation, often lasting less than a year.

        • David Appell says:

          Gordon Robertson says:
          “…and CO2 warming could not possibly act that quickly.”

          CO2 warming is immediate — as soon as the molecule is released into the atmosphere.

          In fact, in just two months the CO2 produced by burning a gallon of gasoline radiatively blocks an amount of heat equal to the energy obtained by burning that gallon of gasoline. (David Archer)

          • barry says:

            Gordon is talking about a years worth of variation amounting to a few tenths of a degree. CO2 warming over a year (based on the long-term trend) is on the order of a few hundredths of a degree.

            CO2 is definitely not responsible for the interannual fluctuations we see in the record. The long-term signal is utterly swamped at the time scale of a few months by internal variation (ENSO, etc).

            That’s why you need long-term analysis to tease out any CO2 signal.

          • Gordon Robertson says:

            DA…”In fact, in just two months the CO2 produced by burning a gallon of gasoline radiatively blocks an amount of heat equal to the energy obtained by burning that gallon of gasoline”.

            David…CO2 cannot block heat. Heat is the kinetic energy of atoms and molecules and to block heat you have to block the transfer of atoms and molecules. That’s what the glass in a greenhouse does.

            In radiative heat transfer, infrared energy is the transporting medium, not the heat itself. Heat is related to atoms and localized to atoms, specifically to the electrons. If atoms radiated IR, they cool, case closed, unless something else maintains the heat level in the atoms like solar energy. The transfer occurs when IR is absorbed by other atoms, causing their energy levels to increase hence their temperature.

            Heat in the radiator is not the same heat in the absorber. They are not the same atoms.

            Physicist/meteorologist Craig Bohren referred to heat trapping by GHGs as a metaphor at best and at worst, plain silly.

          • Gordon Robertson says:

            barry…”Gordon is talking about a years worth of variation amounting to a few tenths of a degree”.

            Not just that, Barry, I am referring to the 1.5C suddenly appearing after a strong El Nino and representing a positive anomaly that remained flat for 15 years.

            I realize one has to be careful, with anomalies. The entire range of the UAH record could represent an overall warming and likely does. I am not debating that. In fact, when you select an average retroactively, such as the present UAH average of global temps from 1981 – 2010 then compare the overall data to that average, you have to be fully aware that you are not seeing a record of absolute temperatures.

            There’s a dynamic in the data with anomalies that changes constantly. When the average changes with the data and time you have to be mighty careful.

            Given that restriction, and trying to work within it, I think it’s vital to look closely at the data and try to tease out what it’s trying to tell you. In that respect, the sudden rise in 2001 to about 1.5 C above the 1981 – 2010 average is more than a simple variation.

            Had the average carried on naturally with a positive trend from 1997 I could understand that. However, in between, there was a relatively massive, brief global warming. After the spike, the global average suddenly appeared above the baseline where it remained for at least 15 years.

            That could be partly an artifact of the statistical analysis. As John Christy pointed out, the trend is like a see saw with one end of the range affecting the other.

            I am not pushing this hiatus and smirking at alarmist, I want to understand what the heck is going on. There is something going on in the atmosphere and it chagrins me that some people are willing to write it off to something as simple as ACO2 warming.

            The Tsonis et al study compared oceanic oscillations over a century and found a correlation between the phases of the oscillation. Global warming/cooling varied with the degree the oscillations were in or out of phase.

          • barry says:

            Not just that, Barry, I am referring to the 0.15C suddenly appearing after a strong El Nino

            What?? That was directly after 2 years of a strong la Nina. 1999 and 2000 were la Nina years.

          • Tim Folkerts says:

            Gordon, we may have been through this before, but “heat” is used many different (and often self-contradictory ways) in various fields of science/engineering and various textbooks. As such, arguing about the meaning of heat is nearly pointless.

            For example, every physics book I have read defines U = internal energy as the thermal energy WITHIN a system, while Q = heat is a process of transferring U from one region to another. With this very standard definition, there cannot be “heat, Q, in an object” any more than there can be “work, W, in an object”. With this standard definition, when EM radiation transfers energy from a warm area to a cooler area, it is indeed “heat” in the sense that any physicist would understand.

            Yes — I have seen heat used the way you are using it (“Heat is the kinetic energy of atoms and molecules”). Sometimes this is done colloquially. Sometimes engineering texts do this. This is by NO MEANS a universal (nor even common!) definition of heat.

            So rather than arguing semantics or the possible superiority of one definition over another, it is much better to argue the physics. And the physics clearly says that U of the warm surface decreases and U of the cooler GHG molecules in the atmosphere increases as Q in the form of IR travels from one to the other. And since that Q would have escaped to space without the GHGs, it seems perfectly understandable to say the GHGs blocked the Q (heat).

          • barry says:

            Gordon,

            I am not pushing this hiatus and smirking at alarmist, I want to understand what the heck is going on. There is something going on in the atmosphere and it chagrins me that some people are willing to write it off to something as simple as ACO2 warming.

            Fair comment. Ok. This is how I see it.

            If CO2 and only CO2 influenced global surface temps we would see a monotonic rise, year on year in surface temps.

            But there is plenty of variability within the climate system on annual, interannual and probably mutlidecadal scales.

            So one should expect a bunch of fluctuations that drown out the CO2 signal.

            ENSO can cause global temp swings of 0.2C and more. Volcanos similar. AMO and PDO may (may) play a role at multidecadal scales (causing long-term global temp change of a few tenths of a degree) and possibly other ocean/atmosphere energy exchanges. Solar fluctuation plays a role (probably very small, and drowned out by in-system processes: ie, the 11 year solar cycle is not evident in the global temperature record). Cloud cover plays a role. Ice albedo. And there are other anthropogenic inputs that may make a difference, like industrial aerosols and black carbon on snow. And other things not yet discovered.

            If the globe were to warm by 3C over a century from CO2 (+feedbacks), then the rate would be 0.03 C/year.

            ENSO influence alone is nearly ten times greater at 0.2C over a few months. So any CO2 signal over a year or two is utterly swamped by this interannual variation.

            Most of the things mentioned above are cyclical or quasi cyclical, or fluctuations around a mean. They don’t create heat, just move it around.

            So to uncover an underlying CO2 signal, one would need a fairly long period of time. Obviously one year is way too short. So how long is long enough?

            If ocean/atmosphere cycles can be as long as 60 years (one full cycle) then you’d need at least 60 years.

            But the CO2 signal should be strong enough to emerge from that in less time, probably 30 years.

            There are numerous statistical tests done to try and establish a time-frame long enough that natural fluctuations cancel out and get a fair average that’s not too susceptible to them if they happen to have a different evolution over the period. The results centre on about 30 years. This is the classic climate period for global climate given by the WMO.

            And that’s why trends over shorter periods should be treated (statistically) with great caution. They may not reflect the underlying, long-term trend. The bit of the IPCC you refer to on the slowdown 1998-2012 comes with this exact caveat.

            As skeptics well understand, the 2016 el Nino bumps up the trend since 1998. I think we all agree that such a short time period trend is susceptible to how temperature evolves over a few months. So a trend analysis is giving more weight then, to short term influences than any long-term signal.

            One could try to numerically account for the degree of influence these natural variations have and remove that to discern the underlying trend. There are studies that ave attempted this, which, of course, reduce the interannual variability (the ‘noise’) in the data and thus the uncertainty in the resulting trends.

            But this is a tricky operation.

            It’s easier just to use a long-term period, where the fluctuations cancel out.

            For instance, if I run a linear trend from 1950 to 2014, and then compare that with a trend from 1950 to Dec 2016, the difference will be tiny. The 2016 el Nino has a tiny effect on the trend at this length. But run a trend from, say 2002 to 2014, and then again to Dec 2016 and the difference is much more pronounced.

            Because at short time-periods, annual variation (weather) has a larger influence.

            There’s no reason to expect global temperature evolution should be linear. It isn’t. Linear trend analyses give us an idea of the overall change, but doesn’t do much for details.

          • David Appell says:

            Gordon Robertson says:
            “Heat is the kinetic energy of atoms and molecules and to block heat you have to block the transfer of atoms and molecules. Thats what the glass in a greenhouse does.”

            I dare you to stick your hand in front of an infrared laser.

          • Kristian says:

            Tim Folkerts says, April 5, 2017 at 1:54 PM:

            (…) the physics clearly says that U of the warm surface decreases and U of the cooler GHG molecules in the atmosphere increases as Q in the form of IR travels from one to the other. And since that Q would have escaped to space without the GHGs, it seems perfectly understandable to say the GHGs blocked the Q (heat).

            I wonder, exactly what Q are the “GHGs” blocking?

            If there were no atmosphere (or “GHGs”), the average Q_in from the Sun to the global sfc would be, say, 300 W/m^2. In a steady state, the Q_out from the sfc (all radiative) would balance this. So: 300 IN, 300 OUT.

            With an atmosphere (or “GHGs”), the average Q_in from the Sun to the global sfc is ~165 W/m^2, while the Q_in through the ToA is ~240 W/m^2. In a steady state, the Q_out from the sfc (only partially radiative), and the Q_out from the ToA (all radiative), would both balance these values. So: 165 IN, 165 OUT (sfc); 240 IN, 240 OUT (ToA).

            The average Q_rad (‘net lw’) escaping the global sfc of the Earth is ~53 W/m^2. The average Q_rad (=Q_out) (OLR) escaping the global ToA, however, is ~240 W/m^2, more than 4.5 times the intensity of the sfc Q_rad.

            So how exactly are the “GHGs” blocking sfc Q from escaping to space?

          • Tim Folkerts says:

            Kristian says: “If there were no atmosphere (or GHGs) …

            These two different options (no atmosphere vs no GHGs). You seem to be comparing the CURRENT conditions on earth to an earth with NO ATMOSPHERE at all. I am comparing the CURRENT conditions on earth to an earth with NO GHGs. To me this is the more logical pairing to compare.

            So if we kept everything else the same, but magically removed just the CO2, then the 40 W/m^2 in the “atmospheric window” of Trenberth’s diagram would increase because we basically made the “window” bigger. Some of the IR from the surface that would have been absorbed by the atmosphere will now escape to space.

            “So how exactly are the GHGs blocking sfc Q from escaping to space?
            Well, I think I just explained it. The GHGs in earth’s current atmosphere block some of the current surface IR from escaping.

            [In fact, look just at the 15 um band. Even with YOUR comparison, there is less 15 um IR escaping now than there would be with no atmosphere at all. So again, CO2 would be reducing this particular sort of IR, while increasing other wavelengths of IR.]

          • Kristian says:

            Tim Folkerts says, April 9, 2017 at 5:55 PM:

            I am comparing the CURRENT conditions on earth to an earth with NO GHGs. To me this is the more logical pairing to compare.

            Yes, I gave you that option. It makes no difference.

            So if we kept everything else the same, but magically removed just the CO2, then the 40 W/m^2 in the “atmospheric window” of Trenberth’s diagram would increase because we basically made the “window” bigger. Some of the IR from the surface that would have been absorbed by the atmosphere will now escape to space.

            We’re not talking about IR from the surface, Tim. We’re talking about HEAT [Q] from the surface.

            “So how exactly are the GHGs blocking sfc Q from escaping to space?”
            Well, I think I just explained it. The GHGs in earth’s current atmosphere block some of the current surface IR from escaping.

            What are you referring to here? The calculated 398 W/m^2 “IR flux”? Or the actual average radiant heat flux of ~53 W/m^2?

            If you’re referring to the latter, then I must ask you to read my comment and my question to you once more. In what way are the “GHGs” blocking any sfc Q from escaping!?

            If you’re referring to the former, then that’s not sfc heat, Tim, and you know that. This whole (nonsensical) idea of 398 W/m^2 going out from the surface, but only 240 getting to escape through the ToA to space, that’s NOT about the “GHGs” blocking surface Q from escaping. Is that what you think?

            [In fact, look just at the 15 um band. Even with YOUR comparison, there is less 15 um IR escaping now than there would be with no atmosphere at all. So again, CO2 would be reducing this particular sort of IR, while increasing other wavelengths of IR.]

            But is this surface HEAT, Tim? Think about it. Are you in fact as confused as Norman on this issue …? Or are you just pretending to be?

      • Bart says:

        “Look how averaging laughable four grid cells gives, for the 1997/98 El Nino, the same data as what is obtained from the 9,504 cells!”

        Stop the presses! Somebody rediscovered the Intermediate Value Theorem.

  2. Skeptikal says:

    Is this the beginning of a cooling trend?

    • Probably not. One month’s change seldom has predictive value.

      • Ross Brisbane says:

        And your probably correct. Thanks for your comment. Here in QLD Australia we had our WARMEST March 2017 ON RECORD.

        The QLD state of Australia is most subject to EL Nino/LA Nina trends one or another then ANY OTHER PART of our globe! A great indicator of our coming from EL Nino heat.

        And might add that additional heat does not come from fairies or some cloud formation unknown that allows more sunlight in.

        This cooling trend is “normal” after an El Nino spike but I would want ALL here to look at the graph of MINIMUM trends and BELOW the line MINIMUM trends – they ALL TREND upward.

        Many who just follow their own herd mentality are simply not aware of deduction of EL Nino welling up of global temperatures. Climate scientist have taken in account the El Nino spikes and there is STILL a warming trend that punctuates through variability of climate.

        Might I add, those implied CYCLES that justify an ideological non-action on global warming as government policy to mitigate. We are definitely warming and regardless of implied saturation of the effect greenhouse gases and other unknown conjecture of cooling cloud formations – the warming pattern will continue way beyond our own century of denials.

        • Robert Austin says:

          But warming is good, Mr. Projector. Bring it on.

          • David Appell says:

            Good for whom?

          • Ross Brisbane says:

            Good for what? 50 degrees C that hit crops and killed them off? Category Cyclonic activities (over land that are greater intensity). Flooding damage to many cities and town costing billions of dollars. Crop failures, cattle drowning, Rainfalls off the chart, pressure gradients of cooler eastern colliding with hot inland heat that generates storm cells with damaging hail, flash flooding, crop damage and home owner damage. You are living Disneyland if thin a warming world is all good.

            Maybe in a Roy Spencer and a climate denier world of that global warming cannot be increasing bad news and lead to greater damage to our way of life.

          • Robert Austin says:

            “Ross Brisbane says:”

            Your wild projections are not based on mainstream science. Estimates of climate sensitivity to atmospheric CO2 concentration have been decreasing except in your fervid imagination.

        • WizGeek says:

          Get a grip, Ross of Brisbane. I say your temperature peaks are due to a combination of cyclic drought and wind across the Northern Territory depositing heat in Queensland, but it’s near impossible to isolate it from the effects of the Milankovitch Cycles and our planetary system bobbing up and down through our galaxy’s dust spirals. [SMH]

          • Ross Brisbane says:

            Get a grip on yourself. Do you really know what we in Australia have really been through over the last 6 months?

          • Ross Brisbane says:

            No heat does not come from fairies. It comes from additional energy in the climatic system. Battery storage maybe?

            Your BS about dust clouds and far out speculations come from the minds of wingnut theory.

            A far easier recognition of real science and the physics of CO2 energy conservation is far more credible then your spaced out junk.

    • Richard M says:

      As we move into summer the lack of sea ice in the Arctic has less of an effect. This should have a negative influence on the global anomaly. We haven’t had a real La Nina (except in the 3.4 region) so the overall impact of ENSO on global temperature has been small for the past 6 months and that shouldn’t change much.

      I’d say to trend should be down until next fall and by then ENSO should be better understood than it is now and can then be factored in.

      • barry says:

        As we move into summer the lack of sea ice in the Arctic has less of an effect.

        This seems backwards. Moving into summer the sun comes up over the Arctic, and any changes in albedo (ice cover) have a greater effect when the sun rises.

    • richard verney says:

      Probably not since we are not in La Nina territory.

      ENSO is currently slightly positive, and if anything the prospects of having a double EL Nino appear stronger than the next phase being a La Nina.

      Further, the satellite data appears more sensitive to El Ninos than it does to La Nina. Perhaps this is due to convection. Whatever the explanation, for there to be significant cooling in the short term, one would probably need a return to La Nina conditions.

      • Bindidon says:

        Further, the satellite data appears more sensitive to El Ninos than it does to La Nina.

        When looking at a superposition of NINO3+4 (scaled and shifted) with two UAH6.0 plots (Globe, ENSO area)

        http://fs5.directupload.net/images/170404/rlm7k5ik.jpg

        I would rather say that the correlation between them is by no means evident as usually pretended (excepted for the Ninos in 1998 and 2016).

        • Nate says:

          If you take into account volcanoes in 82 and 91, the correlation I think is good

        • barry says:

          Further, the satellite data appears more sensitive to El Ninos than it does to La Nina.

          Is this different to the surface data sets?

          It may be that la Ninas are generally less intense than el Ninos. Checking the various ENSO indices, this looks to be the case.

    • Climatechange4realz says:

      Yes! Get ready! Those nut job alarmists better come up with another excuse to explain the cooling quick before there agenda gets torn into a million pieces! The clock is ticking! Don’t let warmies like dr roy spencer throw you off! The sun is and always will be the primary controller of climate change not mankind! El Nio is coming back and the temperature is still cooling. Ocean currents have nothing to do with average global temps! Global cooling is here and is only going to get worse through the early 2030s and maybe even 2040s just as history tells is back in the 1800s and 1600s with the dalton and Maunder Minimum!

      • As for you dr spencer. I believed in you but you have betrayed all of us who tell the truth about climate change. I am ashamed of you. Hopefully the next few years of global temp decline will convince you what is really controlling the earths climate. Good luck in the scientific community.

        Signed

        ClimateChange4realz

        • Robert Austin says:

          Dr. Spencer “betrayed” you. Are you delusional? Dr. Spencer never set himself up as a climate prophet in the manner of your Hansens and Gores. On the contrary, Dr. Spencer has always exhibited scientific humility in pursuing the overwhelmingly complex question of the earth’s climate. You are the one that should be ashamed.

          • Robert, there is no question. The sun is and will always be the main influence on the earths changing climate with or without the help of mans puny contribution to the climate system. Read my comment below this that disproves the man made global warming myth and feel free to do your own research. If you have any further questions or counter arguments that are actually scientific related then i will be happy to serve you.

          • Here is the comment:

            ClimateChange4realz
            April 5, 2017
            For those of you who want to know the truth about climate change read this comment!

            To answer your questions Tony:

            Answer: good question Tony. The reason for this is because there is also short term climate affects and shorter variabilitys in the climate buget such as blocking of radiation from major volcanic plumes such as the one in the early 1900s. Short term positive feedback loops such such as brief recovery spikes which are common in the climate system after steep short term drops and shorter solar cycles which also cause much of the short term variability. The sun is the main role in climate and causes over 90% of the climate change here on earth in the long term. Cycles range on the order of tens of thousands of years to as little as 6-8 years. The cycle that is going to have most of an affect on our life time is the 200 year bicentennial cycle and the 30-40 year schwibe cycle. Right now the past 200 years of warming induced solar cycles have reversed themselves and the earth is about to go through a major cooling possibly as bad as in the early 1600s in the middle of the little ice age. The cooling affects should be noticible to all towards the bottom of this 6-8 year solar cycle 25/26. Around the year 2022. The magnetosphere has already been getting substantially weaker allowing more cosmic rays to enter our atmosphere causing greater cloud cover and more albedo and reflection of UV rays. Also causes the flow to shift which is what is really responsible for these wacky weather patterns we are having. This is because as the jet stream moves out of place and flows mix the jet stream gets stuck causing major high pressure and low pressure areas to stall causing warmer and then cooler then normal temps as well. An example will be the warm winter in the southeast causing the cherry blossoms to bloom early and then freeze in march due to an unexpected hard freeze which can have gargantuan effects on reducing agricultural growing zones and causing food prices to increase. As for humans affects on the climate. They have such a small impact as co2 makes up only about 9-18% of the total ghg affect but humans emissions from fossil fuels make up less then 3% of that. Its role on climate variability in the atmosphere can also explain how much co2 concentration ppm in the atmosphere as well which is a whooping 0.04%! The earth has been warming over the past 100 years but is due to changes in solar activity not increase man made co2 which is really a substantial plant fertilizer to many plants as many have learned in elementary school! Dont let the alarmists fool you on there predictions! All 72 iPCC models have been predicting global warming for the past 19 years now when there hasnt been any! something AGW alarmists love to stay away from! What about the prediction about the glaciers melting? WRONG 62 of the worlds glaciers have actually been on an increase. What about the Greenland ice cap melting? WRONG! Its been growing at a record pace blowing away many records. What about the artic ice cap that wa supposed to be gone by 2013 according to our good old pal al gore? STILL THERE! Sorry al! What about the scientists who predicted that in 1998 the earth would plummet into a giant ice age causing food shortages and human extinction! WRONG! Why am I still alive? What about the city of manhattan will be under water by the end of the 1900s. WRONG! What about an increasing number in Atlantic hurricanes? WRONG! In fact 2014 just a few years ago was one of the questist on record! What about the moron in the early 2000s who claimed snow will be a thing of the past and children wont know what snow is! WRONG! The past few winters were one of the snowiest on record for the eastern US and this year the western US got there slice of the pie. What about an increase in the amount of summer heat waves? WRONG! Summer heatwaves have been much worse in the 1930s then this! What about the claim of increase storminess? WRONG! Although the past few years have been seeing more storms due to increase in galactic cosmic rays penetrating the earths atmosphere the long term trend shows storm and flood related deaths on a decline over the past 100 years when the earth was supposedly warming. What about the Antarctic ice cap melting into oblivion? WRONG! Although the Antarctic ice cap saw some decline this year mainly due to an increase in under water volcanic activity and shift in ocean currents NOT man kinds co2 emissions! the past couple years before it (2014 and 2015) have seen record sea ice extent blown away! What about all the polar bears drowning and dying? WRONG! Polar bear population has been increasing dramatically! What about the drought that was supposed to happen in California? WRONG! Record rain that broke a huge dam earlier in the year and record rain 2015-2016 year as well mainly due to strong El Nio! Take the scam for what it is and dont believe in any of it! Have any other questions feel free to ask. I will be back shortly to provide links to support my claims as a real scientist would do!

          • Here are all of the links:

            Here is the adapt 2030 YouTube channel to get you ready for where the earths climate is really headed! I reccomend you watch all of the movies in order. (Oldest to newest)

            http://tinyurl.com/n35uwzw

            Here is a list of videos by a YouTuber 1000 frolly. Watch all the videos to receive full education on why the sun is the main controller of the climate not mans co2 emissions from fossil fuels:

            http://tinyurl.com/kq7nfyj

            Another video disproving man made co2 myth

            https://m.youtube.com/watch
            v=_u81qXOYfKg

            Marc Maranos climate hustle documentary recommend for starters:

            http://tinyurl.com/kl2x82q

            great global warming swindle (video) recommended for beginners

            https://m.youtube.com/watch?v=t4fa32O3GFQ

          • Sorry that third link came out wrong here it is:

            http://tinyurl.com/logcu44

  3. Kevin White says:

    No surprise, I expected temperatures to crater during the first half of this year as they regress back towards the mean before the developing El Nio’s influence kicks in later on. We’ll remain ENSO-neutral through the end of summer so there is more cooling still left to occur.

    • bea says:

      The result is in line with Global Sea Surface Temperature Anomalies which have flat-lined recently:

      http://www.tropicaltidbits.com/analysis/ocean/global.png

      The Tropical Storm season (2016/2017) in the Southern Hemisphere is shaping up to be the quietest in fifty years:

      http://models.weatherbell.com/tropical.php

    • barry says:

      Well remain ENSO-neutral through the end of summer so there is more cooling still left to occur.

      ENSO has been in a cool phase since July last year and has warmed recently. 3 of the past 5 months have been warmer than the previous month. It’s impossible to predict what will happen yet.

      • Richard M says:

        While ENSO 3.4 has been cool, the 1-2 region has been warm. Globally they have probably cancelled each other out giving us fairly neutral conditions.

      • barry says:

        The 1-2 area is much smaller than 3-4. At this end of the climb down from peak el Nino, various other factors around the globe will have have influence.

        El Nino is not the only property affecting short-term global temps. It tends to dominate during Nino/Nina events, but shouldn’t be mistaken for the sole cause of interannual fluctuations.

      • Bart says:

        “Its impossible to predict what will happen yet.”

        Hardly. You can predict anything. It just might be wrong.

        However, with the AMO firmly in a negative phase, and the PDO crashing down, the likelihood is that Kevin is correct, and there will be continued cooling for the next couple of decades.

        • David Appell says:

          Bart, I’ll bet you $500 that the average global temperature for the 2030s will be higher than that for 2010s. (Baring a huge volcanic eruption or large meteor impact.)

          • Bart says:

            I anticipate that by the 2030’s, you will be a distant memory.

          • Obama says:

            No kidding!? The current real world observable warming trend is about 0.15 degrees centigrade per decade. I fully expect 100 years from now that 2120 will be about 1.5C warmer than today! Whoopee-doo!!!

            Want to make a $500 bet!? 2120 will be less than 2 degrees centigrade warmer than today.

          • coturnix says:

            I anticipate that by 2030 $500 may be will buy you a burger and fries, or possibly not

          • David Appell says:

            Bart, I knew you didn’t have what it takes to put your money where your mouth is.

          • David Appell says:

            Obama says:
            “The current real world observable warming trend is about 0.15 degrees centigrade per decade. I fully expect 100 years from now that 2120 will be about 1.5C warmer than today! Whoopee-doo!!!”

            a) why do you expect the rate to stay constant?

            b) why do you think 1.5 C is irrelevant?

            c) what is the difference in average global surface temperature between an ice age glacial period and an interglacial?
            (A: 5 C = 2 miles of ice over Chicago)

        • barry says:

          PDO come crashing down? It had been in a declining phase since the mid-80s and just ticked up with the new el Nino.

          http://tinyurl.com/lkb7k7p

          You predict that the cycle is about to go back down again fairly immediately, Bart?

          • Bart says:

            Un-smooth it. Then, compare the latest blip to 1960. Yeah, I expect a crash in the not too distant future.

          • barry says:

            If I unsmooth it I don’t see cycles, I see irregular fluctuations.

            http://www.woodfortrees.org/plot/jisao-pdo/from:1900

            Flattish to late 1930s, then a parabola from 1940 to 1980. 40 year *cycle*.

            If that parabolic curve is *the* cycle, then we have another 3 years of warm temps to peak, then a decade of still warmer temps but heading into a trough, which will bottom out (crash) around 1940.

            I wonder if your eyes and mine see the same thing.

            Gathering all you’ve said before, if AMO ad PDO coincide to trough at the same time, then global temps should be roughly what they were the last time this happened in 1970-ish (and possibly 1920-ish).

            http://tinyurl.com/lpudvh6

            I’ll plot a 5-year moving average of decadal temp data centred on the 1920 and 1970. Semi-arbitrary choice to give us some idea of the mean temps around 1920 and 1970.

            http://tinyurl.com/lss64m2

            Fairly different decadal average, warmer for 1970.

            I’ve linked to the site rather than the image in case you want to make different choices (based on concurrent troughs/peaks AMO/PDO). I realize you may not agree with mine, and so you’re most welcome to adjust as you see fit and present the results.

          • barry says:

            Someone has, with a few tweaks, fit the number of pirates in the world to global temperature since the 1880s.

            http://www.fico.com/en/blogs/wp-content/uploads/2015/05/Pirates-chart.png

            My eyeball tells me that rising global temperatures is caused by a decrease in the number of pirates.

            I mean, it’s pretty obvious! Just use your eyes for crying out loud!

            http://www.fico.com/en/blogs/analytics-optimization/beware-pirates-big-data/

          • Ball4 says:

            Barry, good point; was wondering when someone would get around to that comparo. Someone wrote a song about lying eyes.

          • Bart says:

            Such pitiful flailing.

          • Ball4 says:

            But the decrease in pirates is good for us right Bart? Less pirates good, more pirates bad. You can’t hide your lyin’ eyes. Those lyrics are so true even today.

          • David Appell says:

            The PDO doesn’t create heat, it just moves it around. Obviously.

          • Kristian says:

            David Appell says, April 7, 2017 at 6:08 PM:

            The PDO doesn’t create heat, it just moves it around.

            Does it? Do you even know what the PDO is?

          • barry says:

            This is interesting. How would a fluctuating ocean/atmosphere exchange of heat create heat by itself?

          • Kristian says:

            barry, did I say the PDO creates ‘heat’?

            No, Appell stated that the PDO moves ‘heat’ around, and I asked him: Does it indeed?

            The PDO doesn’t create ‘heat’ and it doesn’t move ‘heat’ around either. If Appell (and you) only knew what the PDO really is, then this would be a non-issue.

            The PDO isn’t itself a physical phenomenon. It is an index tracking the fluctuations around a mean value of a very particular SSTa pattern (one of several!) in the extra-tropical North Pacific. It is merely a manifestation of certain large-scale physical mechanisms at work in – mainly – the Pacific basin.

          • Bart says:

            The absurd inconsistency of DA’s statement can be revealed simply by turning it around on him: CO2 doesn’t create heat, it just moves it around.

          • barry says:

            I know what the PDO is, Kristian, though the causes are not well understood.

            The PDO index is physically based – on sea surface temperatures in the eastern and Western Pacific North of lat 20. It has a cool and warm phase with opposite effects in those regions.

            Sure looks like “heat” being moved around to me. But maybe your quibble is semantic.

            It’s possible that it is a fluctuation rather than a cycle, like ENSO, but over longer time scales. We have barely 2 ‘cycles’, so regular periodicity is not proven.

  4. Hkan says:

    I sometimes ponder what the UAH temperature chart would look like if we didn’t have the El Chichn and Mt Pinatubo eruptions.

    I guess you have to Roy, haven’t you?

    • Bindidon says:

      Hkan says:
      April 3, 2017 at 8:07 AM

      It is very well possible to extract such events out of a temperature time series.

      Unfortunately, the two author groups who managed to do it extracted the ENSO signals before (the goal was to show what remains in a time series when you strip off ENSO signals AND volcano eruptions).

      Here is that of Santer et al. (2014):

      http://tinyurl.com/ksoytkl

      There is, afaik, no residual time series resulting from solely extracting SAOD changes due to eruptions.

    • barry says:

      As el Chichon happened around the same time as an el Nino, that would change the profile from a trough to a small peak. For Pinatubo, just remove the trough. The difference re long-term trend would be quite minimal.

    • Richard M says:

      What’s even more interesting is removing all the ENSO active months from the data. If you just plot the neutral for the last 20 years you get nearly a perfectly flat line. No warming at all.

      • barry says:

        I’d like to ask a question about your method.

        As peak global temps lag peak ENSO events by 4-5 months, did you account for this lag when selecting monthly global temps?

        I don’t think 9 years worth of actual data points is going to be very useful, but did you take this step when assessing the trend?

    • barry says:

      That’s equivalent to about 9 years worth of actual data points isn’t it?

  5. Mark says:

    It’s the same temperature now and mid 1980’s. What’s the big fuss about? 🙂

    • Elliott Bignell says:

      The trend rate.

      • Mark says:

        Yes right. It warmed since it cooled….

        It cooled from 1940 to 1975. (pre-manipulated) So the trend is flat over 75 years correct?

        • Elliott Bignell says:

          You have instantly changed the subject to data obviously not included in the data set used in the graph above. I infer that you understand both the big fuss and the trend rate perfectly well indeed.

        • Elliott Bignell says:

          And by the way, the most recent yearly moving average is a full 0.7K above that shown for 1985.

          • Ryan Shaffer says:

            In a few months, that trend line will likely be at .4 degrees Celsius above average over the last 40 years…which is much less than was predicted…by an order of 4 or 5.

            As far as your website…the only real thing they bring up is that global warming increases the number of natural disasters, which was already debunked Roger Pielke by actual science and measurement.

            Google his testimony to congress on youtube if you dare…

    • David Appell says:

      Mark says:
      “Its the same temperature now and mid 1980s. Whats the big fuss about?”

      No it isn’t.

      1984-1986 averaged -0.27 C relative to UAH’s baseline (v6.0).

      So far this year 2017 has averaged +0.28 C.

      2014-2016 averaged +0.31 C.

  6. JDHuffman says:

    CO2 levels have risen for 35 years, but UAH values indicate no statistically meaningful warming.

    There is no discernible linkage of temps to CO2.

    Maybe it’s time to re-think the AGW “theory”….

    • Elliott Bignell says:

      What is the level of significance for the warming shown? Give the trend-rate and coefficient of determination to two decimal places and show your working, please.

      • JDHuffman says:

        To show significance, one would have to separate out “natural variability”.

        • Snape says:

          Dr. Spencer,

          I followed Climate.reanalyzer last month and noticed that, as usual, the arctic was much warmer than the rest of the globe. Wondering if temps over the Arctic are accurately weighted in the UAH model?

          • Bindidon says:

            Of course they are.

            While UAH6.0’s TLT trend for the Globe is 0.12 C / decade for 1979-2016 , that for the Arctic is 0.25 (RSS 3.3 TLT shows even more: 0.35 C / decade).

          • Snape says:

            Bindidon: “Of course they are”

            So why does RSS show significantly more warming in the arctic than UAH?

          • Bindidon says:

            I don’t know, Snape.

            RSS 4.0 TTT, presented by the RSS team as the valuable alternative to RSS 3.3 TLT, shows
            — 0.18 C / decade for the Globe (what is way above UAH6.0, higher than GISTEMP)
            but
            — 0.27 for the Arctic (what is quite near to UAH6.0).

            All depends on which satellites you use, how you compensate their drifts, how you average their outputs.

            In comparison to that, surface “adjustments” seem quite a bit more transparent.

          • Snape says:

            I asked the question because I remember reading somewhere that the satellites have great coverage everywhere except the poles.

          • Bindidon says:

            1. UAH’s 2.5 deg grid does not contain valuable data below 82.5 S nor above 82.5 N

            2. In the document ‘http://www.nsstc.uah.edu/data/msu/docs/readme.msu’ you read:

            ALSO BE CAUTIOUS USING LT AND MT OVER HIGH TERRAIN ( >1500 M)

            The areas of poor anomaly values are : Tibetian Plateau,
            Antarctica, Greenland and the narrow spine of the Andes.
            Depending on how much of these areas are neglected, the
            coverage should be about 97-98% of the globe.

          • Gordon Robertson says:

            Bindidon…”UAHs 2.5 deg grid does not contain valuable data below 82.5 S nor above 82.5 N…”

            yes…but the temps shown are direct measurements from AMSU units and not statistical calculations from NOAA models.

            BTW, the NOAA sats from which UAH get their data contradicts their model-fudged surface records.

          • Gordon Robertson says:

            Bindidon…”While UAH6.0s TLT trend for the Globe is 0.12 C / decade…”

            Still hung up on imposing a straight line trend where it does not belong???

            UAH has to supply a statistical trend over the range but the trend tells you absolutely nothing about true warming or it’s cause.

          • Bindidon says:

            Gordon Robertson says:
            April 4, 2017 at 2:10 AM

            Bindidon’While UAH6.0s TLT trend for the Globe is 0.12 C / decade’

            Still hung up on imposing a straight line trend where it does not belong???

            What’s the matter with you???

            How can you pretend that?

            This, Gordon Robertson, is the exact information provided by UAH in their public data file:

            http://tinyurl.com/jrx6wcn

            If you aren’t even able to look at such a trivial information: why then do you write comments here?

          • barry says:

            Indeed – the linear trends are given by UAH at the link Bindidon provides – to the UAH data portal. They are at the bottom of the page under each zone: global, NH, SH, tropics, Arctic, Antarctic, etc.

          • Gordon Robertson says:

            Bindidon…”This, Gordon Robertson, is the exact information provided by UAH in their public data file…”

            Not debating that. UAH is required to give a statistical analysis based on the data. When stating a trend, they can’t hem and haw, science requires they state it statistically based on the overall set of data points.

            That’s a well known problem with straight averages.

            However, when you claim a trend of 0.12C/decade over 3.5 decades and claim there is also a flat trend of 18 years over the latter 2 decades, approximately, the inquisitive mind might ask why.

            It’s in the numbers. If you plug all the data into a statistical averaging algorithm without questioning the various contexts from which the data was taken, you’ll get 0.12C/decade. However, when you try to account for the 18 year flat trend, you have to put the numbers aside and ask why.

            Using endpoints on the range alone, you would likely get 0.12C/decade. That does not explain the 18 year flat trend, so you have to go back and draw a trend from 1979 – late 1997 then a flat trend from there on.

            What does that work out to per decade? If you understand that you might understand why Obama and NOAA worked so hard at making the flat trend disappear.

          • barry says:

            However, when you claim a trend of 0.12C/decade over 3.5 decades and claim there is also a flat trend of 18 years over the latter 2 decades, approximately, the inquisitive mind might ask why.

            As you’ve been answered on that dozens of times, you clearly lack an inquisitive mind.

            No, you have no curiosity whatsoever about this. Your mind is closed. And obviously there’s no use explaining yet again. You have your pet answer and are deaf to anything that speaks against it.

        • barry says:

          No, any linear trend type is statistically significant over the full satellite record (and the last 35 years).

          • Richard M says:

            Which is completely explained by the influence of ocean cycles.

          • barry says:

            Ah, the science is settled then.

          • Gordon Robertson says:

            barry…”No, any linear trend type is statistically significant over the full satellite record (and the last 35 years)”.

            Please explain the IPCC claim of no statistical warming trend over the 15 years from 1998 – 2012.

            While you’re at it, explain the lack of a trend for 18 years on the UAH data and their claim of little or no warming for 35 years of the record.

            How do you get a linear trend over the 35 years unless it’s pure number crunching?. There’s an obvious discontinuity at 1998 when the flat trend began.

          • barry says:

            Please explain the IPCC claim of no statistical warming trend over the 15 years from 1998 2012.

            We’ve done this to death with neither of us satisfied.

            While youre at it, explain the lack of a trend for 18 years on the UAH data

            One answer is that interannual variability kept temps depressed, magnified by using such a time period.

            Short answer is that the uncertainty precludes a claim of deviation in trend post-1998. IPCC also mention that – something I’ve quoted nearly a dozen times, for you, and which never seems to have pierced your mind.

            How do you get a linear trend over the 35 years unless its pure number crunching?

            The same way IPCC did it to give you the post-1998 trend you keep harping on about.

            If you’re going to reject the trend analysis for the whole record, then you must reject the IPCC trend from 1998 to 2012.

            It’s the same number-crunching.

            So are you going to accept the “number-crunching” for the IPCC trend rates (and therefore mine for the whole record), or reject my number crunching and therefore also the IPCC’s trend analysis?

            Be consistent. You can’t have it both ways.

          • David Appell says:

            Gordon Robertson says:
            “While youre at it, explain the lack of a trend for 18 years on the UAH data and their claim of little or no warming for 35 years of the record.”

            Why do you do this Gordon?

            Your 18-year claim is false, as I’ve told you many times. The other claim is also false.

            Do you not read replies? Do you not know how to calculate trends? Are you a pathological liar?

            I can’t think of any other possibilities. So which is it?

          • Bindidon says:

            Gordon Robertson says:
            April 4, 2017 at 2:15 AM

            How do you get a linear trend over the 35 years unless its pure number crunching?. Theres an obvious discontinuity at 1998 when the flat trend began.

            I think it’s time for me to stop reading comments written by this Gordon Robertson: he even doesn’t know anything about simplest trend computations.

            Here is the linear trend calculated for the UAH6.0 TLT time series for the period 1979 till now:

            http://fs5.directupload.net/images/170404/r28twetw.png

          • Gordon Robertson says:

            barry…”Its the same number-crunching.

            So are you going to accept the number-crunching for the IPCC trend rates (and therefore mine for the whole record), or reject my number crunching and therefore also the IPCCs trend analysis?”

            Neither Barry. I want to do science. John Christy has referred to the complexity of the atmosphere and the over-simplification of the AGW model. I think we are scratching the surface and I have a lot of questions that are not being answered.

            If you want to draw a trend line from 1979 – 2016, I have no argument you’ll find an indication of warming. I’ll even give you the benefit of the doubt that it’s significant. What I cannot accept is drawing the line in the first place because it has no meaning.

            Even Hansen admitted the surface record has little meaning due to the variations in temperatures over a few feet above the surface. You simply cannot install a thermometer in a housing at a fixed distance above the surface and think it will tell you anything meaningful. That’s especially true when those housing can be up to 1200 miles apart.

            I think this todo about global warming is politically based. It doesn’t interest me, I am interested in the physical causes and how they actually relate to the planet. At the same time, I have an interest in resisting the political correctness that has crept into science.

            I think science should be debated not sermonized from a podium.

          • Bart says:

            “No, any linear trend type is statistically significant over the full satellite record (and the last 35 years).”

            Nonsense. To compute a measure of statistical significance, you must have a model that matches the data, with a valid autocorrelation for processes which influence the estimate for the quantity in question.

            There is no such information available. When people proffer some fictional estimate of statistical significance, they are invariably assuming arbitrary models that they dreamed up with no connection to reality.

          • David Appell says:

            The “model” is simple this:

            radiative forcing of CO2 = constant*ln(CO2/initial CO2)

            AGW temperature change = constant*(radiative forcing change)

            CO2 is increasing exponentially.

            Hence AGW temperature change is expected to be linear.

          • barry says:

            Are you saying you have no idea what the trend of global temperature is, Bart?

            I believe you’ve said that warming has slowed down since 1998. But how can you claim such a thing when you also say there is no trend analysis that can account properly for the uncertainty? Shouldn’t your view, then, be that we simply don’t know how global temperature has evolved, because we can’t model properly for uncertainty?

          • Bart says:

            “CO2 is increasing exponentially.”

            No, it isn’t. It only took off significantly in the mid-20th century. It showed positive curvature in the late 20th because temperatures were rising. It leveled off to roughly linear increase when temperatures leveled off. It will decelerate when temperatures decline.

            Your model is unvalidated, and you are begging the question.

            “Are you saying you have no idea what the trend of global temperature is, Bart?”

            I am saying that global temperature anomaly does not fit the model of a linear trend.

          • barry says:

            You are saying that there is no model for global temps that gives us any information about uncertainty. Yet you confidently tell us what the evolution of global temperature is over various time frames, including the last 20 years.

            Either you know of a sufficient model to back up your claims so that you don’t caveat them with uncertainties, or you don’t know of a valid model for trend analysis and you should rescind all those claims.

            If there is a good model for determining uncertainty, what is it?

          • Bart says:

            “If there is a good model for determining uncertainty, what is it?”

            I know of none that have been done for the climate. I could create one, but I already have a job.

            “Yet you confidently tell us what the evolution of global temperature is over various time frames, including the last 20 years.”

            General properties are visible by inspection. Hard numbers… that’s a different ball game.

          • barry says:

            Ah, you’ve never done the analysis for uncertainty according to a model you haven’t yet developed. I think you should include this caveat whenever making claims about the evolution of observed global temperature.

          • Bart says:

            You make no sense, Barry. It’s like the following surreal conversation:

            Bart: Wow, that car is really zooming by.
            Barry: How do you know? Did you clock it?
            Bart: No, I just looked, and it went whoosh! Right on by.
            Barry: But, you didn’t actually get the speed?
            Bart: What’s your point?
            Barry: In this graph, the slope of its postion versus time is not all that steep.
            Bart: That’s just in the vertical dimension. You have to look at more than one dimension.
            Barry: It’s statistically significant.
            Bart: That is beside the point. You are applying an inappropriate model that consists only of vertical movement. I was standing on the road, and watched it go past, and it was really moving.
            Barry: But, you don’t have a numerical value.
            Bart: I was there. I was right there. And, it was moving fast.
            Barry: But, you refuse to quantify it.
            Bart: Why would I need to quantify it? One instant it was there, the next, varoom! Vanished down the road.
            Barry: I don’t think you can quantity it.
            Bart: What would be the point?
            Barry: Ah, then you haven’t done the analysis.
            Bart: ???
            Barry: As I suspected.

          • Norman says:

            Bart and barry

            You two aren’t working together to produce a climate change comedy routine are you??

          • barry says:

            To reply to the analogy I want to know how fast the car is going, and specifically whether it accelerated while we observed it. You say it did, but the acceleration was less after it passed us (we’re standing on a point marked “1998”).

            Fortunately, we have a speedometer that records velocity at regular time intervals.

            But you don’t want to analyse the speedometer data to verify that the car’s acceleration decreased after it passed us.

            Judge: Can you verify that the acceleration rate changed?

            Bart: No, m’lud. But I saw it with my own eyes.

            Judge: You have instruments that measure the velocity of the car over time?

            Bart: Yes m’lud, but it’s too onerous.

            Judge: You have the means to verify what you are charging but can’t be bothered to do so?

            Bart: I’m doing this pro bono.

            Judge: Case dismissed.

          • David Appell says:

            Bart says:
            “No, it isnt”

            It certainly is. The decadal averages are increasing faster than linearly.

            “It only took off significantly in the mid-20th century. It showed positive curvature in the late 20th because temperatures were rising. It leveled off to roughly linear increase when temperatures leveled off. It will decelerate when temperatures decline.”

            Why would it decline when we are pumping 40 billion tons of it into the atmosphere every year?

          • Bart says:

            “Why would it decline when we are pumping 40 billion tons of it into the atmosphere every year?”

            Because that is just a drop in the bucket compared to natural flows, and has little impact.

          • barry says:

            [CO2] showed positive curvature in the late 20th because temperatures were rising. It leveled off to roughly linear increase when temperatures leveled off.

            Let’s get some visuals on this. Eyeballometer is, after all, the best metric.

            CO2 1959 to present

            http://www.woodfortrees.org/plot/esrl-co2/from:1959/mean:12/plot/esrl-co2/from:1959/mean:12/trend

            Late 20th Century

            http://www.woodfortrees.org/plot/esrl-co2/from:1975/to:1997/mean:12/plot/esrl-co2/from:1975/to:1997/mean:12/trend

            Post 1998

            http://www.woodfortrees.org/plot/esrl-co2/from:1999/to:2016/mean:12/plot/esrl-co2/from:1999/to:2016/trend

            The two periods look roughly linear – no clear positive curvature for “late 20th century.” The period is vague enough to be a movable feast. There’s some positive curvature for the latter period, but slight.

            Comparative rates for the prior and latter period:

            1975-1997: 1.54 ppm/yr
            1999-2015: 2.04 ppm/yr

            Now, if there’s no acceleration (positive curvature) for the latter period, we should see a dead flat line on differentiated CO2.

            http://www.woodfortrees.org/plot/esrl-co2/from:1999/to:2016/mean:12/derivative/plot/esrl-co2/from:1999/to:2016/mean:12/derivative/trend

            Slope is positive, but we must caveat it’s unlikely to be statistically significant with that much variability.

            Comparative trend rates in acceleration:

            Whole record: 0.00237404 per year
            1975 – 1997: basically zero*
            1999 – 2015: 0.00304113 per year

            The rates are copied and pasted from the source. Obviously that many decimal places is unnecessary, but I wanted to give the figures as they were.

            Acceleration is greatest in the latter period. Caveats apply.

            * Direct copy and paste from source yielded: 4.40372e-05 per year

    • barry says:

      For the full period of the UAH temp record (38 years, 3 months) the warming is statistically significant.

      0.124 C/decade (+/- 0.062)

      Total mean warming since 1979 is 0.47 C.

      This is the lowest trend of all the major global temp data sets.

      • JDHuffman says:

        Now compare the last 38-year UAH record to the UAH record from 1900 to 1938.

        That might be something interesting.

      • barry says:

        Ah, you’re not serious. My mistake.

        • Snape says:

          If the satellites used in the UAH model have poor coverage over the arctic, and the arctic is where most of the warming is occurring, then that is obviously a big problem.

          • Robert Austin says:

            Snape.
            The area above 82.5 degrees not covered by UAH is a minuscule fraction (less than 1%)of the earth’s area so it is obvious that it is not a big problem.

          • David Appell says:

            It’s not obvious, since this is one of the fastest warming regions… and it’s left out.

      • Richard M says:

        But if you remove the influence of ENSO you get no warming over the past 20 years when nearly 40% of all CO2 emissions occurred and at the highest CO2/CH4 concentrations ever measured.

      • Gordon Robertson says:

        barry…”Total mean warming since 1979 is 0.47 C.”

        That’s pretty neat math, Barry. Let’s see, we had a flat trend from 1998 – 2015 centred around 0.15C. Prior to 1997, most of the anomalies were below the baseline.

        The real true warming, excluding the recent 2016 EN, is closer to 0.15C and that all happened in one year, 2001.

        Put away your calculator, Barry, and explain the physical causes. How did the globe warm 0.15C in 2001?

        You have gotten most of your warming from the 2016 EN, which is still cooling.

        • barry says:

          If I run the long-term trend from 1979 yo Dec 2015, or Dec 2104, the answer is pretty similar.

          Here’s yet another way of looking at the data:

          http://tinyurl.com/l7jasus

          That’s the trend from 1979 to 1998 inclusive (to give a high trend as possible for the period), including the predicted trend based on that with error bars to encapsulate the variability.

          I’ve omitted 2015 and 2016 from the observations to see whether the consequent temps fall within natural variability.

          http://tinyurl.com/kzkvlo9

          Open both images in tabs near each other and click from one to the other.

          The resulting temps to 2014 are within the error bounds. No statistically significant change in trend (there are statistical values that show the same thing – the uncertainty precludes any claim of a statistically significant slowdown. Yes, the mean trend line is lower after 1998, but the rate change is not a statistically significant one (IPCC does not discuss the uncertainty, but provides the error bars that support my contention).

          Now, it’s a little unfair to accept a super el Nino in 1998 (which gives us the slowdown), but reject a super el Nino in 2016. So what does the whole record look like?

          http://tinyurl.com/lzzf5bn

          Still based on the trend from Jan 1979 to Dec 1998.

          You think there’s been a step-jump. A sudden rise in global temps in one year. As you know, I disagree with your premise as well as your conclusions. I doubt repeating the argument will get either of us anywhere. But I see a trend from 1979 to Dec 1998, whereafter there is no statistically significant departure in trend, just interannual variability which keeps global temps relatively depressed for nearly two decades, but still within the region of the prior trend. The underlying trend is still apparent, and then 2016 comes along and exceeds the long-term trend for a few months.

          There is now a positive mean trend since 1998. It’s not a statistically significant trend – just within that period the globe could be warming, flatlining or cooling. But the trend from 1998 is statistically indistinguishable from the temp trend prior to it.

          This is the case no matter what correlation model is used, or what order polynomial, smoothing or any kind of trend analysis. I don’t have to cherry-pick a method. The result is the same.

          • Bart says:

            Hopelessly jejune. This is not a deterministic system, and these are not deterministic data. You are fitting lines to noise.

          • barry says:

            I created a test based on a linear assumption. That model holds good for the period of interest. If you disagree, you are free to demonstrate that.

            Even better, you are free to create your own test to answer Gordon’s remarks. It would be a marked improvement on criticising without doing any work to corroborate your criticism.

            IOW, stop waffling.

          • Bart says:

            “If you disagree, you are free to demonstrate that.”

            I don’t have to demonstrate it. You cannot just assume a model and calculate statistics based on it with no regard for whether it is a valid model or not, and pronounce it “truth”.

            Just look at the plot. The temperatures, appropriately scaled and baselined, match the CO2 rate of change. That is all you need.

          • barry says:

            I dont have to demonstrate it.

            Yes you do. Assertion doesn’t cut it. Never does.

            I pronounced no “truth”, just made a choice and followed through. And I invited you to do an improved method. Many times. You refuse. That’s not my fault. I remain open-minded.

            Just look at the plot. The temperatures, appropriately scaled and baselined, match the CO2 rate of change. That is all you need.

            Eh? That’s not the topic here.

            The CO2 rate of change correlation to temps shows that the instantaneous rate of change of CO2 correlates to monthly temperature fluctuations. That is all. Doesn’t have anything to do with what I’m talking about with Gordon, which is about temperature trends and their uncertainty.

      • Bart says:

        There is no basis to consider the data to fit the model of a trend with iid noise on top. Ergo, your claim of significance is just so much blather.

        • barry says:

          I’m getting the impression that if you were honest about the evolution of global temperature since 1979, you should be saying, “I am not certain.”

          • Bart says:

            I would say nobody is certain, and pari passu, that claims of statistical significance are just so much blather.

          • barry says:

            Then why do you tell us temps have been rising over the long term in one post and that they have hardly been rising at all in the last 20 years in another, neither claim accompanied by any mention of uncertainty? If you don’t know, you don’t know. Will you now stop making claims about global temp trends of any duration?

          • Bart says:

            These are qualitative observations. The temperatures fit a pattern, and that pattern is not a linear trend. Quantitative analysis based on an improper model, on the other hand, is pretty useless.

          • Nate says:

            Bart says:
            April 5, 2017 at 5:00 PM
            These are qualitative observations. The temperatures fit a pattern, and that pattern is not a linear trend. Quantitative analysis based on an improper model, on the other hand, is pretty useless.

            ‘Improper model’ means one that disagrees with Bart’s models. There is no point to trying any other model because it is self-evident that only Bart’s model is the proper one. It doesnt even need to be checked.

            Seriously though, there is nothing improper about trying a linear model (as Barry does), or testing Barts model (sinusoidal??) as he should. There are statistical tests to see which is a better fit, or maybe they are equally good.

            After finding the best statistical model for the data one can argue about whether it matches a theory. This is the usual way of doing things.

          • Bart says:

            So, a proper model is a linear trend? Sorry, that is not what the data show.

          • barry says:

            Nate didn’t say that. And you offer no alternative.

        • barry says:

          So what’s the proper model for quantitative analysis of the evolution of global temperature?

          If you know what it is, could you give us the uncertainty estimates for the trend since 1998?

          • Bart says:

            “If you know what it is, could you give us the uncertainty estimates for the trend since 1998?”

            I could, but it would require work. The model would have to include the long term trend that was in evidence before CO2 forcing could have established it, as well as the ~60 year cycle. What is left that could be ascribed to CO2 forcing after compensating for those is very little, indeed.

          • barry says:

            Perhaps I could prevail upon you to do the work?

            Have you ever done it? You could simply copy and paste the resulting values.

            If you’ve never done it, how can you make confident claims about the evolution of observed temperature if you don’t know the uncertainty?

    • David Appell says:

      JDHuffman says:
      “CO2 levels have risen for 35 years, but UAH values indicate no statistically meaningful warming.”

      Completely false.

      Do the math.

      • Bart says:

        Phony math. You do not have a validated model upon which to base claims of statistical significance.

        None of you guys apparently understand statistics. You think you can just load the numbers into a canned routine, and out pops truth. But, you have no understanding of the assumptions which go into the canned routine. It is just pitiful.

        • David Appell says:

          The linear trend is statistically significant.

          • Bart says:

            By what validated statistical model? None whatsoever.

          • barry says:

            In that case no no one can claim a slowdown in temps since 1998. And yet you do.

          • Bart says:

            Not really. The slowdown is due to the peaking of the ~60 year cycle, and that has been in evidence for nearly two whole cycles now, back to the turn of the last century. That’s a whole different kettle of fish than imagining a significant trend over a couple of decades, when a linear trend model clearly does not fit the data over the long term.

          • barry says:

            It seems you’ve done no statistical testing for the cause/effect and uncertainty.

            I’m beginning to suspect this is beyond your capabilities (no foul if so). It would appear hat your hypotheses re ocean forcing of temperature is done simply by eye-balling time series.

            Am I correct on the latter?

          • Bart says:

            Why do you think you cannot trust your eyes?

          • barry says:

            I trust my eyes, as far as that goes. But my eyes cannot tell if AMO leads regime changes in global temperature or if the AMO aliases global temperature.

            That’s when we need to do more than eye-balling. A lot more.

            Also because my logical mind suggests the possibility that the North Atlantic is a subset of the global system, and I now need to find out if its responding to global temp evolution or causing it.

            Neither of our eyes can discern that, and indeed if I do a bit of “pattern watching” of hemispheric temps, the Southern Hemisphere looks like it leads AMO. Which can’t be right if AMO leads temps.

            When we’re reaching different conclusions looking at the same things we use tools to give us a better view. But you don’t wan’t to do the *work* and use them.

            Bit of an impasse, eh?

          • Bart says:

            All you need are these two observations:

            1) Global temperatures have been rising at the same underlying rate, with an approximately 60 year cycle riding on top, since well before CO2 forcing could have been responsible for it. When those terms are subtracted out, there is very little left for CO2 to force

            2) the rate of change of atmospheric CO2 concentration is proportional to appropriately baselined temperature anomaly. That precludes human emissions of latent CO2 from being the primary driver of atmospheric CO2. It also precludes significant sensitivity of temperature anomaly to CO2, as that would indicate a positive feedback loop that would have driven us to a boundary condition eons ago.

            Those two observations are enough to scotch the notion that burning of fossil fuels is having a deleterious impact on surface temperatures. The whole thing is a farce.

            A) We are not the primary driver of CO2 concentration.
            B) There is no evidence that rising CO2 concentration has resulted in any deviation from natural, cyclic behavior of the climate indeed, given point A, it is quite impossible for CO2 to have a significant impact on temperatures in the present climate state, as this would produce unstabilizable positive feedback, and we would have reached a saturation point eons ago.
            C) Reduction of global temperature gradients would result in less extreme weather, not more.
            D) Warmth is good for life on this planet, cold is bad.
            E) CO2 is an essential nutrient for life on this planet. It has been decreasing steadily for eons, and has been approaching plant starvation levels in the relatively recent past. If anything, we need more of it, not less.
            F) Wind and solar power will never, ever satisfy more than a small fraction of our energy needs, and they are environmentally horrendous.

          • Nate says:

            Bart says

            ‘the rate of change of atmospheric CO2 concentration is proportional to appropriately baselined temperature anomaly. That precludes human emissions of latent CO2 from being the primary driver of atmospheric CO2. It also precludes significant sensitivity of temperature anomaly to CO2, as that would indicate a positive feedback loop that would have driven us to a boundary condition eons ago.’

            No it is not, when properly tested, as previously discussed. Plus this notion requires throwing out broadly validated data sets for CO2 history.

            ‘1) Global temperatures have been rising at the same underlying rate, with an approximately 60 year cycle riding on top, since well before CO2 forcing could have been responsible for it. When those terms are subtracted out, there is very little left for CO2 to force’

            No, one and half cycles is not sufficient to claim what you are claiming here.

            Why should temp keep rising at a steady 0.7C/century? When does this stop? If this is a recovery from LIA, as you say, then shouldnt we be settling down by now to temps prior to LIA?

            ‘Those two observations are enough to scotch the notion that burning of fossil fuels is having a deleterious impact on surface temperatures. The whole thing is a farce.’

            Bart, no these are your nutty ideas alone and are not accepted by anyone who is serious about the science. Therefore they do not scotch anything.

          • Bart says:

            You are too blind to see. It’s pretty obvious, though. One day, people will look back upon this circus and shake their heads, like we do now for silly things other people imagined in the past that seem so obviously wrong now.

          • Bart says:

            “Why should temp keep rising at a steady 0.7C/century?”

            Why shouldn’t it? It’s behaved similarly before.

            “When does this stop? If this is a recovery from LIA, as you say, then shouldnt we be settling down by now to temps prior to LIA?”

            Why should we? We can’t recover to a steady state if there is no steady state to which to recover.

          • Nate says:

            Bart,

            Recovery was your word. It implies return to normal, in this case after the lia. The lia forcing was Maunder minimum, ending in 1700. You say, recovery from this is a lnear rise .7C/cent, that apparently has no end. It is a nonsense model.

          • David Appell says:

            You don’t need a model to determine if a linear trend is statistically significant. You just need to calculate.

          • barry says:

            You can also test to see if a linear model is appropriate for the data. It isn’t for the full record, but seems to be (from statistical analysis I’ve read) from about 1970/75 to present.

            If a linear regression is an appropriate function for a sub-set of data, we can use that subset to explore other issues.

            The data determine what model is most valid, not assertion.

          • barry says:

            All you need are these two observations:

            But we disagree about what their correlation shows.

            So I invite further inquiry and you reject it.

            For the 134,678th time…

            Your observations show changes in the rate of CO2 rise at monthly scale correlating fairly well with monthly changes in global temperature data.

            So I see that acceleration is influenced by temps.

            But I do not agree that your observation demonstrate long-term correlation. Especially for the period when temps slowed down but CO2 acceleration didn’t.

            I also don’t believe for a moment that a 0.8C rise in global temps from 1959 is responsible for a 90 ppm rise in atmospheric concentrations of CO2, which is what your hypothesis directly implies.

          • Bart says:

            DA –

            “You dont need a model to determine if a linear trend is statistically significant. You just need to calculate.”

            Apparently, you do not understand the basis for statistical inference.

  7. Slipstick says:

    Another milestone based on an arbitrary calendric interval, which some people seem to find meaningful; the monthly UAH TLT has now been above the 1981-2010 average every month for 5 years.

    • Richard M says:

      When was the last time we had a La Nina? Would that be 5 years ago?

    • Snape says:

      Slipstick

      Agreed! People tend to get caught up on the calendar. For example, endless comparisons between 1998 and 2016. But was December, 2016 really any more significant than January, 2017?

    • JDHuffman says:

      Would “5 years” be “an arbitrary calendric interval”?

      Most likely.

      • Snape says:

        I misunderstood slipstick. It wasn’t a complaint, he was just acknowledging the five year interval was an arbitrary number.

    • Bindidon says:

      The easiest way to look at it is UAH’s own anmomaly graph:

      https://wattsupwiththat.files.wordpress.com/2017/04/032017_tlt_update_bar.png

      Sans commentaires…

    • Bart says:

      Trivial observation. Temperatures have been rising. But, rising temperatures do not establish that humans have been driving them, and the rise has been far less than the models based on assumed CO2 response projected.

      • David Appell says:

        This paper shows that the downward infrared radiation impacting Earth is higher, and just at the bands where anthropogenic GHGs emit:

        Radiative forcing measured at Earths surface corroborate the increasing greenhouse effect, R. Philipona et al, Geo Res Letters, v31 L03202 (2004)
        http://onlinelibrary.wiley.com/doi/10.1029/2003GL018765/abstract

        Re: models. The agreement is quite good; see this graph:

        http://blogs.reading.ac.uk/climate-lab-book/files/2014/01/fig-nearterm_all_UPDATE_2017.png

      • barry says:

        Trivial observation. Temperatures have been rising.

        Bart, how can you say this when you don’t believe we can model for the uncertainty of any trend analysis. Shouldn’t your view be far less certain?

        • Bart says:

          You seem to misapprehend. I have not called the data into question. I have called into question your silly attempts at analyzing it by forcing it into a model which does not apply to it, and calculating statistics based on that model which are thereby inapplicable.

        • barry says:

          My view on temperature evolution is wrong because I’m using the wrong methods to assess trend and uncertainty, you say. But your view on temperature evolution is right because you’ve used no methods to assess trend and uncertainty and don’t even know what the appropriate methods are?

          “Professor, I’m applying an AR(eyeball) method to the data, which tells me my results are statistically significant.”

          F-

          • Bart says:

            I certainly know the appropriate methods. But, it is a lot of work. Not this simplistic stuff you are bandying about.

            It isn’t necessary, though, to make conclusions. Yes, definitely, in this case, eyeballing is far superior to utilizing arbitrary and inappropriate analysis techniques.

            Why do you not trust your own eyes?

          • barry says:

            Because they do not agree with yours.

            That’s not from trenchant opposition – I really don’t see what you’re seeing. A slowdown in CO2 acceleration after 1998 is simply not apparent to me just by looking at the graph you keep showing. Whatever limited testing I’ve done you’ve rejected. So I’m left with dismissal and no substance to fill the gap.

            Just the mantra of “look at the graph” repeated over and over and over and over and over again.

            Perhaps you could describe/name the appropriate model/methods. I have a friend who might be able to apply them and give me some answers.

          • Bart says:

            Draw a straight and level line through the middle of the CO2 rate of change curve since 1998. Do the data essentially hug that line? Yes, they do. Ergo, the data are consistent with a deceleration during the temperature “pause”.

            Your problem is that you are under the impression that a line drawn using a least squares fit is somehow better than the one described above. It isn’t. There is nothing holy and inviolate about a least squares fit, especially over short time spans where noise is dominant. Your eyes can make a better judgment than a canned analysis routine.

            What you have to do to get a realistic picture is defocus from the trees, and concentrate on the forest. The agreement between sea surface temperature anomaly and the rate of change of atmospheric CO2 is amazingly good for nearly 60 years. In the world of stochastic data analysis, it hardly ever gets better than this.

          • barry says:

            Hang on:

            I certainly know the appropriate methods [to assess trend uncertainty].

            But upthread you said:

            Barry: “If there is a good model for determining uncertainty, what is it?”

            Bart: “I know of none that have been done for the climate. I could create one, but I already have a job.”

            So you know the right method, but you haven’t created it yet.

            And ‘create’, isn’t the right word, is it? The data dictate appropriate trend models.

            Throw us a bone here, Bart.

            I don’t trust my eyes. I certainly don’t trust yours. That outlook is statistics 101. A qualitative opinion is by definition subjective. Until you quantify you’ve got nothing solid.

          • barry says:

            (Fixed formatting)

            Hang on:

            I certainly know the appropriate methods [to assess trend uncertainty].

            But upthread you said:

            Barry: “If there is a good model for determining uncertainty, what is it?”

            Bart: “I know of none that have been done for the climate. I could create one, but I already have a job.”

            So you know the right method, but you haven’t created it yet.

            And ‘create’, isn’t the right word, is it? The data dictate appropriate trend models.

            Throw us a bone here, Bart.

            I don’t trust my eyes. I certainly don’t trust yours. That outlook is statistics 101. A qualitative opinion is by definition subjective. Until you quantify you’ve got nothing solid.

          • Bart says:

            What can I say? You insist on keeping your eyes closed, and denying there is such a thing as sight. This is invincible ignorance. Nothing can overcome it.

          • barry says:

            Round and round in circles. Hard to believe you ever took a course in statistics. Which institute failed to give you the most basic lesson? “Analyse the data to avoid fooling yourself.”

      • Bart says:

        “This paper shows that the downward infrared radiation impacting Earth is higher, and just at the bands where anthropogenic GHGs emit”

        Another trivial observation. It is not (even remotely) sufficient evidence to establish AGW.

        • Slipstick says:

          No, not a “trivial observation”, rather it is empirical evidence consistent with the prevailing science. What is trivial is dismissing evidence without providing a single scrap of countervailing evidence or any justification for the dismissal.

          • Bart says:

            Poisonous night gases leaching from the ground is consistent with malaria (literally, bad air). Lack of rain is consistent with the displeasure of the Gods. Consistency oft leads astray. It is a necessary condition, but not a sufficient one, for making conclusions.

            And, I have presented copious evidences for my POV.

          • David Appell says:

            Bart seems to think that scientific hypotheses can be proved. They can’t.

            Another indication that mathematicians do not understand even basic science.

          • Bart says:

            They can, it just depends on your standard of evidence.

            In the courts, we “prove” guilt or innocence based on standards such as “reasonable doubt” or “preponderance of evidence”, but these do not provide actual proof.

            The preponderance of evidence standard is the level demanded for lesser, civil verdicts. The evidence for AGW does not even rise to that level.

          • Slipstick says:

            “Might be” correlations without analysis, or even a physical basis, do not constitute “evidences”[sic]. Evidence is observation confirming, or contradicting, the predictions of a hypothesis.

        • David Appell says:

          No, it’s not trivial, Bart — it’s exactly the signature one expects from AGW.

          • Bart says:

            No, it is the signature one expects from IR emitting material as it heats from whatever source. Trivial.

  8. Jaime Jessop says:

    Maybe this is what the early stages of a low solar activity climate looks like. A series of powerful El Ninos, followed by weak La Nina conditions but strong cooling. The weak La Nina fails to top up ocean heat content, therefore we get progressive cooling as the next El Nino dissipates yet more heat from Pacific surface waters. I can’t see a ‘step up’ in global temp happening if, as predicted, the current weak La Nina transitions to another strong El Nino, but we shall see.

      • ren says:

        The heat content in the ocean is falling.

        • barry says:

          For the last few months. Normal variability.

          • David Appell says:

            It usually happens when an El Nino occurs.

          • barry says:

            Really? It makes sense, but el Nino is not the only thing affecting Ocean Heat Content.

            Anyway, here is a long-term time series of ocean heat content. You can see plenty of short-term downturns and a long-term increase.

            http://tinyurl.com/kyuef5q

            This is not the first time someone got excited over a dip in OHC.

          • AaronS says:

            As i understand that paper it seems likely to me that graph is a model of an invalid model. Did the boat correction for surface temp influence the DW also? bc they sure seem to callibrate like it did. Haha.

          • AaronS says:

            The A.R.G.0 empirical data has nothing like that trend.

          • AaronS says:

            It is a miracle!!! Every time we model data when there is none it matches the global temp models! Its funny if u step back and look from a helicopter view. Nothing is working in the best data but once uncertainty sky rockets we understand.

          • David Appell says:

            Thanks for that graph. There are downward dips during El Ninos: for the 1982-83 El Nino, that in 1997-98, and 2015-16.

            But that recent loss seems over now: the change in the 0-700 meter region in the last quarter (4Q16) was a strong 1.05 W/m2, compared to 3Q16.

            But, yes, the long-term trend is certainly upward. For your graph, since 1955, I calculate the trend to be 0.25 W/m2.

          • barry says:

            As i understand that paper it seems likely to me that graph is a model of an invalid model. Did the boat correction for surface temp influence the DW also? bc they sure seem to callibrate like it did.

            These are subsurface temps, not sea surface (boat temps). It’s not from a a paper (although there are method papers describing it), it’s from an institute that monitors and updates ocean temps at various depths.

            The A.R.G.0 empirical data has nothing like that trend.

            ARGO data is used to create the OHC profiles like the one above. Older data is from XBTs.

            Perhaps you would be so kind as to link to the “ARGO data.” An up-to-date time series would be nice.

            You’ll probably hunt for it and find your way here:

            http://tinyurl.com/jbf2xco

    • AaronS says:

      Jamie, I am a supporter of a stronger sun and more natural warming last century due to increases in solar activity (TSI, UV, magnetics). Do you have a model? I do if u want to compare sometime let me know. If not we can compare notes. When i do the math I either need to invoke a lag from the sun to climate (plausible) or invoke some GHG. Im currently exploring Methane bc it is a very strong GHG and matches temp nicely. CO2 could also be a factor obviously. Let me know if interested and we can touch base.

  9. barry says:

    Still lots of wishful thinking about global cooling. The la Nina didn’t materialize, the trend since 1998 did not go flat by the end of 2016. Perhaps crossing fingers will be useful.

    • barry says:

      I’ll amend that slightly. The predicted (by skeptics) la Nina did not materialize in 3 out of 4 different indices. NOAA called it by their ONI method, but BoM, JMA, and the MEI index don’t have la Nina for 2016/17.

  10. SocietalNorm says:

    Thank you for your work, Dr. Spencer.

  11. barry says:

    For the UAH6.0 linear trend since 1998 to go flat again, the average temperature for 2017 would have to be less than -0.16 C. We haven’t reached that so far this year. We’re quite high above it. The average so far based on the first 3 months of the year is 0.28 C.

    If you want a visual for how low temps would have to go for the remainder of the year in order for the 1998 trend to flatten, check the temperature record at the top of this page. Temps would have to be as cool as 1985 for the remainder of the year.

    I reckon the odds are pretty low.

    If we look ahead to 2020 for a flat trend from 1998, we need a 3-year period of cool temps similar to those in 1994-96.

    Barring a massive volcanic eruption in the next two years, I reckon the odds of that are very low.

    • Norman says:

      barry

      The globe may not be cooling at this time and even warming some but is it warming at the rate the models predicted a few years ago. They keep tweaking the models to match the measured warming but that is not predictability of a model, it then just becomes a complex toy for adults to play with but not really a scientific tool designed to predict future events.

      Also, if carbon dioxide can prevent an ice age without burning up the planet, is that a bad thing? The human race almost went extinct during an ice age 70000 years ago. A large volcano on top of an ice age cooled the Earth and made life tough for our species.

      • barry says:

        They keep tweaking the models to match the measured warming

        Well, they’re not doing a very good job of it! The modeling done for AR4, and the next gen models for AR5 both have a very similar deviation from observed temps. Not much is different, really.

        What has changed is that recent temps moved back into the middle of the model ensemble. We’ll see how things progress.

      • David Appell says:

        Norman says:
        “They keep tweaking the models to match the measured warming but that is not predictability of a model”

        That’s called “doing science.”

        This happens with all models. The Bohr model of the atom was certainly “tweaked,” to say the least. Did you expect it to correctly predict every atomic phenomenon at the time it was first written down?

        • Jake says:

          The Bohr model only predicted Hydrogen correctly, which is why it’s not used anymore.

          So, Dave, are you saying we shouldn’t use models due to their lack of predictive ability?

          • David Appell says:

            You’re right. The Bohr model also didn’t predict the fine structure of H spectral lines. Or the Lamb shift, or the anomalous magnetic moment of the electron, or more.

            But the Bohr model was a necessary historical step to get to the right answer, which is relativistic quantum field theory.

            That’s exactly how science progresses.

      • barry says:

        David, they don’t tweak predictive GCMs to match temp observations. Doing the science in this case means getting the physics right and parametrizing dynamics in the system well enough. They don’t make tweaks to force predictive GCMs to match temps.

      • David Appell says:

        OK. But my understanding of what modelers do do is:

        1) try to include more natural processes in their models. For example, https://eo.ucar.edu/staff/rrussell/climate/modeling/climate_model_components_evolution.html

        2) work to improve parametrizations.

      • barry says:

        Yes, that’s a good page giving a brief overview over how they try to improve models and what components have been added and improved over the years.

        My point is corroborated by it (and the other things I mentioned) – there is no mention of observed global temps anywhere on that page. GCMs are not trained to global temperature. The ‘tweaks’ are not done to match observations.

        The whole process is very interesting. Control runs are done without any forcings to see how well they replicate things like cloud evolutions and ENSO and a wide array of dynamic processes.

        There’s a great time-lapse comparison between a control run and a satellite derived time-lapse of atmospheric flows and turbulence over a year. It’s amazing how similar they are, considering the model is based on physics and topography mapping.

        http://www.easterbrook.ca/steve/2014/02/climate-model-vs-satellite-data/

        The two images are running at different speeds, so the flows are slower in one than another, but check out how well the large-scale processes match. The author describes some differences between what the satellites and the model are “seeing.”

    • barry says:

      They keep tweaking the models to match the measured warming

      No temp data are used to calibrate predictive GCM runs (or control runs for same). Tweaking is done upon improved understanding of dynamic, in-system processes. If they used temps to calibrate, then you would be right.

      The next ice age is tens of thousands of years off. Not an immediate concern.

      If an ice age is a cautionary tale, then so are geological records of rapid global warming events, many of which are associated with widespread species die-off. Not that the human race would go extinct. But if we look to the past for signs of global disruption, cooling events are not the only source of interest.

  12. Bindidon says:

    Richard M says:
    April 3, 2017 at 2:06 PM

    Yes, Snape, there is a lot of warming in the Arctic over the past 20 years even as global temperatures have stayed flat. That means the rest of the planet has cooled. Think about it.

    This 1998 cherry-picking slowly but surely becomes a bit boring. I guess in a few years, when warming continues as it does actually, the start date will be moved toward an even better place promising ‘better’ data again.

    Lets us have a look at UAH6.0’s latitude trends for the whole satellite era (1979-2016) from 82.5 S up to 82.5 N:

    http://fs5.directupload.net/images/170404/w76g2xhh.jpg

    The ony place showing cooling at tropospheric levels (about 4 km above surface) is the Southern Circumpolar Current.

  13. TonyL says:

    I have a couple of questions:

    Why does the global temperature rise and fall so much over a few years? I know it is natural variability, but what is varying? I suspect changes in cloud cover.

    Why do some claim CO2’s effect will take a long time? The globe can clearly cool and warm quickly. CO2’s insulating effect would immediately resist any cooling, so it seems to me that CO2’s affect would be completely factored in after any significant cooling event.

    • barry says:

      There are lots of short-term factors at play. Insolation, cloud cover, ocean/atmosphere heat exchanges (el Nino/laNina is the most dominant cycle over a few years), occasional volcanic eruptions and more. Not all of the factors are known for short-term variation.

      Re CO2, let’s suppose that all of the warming since 1970 was from anthropogenic CO2. The trend for global surface temps (Hadley data) is 0.17 C/decade.

      That’s 0.017 C/year.

      As global temp swings per year can be far larger than that (0.2C), the underlying warming from CO2 is completely swamped at short time scales by other factors.

      As an analogy, a tide gauge can measure a change in sea of a few feet as the tide goes in and out, but the height of waves every few seconds can be much greater, especially during storms. Plot the tide rising from lowest to highest during a storm and you will see huge variation every few seconds while the ‘signal’ hidden in all that chop is a steady rise.

      • crakar24 says:

        Great analogy except the seal level started rising many, many, many, many years before the temp did.

        CO2 does not have an insuating effect, it does not work like a blanket trapping heat, if it did we would stuff our roof spaces with it during winter and I would have made a killing out of CO2 enhanced thermos flasks to keep your coffee hot on a cold day.

        Perhaps….maybe…..possibly the amount of energy leaving the planet varies dramatically despite the pile up of blankets made of pure carbon in our atmosphere.

        Yes I know I am a heretic and should be burned at the stake for speaking out against the state.

        OMG………..the temp for this month is 0.17C above the baseline we are doomed, doomed i tells ya.

        • David Appell says:

          crakar24 says:
          “CO2 does not have an insuating effect, it does not work like a blanket trapping heat, if it did we would stuff our roof spaces with it during winter and I would have made a killing out of CO2 enhanced thermos flasks to keep your coffee hot on a cold day.”

          You attic *does* have CO2 in it — from the air. But there’s quite a difference in the height of an atmosphere and the height of your attic. And your attic leaks heat constantly.

          Lastly, no one would want to live with an attic full of 100% CO2 in it — a leak could kill you (hypercapnia).

          Yes, CO2 certainly has an insulating effect. This is a scientific fact.

          • crakar24 says:

            Describe this insulating effect in detail please

          • Mike Flynn says:

            David Appell,

            Two things. Insulators are also used to keep things cool. Firemen wear heavy insulation – keeps heat out. Cold rooms are heavily insulated – keeps heat out.

            As to the attic leaking heat constantly – so does the Earth. That’s why it has cooled down over the last four and a half billion years or so.

            You are being as silly as Mann, Schmidt, or Hansen!

            You can’t make a thermometer hotter using CO2. Neither can they! A shared delusion is still a delusion. A fake fact, if you like.

            Cheers.

          • Norman says:

            Mike Flynn

            There are actual experiments that can be run in the lab to test the hypothesis of Carbon Dioxide’s ability to increase a surface temperature that has a continuous input of energy by emitting radiant IR back to the surface and having the overall effect of increasing the energy of that surface forcing it to reach a higher equilibrium temperature to balance the new net energy in.

            The experiment would be in response to your claim:
            “You cant make a thermometer hotter using CO2. Neither can they! A shared delusion is still a delusion. A fake fact, if you like”

            The design would be to have a hot plate with a thermometer. All tests would have the same input energy to the hotplate which would reach an equilibrium temperature (the value of interest, one where the temperature is no longer changing).

            In an enclosure above the plate you add high concentrations of different gases. Dry nitrogen at higher at high concentration (since the path length for the experiment would be small, maybe a meter or two, real atmosphere column is thousands of meters but that would make the test too expensive and difficult to run.

            Test the equilibrium temperature with dry nitrogen. Then try dry carbon dioxide (theory would suggest the CO2 will warm and emit radiation in all directions with some making it back to the heating surface with the thermometer, and now you have more energy added to the heating surface and the equilibrium temperature will be higher than in dry nitrogen test).

            You could also try very humid air and see what that effect is.

            This experiment should satisfy your claims and demonstrate a real GHE in a lab experiment. Hope that helps.

          • Norman says:

            Mike Flynn

            I just thought of this for the experiment I suggested. You would probably have to artificially cool the enclosure to some same temperature for all tests as if this warmed up it would also start radiating back to the plate and could overwhelm the study of the effect of the gases involved.

          • David Appell says:

            Mike Flynn says:
            “As to the attic leaking heat constantly so does the Earth. Thats why it has cooled down over the last four and a half billion years or so.”

            That’s wrong. The Earth’s climate has had many oscillations since we’ve been able to measure it (which does not go back 4.5 Byrs, and I’m sure you don’t have data saying so).

            “You cant make a thermometer hotter using CO2. Neither can they!”

            We’re doing in on Earth, right now.

          • David Appell says:

            crakar24 says:
            “Describe this insulating effect in detail please”

            Read

            “Principles of Planetary Climate,” Raymond Pierrehumbert (2010)
            http://www.cambridge.org/gb/academic/subjects/earth-and-environmental-science/climatology-and-climate-change/principles-planetary-climate?format=HB&isbn=9780521865562

            especially chapters 3 and 4. Let me know if that’s not detailed enough for you.

          • David Appell says:

            Mike Flynn says:
            “Two things. Insulators are also used to keep things cool.”

            During cold winters, insulation is used to keep a house warm.

      • Except that warming since the sattelite era from 1978 to present was caused by the sun which warms the earth naturally every 200 years or so. The trend however from 1998 to now experienced no significant global warming which marked the end of this warm era. We are now going into another solar minimum just like we did in the 1600s and 1800s. By the early 2020s there will be no “co2 causes disasterous climate change” babble anymore as everyone will realize we are cooling dramatically and the alarmists who support this phoney scam will have to comd up with another excuse as to why global warming is causing global cooling! My guess is climate geoengineering. They will say we tried to help everyone out by cooling the planet with chemtrails but we didn’t know how strong they really were so that’s why we caused it to cool this much but don’t worry we will be back to cool it some more once the affects of these chemtrails where off! Losers! History is repeating itself as it always has been. This climate change hype has been jammed down our throats for over 100 years now and history showed us every time the climate switched 30 year cycles they switch there scare tactics!

    • For those of you who want to know the truth about climate change read this comment!

      To answer your questions Tony:

      Answer: good question Tony. The reason for this is because there is also short term climate affects and shorter variabilitys in the climate buget such as blocking of radiation from major volcanic plumes such as the one in the early 1900s. Short term positive feedback loops such such as brief recovery spikes which are common in the climate system after steep short term drops and shorter solar cycles which also cause much of the short term variability. The sun is the main role in climate and causes over 90% of the climate change here on earth in the long term. Cycles range on the order of tens of thousands of years to as little as 6-8 years. The cycle that is going to have most of an affect on our life time is the 200 year bicentennial cycle and the 30-40 year schwibe cycle. Right now the past 200 years of warming induced solar cycles have reversed themselves and the earth is about to go through a major cooling possibly as bad as in the early 1600s in the middle of the little ice age. The cooling affects should be noticible to all towards the bottom of this 6-8 year solar cycle 25/26. Around the year 2022. The magnetosphere has already been getting substantially weaker allowing more cosmic rays to enter our atmosphere causing greater cloud cover and more albedo and reflection of UV rays. Also causes the flow to shift which is what is really responsible for these wacky weather patterns we are having. This is because as the jet stream moves out of place and flows mix the jet stream gets stuck causing major high pressure and low pressure areas to stall causing warmer and then cooler then normal temps as well. An example will be the warm winter in the southeast causing the cherry blossoms to bloom early and then freeze in march due to an unexpected hard freeze which can have gargantuan effects on reducing agricultural growing zones and causing food prices to increase. As for humans affects on the climate. They have such a small impact as co2 makes up only about 9-18% of the total ghg affect but humans emissions from fossil fuels make up less then 3% of that. It’s role on climate variability in the atmosphere can also explain how much co2 concentration ppm in the atmosphere as well which is a whooping 0.04%! The earth has been warming over the past 100 years but is due to changes in solar activity not increase man made co2 which is really a substantial plant fertilizer to many plants as many have learned in elementary school! Don’t let the alarmists fool you on there predictions! All 72 iPCC models have been predicting global warming for the past 19 years now when there hasn’t been any! something AGW alarmists love to stay away from! What about the prediction about the glaciers melting? WRONG 62 of the worlds glaciers have actually been on an increase. What about the Greenland ice cap melting? WRONG! It’s been growing at a record pace blowing away many records. What about the artic ice cap that wa supposed to be gone by 2013 according to our good old pal al gore? STILL THERE! Sorry al! What about the scientists who predicted that in 1998 the earth would plummet into a giant ice age causing food shortages and human extinction! WRONG! Why am I still alive? What about the city of manhattan will be under water by the end of the 1900s. WRONG! What about an increasing number in Atlantic hurricanes? WRONG! In fact 2014 just a few years ago was one of the questist on record! What about the moron in the early 2000s who claimed “snow will be a thing of the past and children won’t know what snow is!” WRONG! The past few winters were one of the snowiest on record for the eastern US and this year the western US got there slice of the pie. What about an increase in the amount of summer heat waves? WRONG! Summer heatwaves have been much worse in the 1930s then this! What about the claim of increase storminess? WRONG! Although the past few years have been seeing more storms due to increase in galactic cosmic rays penetrating the earths atmosphere the long term trend shows storm and flood related deaths on a decline over the past 100 years when the earth was “supposedly” warming. What about the Antarctic ice cap melting into oblivion? WRONG! Although the Antarctic ice cap saw some decline this year mainly due to an increase in under water volcanic activity and shift in ocean currents NOT man kinds co2 emissions! the past couple years before it (2014 and 2015) have seen record sea ice extent blown away! What about all the polar bears drowning and dying? WRONG! Polar bear population has been increasing dramatically! What about the drought that was supposed to happen in California? WRONG! Record rain that broke a huge dam earlier in the year and record rain 2015-2016 year as well mainly due to strong El Nio! Take the scam for what it is and don’t believe in any of it! Have any other questions feel free to ask. I will be back shortly to provide links to support my claims as a real scientist would do!

  14. CO2isLife says:

    Help!!! I’ve been banned on Facebook for being “abusive.” Here is my recent article. Anyone that reads my posts knows that they have been directed at exposing the climate bullies.
    The Benefits of Higher CO2 Levels; Fewer Hurricanes, Greater Prosperity, Longer Life
    https://co2islife.wordpress.com/2017/04/04/the-benefits-of-higher-co2-levels-fewer-hurricanes-greater-prosperity-longer-life/

    • Norman says:

      CO2isLife

      Did they let you know exactly what content of your blog was abusive? Or was it because of random complaints? Big Brother is coming!

      • David Appell says:

        Orwell used “Big Brother” in “1984” to refer to the totalitarian leader of the authoritarian ruling government. Facebook is a private company and can ban whoever they want

        • Harry Cummings says:

          public company

        • Norman says:

          David Appell

          I think the progressive left is a totalitarian system. More inclined to suppress free speech and thought than have their views challenged.

          You are quite correct that Facebook can ban whoever they want but it does not mean it is not a totalitarian action.

          http://www.dictionary.com/browse/totalitarian

          “adjective
          1.
          of or relating to a centralized government that does not tolerate parties of differing opinion and that exercises dictatorial control over many aspects of life.
          2.
          exercising control over the freedom, will, or thought of others; authoritarian; autocratic.”

          My use of the word would fit in definition 2. Controlling the thoughts of others. CO2isLife rejects the current understanding of the state of the Climate and voices his opinions on it. He can be wrong but far better to do what this site is doing. Allow the whole range of opinions. I don’t think Roy ever banned anyone for just holding an opinion. It is when they get abusive to fellow posters and he does warm them about their behavior before the ban.

          • Crakar24 says:

            Companies in Australia are buying rings for their workers to wear in support of same sex marriage, will be interesting to see the fate which awaits the first person to refuse.

            The rings have a slot cut in them to represent the gap between biblical marriage and the leftist version of. The slot is wide enough to also allow it to worn in the nose…..just saying.

            The Facebook example is small fry compared to what others are trying to achieve

          • David Appell says:

            Norman says:
            “I think the progressive left is a totalitarian system.”

            That’s just stupid.

          • crakar24 says:

            DA,

            Latest news from the USA

            Three senior House Democrats asked U.S. teachers Monday to destroy a book written by climate scientists challenging the environmentalist view of global warming. The Democrats were responding to a campaign by the conservative Heartland Institute copies of the 2015 book, Why Climate Scientists Disagree About Global Warming

            So maybe not so stupid afterall.

          • crakar24 says:

            Further to my last

            Public school classrooms are no place for anti-science propaganda, and I encourage every teacher to toss these materials in the recycling bin, Scott said. If the Heartland Institute and other climate deniers want to push a false agenda on global warming, our nations schools are an inappropriate place to drive that agenda.

            Those descriptions of totalitarian again

            1.
            of or relating to a centralized government that does not tolerate parties of differing opinion and that exercises dictatorial control over many aspects of life.
            2.
            exercising control over the freedom, will, or thought of others; authoritarian; autocratic.

            And you DA think Norman is stupid?

          • Snape says:

            Using the the second description of the word “totalitarian”, you could find a way to apply it to almost any person, company, government, etc.

          • Snape says:

            Schools should do there best to teach science and not be called names for refusing to do otherwise.

          • Norman says:

            David Appell

            Thanks for correcting my incomplete conclusion on the issue of totalitarianism.

            I worded my post incorrectly. I said: “I think the progressive left is a totalitarian system.

            A more precise post should have included, I think the extreme progressive left is a totalitarian system.”

            It is in the extremes of any world-view that totalitarianism emerges and the extreme right suffer the same mentality. They do not like anything that questions their strong beliefs about what they believe to be the truth.

            Those with other views are viewed as enemies to be vanquished. (Since currently we have very strong inhibition of killing those who disagree with us the next option is to completely silence their words and ideas which is similar to killing them but you do not have to physically do it then).

            https://www.washingtonpost.com/opinions/the-right-shuts-down-free-speech-too/2016/12/15/745fa352-c30d-11e6-9578-0054287507db_story.html?utm_term=.82b9b7104963

            This is a balanced view of both sides but both exhibit totalitarian systematic belief. Shut down and suppress any opposing thoughts or ideas.

          • Norman says:

            Snape

            The question to your post is then what do you believe “Science” is?

            You and me have very different views on science. I think in the elementary and junior high level of thought you probably would be best using an authoritarian approach to setting up ideas in young minds. Once science students reach Junior or Senior levels and beyond. Good science teaching would be to include alternate views (like Creationism or views against Climate Change). You would have the students research the topics to find evidence in favor or against the ideas. That is how you debate science, with evidence. No need to suppress ideas that do not fit in with the mainstream thought. Far better for your students to learn and research on their own.

            Totalitarian thought is Science chokes and destroys it. This view always pops up and then some genius comes and crushes it and turns the world upside-down and science can once again grow. Counter ideas should be fought against by superior evidence and not suppression of those rival thoughts.

          • Snape says:

            Norman

            I mostly agree, but there’s a big difference between not teaching something and “suppressing” information.

            Example: a medical school may choose not to teach aromatherapy, reflexology or Chinese medicine. Does this make them a totalitarian institution that actively suppresses other points of view?

          • barry says:

            Are the extreme progressive left a force to be concerned about?

            I know one, from my childhood – an activist from Socialist Alliance.

            I went to one of the meetings, was uninspired and never went back. I read one of the ranty gazettes they put out.

            I don’t see these people around much. I expect they show up at rallies and the like pushing their agendas. Don’t seem like a big deal, and society is a big enough tent to hold them and their political opposites without falling apart.

          • Norman says:

            barry

            A thoughtful response from you as seems typical.

            YOUR QUESTION: “Are the extreme progressive left a force to be concerned about?”

            It seems the suppression of free speech and opposing views is very strong on college campuses. Did you read about the protest/riot in Berkley California recently over a free speech issue?

            My concern is both left and right are pushing each other into more extreme views and the numbers on both sides are increasing that are entering the extreme camps. I consider you more a moderate so you would not be so affected by this trend.

            In China they reached a climax of opposing views and had there big “Cultural Revolution”.
            https://en.wikipedia.org/wiki/Cultural_Revolution

            The solution was to kill all opposing ideas and thoughts.

            The University setting should be one of free inquiry of many ideas and active debate of the merits of the ideas, not the suppression of opposing ideas.

          • barry says:

            I agree that partisanship has been on the rise.

            I don’t consider the war between rejecting “hate speech” and it’s political opposite, expressed as promoting “freedom of speech” to be an extremist arena, but I agree that it’s become a partisan battle.. The issues are complex and interesting. I’m not even close to settling on a point of view, though I can articulate the pro/con.

            Not really an appropriate discussion for this venue, but an interesting one nonetheless.

          • David Appell says:

            Norman says:
            “Good science teaching would be to include alternate views (like Creationism or views against Climate Change).”

            Creationism is not based on science.

            Nor is climate change denial.

            What Norman’s doing here is trying to win the scientific debate by means other than scientifically disproving AGW.

            But he, or anyone, hasn’t been able to do that, so in their frustration they insult scientists and the left and whoever they wish they could prove wrong.

          • Norman says:

            Snape

            What you post is a correct view but it is not quite the point I am making.

            A school not teaching some topic would not be considered suppression in my view or totalitarian. A school has realistic limits of what they can cover and teach. A totalitarian education system would be one that does not allow the topic to be brought up or punishes an individual for bringing it up.

            In your example about medical school, it would not have to teach alternate medical procedures but if a student did bring up Chinese medicine and wanted to point out some observational evidence of the viability of this practice and was crushed by the Instructor, I would really start to consider this totalitarian and a negative on the body of truth.

          • Snape says:

            Norman

            Right. I love freedom of thought, too. I just don’t think schools should be criticized for refusing to teach what 97% of scientists think is rubbish.

          • Norman says:

            David Appell

            Sorry but I think you greatly missed the point I was making and came up with a twisted post about the content of my post.

            I thought a correction should take place on your distorted view.

            Your claim: “Creationism is not based on science.

            Nor is climate change denial.”

            In my post I did not make the claim that Creationism is science.

            My point (Post was not to you by the way, so if you want to criticize my posts it would be nice if you tried to understand the point I am making which it seems Snape, who I was responding to, understood okay) was that bringing up Creationism or Climate Change denial in science classrooms can be very instructive (at higher levels of scientific thought process) to how science works.

            Science is a process that is based upon observational evidence and or experimentation to arrive at closer approximations of Truth or Reality. You can have students investigate the claims of Creationism and see if they can come up with valid evidence for the claims. Or with Climate Change denial you can present students with information that Mass of the atmosphere may be the cause of a warmer surface and have them seek evidence to support this claim. In doing science they would have to explain all the observations. One big one would be what happens to the 390+ w/m^2 being emitted by the Earth’s surface if mass was a valid explanation. It would get young scientists to learn and think and also be exposed to the myriad of ideas that pop up in the scientific thought body and how to evaluate them in context of evidence based research. I still cannot see how this would be harmful.

          • Norman says:

            David Appell

            Also on your second point.

            YOU: “What Normans doing here is trying to win the scientific debate by means other than scientifically disproving AGW.

            But he, or anyone, hasnt been able to do that, so in their frustration they insult scientists and the left and whoever they wish they could prove wrong.”

            Not sure where this one came from. I am not trying to scientifically disprove AGW. I do not know which scientists I have insulted nor am I frustrated that I have not been able to disprove AGW. It is not even my goal. I think Carbon Dioxide will produce some warming of the Earth’s surface. I am not certain by what amount, I really question any confirmation of increase in severe weather caused by a 1 C global temperature increase in 100 years.

            I have not seen you provide any valid proof that severe weather has increased. You have linked to the output of some computer model forecasts into the future, that is a far-cry from proving that severe weather has steadily increased.

            I used to be a leftist and generally liked a lot of their ideas on making a better world. Now they seem a hostile totalitarian force for worse not better. Not an insult but an observation, I did link you to a Washington Post article so you can see what I am reading on the topic.

          • Norman says:

            Snape

            I agree with you. When using the word teach. That is the long term systematic process of getting useful information in the minds’ of students. So schools should not waste time teaching material that is not supported by the scientific community. My point is that the issue of Climate Change denial can still be brought up in schools and discussed or thought about, but you would not have to teach obvious false science. Bringing it up and discussing is a different matter than teaching and I would be against completely suppressing the idea and squashing it without discussing it and bringing up some of its flawed reasoning.

            I think we agree, or hope so, but are discussing different aspects of education system. Thanks.

          • David Appell says:

            crakar24 says:
            “Latest news from the USA”

            Teachers should also reject books advocating flat-Earth theory.

          • David Appell says:

            Norman wrote:
            “…bringing up Creationism or Climate Change denial in science classrooms can be very instructive”

            I disagree. US high school students aren’t sufficiently prepared to understand such distinctions — and what’s worse, most HS teachers aren’t qualified to teach it. I think the students should be taught what the science says. Those who really desire more knowledge can be taught the subtleties of the scientific method later, in college.

            (I think European high school students probably could handle that, though.)

          • Norman says:

            David Appell

            I was not advocating teaching Creationism or Climate Change Denial.

            I explained the distinction between teaching and discussing and issue.

            If a student brings up the subject and is curious I think some time could be explained why this subject is not science, unless the student can provide sufficient evidence to make it viable.

            I just don’t like suppression of ideas as that more likely leads to stagnation than growth.

  15. Lasse says:

    This is just a number.
    It would be interesting to know areas that are extreme and contribute most to the numbers this month.
    I saw an area over Siberia that was hot this month. In December that area was colder than normal.
    https://wattsupwiththat.files.wordpress.com/2017/04/march_2017_map.png
    http://www.nsstc.uah.edu/climate/2016/december/DECEMBER_2016.png

    Is there an area that always is warmer than previous?

    • Bindidon says:

      To obtain this information, you should process for example UAH’s 2.5 degree world grid data such that
      – linear trend
      and
      – maximal deviation fron the trend
      are computed for each of the 9,504 grid cells over the entire UAH era (dec 1978 – now).

      Then you sort the list first by ascending deviation from the trend, and then by descending trend.

      The top of the sorted list should give the answer to your question.

  16. ren says:

    The DMI ice temperature product (IST) uses three thermal infrared channels from the Advanced Very High Resolution Radiometer (AVHRR) on board the Metop-A satellite to calculate the surface temperatures in the Arctic.
    http://ocean.dmi.dk/arctic/ice_temp/plots/icetemp.arc.d-00.png

  17. ren says:

    “Midwest/Northeast: Snow, Wind Later This Week
    Thanks to an intensifying southward jet stream plunge, the surface low-pressure system will also intensify late this week over the Ohio Valley and Northeast.”
    http://virga.sfsu.edu/gif/17040500_jetstream_h36.gif

  18. Crakar24 says:

    I would like to thank Barry et all for their statistical analysis (stats are not my strong suit) however I question their relevancy wrt agw.

    Whilst I acknowledge the work by Dr Spencer as a vital contribution to this field of science I hardly see how quibbly over trends in the tenths of degrees supports the agw theory.

    We don’t have the knowledge to make any determination of this trend, for arguments sake for all we know their are forces driving the temps down by up to 1c but co2 is adding 1.2c or perhaps the other way round or indeed its all natural and co2 has basically no effect.

    IMHO the trends shown by Dr Spencers data do not support agw or at the very least show co2 to be a very weak contributor

    • David Appell says:

      Crakar24 says:
      “IMHO the trends shown by Dr Spencers data do not support agw or at the very least show co2 to be a very weak contributor”

      So what is causing the observed warming?

      • crakar24 says:

        Are you serious DA? First I ask you to describe the insulating properties of CO2 and you give me a reference to a book I can buy on a website.

        Now you want me to describe what is causing the obsereved warming, if you bothered to read my comment you would understand that I am saying we dont have enough knowledge to make an educated statememnt as to why.

        Your mind must be like one big bowl of spagetti that lacks the ability of critical thought and logical processing pathways.

        • Norman says:

          crakar2.4

          I agree with your assessment of David Appell. I sometimes wonder about his responses. I think he just quick scans them and makes a comment.

          My hypothesis on his actions is that he gets paid some sum of money for the number of posts he makes on skeptical climate blogs, if you watch, when a thread is almost done with posts you will see 20 more posts all coming from David Appell. Everyone has to eat and pay rent so that may be how he accomplishes his wage earning. Not a proven fact just my speculation on his antics.

          • David Appell says:

            Occurrences on this page of “Norman”: 75
            Occurrences on this page of “Appell”: 60

            as of 5:41 pm PST 4/7/17.

          • David Appell says:

            Norman says:
            “My hypothesis on his actions is that he gets paid some sum of money for the number of posts he makes on skeptical climate blogs….”

            Here again is another instance of Norman trying to win the scientific debate with methods other than science — imply your opponent is crooked, trying to win by default.

            No proof need be offered.

          • Norman says:

            David Appell

            I really do not consider you an opponent. I actually like to read your posts and links. I am not trying to win the argument by nonscience.

            I was just trying to figure out why on a dead thread (no activity for awhile, no active or ongoing debates about some issue) I suddenly see 20 new posts and then I look through it and you have comments posted all throughout the thread. It was just unusual behavior so I was attempting to come up with an explanation as to why you would do this. It makes some kind of sense if you got paid some income per post, it did not make much sense otherwise as no one responds to all the posts and most would not even look after a time period. I was just curious when I saw a large increase in posts on what I assumed was a dead thread.

            I hope I did not spark hard feelings toward you on my speculation.

    • barry says:

      Thanks for the hat-tip, crakar. Linear trend analyses aren’t the be all and end all, I agree. They are suggestive. Over long time frames, as the uncertainty diminishes, they become a bit more suggestive.

      • crakar24 says:

        Agreed Barry but all it suggests is the planet may have warmed or cooled a bit over a period of time, the period of time of course is subjective.

        As I said I believe this type of discussion is very important and very useful the mere fact we are talking about changes in tenths of degrees suggests to me AGW is a non problem and the longer we remain in the thenths of degress the bigger a waste of money this whole AGW thing has become.

  19. @njsnowfan says:

    Hi Dr Spencer
    Can you post the latest WV departures from normal chart.
    Thanks

  20. It is a weak solar/albedo/lower sea surface temperature play that will put an end to the global warming theory . El NINO if it should come this summer may delay the drop but once the drop occurs which will likely be after this next El Nino ends, will be fast.

    Albedo should increase, even a 1/2% increase is significant , and sea surface temp. should cool all in response to very weak solar.

    Increase in clouds, volcanic activity ,snow cover will result in a higher albedo. Less UV light will promote lower sea surface temperatures.

    Not much more say but wait and see how this unfolds as solar activity should remain very weak going forward.

    This recent burst of solar activity should end.

    • barry says:

      Solar trend, with the 11-yr cycle doing its thing, has been pretty much flat since the 1960s.

      You’ve been predicting this for years, Salvatore. It seems to be perpetually just around the corner.

      I believe you gave a firmer prediction than usual, recently. Do you have any kind of time limit on this prediction, or will you always be able to say the conditions aren’t exactly right?

      • Bart says:

        We’ve been waiting longer for the enhanced GHE to kick in, going on two decades now.

        It’s just a matter of time, Barry. The handwriting is on the wall. The AMO already switched phase. It is only an anomalous PDO that has kept temperatures high, and going by history, its crash will be sudden.

        God apparently has a sense of drama, whoever she is.

        • David Appell says:

          The AMO and PDO do not create heat, they just move it around.

          The increase in ocean heat content is the best metric to see the planet’s energy imbalance.

          • Bart says:

            Stupid comment. The Earth is never in steady state, so there is always either an imbalance one way or the other, or a transition to an imbalance one way or the other.

            The oscillations are due to alternating storage and release of heat, and they have very long term components. Releasing stored heat has the same immediate effect on the surface system as introducing new heat.

          • barry says:

            But the full cycles are 60 years or thereabouts, aren’t they? So after 60 years surface temps should be about the same as they were as at the beginning of the cycle?

          • Bart says:

            One apparently significant modal response is near 60 years. That does not preclude others.

          • David Appell says:

            Bart says:
            “The Earth is never in steady state….”

            Stupid comment. It was very close to one for much of the Holocene.

            But it isn’t now. And you have nothing to offer as an explanation, just denial.

          • Bart says:

            “It was very close to one for much of the Holocene.”

            IOW, it wasn’t. And, at other times, it was less so. Your arguments are self-refuting.

        • barry says:

          Bart, the PDO has trended down since the mid-80s.

          http://tinyurl.com/lkb7k7p

          And has kicked up at the same time as the latest el Nino. Maybe it’s moving into a warm phase. If so, I imagine that should prolong your skepticism for quite some time.

          If you’re predicting global cooling, could you go one better than Salvatore and put some constraint on it as to when you think you would be proved wrong? What would it take for your hypothesis to be undone? Or is that even possible?

          • Bart says:

            Don’t smooth it with the average. There is a recent blip up. It is not unlike the previous blip at about 1960. That one came crashing down. This one will, too.

          • barry says:

            Smoothing just makes it easier to see. But here’s the non-moving average version.

            http://tinyurl.com/l37qd27

            Just a noisier version of the same thing. PDO correlation breaks down mid-80s, and the recent el Nino kick-up is still there.

            But we have some predictions from you and that’s good.

          • Bart says:

            “…and the recent el Nino kick-up is still there.

            Let’s see what happens when it dissipates.

          • barry says:

            Say it dissipates, AMO is still low, the sun keeps quiet and global temps continue to go up.

            Will you state for the record that this will interfere with your hypothesis on what is driving global temps?

          • Bart says:

            Never respond to hypotheticals. I will cross that bridge if and when we come to it.

          • barry says:

            What would you say of a hypothesis that has no predictive value?

          • Bart says:

            Like AGW?

          • barry says:

            What about your hypothesis? Does it have predictive value or not?

          • Bart says:

            Well, I did predict the turning point of the pause based on the observed apparent ~60 year cycle, and that arrived on time. AGW proponents missed that one.

            I also predicted that CO2 rate of change would turn around with it, and that also came to pass.

            So, yeah, I’m feeling pretty successful so far. We will see what the future holds.

          • barry says:

            I also predicted that CO2 rate of change would turn around with it, and that also came to pass.

            Would you kindly give the numerical values for the CO2 rate of change prior to and after the turning point of the pause?

            Preferably the acceleration rate of the 15+ years before and after.

            I’ve been hoping you would corroborate what you keep saying with some actual values. What are they?

          • David Appell says:

            Bart: Explain how the PDO or AMO inputs more heat into the Earth’s system.

          • Bart says:

            Explain how CO2 inputs more heat into the Earths system.

          • barry says:

            Are you unable to answer the question. Bart?

          • Bart says:

            I think it is self-evident. CO2 can trap more heat in the system, all things being equal. Ocean currents can do the same. Neither H2O nor CO2 produce heat, but that is a trivial point. It is about the dynamics of heat transport, not heat production.

          • barry says:

            Well, I did predict the turning point of the pause based on the observed apparent ~60 year cycle, and that arrived on time. AGW proponents missed that one.

            I also predicted that CO2 rate of change would turn around with it, and that also came to pass.

            CO2 spikes with el Nino? That’s well observed. Your ‘prediction’ is hardly original.

            And if the PDO cycles are regular we should be in the middle of a cool phase over the next 15 years.

            https://upload.wikimedia.org/wikipedia/commons/thumb/0/09/PDO.svg/1000px-PDO.svg.png

            You predicted a change in periodicity? Maybe a reference to your prediction is in order.

            But I have to admire the vague 60-year cycle reference. You can now change topic and say you meant a different 60-year cycle to what we were discussing.

            So here’s the AMO:

            https://upload.wikimedia.org/wikipedia/commons/thumb/1/1b/Amo_timeseries_1856-present.svg/672px-Amo_timeseries_1856-present.svg.png

            Presaging a continued warm phase for a decade or so.

            I really have to see this prediction you made. It’s not based on those cycles. Unless you predicted a change in periodicity.

        • barry says:

          And if you’re saying the these ocean/atmosphere systems are responsible for the global being warmer than 100 years ago, would that mean we should see less heat in the oceans over that time? Where is the heat coming from?

          • Bart says:

            What makes 100 years special? The oceanic heat content oscillates due to numerous forcings (wind, tides, Coriolis forces, planetary wobble, orbit precession, etc…). Some of these are very long term.

            Keep in mind also that we don’t have particularly good measurements of oceanic heat content, and that degrades spectacularly before ARGO came online in the 2000’s, with very poor surface measurements, and hardly any at all at depth.

          • barry says:

            What makes 100 years special? It covers most of the instrumental record. Data are patchier the further back in time you go, so I usually round off to 1900 or 1950, depending on what’s being looked at.

            So, you mention ocean heat content data being worse quality the further back in time you go.

            Is AMO, PDO and global surface temperature data immune from this?

            Nope.

            There’s all this uncertainty you champion when arguing against something, but that completely evaporates once you push your own theories.

            You do not caveat the older AMO or PDO data.

            You believe we cannot model global temp behaviour sufficiently to make uncertainty estimates about global temperatures. Yet you make claims about the evolution of global temperatures without caveat.

            I spy a bias in this lack of consistency.

          • Bart says:

            No, not really. There is a difference between discerning qualitative patterns, and estimating quantitative values.

          • barry says:

            Should I take that to mean that you have no interest in quantifying your views?

          • barry says:

            I’ve talked with you a fair bit in recent times, Bart, most of it fairly collegially, which I appreciate. I think you might agree that you tend to emphasise uncertainty when arguing against a thing, but omit it when making your own case. I’ve a good memory, and that ledger is quite clear.

          • Bart says:

            “Should I take that to mean that you have no interest in quantifying your views?”

            Quantification is work. I don’t work for free.

            Uncertainty is always difficult to deal with. We’ve only really been getting good data on this system for a very short time, relatively speaking. But, that does not prevent us from observing patterns, and extrapolating likely progression in general terms.

          • barry says:

            Your hypotheses will be given credence according to the rigour you’ve applied to them.

            You’ve said previously that you have no interest in persuading anyone. I guess I could compliment you on sticking to your guns.

          • Bart says:

            At least I have rigor. Applying arbitrary models to data that do not exhibit the properties of those models is not even a pretension to rigor. It’s just chaff, intended to bamboozle the unwary or math-challenged.

          • Ball4 says:

            Bart: “At least I have rigor.”

            Rigor? Your mark 1 eyeball on a couple curves? No, Barry has more rigor.

            What you have demonstrated is the ability to fit a curve integrating between two endpoints and a constant of integration of YOUR choosing not nature’s. With those three free parameters you can fit the top post curve as closely as you want, to as high a degree of confidence ever observed.

            What Bart hasn’t done is write a physical reason your eyeball results provide: 1) any kind of global T prediction, 2) any kind of statement about eGHE or even the basic physics of rGHE.

          • Bart says:

            Umm… no.

          • Ball4 says:

            Bart makes my point, there is no defense for lack of rigor.

          • David Appell says:

            Bart says:
            “Quantification is work. I dont work for free.”

            Shorter Bart: My replies here are based only on what I imagine.

          • Bart says:

            More concise Bart: the patterns are glaringly evident. Why waste time proving 2 + 2 = 4? How would it be worth the effort for people who can’t even add 2 and 2? How would that even begin to crack their religious devotion?

    • ren says:

      Salvatore take a look at the GCR chart.
      It can be seen that the even-numbered cycles, the minimum activity is extended in time.
      https://cosmicrays.oulu.fi/webform/monitor.gif

    • David Appell says:

      Your conclusions are in a word wrong, and that will be proven over the coming years, as the temperatures of earth will start a more significant decline (which started in year 2002 by the way).

      – Salvatore del Prete, Reply to article: IC Joanna Haigh – Declining solar activity linked to recent warming,
      10/8/2010
      http://climaterealists.com/index.php?id=6428

  21. barry says:

    There is at least one “skeptic” on this board who has a truly inquisitive mind and can disagree without being disagreeable. Kudos to you, sir.

  22. ren says:

    High temperatures in the Pacific in Nino 1.2 region will inhibit the development of hurricanes in the Atlantic.
    http://www.opc.ncep.noaa.gov/sst/images/full/Full_GoesSST.gif

  23. Mike Flynn says:

    Norman,

    Experimentation demonstrating the ability of gases to absorb heat, and thereby lower the amount of heat reaching a thermometer, were carried out by Professor John Tyndall and others, more than 150 years ago.

    Subsequent experiments have verified his extensively and meticulously documented experiments. No GHE supporter has come anywhere near even attempting to perform physical experiments of this nature, let alone trying to contradict Tyndall’s results.

    Any competent experimental physicist laughs at the foolishness of the concept that interposing CO2 between a source of heat and a thermometer, causes the temperature of the thermometer to rise!

    This would require a naive and gullible belief in fake physics, as promoted by certain mentally deranged self proclaimed climatologists.

    Tyndall’s experiments are replicable – they verify his original conclusions. The laws of thermodynamics still apply, it would seem.

    Or you can believe the assertions of David Appell – self proclaimed journalist. If you live in a cold climate, you might notice that using a clear glass fire screen works to shield you from the fierce heat of an open fire. If you do not understand why, Tyndall provides a clear explanation, complete with an illustration for those of lesser scientific background.

    I hope this helps.

    Cheers.

    • Snape says:

      Mike

      Your logic is so upside down it’s making me chuckle.

      Are you imagining the fire in the fireplace as the sun, and the glass screen as Co2 helping to keep the planet cool?

      • Norman says:

        Mike Flynn

        I am not sure you want to bring in John Tyndall’s research into your debate.

        I looked at his original testing here.

        http://web.gps.caltech.edu/~vijay/Papers/Spectroscopy/tyndall-1861.pdf

        Do you like to research things? Look at page 29 of this research paper and note the title. Tyndall did different types of testing. He tested the absorbitivity of different gases but he also tested
        “Radiation of Heat by Gases”. Read through this series of tests.

        He totally proves your current view as incorrect. It is what I stated which is opposite of your current view.

        Heated Carbon Dioxide (and a couple other gases he tested) caused deflection in his instrument while heated oxygen or nitrogen did nothing.

        I hope that helps you understand why your thought process is incorrect and needs to adjust to correct and valid physics.

        Tyndall does not support your view, which is not based upon any empirical testing or logical thought process. Just a fantasy you hold onto, now embrace the truth. Find the reality.

        • Norman says:

          Mike Flynn

          I think you use some backward thinking to try and disprove the GHE which ends up in failure mode on your part.

          YOU: “Experimentation demonstrating the ability of gases to absorb heat, and thereby lower the amount of heat reaching a thermometer, were carried out by Professor John Tyndall and others, more than 150 years ago.”

          Yes indeed and that is exactly what satellites show, the amount of energy exiting the Earth TOA is less than the IR energy leaving the Earth’s surface so indeed the GHG inbetween absorbed this energy and prevented it from reaching the satellite thermometers.

          YOU: “Any competent experimental physicist laughs at the foolishness of the concept that interposing CO2 between a source of heat and a thermometer, causes the temperature of the thermometer to rise!”

          True and also no climate researcher would say that such a thermometer would rise. If David Appell reads this post he will also agree that such a case would be foolish. It is opposite of what Climate researches say. I really do not know where you got this from.

          If you would actually go back up to my posts and read the nature of my experiment, it is opposite of what you think is being claimed.

          Carbon Dioxide leads to a higher surface energy because it emits IR back to the surface.

          • Norman says:

            Mike Flynn

            I tried to explain the concept to John O’Sullivan on a previous thread but so far he has chosen not to respond.

            The maximum rate a surface can emit IR is when there are no surrounding energy fluxes around. It is determined by the Stefan-Boltzmann Law.

            Q=(area of surface)(emissivity of surface)(Stefan-Boltzmann Constant)(temperature of surface in Kelvin)^4

            http://www.engineeringtoolbox.com/radiation-heat-transfer-d_431.html

            Look at this link.

            Once you add any surrounding IR flux the rate of energy leaving the surface now goes down, the higher the surrounding temperature the less energy leaves. This is not a cooling effect, the presence of any surrounding source of IR reduces the loss of heat making the surface warmer than when no surrounding energy IR fluxes are present. Not that hard to understand. Think about it, it will make sense to you if you make an effort to understand, if not you will mindlessly continue posting your own false physics and think you are the smart one.

    • David Appell says:

      Mike Flynn says:
      “Subsequent experiments have verified his extensively and meticulously documented experiments. No GHE supporter has come anywhere near even attempting to perform physical experiments of this nature, let alone trying to contradict Tyndalls results.”

      MF thinks no one has ever verified Tyndall since.

      That’s not just funny, it’s really really sad that this man presumably graduated from a high school or even college.

  24. Mike Flynn says:

    Snape,

    I’ve said what I’ve said. Make of it what you will.

    If you believe that putting CO2 between the Sun and the surface of the Earth, makes the temperature of a thermometer on the surface hotter than a similar thermometer placed on the surface of the Moon (no GHGs to be found there) under similar conditions – distance, exposure time, and so on – then I wish you well with your existence in your fantasy world.

    The reason that no GHE proponent has ever demonstrated that placing a gas between a heat source and a thermometer causes the temperature of the thermometer to rise, is because it doesn’t happen.

    Have you any facts to contradict Professor Tyndall’s experiments? Maybe intense chuckling will make thermometers hotter – CO2 has never been shown to do so.

    Cheers.

    • Tim Folkerts says:

      Mike, you DO realize, don’t you, that the average temperature of a thermometer on earth is WAY higher than a thermometer at a similar latitude on the moon? So I similar thermometer on the moon is indeed cooler, contradicting your claim.

      (Of course there are many reasons for this, but GHGs are indeed one of the reasons for the warmer average temperature on earth.)

    • Snape says:

      Mike

      No need to contradict Professor Tyndall.

      Imagine your house is the stratosphere (a very cold climate, indeed!). The warm fire is the earth (which has been heated by the sun).
      The clear glass fire screen are the greenhouse gasses in the troposphere. These gasses help keep your home cool by shielding it from the heat of the earth.

      • Snape says:

        In other words, Co2 (and other greenhouse gasses) in the troposphere absorb some of the heat emitted from the earth, and thus cool the stratosphere.

      • Mike Flynn says:

        Snape,

        Imagine your house is on the surface – reality, not fantasy.

        Imagine it is heated by the Sun – reality, not fantasy.

        Imagine it is night – reality, not fantasy.

        Imagine you have read and understood Tyndall’s experiments – sorry, I’m lapsing into the realms of fantasy myself . . .

        Cheers.

        • Snape says:

          Mike

          Ok. Forgot the hypothetical. Our thermometer is near the ground. However, the heat that GHG’s absorb doesn’t come from the sun, it comes from the earth beneath your feet. So the Co2 is not BETWEEN the thermometer and the heat source, it’s ABOVE them.

          The cooling effect your talking about is taking place in the stratosphere.

        • Mike Flynn says:

          Snape,

          Better.

          I’m not sure whether anyone would agree that the Sun doesn’t warm gases. The temperature of the air certainly seems to increase during the day. At night, the temperature drops, regardless of CO2 – presumably due to withdrawal of heat from the Sun.

          I suppose it doesn’t really matter. If you shade a thermometer from the Sun – using a cloud, a sunshade, or even some gas, the temperature of the thermometer falls,

          If you can demonstrate otherwise by reproducible scientific experiment, I would be very surprised. Computer models or consensus agreements are not reproducible scientific experiments.

          No GHE. Even GHE supporters have difficulty in claiming it has any temperature raising effect at night, indoors, when it’s cold, in arid tropical deserts with a demonstrated lack of that most important GHG – H2O, even though they are the hottest places on Earth!

          A most interesting effect – of no effect at all!

          Cheers.

          • Snape says:

            Mike

            A thermometer in the shade is warmed by the atmosphere. Put it in the sun, it gets even warmer. This is like the earths surface, warmed by both the atmosphere and the sun.

            The atmosphere, on the other hand, is primarily warmed by the earth, Why? Because on a clear day the sun’s rays pass through the atmosphere mostly unobstructed. On a cloudy day, clouds reflect most of the sunlight back into space.

            When the sun comes up in the morning, it starts to warm the earth’s surface around you, and this in turn warms the air around you. Opposite when it gets dark.

          • Norman says:

            Mike Flynn

            You ask for evidence and I will provide it. It will require a click of the mouse. I really do not think you are interested in any evidence and will not look at the link but there is always hope.

            Here shows GHG warming the surface at night with no solar energy available completely contradicting your false belief system that seems unshakable even when evidence contrary to it is presented.

            https://www.esrl.noaa.gov/gmd/webdata/tmp/surfrad_58e2cdf59906c.png

            This graph is real world measurements and it shows an increasing temperature spike during the night and it also shows a higher downwelling IR than upwelling.

            Here is a graph with just temperature so you can more clearly see the upward trends at night.

            https://www.esrl.noaa.gov/gmd/webdata/tmp/surfrad_58e2d0aaba326.png

            Did you look at the Tyndall research paper I linked you to above. His research confirms the GHE, Carbon Dioxide, when heated, emits IR while he could not detect the effect with nitrogen or oxygen.

            I think you should look at the links, think about what they are showing you and start to slowly get back into the real science instead of your “cargo-cult pseudo science” you currently are demonstrating. Your view is not based upon empirical evidence, logical thought process or any thermodynamics textbooks.

          • Mike Flynn says:

            Snape and Norman,

            Let’s cut to the chase. Neither you nor anybody else can raise the temperature of a thermometer by using CO2.

            Avoiding the subject, talking about averages, misunderstanding physics – none of these can achieve the impossible. Without heat, all matter has no temperature – absolute zero. CO2, C, O – it matters not.

            Matter at a given identical temperature cannot be distinguished by temperature alone. CO2 at 20 C is precisely the same temperature as any other material at 20 C. I wouldn’t be surprised if you don’t believe me, but it’s true! Measure the temperature of two gas cylinders. You won’t even be able to tell if they are full or empty, let alone what sort of gas they contain. Would you know whether they are full of mercury or sand, if their temperatures are the same?

            No miraculous properties for supposed GHGs. You’ve been had. Complete nonsense!

            Cheers.

          • Snape says:

            Mike

            Do you think it’s possible to measure the temperature of CO2 using a thermometer?

          • Norman says:

            Mike Flynn

            You avoid the links I put in like a deadly disease. They show warming of the surface at night with NO SUN!! I can’t make you look but you look ignorant when you don’t look then post garbage.

            I really do not grasp your point at all or what you are trying to say with this.

            YOU: “Matter at a given identical temperature cannot be distinguished by temperature alone.”

            Okay that is correct. But from this statement you make this conclusion:

            YOU: “No miraculous properties for supposed GHGs. Youve been had. Complete nonsense!”

            How is this a logical thought process. Different materials emit different IR based on their temperature. You can have lots of the material at the same temperature and you could identify the material with an IR detector based upon the temperature and how much IR it emits. It is highly variable. Hot polished metal will emit very little IR while water at the same temperature will emit a lot.

            You really did not have any studies in physics but just post like you know something. If you spent a little time reading a physics book instead of posting it would really help with your understanding. People respond to your posts but it really does no good, I can go back to your posts of years ago and they are the same, you have little ability or desire to learn but seek to have attention so you post the same things multiple times hoping fools like me will respond.

          • Norman says:

            Mike Flynn

            Click on this link. It is an emissivity table for IR for various materials.

            If you have water at 50 C and a Brass object at 50 C you will easily be able to tell the difference between materials using an IR gun.

            http://www.scigiene.com/pdfs/428_InfraredThermometerEmissivitytablesrev.pdf

        • David Appell says:

          MF, what did you get when you repeated Tyndall’s experiments?

          PS: Tyndall was actually not the first:

          Circumstances affecting the Heat of the Sun’s Rays, Eunice Foote, The American Journal of Science and Arts, November 1856, pp. XXXI.
          https://books.google.co.uk/books?id=6xhFAQAAMAAJ&pg=PA382#v=onepage&q&f=false

          – For more information, see Eunice Foote’s Pioneering Research On CO2 And Climate Warming, Raymond P. Sorenson, Search and Discovery Article #70092 (2011).
          http://www.searchanddiscovery.com/pdfz/documents/2011/70092sorenson/ndx_sorenson.pdf.html

          • Ball4 says:

            “Tyndall was actually not the first”

            Once again Stiglitz’s law of eponymy holds No scientific discovery is named after its original discoverer.: Stephen M. Stigler, 1999: Statistics on the Table, Harvard University Press, Ch. 14.

            Another name for this “supremely important law of the history of science” is “the Infinite Chain of Priority: Somebody Else Always Did It First” (Tony Rothman, 2003: Everything’s Relative and Other Fables from Science and Technology, John Wiley & Sons, p. xiii.).

          • barry says:

            Eunice Foote had her observations presented by a male scientist at a time when women were excluded from formally participating. This, and that her experiments were not as rigorous as Tyndall’s work which took place 3 years later, is why she doesn’t even make a footnote in the history. Which I think is a shame. I’ve promoted her work elsewhere.

    • Mike Flynn says:

      Tim Folkerts,

      Unfortunately, I’m not referring to averages. Averages tend to be the refuge of the incompetent. No one has yet measured the average temperature of the Earth (or its surface), and it seems probable that no one will be able to do, so in the foreseeable future.

      I believe the Earth’s surface was once molten. The average surface temperature was obviously above the temperature of molten rock.

      Before liquid water appeared, the average temperature was above the boiling point of water. And so on.

      Neither you nor anybody else can calculate or model the average temperature of the Earth at any point in time. In any case, such a temperature would be as useless as averaging the numbers in a telephone directory.

      No one has every demonstrated a GHE, let alone quantified such a non existent thing.

      If you can rebut anything I have assumed as fact, please do so. I doubt that you can. Faith is not fact.

      Cheers.

      • Norman says:

        Mike Flynn

        Please start reading at page 29 of Tyndall’s paper and then report back that you still agree with your statement.

        YOU: “No one has every demonstrated a GHE, let alone quantified such a non existent thing.”

        http://web.gps.caltech.edu/~vijay/Papers/Spectroscopy/tyndall-1861.pdf

        • Mike Flynn says:

          Norman,

          As instructed by you, I report back that no one has demonstrated a GHE. Tyndall heated gases. Heated bodies emit EMR. You may not realise that a common electric hair dryer uses this principle of heating air, and transferring the absorbed heat to something else – namely hair.

          Not a GHE. Just physics in action.

          Maybe you could raise the temperature of a thermometer by using some CO2 yourself! Only joking – CO2 heats nothing.

          Cheers.

          • Norman says:

            Mike Flynn

            Look at your assertion you post many times on different threads.

            YOU: “Lets cut to the chase. Neither you nor anybody else can raise the temperature of a thermometer by using CO2.”

            Tyndall did this very thing in his heated gas experiments. You have a mental block in your thought process. Cult programing that prevents you from logical reasoning ability. Your opposition and stubborn personality are too intense for you to open up your mind to evidence and humble thought.

            Is the atmospheric carbon dioxide warmer than absolute zero?

            YOUR POINT: “Tyndall heated gases. Heated bodies emit EMR.”
            Carbon Dioxide in the atmosphere emits IR then correct and according to Hottel’s charts it would emit about 60 W/m^2 in all directions at the temperature of atmosphere in the lower troposphere (maybe up to 1000 meters).

            Why would you claim that Carbon Dioxide cannot raise the temperature of a thermometer using CO2 when that is EXACTLY what Tyndall demonstrated and at the same time he demonstrated that all heated gases do not emit measurable IR as with Nitrogen or Oxygen which when heated produced no effect.

          • Ball4 says:

            “…at the same time (Tyndall) demonstrated that all heated gases do not emit measurable IR as with Nitrogen or Oxygen which when heated produced no effect.”

            Tyndall 1861 results show N2, O2 deflections of his needle were measurable, though deflected needle only a fraction of a degree at higher than ambient pressures (5″ mercury). Vs. CO2 achieved 25 degree deflection.

            The added pressures enabled higher opacity of the gas in the tube so to be observed from his limited IR supply at 212F. His first ambition at the time was only to establish the order of each gas effect.

            He observed introducing lab air raised the “thermometric columns” 5F.

      • David Appell says:

        Mike Flynn says:
        “No one has every demonstrated a GHE….”

        https://www.giss.nasa.gov/research/briefs/schmidt_05/curve_s.gif

    • Nate says:

      Mike,

      By your logic, placing a piece of glass between the sun and a thermometer on a surface, the thermometer should not warm. It certainly does warm.

  25. TonyL says:

    Thanks for some answers to my question. I have a follow-up relating to “the insulating effect” of CO2.

    In a simple one-dimensional world, a warm piece of ground will emit some IR photons. The higher the temperature the higher the rate the photos are emitted. In the vacuum of space when that IR photon leaves the ground then the ground cools a little and the photon is gone forever. Without any new energy added to the ground then the ground will cool to absolute zero over time, at which point it stops molecular movement and no longer emits IR photons. Correct?

    If there is an atmosphere over the ground with some IR reactive gas (CO2, water vapor, etc.) and let’s assume there is only one CO2 molecule and the rest are N and O2, then the IR photon hits the CO2 molecule and is absorbed. I think only three things can happen, and I want to know if they are correct, or if there are more things that can happen:

    1) the CO2 emits the photon upward and it is gone forever. The ground cooled a little when the IR photon left so ground remains at that lower temperature.

    2) the CO2 emits the photon downward and hits the ground. When the ground absorbs that IR photon it must warm back to its original temperature. It does not warm higher since there is no extra energy available. Since this process takes some time the CO2 slows the rate of cooling. Hence, this is an insulating effect.

    3) the extra energy in the CO2 molecule is transferred to one of the neighboring molecules via kinetic energy. This way the CO2 molecule cools and the neighboring molecule warms. In this case I don’t think the CO2 would emit the IR photon.

    Is this correct, or are there more things that can happen?

    If #3 cannot happen then the odds of #1 & #2 are 50/50 since the CO2 will emit in a random direction and there are only two directions in a one-dimensional world. If #3 can happen, then what are the odds that it happens. Are there any measurements showing the effect, or lack of it?

    Tony

    • Tim Folkerts says:

      Tony, That all sounds good. As I recall, the odds of (3) are actually much higher than either (1) or (2). The frequency of collisions in the atmosphere is very high, and the time before emitting an IR photon is considerably longer.

      (There is one other possibility to consider here, too. The other N2/O2 molecules can hit the CO2 and give it extra energy, which could then be emitted as an IR photon. )

    • Mike Flynn says:

      Tony,

      Correct – more or less. It might be noted in passing that all matter above absolute zero is continuously emitting EMR. The infrared spectrum covers roughly 700 nanometers to 1 millimetre, it doesn’t matter whether it’s CO2, N2, or anything else, matter at the same temperature is at the same temperature, by definition.

      A simple measurement is to wait for sunset. Under clear sky and windless conditions, the temperature will drop.

      In other words, the thermometer is emitting more energy than it is absorbing. End of story. Once again, Professor John Tyndall explains the mechanism in mid 19th century terms – quite nicely.

      No GHE. No need. Just physics in action. Sir Isaac Newton even created Newton’s of Cooling. Not as well known as Newton’s Laws of Motion, but still useful.

      Cheers.

      • ren says:

        Why does water vapor warm the atmosphere?
        Saturated air rises:
        So let us get back to the air with its water vapor. When water vapor gets mixed into the air, the oxygen and nitrogen have to move over to make room because only 6,02 x 1023 bits can fit into the box; ultimately, when you are out-of-doors, the gases move up, because all the space around is already filled with oxygen, nitrogen, argon, and the other components of air, and up is the only place where there is more room. But the water molecule is actually lighter than the oxygen molecule and also lighter than the nitrogen molecule.

        Some airy weights:

        Basically, you get the weight of a molecule by counting the protons and neutrons in its atoms:

        That makes O2 have a weight of 16 + 16 = 32

        It makes N2 have a weight of 14 + 14 = 28

        Carbon dioxide (CO2) has a weight of 12 + 16 + 16 = 44

        Argon is an atom that has a weight close to 40

        Finally, water H2O has have a weight of 1 + 1 + 16 = 18

        See how light the water is? It is amazing that it doesnt float away altogether and become lost in space.

        Anyway, you can see that a box of gas that is part water vapor will be lighter than one that is only oxygen and nitrogen. So it will rise.
        https://marydaly.wordpress.com/2009/11/03/why-humid-air-rises/

      • Tim Folkerts says:

        Mike, you seem to be missing several important ideas.

        1) You say ” … all matter above absolute zero is continuously emitting EMR” (which is true, but misleading) and “… it doesnt matter whether its CO2, N2, or anything else, matter at the same temperature is at the same temperature, by definition.” which is also true, but misleading — especially when combined with the previous statement. Different types of matter at the same temperature emit the thermal EMR with very different efficiencies. The EMR from N2 would be so small it would be tough to actually measure. The EMR from CO2 would be many orders of magnitude stronger at the same temperature.

        2) “A simple measurement is to wait for sunset. Under clear sky and windless conditions, the temperature will drop.” You miss the importance of this! Under a cloudy sky, the temperature will drop much less due, due to the backradiation from GHGs and clouds (= higher average temperature over night, and a warmer starting point for the next morning). Under a clear sky of pure N2, the temperature drop would be much greater due to the near-absence of back radiation (= lower average temperature over night, and a colder starting point for the next morning). Your example actually supports the greenhouse effect if you think about the further implications! The back radiation DOES effect the average temperature, making the surface warmer when GHGs are present. 🙂

        • Norman says:

          Tim Folkerts

          A good and thoughtful reply but it will not change Mr. Flynn.

          Mike Flynn can do an actual test to prove himself wrong but he will not do it. Not expensive or even too time consuming.

          Get a double walled Styrofoam insulated cooler. Fill it with ice water and on a summer night test your faulty hypothesis that Carbon Dioxide cannot warm a thermometer. Put some low cost thermometers around the testing container to monitor the source of incoming heat. Have a thermometer placed in the air just above the ice water (it should be fairly cold so it will not warm the ice water or you can monitor it to see if it is the warming agent…you can vary the experiment to try an eliminate all sources of heat input other than the warmer atmosphere above and the IR it is emitting downward toward your ice water cooler.

          If you do the experiment honestly and working to eliminate any form of heat input (warmer air surrounding the cooler) maybe put the cooler on a stand so it does not contact the warm ground. Maybe put ice in the double wall so the air on the sides and underneath (that would still be quite warm, does not transmit heat to the ice water)…you may discover that the Carbon Dioxide and water vapor (do it on a clear summer night to eliminate cloud induced GHE) GHE (downwelling IR or backradiation) will warm your ice water to a much higher temperature.

        • Kristian says:

          Tim Folkerts says, April 6, 2017 at 8:51 AM:

          Under a cloudy sky, the temperature will drop much less due, due to the backradiation from GHGs and clouds (= higher average temperature over night, and a warmer starting point for the next morning). Under a clear sky of pure N2, the temperature drop would be much greater due to the near-absence of back radiation (= lower average temperature over night, and a colder starting point for the next morning). Your example actually supports the greenhouse effect if you think about the further implications! The back radiation DOES effect the average temperature, making the surface warmer when GHGs are present.

          Here we go again. The temp will drop less per unit of time under a cloudy sky and/or a more humid atmospheric column than under a clear sky and/or a drier atmospheric column, because the surface heat loss – including the radiant portion – is reduced. You make it sound as if the “back radiation” somehow independently heats the surface a little bit to offset its overall cooling. But this way of describing the process greatly confuses readers like Norman here, and is really quite redundant.

          There is ONLY a LOSS of energy to be detected from the surface under a cloudy/humid atmosphere also. The loss is simply much SMALLER than under a clear/dry atmosphere.

          So the MATHEMATICAL/CONCEPTUAL addition of radiant energy from the “back radiation flux” (the DWLWIR) does not have a separately detectable thermodynamic effect on the surface. It is only in SUBTRACTING from the opposite (upward) mathematical/conceptual surface loss of radiant energy (the UWLWIR) that is has a physical meaning, REDUCING the NET loss.

          • Ball4 says:

            Kristian: “You make it sound as if the back radiation somehow independently heats the surface a little bit to offset its overall cooling.”

            As Tim’s comment and Dr. Spencer’s 2015 test on the added atm. DWLWIR point out to Kristian: “It doesn’t matter whether you call it “reduced rate of cooling”, or “warming”, the result is the same: a higher temperature.”

          • Kristian says:

            Ball4 says, April 7, 2017 at 7:48 AM:

            As Tim’s comment and Dr. Spencer’s 2015 test on the added atm. DWLWIR point out to Kristian: “It doesn’t matter whether you call it “reduced rate of cooling”, or “warming”, the result is the same: a higher temperature.”

            It very much matters. It’s two different (opposite) thermodynamic processes. “Insulation” vs. direct “heating”.

            Again, Folkerts makes it sound as if the “back radiation” somehow independently heats (thus directly raises the temperature of) the surface a little bit to offset its overall cooling (reduced temperature) somewhat. Which is nonsense.

          • Ball4 says:

            Tim’s 8:57am comment does not use the term heat, Kristian. Though I’d vote to grant Tim a license to use heat term as he uses it correctly meaning KE of the body constituents.

            It doesn’t matter whether you call it “independently heats”, or simply “heats” or “offset its overall cooling”, the result is the same: a higher temperature.

          • Ball4 says:

            Tims 8:51am comment.

          • Norman says:

            Ball4

            That is a good point. I really don’t know why Kristian is so obsessed with his view of radiant energy transfer.

            It really is not the logical assumption one would make when trying to figure out what is going on.

            In his view, if you have a hot plate in space at 300 C (no surrounding energy flows), you could put an IR detector pointed to the surface and detect an approximate IR outgoing flux of 6118 W/m^2.

            If you move another plate at 300 C above this plate then there is no IR being emitted by either surface, they must somehow work to suppress the emission of each surface. The NET IR is zero so there can be no bidirectional flow of energy between the plates.

            Even if you put IR sensors in-between the two plates pointed at the surface of each plate and both sensors registered 6118 W/m^2 he would not accept that energy fluxes are flowing in both directions. One surface is emitting 6118 W/m^2 but also absorbing the same amount from the other surface so the temperature does not change.

            He also would not accept that if you tried many different temperatures of the plates (say 15 C) and you have the identical IR sensors they would both now detect 390 W/m^2 coming off each plate (the IR detectors are both facing opposite directions and the IR reaching their internal sensors can only come from one direction…the sensors can even be cooled by liquid helium to close to absolute zero so their own internal energy does not effect what the sensor is detecting). With overwhelming evidence Kristian will still insist you are not measuring two macroscopic flows of energy that are moving in opposite directions.

            I have linked him to many textbooks on the subject but he ignores them and just keeps up with his strong opinions that are not grounded in anything.

            I do not mind Kristian believing this view on his own. I get annoyed with his posts when he makes the bold assertion I am wrong with my understanding (even though mine is supported by all thermodynamics, his has zero support, is logically based and seems to be measureable by actual IR sensors).

          • Ball4 says:

            “So the MATHEMATICAL/CONCEPTUAL addition of radiant energy from the “back radiation flux” (the DWLWIR) does not have a separately detectable thermodynamic effect on the surface.”

            Once again, Dr. Spencer’s 2015 test on the atm. DWLWIR showed it DOES have a separately detectable thermodynamic effect on the surface, the result was: an increase in temperature.

            No matter what Kristian calls the result.

          • Tim Folkerts says:

            Kristian says: “You make it sound as if the back radiation somehow independently heats the surface a little bit to offset its overall cooling. ”

            I am sorry that this is what you hear. Specifically, I would never say (in a careful discussion) that the atmosphere “heats” the ground (ie that “Q” goes from the cooler atmosphere to the warmer ground).

            In the end you are simply quibbling over semantics here. Whether we discuss a two-flux model or discuss a one-flux net model, the results are mathematically and physically the same.

            Ball4 says: “Though Id vote to grant Tim a license to use heat term as he uses it correctly meaning KE of the body constituents.”

            Actually, I avoid using “heat” in this sense. “Heat” is used in various ways by various people at various times. I try to consistently use “heat” to mean “Q” which is a process transferring energy from one system to another. This is consistent with all textbooks used in thermodynamics in physics that I have seen.

            You seem to be referring to “U”, which is the internal energy of a specific system. I have certainly seen occasional textbooks (in engineering and climate science) that call “U” “heat”. B

          • Kristian says:

            Tim Folkerts says, April 7, 2017 at 10:29 AM:

            Kristian says: “You make it sound as if the back radiation somehow independently heats the surface a little bit to offset its overall cooling.”

            I am sorry that this is what you hear.

            No, it’s not what I hear. It’s what people like Norman hear. People who know how these things actually work get what you mean.

            What I’m telling you is simply that when you describe the process as if the “back radiation” somehow directly and all by itself makes the surface temperature higher, then you appear to TREAT it as if it were a separate incoming heat flux, right next to the solar one. I know you’re careful not to CALL it heat, Tim. But that only adds to Norman’s confusion, because the way you DESCRIBE the process, the “back radiation” seems to act like a heat flux.

            I’ve shown you this before, Tim:
            https://okulaer.files.wordpress.com/2014/10/drivhuseffekten.png
            Derived from this:
            https://curryja.files.wordpress.com/2012/11/stephens2.gif

            How does the global average surface temperature of Earth get from 232K to 289K according to the “back radiation” explanation of the GHE?

            Well, the average solar heat flux (165 W/m^2) could only raise the temp as far as 232K. But if you just add the DWLWIR (and subtract the conductive and evaporative heat losses, of course), then the temp would somehow go all the way to 289K [165+345-112= 398 W/m^2].

            But this is equivalent to putting two Suns in the sky. Or three +, rather. It’s the way you add HEAT fluxes together.

            Just stop talking about atmospheric “back radiation” altogether, as if it were some kind of distinct thermodynamic energy transfer to the surface, on a par with the solar flux, and stick to simply including it in the surface heat loss (radiative+conductive+evaporative) and Norman’s confusion will (hopefully) vanish.

            In the end you are simply quibbling over semantics here.

            You know I’m not.

            Whether we discuss a two-flux model or discuss a one-flux net model, the results are mathematically and physically the same.

            This is not about one-way vs. two-way transfer, Tim. Didn’t you read my comment?

            Even if you adhere to a two-way model of radiant transfer, you will have to agree that neither of the two “counter fluxes” making up the net can independently be seen or treated as a thermodynamic energy transfer like ‘heat’ [Q] or ‘work’ [W]. They are fundamentally integrated into ONE, the net flux, the radiant heat, the macroscopically detectable thermal transfer of radiant energy.

            If you want to define the average radiant heat loss of Earth’s surface as UWLWIR minus DWLWIR, that is 398-345= 53 W/m^2, or just simply as 53 W/m^2, that makes no difference, budgetwise. The problem/confusion only arises as soon as you, if adhering to the two-way model, choose to split the two heat loss components and put them up as separate energy transfers next to actual heat fluxes. Then you are definitely muddying the waters …

          • Ball4 says:

            Tim: “Actually, I avoid using “heat” in this sense. “Heat” is used in various ways by various people at various times. I try to consistently use “heat” to mean “Q” which is a process transferring energy..”

            There is no need to ever use heat term, when invoking it one has to watch the pea (KE) carefully, if no heat term, then no pea watching.

            Tim uses the term heat consistently and correctly when writing about the transfer of KE. Kristian, not so much.

            Q is transfer of constituent particle KE by virtue of a temperature difference between two bodies either in contact or in view of each other. Authors and dictionaries sometimes invoke the heat term correctly meaning KE transfer. In Clausius, Maxwell, Planck time they consistently (over) used heat always correctly meaning the transfer of constituent particle KE between two bodies. Mostly because heat was in research mode not well understood at the time.

            Clausius wrote heat is never contained in a body and stuck to that. Kristian writes something not contained in a body can then transfer from that body to be not contained in another body. Basically paranormal, mythical, superstition which causes Kristian innumerable errors. His license to use heat should be revoked and those errors would clear right up.

            The efforts to give heat some corporeal form through pretzel twisting words are substantial on blogs. People can not let a long outdated term die off. The errors continue.

          • Ball4 says:

            “It’s the way you add HEAT fluxes together.”

            Energy fluxes actually, you know like added DWLWIR from adding cloud to clear sky as in Dr. Spencer’s test.

            “..because the way you DESCRIBE the process, the “back radiation” seems to act like a heat flux.”

            No, not the way Tim describes it. It doesn’t matter what Kristian calls it, Norman is not confused, the result is the same: a temperature increase.

            “…and subtract the conductive and evaporative heat losses, of course…”

            Kristian forgets to add back the conductive and evaporative energy gains in the cycle for no net affect on surface constituent particle KE.

          • David Appell says:

            Kristian says:
            “It very much matters. Its two different (opposite) thermodynamic processes. Insulation vs. direct heating.”

            No, Kristian — a joule is a joule, whether you add one or block one from escaping.

          • Kristian says:

            Ball4 says, April 7, 2017 at 9:16 AM:

            Though I’d vote to grant Tim a license to use heat term as he uses it correctly meaning KE of the body constituents.

            Tim Folkerts says, April 7, 2017 at 10:29 AM

            Ball4 says: “Though I’d vote to grant Tim a license to use heat term as he uses it correctly meaning KE of the body constituents.”

            Actually, I avoid using “heat” in this sense. “Heat” is used in various ways by various people at various times. I try to consistently use “heat” to mean “Q” which is a process transferring energy from one system to another. This is consistent with all textbooks used in thermodynamics in physics that I have seen.

            You seem to be referring to “U”, which is the internal energy of a specific system. I have certainly seen occasional textbooks (in engineering and climate science) that call “U” “heat”.

            Ball4 says, April 7, 2017 at 12:47 PM:

            Tim: “Actually, I avoid using “heat” in this sense. “Heat” is used in various ways by various people at various times. I try to consistently use “heat” to mean “Q” which is a process transferring energy..”

            (…)

            Tim uses the term heat consistently and correctly when writing about the transfer of KE. Kristian, not so much.

            Huh!?

            Elsewhere, Folkerts points out to Gordon Robertson:

            Tim Folkerts says, April 5, 2017 at 1:54 PM:

            (…) every physics book I have read defines U = internal energy as the thermal energy WITHIN a system, while Q = heat is a process of transferring U from one region to another. With this very standard definition, there cannot be “heat, Q, in an object” any more than there can be “work, W, in an object”. With this standard definition, when EM radiation transfers energy from a warm area to a cooler area, it is indeed “heat” in the sense that any physicist would understand.

            … which echoes …
            Mark W. Zemansky, “Heat and Thermodynamics”, 5th Ed. (1968), p.80:
            https://archive.org/details/HeatAndThermodynamics

            4-5 Concept of Heat

            Heat is energy in transit. It flows from one part of a system to another, or from one system to another, by virtue of only a temperature difference. When this flow has ceased, there is no longer any occasion to use the word “heat.” It would be just as incorrect to refer to the “heat in a body” as it would be to speak of the “work in a body.” The performance of work and the flow of heat are methods whereby the internal energy of a system is changed. It is impossible to separate or divide the internal energy into a mechanical and a thermal part.

            I use and have always used the term “heat” [Q] in the exact same way as Folkerts and Zemansky do. The physically/thermodynamically standard way.

          • Ball4 says:

            Kristian: “I use and have always used the term “heat” [Q] in the exact same way as Folkerts and Zemansky do.”

            Incorrect.

            Zemansky correctly writes Q is by virtue of temperature difference using energy term not heat term as does Kristian in error.

            Zemansky on Q: “equal to the difference between the energy of thermal radiation”

            Kristian on Q: “we need to account for is the HEAT transferred to/from the system”.

          • Kristian says:

            Ball4 says, April 8, 2017 at 10:37 PM:

            Kristian: “I use and have always used the term “heat” [Q] in the exact same way as Folkerts and Zemansky do.”

            Incorrect.

            Zemansky correctly writes Q is by virtue of temperature difference using energy term not heat term as does Kristian in error.

            Zemansky on Q: “equal to the difference between the energy of thermal radiation”

            Kristian on Q: “we need to account for is the HEAT transferred to/from the system”.

            Good trolly! I see you’re starting to string the pieces together. But still quoting out of context and misrepresenting, I see. Tsk, tsk. Bad trolly!

            Zemansky says:
            “Heat is energy in transit. It flows from one part of a system to another, or from one system to another, by virtue of only a temperature difference. When this flow has ceased, there is no longer any occasion to use the word “heat.””

            Folkerts says:
            “(…) every physics book I have read defines U = internal energy as the thermal energy WITHIN a system, while Q = heat is a process of transferring U from one region to another.”

            They’re both correct.

            Heat is simply the energy transferred between places at different temperatures, as a direct result of the temperature difference. It is also the process itself, the thermal transfer of energy. No temperature difference, no heat, no thermal transfer of energy, and no change in U (and T).

            Zemansky also says (pp.78-79, Ch 4-4):
            “This energy, whose transfer between the system and its surroundings (…) has taken place only by virtue of the temperature difference between the system and its surroundings, is what we have previously called heat. We therefore give the following as our thermodynamic definition of heat: When a system whose surroundings are at a different temperature and on which work may be done undergoes a process, the energy transferred by nonmechanical means, equal to the difference between the internal-energy change and the work done, is called heat. Denoting this difference by Q, we have

            Q = U_f – U_i – (-W), or

            Q = U_f – U_i + W, (4-2)

            where the convention has been adopted that Q is positive when it enters a system and negative when it leaves (just the opposite of the sign convention for W). The preceding equation is known as the mathematical formulation of the first law.

            Notice how he denotes his definition of “heat” by Q.

            Finally starting to sink in, trolly?

            To make this whole concept easier for you to grasp, just think about what Zemansky and Folkerts are both pointing out:
            “It would be just as incorrect to refer to the “heat in a body” as it would be to speak of the “work in a body.” The performance of work and the flow of heat are methods whereby the internal energy of a system is changed. It is impossible to separate or divide the internal energy into a mechanical and a thermal part.”

            When the energy is INSIDE the system or object, it is termed “internal energy”, U. When the energy passes from one system or object to another by some thermodynamic process, however, it is termed according to the process of transfer, be it a THERMAL process (the energy is then termed “heat”, Q) or a MECHANICAL process (the energy termed “work”, W).

            It’s all energy. It is only given different names in different situations to distinguish between the different states and/or processes that the energy can be in. To make it all EASIER to follow, easier to analyse. To AVOID confusion and gain PRECISION.

            However, treated individually and independently, as distinct entities, neither the “DWLWIR” nor the “UWLWIR” would fit into this neat thermodynamic definitional system of state and path functions (energy stored and energy transferred). And this is my central point:
            Only when COMBINED, treated as ONE integrated unit, as a single flux, one single transfer of energy, they will be able to produce a thermodynamic (macroscopically observable) effect. Because only then they become a THERMODYNAMIC energy transfer, an actual, operative “path function”, the radiant HEAT, Q_lw.

            And there’s a very good reason for it. It happens to be all we ever detect. Macroscopically. Thermodynamics is about MACROSCOPIC conditions. It applies to and governs the MACROSCOPIC world. The one that we live in and sense. We only ever detect that one single transfer of energy, the Q_lw, the NET transfer of thermal radiant energy between systems or regions at different temperatures.

            It’s that simple.

          • Kristian says:

            Sorry, full Zemansky quote (forgot the “unquote” at the end):

            This energy, whose transfer between the system and its surroundings (…) has taken place only by virtue of the temperature difference between the system and its surroundings, is what we have previously called heat. We therefore give the following as our thermodynamic definition of heat: When a system whose surroundings are at a different temperature and on which work may be done undergoes a process, the energy transferred by nonmechanical means, equal to the difference between the internal-energy change and the work done, is called heat. Denoting this difference by Q, we have

            Q = U_f U_i (W), or

            Q = U_f U_i + W, (4-2)

            where the convention has been adopted that Q is positive when it enters a system and negative when it leaves (just the opposite of the sign convention for W). The preceding equation is known as the mathematical formulation of the first law.

          • Ball4 says:

            “They’re both correct.”

            Only to their own mythology about heat in a futile attempt to give heat some kind of corporeal existence .

            Nowhere does Zemansky put heat into Q as does Kristian; for Zemansky Q is always internal kinetic energy changing by virtue of a temperature difference. When Zemansky uses heat he always…ALWAYS means the KE of the objects constituents following Clausius, Maxwell, Planck unlike Kristian who simply follows his own personal mythology when using heat term, sometimes Kristian correctly lines up with Zemansky, sometimes not.

          • Ball4 says:

            Kristian: “the radiant HEAT”

            Zemansky: radiant energy

            Kinetic energy is not radiation Kristian, photons have no rest mass so far as is known. Follow Zemansky exactly and Kristian’s errors in this field will reduce, always use energy.

          • Ball4 says:

            Zemansky: the energy transferred by nonmechanical means

            Kristian: heat flux

            No, Kristian does not follow Zemansky exactly, leading to substantial Kristian errors which Zemansky does not commit.

          • Kristian says:

            Ball4 says, April 9, 2017 at 5:50 AM:

            Nowhere does Zemansky put heat into Q as does Kristian (…)

            Er, yes, he does in the quote directly above you comment. You should read it out loud to yourself, maybe that’ll help. You seem to suffer from some severe form of selective reading impairment, after all.

            (…) for Zemansky Q is always internal kinetic energy changing by virtue of a temperature difference. When Zemansky uses heat he always…ALWAYS means the KE of the objects constituents (…)

            Again, I don’t know what you think you’re reading, but it certainly isn’t what is written in black letters on white background on this very page. Zemansky is careful to stress, again and again, that Q (heat) is specifically NOT (!!!) to be confused with the “internal kinetic energy” of objects. He says the complete OPPOSITE of what you claim. Read the quotes.

            You’re really starting to come off as delusional here. Are you OK?

          • Ball4 says:

            I’m fine, it is Kristian needs help reading Zemansky, again:

            Zemansky: the energy transferred by nonmechanical means

            Kristian: heat flux

          • Kristian says:

            Ball4 says, April 9, 2017 at 8:18 AM:
            “Zemansky: the energy transferred by nonmechanical means”

            Yes. … is called HEAT, and is denoted by Q.

            It’s right there in the quote, dude:

            When a system whose surroundings are at a different temperature and on which work may be done undergoes a process, the energy transferred by nonmechanical means, equal to the difference between the internal-energy change and the work done, is called heat. Denoting this difference by Q, we have

            Q = U_f – U_i – (-W), or

            Q = U_f – U_i + W, (4-2)

            Do you want an even smaller spoon …?

          • Ball4 says:

            The energy is transferred per Zemansky, Kristian insists the heat is transferred which causes Kristian commit much error in Earth energy balances that are not committed by Zemansky.

    • David Appell says:

      TonyL says:
      “In a simple one-dimensional world, a warm piece of ground will emit some IR photons. The higher the temperature the higher the rate the photos are emitted. In the vacuum of space when that IR photon leaves the ground then the ground cools a little and the photon is gone forever. Without any new energy added to the ground then the ground will cool to absolute zero over time, at which point it stops molecular movement and no longer emits IR photons. Correct?”

      No, because the Earth’s surface is also receiving energy from the Sun.

      • TonyL says:

        David,

        I stated “without any new energy”. I was trying to establish that CO2 does act as a radiative insulator, and I think most everyone agrees with this.

        Now the question I have is, how much? Can CO2 transfer some of the energy from the ansorbed IR photon to N or O2 without emitting another IR photon? Are there any empirical measurements of this? It seems that this is a key thing to know as it determines the effective “R value” of CO2.

        I also suspect that this value measured in a lab may be very different in the real world, and also extremely variable based upon conditions. I have used MODTRAN to look at how surface temperature changes as a function of CO2 concentration and cloud cover. The more cloud cover the less the effect of CO2. What are your thoughts on this?

        Tony

  26. ren says:

    They begin to heavy rainfall in California.

  27. ren says:

    What if Earth had a ring?
    Today, I would like to mention a very interesting possible driver of climate: suppose Earth had a ring.

    If we had a ring, it would cause shading on the Earth. Furthermore, as Earth traveled around the sun, the shade of the ring would fall on the northern hemisphere for one half-year and on the southern hemisphere for the other half-year. Indeed, it would fall on the northern half during our winter, and on the southern half during their winter. The effect would be to intensify winter. So who would notice that? Bears?
    Well, if the dust is very small (and the YORP effect guarantees that it will end up small if it doesnt start small) if it is very small, then solar storms, which release floods of high-energy charged particles, can cause a sudden downfall of dust from one sector of the ring. The immediate effect might be a local storm, possibly quite a large one. Unexpected storms are not so unusual. During a phase of very active sun, lots of sunspots that is, the ring would erode very considerably. But during quiet sun, the ring could get thicker.

    We do know that the Maunder minimum was a time of very few sunspots, seventy years with no spots visible, and the Jesuits were watching closely. The Maunder Minimum is the middle of the Little Ice Age. So there is a correlation; there might be causation.

    There might be.

    Quiet sun might cause thickening rings, colder winters. And we have a very quiet sun these days, these years. You cant wake up the sun by parking your car.
    https://marydaly.wordpress.com/

  28. Cloudbase says:

    What’s heating the ocean ?

  29. Again it is a very low solar/increased albedo/lower sea surface temperature play for the climate moving forward.

    Albedo increase – due to greater volcanic activity (major),increase in global cloud coverage/snow coverage as a consequence of very weak solar conditions.

    Lower overall sea surface temperatures – as a result of a reduction of UV light again a consequence of very low solar conditions.

    It is that simple and concise no need to go on and on.

    • Bindidon says:

      Exactly that you are telling since about 2010.

      Les dieux ne sont pas avec vous, Salvatore!

    • Bindidon says:

      And oh dear I unfortunately forgot to mention UAH6.0’s trend for the Globe since 2010: 0.36 +- 0.09 C / decade.

      • AndyG55 says:

        Once you include the transient of the NON-CO2 based El Nino.

        A mathematical nonsense, in other words.

        But keeps using those NON-CO2 El Ninos.

        its ALL you have. !!!

  30. ren says:

    The storm could bring 1 to 4 feet (0.3 to 1.2 meters) of snow to the Sierra’s higher elevations, an unusual amount for April. Forecasters say it will be the biggest storm the Sierra has seen in April in a decade.

    Electronic monitors last week showed the Sierra’s snowpack was at 164 percent of normal. It was the most dense springtime snowpack since 2011, a year followed by five years of harsh drought.
    http://www.sacbee.com/news/state/california/article142831394.html

  31. ren says:

    Dangerous freezing rain in the Northeast. On the night of blizzards.

      • Snape says:

        Mike

        Here is another experiment you could try: On a warm summer night, place a thermometer in the fridge until it’s nice and cold. Then take it outside.

        What do you suppose will happen?

        • ren says:

          Heat flows from warmer to colder body.

          • Norman says:

            ren

            Yes indeed it does. But do you consider radiant IR a potential heat flux? Like how the Sun is able to warm the Earth and other planets?

          • Snape says:

            To Tim Folkerts, Norman

            I think I just had a moment of clarity regarding the Flynn/Tyndall confusion.

            Basically, Tyndall placed CO2 between a heat source and a thermometer, and the thermometer showed cooling. What’s important to consider is the heat source was not the sun! (It couldn’t have been because Co2 is mostly transparent to sunlight.)

            So to replicate Tyndall’s experiment on a planetary scale, the heat source would have to be the sun warm earth, the troposphere would contain the Co2 in the middle, and the thermometer would be placed on the other side (the stratosphere).

            Now increase levels of the Co2 in the middle, (humans are doing this), and according to Tyndall’s experiments, the stratosphere should cool.

            As far as I know, this has been observed.

          • Snape says:

            I meant to write, “the sun warmed earth”

          • ren says:

            Norman
            “An infrared heater or heat lamp is a body with a higher temperature which transfers energy to a body with a lower temperature through electromagnetic radiation. Depending on the temperature of the emitting body, the wavelength of the peak of the infrared radiation ranges from 780 nm to 1 mm. No contact or medium between the two bodies is needed for the energy transfer. Infrared heaters can be operated in vacuum or atmosphere.”
            https://en.wikipedia.org/wiki/Infrared_heater

          • ren says:

            “Quartz tungsten infrared heaters emit medium wave energy reaching operating temperatures of up to 1500 C (medium wave) and 2600 C (short wave). They reach operating temperature within seconds. Peak wavelength emissions of approximately 1.6 m (medium wave infrared) and 1 m (short wave infrared)”.
            The temperature in the photosphere is about 10,000 degrees F (5,500 degrees C). It is here that the sun’s radiation is detected as visible light. Sunspots on the photosphere are cooler and darker than the surrounding area. At the center of big sunspots the temperature can be as low as 7,300 degrees F (4,000 degrees C).

            The chromosphere, the next layer of the sun’s atmosphere is a bit cooler about 7,800 degrees F (4,320 degrees C). Visible light from the chromosphere is usually too weak to be seen against the brighter photosphere, but during total solar eclipses, when the moon covers the photosphere, the chromosphere can be seen as a red rim around the sun.

            Temperatures rise dramatically in the corona, which can also only be seen during an eclipse as plasma streams outward like points on a crown. The corona can get about 3.5 million degrees F (2 million degrees C). As the corona cools, losing heat and radiation, matter is blown off as the solar wind.
            http://www.space.com/17137-how-hot-is-the-sun.html

          • Norman says:

            Snape

            Best of luck in getting Mike Flynn to understand or even consider your point.

          • Snape says:

            Well, it was fun to think about. Not sure if my idea actually holds water.

          • An Inquirer says:

            Snape says: “Now increase levels of the Co2 in the middle, (humans are doing this), and according to Tyndalls experiments, the stratosphere should cool.
            As far as I know, this has been observed.”

            Certainly, the scientific prediction is for increased CO2 to cool the stratosphere. A reasonable question would be whether that impact would swamp other influences.

            It is a deceptive ploy by alarmists to say that the stratosphere has cooled because increased CO2. Over the time period where we have measurement, the stratosphere cooled essentially when there were major, low-latitude volcanic eruptions sending aerosols to uncommon heights. Since the end of these volcanic eruptions, the stratosphere has basically flatlined in temperature. That has been the situation now for 22 years. In other words, we have flatlined stratospheric temperatures for a longer period of time than we had cooling stratospheric temperatures.

            The 2017 February and March temps for stratosphere were -.21 and -.22. The temperatures in 1995 were cooler than that for 2/3 of the months . . . and were cooler for every month in 1996.

            CO2 does not appear to the dominant influence.

          • Ball4 says:

            Snape 1:38pm, your idea is not exactly what Tyndall wrote, easy to find what he did write from experiments in 1859,’60 google string: Tyndall 1861

            His IR source shining into the gas in his apparatus was 2 boiling water* containers so as to show constant temperature from these sources. He used end caps to make sure no material conduction from the boiling water into his gas tube. He screwed a thermometer into his apparatus (search 2nd hit of thermometer). His words: “On filling the tube the thermometric columns rose, on exhausting it they sank.” So added CO2 raised the gas temperature in his apparatus.

            Mike Flynn has been shown this in the past, now he is using it for twisting pretzels around to confuse readers. And play games with them.

            Prior to the thermometers, Tyndall used a balanced thermopile reading calibrated to 0 in view of the IR from both waters, as the gas filled the tube increasing opacity not as much IR reached the thermopile and the needle deflected showing the IR from the control water unchanged and the IR from the apparatus decreased, this is what Mike is trying to sell to the unwary as a decrease in T from CO2 et. al. gas.

            Tyndall was so astonished (search astonishment) the needle pegged with CO2, that he then screwed in the thermometers.

            He actually eventually removed his whole apparatus and just squirted CO2 out of his cylinder into the air of the room between his boiling waters and found the same results, the CO2 with IR from boiling water increased T in the atm. of his lab. The most famous original CO2 heat trapping (ha!, really opacity increasing) experiment.

            *He had tried many other much hotter sources but could not maintain their T to his specifications. Hotter T would have enabled him to better measure O2, N2 opacity over a vacuum.

          • Snape says:

            Ball4,

            I’m thinking as his room’s temperature increased, the temperature in the attic decreased. In my planetary idea, of course, the room would be the troposphere (which shows warming), and the attic would be the stratosphere (which I believed was cooling until I read the post by “An Inquirer”).

          • Ball4 says:

            An Inquirer: “Over the time period where we have measurement, the stratosphere cooled..”

            No confidence in that.

            The standard atm. of the mid-latitude tropics shows a stratosphere 9-10km deep and the committee voted it isothermal(z). The fixed thermometer fields at z=1.5m are debated as being too sparse, TOBs deficient, relocated, sited at airports or nearby tennis courts with asphalt & burn barrels. Since there is no fixed thermometer field in the stratosphere at any level, the known readings are even more sparse so confidence in trends is much less.

            My last reading of papers on stratosphere anomaly still cannot improve the sparseness to be very confident of the cooling trends but if you read closely they are picking up some long term cooling signals from what they do have above the noise and dealing with various spikes you mention. Of course they want more funds for better data.

          • Gordon Robertson says:

            Ball4…”The most famous original CO2 heat trapping (ha!, really opacity increasing) experiment”.

            How many times do I have to say this before an alarmist gets it. INRARED ENREGY IS NOT HEAT. CO2 cannot trap heat!!

            When the Earth’s surface emits IR, the surface cools. If that heat was not replenished by solar energy, the Earth would continue to radiate energy and cool. It’s a natural process that has nothing whatsoever to do with atmospheric CO2.

            The heat in this case is associated with the atoms and molecules that make up the surface. There is no heat to trap in the atmosphere which has it’s own thermal energy due to the collision of gas molecules.

            If CO2 manages to capture some IR from the surface, it does warm but its mass is so insignificant compared to the 99%+ created by N2 and O2 that CO2 contributes virtually nothing to atmospheric warming.

            Which leads to the question, Ball4, what was the mass of CO2 in Tyndal’s equation? Was it 0.04% of the gas in the container? I don’t think so. If he infused CO2 into the container it was likely closer to 100% CO2.

          • Gordon Robertson says:

            INRARED ENREGY IS NOT HEAT.

            Enregy is Venusian for Energy.

          • Ball4 says:

            Snape 3:38, the cooling at Tyndall’s needle on the side of the apparatus (from increased opacity in the apparatus) would be from the same physics as the stratosphere cooling; the increased temperature at his thermometer bulb inside the apparatus (or the free lab air) being from the same physics as added CO2 increasing thermometer T lower troposphere down to surface.

            No need to go into Tyndall’s lab attic in search of testing support for Mike Flynn’s cooling, which in Mike’s comments is simply a confusing twist of the pretzel.

          • Snape says:

            Ball4,

            When Tyndall squirted Co2 into the air in his lab, the lab warmed up, right? If the lab warmed up, the attic would likely have cooled. The attic, then, would be somewhat analogous to the stratosphere.

          • Ball4 says:

            “How many times do I have to say this before an alarmist gets it. INRARED ENREGY IS NOT HEAT. CO2 cannot trap heat!!”

            Calm down Gordon. Only once since Tyndall proved you wrong, you took my bait. Heat was trapped in Tyndall’s apparatus! It couldn’t get out until he evacuated the chamber when the “thermometric columns sank”.

            In real modern physics Gordon, the term heat can mean anything you want as heat does not exist, so excuse my bait, the atm. molecules KE as measured by thermometer increased as CO2 was added making the atm. in the tube more opaque to transiting the IR from the boiling water.

            This is all really easy, your comments would be sensible if aligned with Tyndall results meaning you took the time to read Tyndall 1861, until then my bait will be successful, I’ll haul you in hook, line and sinker.

          • Gordon Robertson says:

            Norman…”do you consider radiant IR a potential heat flux? Like how the Sun is able to warm the Earth and other planets?”

            Atoms or molecules are required to produce heat, since heat is a property of mass. IR as EM does not have heat as a property so there’s no such thing as a heat flux, unless you are referring to a vector field flux of thermal energy flow in a mass. Heat does flow like electricity in a conductor, being transferred via valence electrons.

            If solar IR continued through space without contacting atoms or molecules, there would be no heat associated with it. It’s only when the electrons in an atoms or molecule absorb IR that they can potentially gain the energy to jump to a higher energy level. If that happens, the kinetic energy of the atom increases and that represent heat.

          • Ball4 says:

            “what was the mass of CO2 in Tyndal(l)’s equation?”

            Test.

            CO2 was ~.04% to begin with and then increased from that amount when he opened the cylinder into his lab atm. pegging his needle and “the thermometric columns rose” from the boiling water added IR energy as CO2 ppm increased atm. opacity.

            He also evacuated his cylinder and introduced CO2 into the vacuum pegging his needle & saw that “the thermometric columns rose”. Upon introducing air into his apparatus (.04% CO2) the thermometric columns rose 5F.

            When he introduced N2 from vacuum to 100%, his needle changed a smidgen from 0 to 1 count or so, I didn’t reread the whole paper but his results are in there, find them.

          • Gordon Robertson says:

            Snape…”Tyndall placed CO2 between a heat source and a thermometer, and the thermometer showed cooling”.

            How much CO2 did he place between the heat source and a thermometer. Was it the 0.04% of CO2 that makes up it’s proportion of air? Obviously not because air with that percent CO2 will not do anything.

          • Snape says:

            GR,

            Will not do anything”, or “will do very little?” Which one do you think is correct?

          • Ball4 says:

            Gordon: “there’s no such thing as a heat flux…Heat does flow..”

            A demonstration of confusion over heat term miss-use. As I always recommend Gordon, your confusion will reduce if you drop the heat term from comments, heat term is never needed, the term only adds confusion as you demonstrate.

          • Ball4 says:

            Snape 4:32pm, suppose Tyndall’s lab warmed to say 800F at Venus CO2 level, would you expect the attic to still cool? I would not.

            Take that down to his 5F, there would be no effect on his attic. Presumably in his day, lab was kept at room temperature by steam heat and maybe a thermostat or valve set at keeping it fairly constant. As far as I read, I did not recall him mentioning the T of his lab atm. and if it varied or not. My guess is he did not consider room temperature variation/change significant to what he learned in his apparatus so did not report it iirc.

          • Snape says:

            The Co2 in the room would act like insolation and impede some of the boiling water’s heat from reaching the attic. Thus the attic, receiving less heat, would cool down as the room warms. Isn’t this super basic physics?

          • Snape says:

            In order for the room to reach 800F from the heat of a pot of boiling water (pretending it’s possible), the room would have to be insulated like an oven. Almost no heat would be permitted to reach the attic and be lost through the roof. So yeah, the attic would be cooling.

          • Snape says:

            Assuming, of course, that the boiling water is the attic’s only heat source.

          • Snape says:

            Ball4

            So here’s the question you need to ponder:

            How could you get the room up to 800C if you have heat leaking into the attic?

          • Tim Folkerts says:

            Gordon says things like : ” The heat in this case is associated with the atoms and molecules that make up the surface. …
            Atoms or molecules are required to produce heat, since heat is a property of mass.

            Gordon, I KNOW you like this definition of “heat”, but this is non-standard, mostly archaic use of “heat”. Try googling “heat thermodynamics” and see what you get. The first page comes up with wikipedia, Khan Academy, several universities, and assorted other sources. NONE agree with your definition. All discuss heat, Q, as a process of energy transfer. Simply insisting on a non-standard definition is not going to get you very far.

            At a minimum, accept that some (MOST!) scientists use a different definition than you. Maybe ask which definition of “heat” they mean. Better yet, give people the benefit of the doubt and think “thermal energy transfer” when they say “heat”. If you STILL disagree with what they are saying in this context, then state your objections. If you simply want to quibble about semantics … well I guess that is your prerogative.

          • Ball4 says:

            “How could you get the room up to 800C if you have heat leaking into the attic?”

            Heat can’t leak from Tyndall lab as it doesn’t exist in the lab, only KE exists in there. The KE can leak, the rate of which matters.

            There is no perfect insulation, if the energy into the room is greater than energy leaving for long enough the flame temperature will get it to 800+C as it burns a fuel and any real insulation would thus raise not lower the attic temperature.

          • Snape says:

            Ball4

            Do you understand that in this scenario the insulation is in the room beneath the attic?

          • Ball4 says:

            Yes, the insulation in the room below the attic will transfer (radiative, conductive) a nonzero amount of KE to the constituent molecules in the attic, increasing their KE thus a thermometer would detect: a higher temperature in the attic.

          • Snape says:

            The attic will become warmer than it was before insulation was added to the room below?

          • Ball4 says:

            When the room below the attic constituent KE increases from that of room temperature to that of 800F.

          • Snape says:

            Ball4

            Ok, one more try and l’ll let it go:

            So initially, lets assume equal energy entering and leaving the room. This gives a stable temperature.

            When insulation is introduced, energy will exit at a slower rate than it did previously. This also means energy will enter attic at slower rate. However, because insolation was not added to attic, energy will still be leaving at about same rate as before…thus less coming in than leaving and temperature will decrease.

            When the insulation has absorbed all the energy it’s capable of, an equilibrium will again be reached and the temperature will again stabilize. To achieve more heating, more insulation will need to be added, and the process will begin all over again.

            If level of Co2 in the atmosphere were to stabilize, eventually temperature would as well (except for potential feedbacks like albedo loss). As long as we keep adding more CO2 (insolation), temps will keep increasing.

          • Snape says:

            The reason attic would remain cool even as room becomes increasingly hot is that a ridiculous amount of insulation would have been used. The ceiling between room and attic might need to be 20′ thick for room to reach 800 F using such a small heat source.

          • Bindidon says:

            An Inquirer says:
            April 6, 2017 at 2:35 PM

            Over the time period where we have measurement, the stratosphere cooled essentially when there were major, low-latitude volcanic eruptions sending aerosols to uncommon heights.

            This, Inquirer, is plain wrong.

            Because the time period where we have measurement shows exactly the contrary, what you seem completely to ignore though data about it is accessible to all of us.

            You just need to
            (1) download the UAH temperature time series for the lower troposphere
            http://tinyurl.com/jrx6wcn
            and for the lower stratosphere
            http://tinyurl.com/ktx6xg8
            and to
            (2) superpose the data plots in a common chart:

            http://tinyurl.com/mxu7syn

            There you immediately see that upon the huge eruptions which occured during the satellite era (St Helens + El Chichon; Pinatubo), the lower stratosphere experienced rather strong global warming at the time the lower troposphere cooled.

            The stratospheric warming spots are even higher in the tropical zone, but I didn’t add the Tropics LS plot because its tremendous ups and downs hide more than they colud explain.

            These observations perfectly confirm research done by Stenchikov and Santer some years ago.

          • Ball4 says:

            Snape 12:31am, sure a ridiculous amount of insulation which increases the amount of time for the increased kinetic energy flow to reach the attic but eventually at steady state the attic is warmer as no amount of insulation is perfect. You could even put in some state changing device like the Venera landers used to delay the inevitable.

          • Snape says:

            Ball4

            I’m not sure I follow your comment. But the key point to understand here is quite simple:

            If the amount of energy leaving the room exceeds the energy produced by the pot of water, the room will cool.

            So even if the room were 800 F, the rate of energy exiting could not exceed the original rate….or the room would be cooling, right?

          • Snape says:

            Insulation could not cause a FASTER rate of energy to exit the room, which is what would be required to increase temp in attic.

          • Snape says:

            Attic gets it’s energy from the room. If the rate of energy leaving room declines, temperature in attic will also decline. It’s that simple.

          • Ball4 says:

            Snape 12:11am: “If level of Co2 in the atmosphere were to stabilize, eventually temperature would as well (except for potential feedbacks like albedo loss). As long as we keep adding more CO2 (insolation), temps will keep increasing.”

            CO2 IR active gas effect is not insolation (perhaps you meant insulation in context of subthread).

            CO2 is but one of around 9 measured radiative forcings (each with some confidence interval est.s) of planet wide global near surface air temperature, there is no assurance added CO2 alone will always long term (climate length) increase overall global surface T (& reduce T higher up for no change in total system KE). One or several other radiative forcings acting together could invoke a long-lasting reduction in T though effect of added CO2 component is monotonic on that T.

          • Ball4 says:

            Snape 4/6 3:38: “I’m thinking as his room’s temperature increased, the temperature in the attic decreased.”

            Snape 4/7 11:13: “If the rate of energy leaving room declines, temperature in attic will also decline.”

            Spot the evolution in Snape comment?

            There are 2 relevant furnaces in Prof. Tyndall’s room burning a fuel consuming energy driving his gas bill up: the 2 flames boiling the water in his containers, one producing his relevant tube’s IR at 212F constant. Lets say consuming methane in air. Flame T ~3500F each.

            Squirting the CO2 into his apparatus from the gas cylinder increased the temperature at the 2 screwed in air-tight thermometer bulbs “the thermometric columns rose”. There was an equal and opposite temperature reduction causing his balanced needle to deflect from 0 an amount to his astonishment, from the increase in opacity of the column contents. An opacity that could not be detected by human eyes, to him the column opacity did not change, it was still clear, thus he was astonished.

            This process had no effect on his attic temperature or room temperature as CO2 did not burn a fuel, total KE of the relevant constituents was not changed from this added CO2 process, higher local constituent KE at bulb, lower KE at needle.

            Then I added a number to your assumed warming 800F from the flames if allowed to run a long time. Presumably he turned them off at times. This process left alone would eventually warm the attic like your furnace does in winter time not cool the attic.

            Then you added insulation like an oven. Ok, if added instantaneously the ridiculous amount of insulation would for a bit decrease the attic temperature as presumably the insulation was 72F room T and had to warm up to 800F. This decrease would eventually become the same attic T as original then increase over the original T as the flames kept running.

            You are jumping around faster than I can keep up.

          • Snape says:

            Ball4 wrote, “spot the evolution in Snape comment?”

            No evolution. Two ways of saying the same thing. I’ve been “jumping around” trying different ways to explain what I assumed was a fairly simple concept.

          • Ball4 says:

            No evolution? Plenty of evolution as defined in Snape comments: the gradual development of something, especially from a simple to a more complex form.

          • Snape says:

            Ball4,
            Maybe I should have tried devolution:

            – As room gets more warm, attic gets more cold

            – Insulation no make area above insulation warmer.

          • Snape says:

            Ball4,

            I don’t appreciate being criticized for trying to explain something better. Should I have tried devolution?

            – As room gets more warm, attic gets more cold

            – Insulation no make area above insulation warmer.

          • Ball4 says:

            “As room gets more warm, attic gets more cold”

            You devolve to nothing here. Sure if the A/C outlet is in the attic, and the exchanger is plugged in the room.

            “Insulation no make area above insulation warmer.”

            Insulation does not burn a fuel, the 2 flames do.

          • Snape says:

            Ball4:

            I ended up thinking about something that has almost nothing to do with Tyndall’s experiment and neglected to let you know. Sorry

            BTY, An insufficient level of insulation will never warm a room to, for example, 800 C, no matter how long you wait. (Assuming a constant heat source)

          • Ball4 says:

            Right, I had presumed your ridiculous amount of insulation was off the scale high (you know 20′ thick) & not too low.

          • David Appell says:

            Gordon Robertson says:
            “INRARED ENREGY IS NOT HEAT.”

            I dare you to stick your hand in front of this IR laser:

            https://phys.org/news/2007-11-worlds-largest-laser-pace.html

            Agreed?

          • David Appell says:

            ren says:
            “Heat flows from warmer to colder body.”

            False — heat is emitted by any body with T>0.

          • Ball4 says:

            IR is not heat David, but IR is still EM energy which can be transformed into the KE of the constituent particles of an opaque hand.

          • Ball4 says:

            Energy is emitted by any body with T>0 which is all bodies.

          • David Appell says:

            Ball4 says:
            “IR is not heat David”

            Of course it is: E=h*nu

          • David Appell says:

            Ball4 says:
            “Energy is emitted by any body with T>0 which is all bodies.”

            Emitted energy is a flow of energy.

          • David Appell says:

            ren says:
            “Heat flows from warmer to colder body.”

            Radiation is heat. Radiation flows from any body with T>0.

          • Ball4 says:

            “Radiation is heat.”

            No. Only in your personal mythology. Radiation contains no KE of its constituent particles, radiation has momentum, energy and can be polarized.

          • David Appell says:

            Are you ready to put your hand in front of that infrared laser — or any laser?

            If not, why not?

          • David Appell says:

            Ball4 says:
            “radiation has momentum, energy and can be polarized.”

            What do you think heat is, if not energy?

          • Ball4 says:

            Heat is a myth David, as such it can be anything you want in your own private mythology, same for the other commenters here.

            Clausius: An object contains the kinetic energy of its constituent particles. An object does not contain heat.

          • Ball4 says:

            I point my IR laser at my hand all the time to see if the battery is working David, so far no deleterious effects. I will let you similarly test higher energy lasers.

          • David Appell says:

            So you’re afraid of high-powered IR lasers.

            I don’t blame you.

          • Ball4 says:

            David wrote ANY laser, some are battery powered, others use more juice.

  32. ren says:

    ASTEROID 2014 JO25 IS GETTING NEAR THE EARTH THIS APRIL 19, 2017
    https://www.youtube.com/watch?v=uAmNmnV5ujM

  33. Mike Flynn says:

    If anybody is interested in Tyndall’s work relating to gases, heat, radiation, and so on, they might find it useful to ensure that they get the most recent edition of Tyndall’s book “Heat: a mode of motion”.

    When Tyndall corrected himself, he used footnotes in new editions. This presumably saved the cost of resetting and reimposition. Unfortunately, it can also lead to confusion, if the original incorrect body text remains in place.

    It’s fairly obvious that many people are merely parroting what they have been told by someone who did not bother to properly read and comprehend Tyndall’s works.

    Anything which prevents heat from reaching a thermometer results in a lowering of the thermometer’s temperature.

    Just as a matter of interest, if CO2 absorbed 2000 times as much energy of a particular wavelength as, say, dry air, but only comprised 4 molecules per 10,000, then the dry air would still absorb more energy than the CO2, overall. 4 CO2 @ 2000 = 8000, but 9996 @ 1 = 9996.

    Still no GHE, I’m happy to say.

    Cheers.

    • Snape says:

      Flynn says:

      “Anything which prevents heat from reaching a thermometer results in a lowering of the thermometer’s temperature.”

      Hey! We finally agree on something!

    • Tim Folkerts says:

      My reply seems to have gotten lost, so here is a condensed version.

      Mike, CO2 absorbs WAY more than 2000x better than N2 & O2 — and that even includes factoring in the actual abundances! You can see for yourself at a website called “spectralcalc.com” Play around with the “Line List Browser”.

      • Ball4 says:

        “Anything which prevents heat from reaching a thermometer results in a lowering of the thermometer’s temperature.”

        And the “anything” constituents increase in KE as measured by thermometer, thus temperature, hey, whoa, Mike, a GHE!

        • Ball4 says:

          Mike needs to actually read and comprehend Tyndalls book “Heat: a mode of motion” where Prof. Tyndall sets forth the conception of heat as body constituent’s molecular motion, the same definition previously published by Clausius.

          Oh, and the writings where Prof. Tyndall explains the GHE would be especially important for Mike.

          • David Appell says:

            Nobody needs to read Tyndall — they just need to pay attention in freshman physics.

          • Ball4 says:

            Tyndall’s work is covered in freshman physics David, reading Tyndall you do not have to worry about what inaccuracy crept in behind in the subsequent text author’s words.

            If you want to know what Newton said, read Newton. So forth.

          • Ball4 says:

            Mike Flynn invokes Tyndall without having read/understood his experiments, and Tyndall wrote about Earth or any planet’s GHE in 1861 which MF ignores for entertainment purposes.

      • Mike Flynn says:

        Tim Folkerts,

        Hopefully you will agree that 20 C results in peak spectral emissivity of close to 10 um.

        In a room or other closed container at 20 C containing any gas, the gas is also at 20 C. Nitrogen, oxygen, radon, CO2, H2O – all have the same temperature. No little white hot CO2 molecules.

        The gases are all exposed to the same wavelengths. You are confused about resonant frequencies, energy, heat and temperature, possibly.

        CO2 heats nothIng. CO2, just as other gases, can be heated by friction, compression, and other methods. Left to itself, it will cool, like any other gas, to absolute zero.

        You may try to convince others that at 20 C, CO2 is somehow much hotter than other gases at 20 C because it absorbs thousands of times more energy, but you will find yourself questioning whether you are making sense, even to yourself.

        But all this is beside the point. Neither you, nor anybody else, can make a thermometer hotter by surrounding it with CO2.

        Still no GHE.

        Cheers.

        • Norman says:

          Tim Folkerts

          I hope you can see Mike Flynn is just playing with you. He has no interest in science, truth, logic. He states nonsensical comments to annoy you and hope you respond. He has done the same thing for years. I think you are much too intelligent to waste anymore time trying to reason with him, unless you use him as a method to teach other readers about the actual physics. I think US citizens might be so scientifically illiterate (Gordon Robertson is one example) that they might actually believe Mike over you. That would be a really sad thing to happen to a Nation improved by scientists through several generations.

          • Ball4 says:

            Norman you are right, Mike is just playing word games void of science when writes: “Neither you, nor anybody else, can make a thermometer hotter by surrounding it with CO2” as Prof. Tyndall reports 1861 “the thermometric columns rose” made hotter by surrounding it with CO2…..and lab air, N2 et. al. Test results replicated later by many others added even more precise measurement equipment.

          • David Appell says:

            I agree with Norman — Mike Flynn isn’t serious. He shouldn’t be treated as if he is….

            GR on the other hand…….

        • Tim Folkerts says:

          Mike, you were doing fine for two paragraphs. In your 20C room scenario, all of the gases are indeed @ 20 C.

          But then you show that you are clearly confused about heat and temperature when you say “You may try to convince others that at 20 C, CO2 is somehow much hotter than other gases at 20 C because it absorbs thousands of times more energy”. That is not how it works, and that is not what I am trying to convince people of.

          CO2 does indeed absorb thousands of times more IR than N2. It also emits thousands of times more. The two energy flows balance; temperature remains steady @ 20C. You could also consider a polished metal ball (emissivity =0.03) and a similar ball painted with black paint (emissivity = 0.96). If you suspended both in the room, both would reach room temperature (20C in your example), but the painted ball would be absorbing (and emitting!) 32 times more IR!

          (And yes, Norman, this is mostly so that others are exposed to the flaws in his reasoning.)

    • David Appell says:

      MF: dry air already contains 0.04% CO2.

  34. Norman says:

    barry

    I think you might be able to answer this question I have.

    https://tinyurl.com/lytej3o

    This link has a measured value of contribution to downwelling IR from Carbon Dioxide at 0.2 W/m^2 in a decade (the increase in the IR).

  35. Norman says:

    barry

    Sorry I have to break up the original post into fragments to try and find the offending piece. Hope it does not destroy clarity for you.

    The problem comes up with the ocean heat content over this same time period.

    https://tinyurl.com/jbf2xco

    I can’t get an exact number but it looks like the content was around 5 x 10^22 joules in 2000 (same years as the IR study above) and rose to around 13 x 10^22 joules in 2010. Maybe in the ballpark of an 8 x 10^22 joules energy gained over that time period.

  36. Norman says:

    If you run the math on this. The Earth has 360 trillion square meters of water so that is your absorbing surface.

    Start the math by dividing the total energy increase of 8×10^22 joules/360×10^12 m^2 = 2.22×10^8 joules/m^2 Now to get watts just divide this by the number of seconds in a decade (3600)(24)(365)(10) to get = 315,360,000 seconds in a decade.

    2.22×10^8/3.1536×10^8 = 0.704 W/m^2

  37. Norman says:

    It would seem the each meter of ocean surface would have had to receive and average of 0.704 W/m^2 in order to get the number of joules into the ocean in the 10 years. Problem is the measured value of contribution of Carbon Dioxide is only 0.2 watts/m^2 over the whole decade (increasing gradually the whole time). Even if it started at the 0.2 the whole time it would still be far short of explaining the increase in ocean heat content. From this limited study it would seem AGW contributed less than 28% of the observed heating. Some other factor must have contributed the reamining 72%. Maybe changes in cloud cover or dustiness changes, less dust in the air over the oceans.

    What does this say?

    • barry says:

      My maths is poor (I like to be clear about my limitations), but I’m pretty good at grasping concepts.

      I don’t have a quick answer for your question, but I have some thoughts and questions that pop up.

      It’s my understanding that if something external to the system (the Sun, for example) causes the Earth’s atmosphere to warm, >90% of the added energy goes into the oceans on short time scale.

      The heat capacity of water is much greater than that of near surface air (1000 times greater, IIRC).

      Is your model 3D? That is, have you accounted for volume at all stages of the equations, not just the OHC source? Seemed you devolved to 2D when accounting for ocean surface area.

      • Norman says:

        barry

        Thanks for the links. I have already read through most of this material at other sites and it is all similar.

        In my calculation you can only use a 2D model of energy in. Energy into the ocean only enters via a 2D surface, a 3D calculation is not needed to determine energy in.

        The point I am making, in order for the ocean to accumulate the energy that has been measured in the OHC, there would have to be an imbalance of Net energy of 0.7 W/m^2 entering into the ocean to allow this heat accumulation.

        I just took the total water surface area of earth and time consideration.

        The OHC curve is mostly linear over the 10 year time period indicating a continuous energy input of 0.7 W/m^2. If energy input was highly variable the OHC increase would show this.

        The studies have shown carbon dioxide during the same time period increased a total of 0.2 W/m^2 over that time and that amount of input energy is far too small to explain the OHC. Does that make sense to you conceptually. Forget the math, just wondering about the concept.

        • David Appell says:

          Norman says:
          “The studies have shown carbon dioxide during the same time period increased a total of 0.2 W/m^2 over that time and that amount of input energy is far too small to explain the OHC.”

          radiative forcing does not equal energy imbalance.

          • Norman says:

            David Appell

            The 0.2 W/m^2 is not what is going on at the TOA where you describe the forcing factor is taking place. This is the actual increase in downwelling IR that is attributed to an increase of 22 PPM CO2 over that time frame. It is the actual energy that can can add to a total OHC. So it is part of a surface energy imbalance. The surface is receiving 0.2 W/m^2 more energy and it must do something with this energy. Increase temperature since the ocean’s absorb lots of energy before increasing in temp and increasing upwelling IR flux the energy storage in the ocean can get large before affecting its temperature. The large OHC is based upon a few hundredths of degrees C and this would not do much to increase the upwelling IR, so the energy can accumulate for quite some time before the emission rate increases to match the energy imbalance.

          • David Appell says:

            Again, radiative forcing does not equal the energy imbalance. It excludes convection, for one thing. And RF is calculated/measured at the tropopause, not the surface or the TOA.

        • David Appell says:

          “Here, we update our calculations (Fig. 1), and find a net heat uptake of 0.71 0.10 W m2 from 2005 to 2015 (with 0.61 0.09 W m2 taken up by the ocean from 01,800 m; 0.07 0.04 W m2 by the deeper ocean; and 0.03 0.01 W m2 by melting ice, warming land, and an increasingly warmer and moister atmosphere.)

          Gregory C. Johnson et al, Nature Climate Change, July 2016.
          http://flux.ocean.washington.edu/510_2016/johnson.et.al.energy.imbalance.pdf

    • David Appell says:

      Norman says:
      “Problem is the measured value of contribution of Carbon Dioxide is only 0.2 watts/m^2 over the whole decade (increasing gradually the whole time).”

      This is where you went wrong — that’s the *increase* in CO2’s radiative forcing over a decade, not the value of its radiative forcing.

    • David Appell says:

      Norman, you’re confused about what is the rate of change.

      “W/m2” *is* a rate of change.

      Total CO2 radiative forcing is now about 5.35*ln(405/280) = 2.0 W/m2. Aerosols are about -1 W/m2, and other GHGs and brown carbon contribute too, but let’s call the total RF 1 W/m2.

      As I said, there is still convection and whatnot. But for simplicity let’s assume RF=energy imbalance.

      Then, if the RF is 1 W/m2, that’s how much the ocean heating rate would be.

      If CO2’s RF is increasing by 0.2 W/m2/decade, the next decade’s energy imbalance would be something like 1.2 W/m2 — not 0.2 W/m2. Accordingly, the ocean would warm at a rate of 1.2 W/m2.

      See the difference?

      • Gordon Robertson says:

        DA…”Norman, youre confused about what is the rate of change. W/m2 *is* a rate of change”.

        It depends on the parameters and the inference. If I state something as metres/second, I am referring to the rate of change of distance per unit time. Rate of change usually has a time factor in it. That’s why time was invented, to keep tract of change.

        W/m^2 has no time factor. It refers to the radiation in watts over an area of a square meter. To make it a rate of change you’d have to state W/m^2/sec. Then you’d have a flow, likely in a fluid or gas, and something would be changing.

        • David Appell says:

          Gordon Robertson says:
          “W/m^2 has no time factor.”

          1 Watt = 1 Joule per second.

          Seriously Gordon, did you EVER TAKE even baby? physics.

          • Gordon Robertson says:

            DA…”1 Watt = 1 Joule per second.
            Seriously Gordon, did you EVER TAKE even baby? physics”.

            I don’t know how you could be so confused about this and why you feel the need to use ad homs as your primary rebuttal. You were talking about a rate of change.

            Yes, a watt is 1 joule/second and it describes the amount of work done per second. You are talking about the radiation of a square meter, however, which is another matter on something like an ocean surface.

            In electrical theory an ampere describes the number of coulombs passing a point in a second. An ampere is not a rate of change. It’s not till you express it as a differential, as in di/dt that it becomes a rate of change.

            You talked specifically about heating the ocean which requires a time factor. It takes time for water to warm and describing that takes more than stating W/m^2.

            In electrical theory, if you have a heater giving off 300 watts that is a reference to a constant emission not a rate of change. If you want rate of change you have to express it in watt-hours or kilowatt-hours.

            If you want to know anything about the effect of electrical watts you have to talk in terms of power, which is the rate at which electrical energy is transferred.

            A reference to 250 W/m^2 is a reference to a constant radiation from an area of a square meter. If you wanted to make that a rate of change, you’d have to express it in watts/area/second, or watts/area/hour.

      • Norman says:

        David Appell

        Thanks for taking the time to respond to my question. I can understand it. The 0.2 was the increase in an already imbalanced state that was adding energy to the oceans, not the actual amount of energy imbalance itself.

        I got it.

        • barry says:

          Me too. I had pondered that possibility but not knowledgable enough to determine. The value is cumulative, then, and we start with an energy imbalance in the first place.

  38. ren says:

    The repair plan was released nearly two months to the day after a giant crater erupted in the dam’s main spillway, eventually triggering a crisis that forced the temporary evacuation of 188,000 residents.

    Croyle acknowledged the plan is a work in progress.

    “We have a little less than a 60 percent design,” he told reporters. Nonetheless, the project is being circulated among four contracting firms, and DWR expects to execute a contract by April 17. The firms weren’t identified.

    “We’re moving as fast as we can. We need this (contract) in a matter of hours or days, not weeks or months,” Croyle said.

    Croyle said he was unable to provide a cost estimate beyond his original projection nearly two months ago that it would take up to $200 million to repair the structure. President Donald Trump made a disaster declaration over the weekend that’s expected to free up approximately $274 million in federal funds for Oroville repairs, although much of that money is being spent on debris removal and other functions not directly tied to repairing the spillway.
    http://www.sacbee.com/news/state/california/water-and-drought/article143200489.html
    https://www.ventusky.com/?p=38.9;-124.2;5&l=rain-3h

  39. ren says:

    It is worth noting the degree of cloudiness in the North Pacific.
    http://files.tinypic.pl/i/00889/qb0p9iylw8yi.png

  40. Massimo PORZIO says:

    Hi Norman,
    some messages above you linked a very interesting plot from SURFRAD about Sioux Fall LWIR on March 24.

    I noted a strange phenomenon which puzzles me.

    That day, during the night from 6pm to 4am, the downwelling LWIR radiation was more than the upwelling LWIR radiation (I estimated at least 14W/m2 at peak about 10:30pm), but the air temperature was still falling down, I also plotted the case and dome temps for the two PIR sensors and they follow the air temperature too.

    Since the upwelling temperature should reflect the ground temperature and it was declining too, how do you explain this?

    If the real temperature driver at the ground was pure radiative, I expected to see an increment into the upwelling LWIR in that conditions until it reached the downwelling one.
    I suspect that (at least that night) there was an another energy sink process on the run which was much more influential than the LWIR radiative exchange between the atmosphere and the ground.

    I would like to know your point of view about that, and the opinion of anyone who as an explanation for that, of course.

    Have a great day.

    Massimo

    • Norman says:

      Massimo PORZIO

      Thank you for your thoughtful and thought provoking post.

      Here is the graph I posted.

      https://www.esrl.noaa.gov/gmd/webdata/tmp/surfrad_58e2cdf59906c.png

      When the air temperature is rising you can see the UPWELLING IR also going up in both the air temperature rises.

      One other factor is the other forms of heat exchange going on. Even if you are adding energy to a surface its temperature may not show change right away as the energy is moving in the system by other means, conduction, convection and evaporation.

      My main point on this graph was to show downwelling IR can exceed the surface upwelling and that temperatures can rise at night without a warm front being the cause. Winds were from the North that night and fairly light when the temperature rose most. It could also be the cold wind keeping the temperature down, when it got light that is when you see your upward temperature spike. I can think on it more if you bring up more good points. Thanks again.

      Link to weather in Sioux Falls on the night of the graph.
      https://www.wunderground.com/history/airport/KFSD/2017/3/24/DailyHistory.html?req_city=Sioux+Falls&req_state=SD&req_statename=South+Dakota&reqdb.zip=57101&reqdb.magic=1&reqdb.wmo=99999

      The north wind may be taking away the energy so that it keeps the surface cooler, then when it is lightest the surface can then warm from the atmosphere.

      • Ball4 says:

        IIRC, it rained for couple hours after midnight. What about the release of latent energy at height and the surface evaporation reducing local T? What about dew point which influences T low?

        What about pressure? Looks like a low pressure system was passing and being replaced by a higher pressure system.

        These type of weather systems you can plainly see P=density*R*T does not hold, sometimes P goes up when T goes down at the same density and vice versa. Pretty difficult to draw conclusions on night time terrestrial LW with all this going on.

        • Norman says:

          Ball4

          The events you are describing are after my main point of a noticeable increase in the air temperature from around 10:30 PM to 11:30 PM.

          You can see the downwelling flux increase and then the cooling trend stops and reverses and the night-time temperature goes up for about 1/2 hour.

          Maybe better conditions for you to look at.

          https://www.wunderground.com/history/airport/KFSD/2017/3/23/DailyHistory.html?req_city=Sioux+Falls&req_state=SD&req_statename=South+Dakota&reqdb.zip=57101&reqdb.magic=1&reqdb.wmo=99999

          Night on the 23rd between 10 and 12 would probably help. The pressure was not changing much and the dew point was well below the air temp so no latent heat would be formed by condensation at the temperature during that time.

          Ball4 thanks for the thoughtful analysis. It is very hard to get all the data and demonstrate points from real time data as it is very complex with multiple processes going on. It is hard to find just the right conditions to demonstrate points. You need cloudy and very calm nights to try and show a GHE, but I think this one at least shows the possible GHE whereas IR emitted by the atmosphere can actually warm the surface.

          • Ball4 says:

            Find a calm night time pretty much straight decline of DWIR emitted from the cooling atm. Then check weather report for a clear night.

            Find one with a few up DWIR bumps that return to the steady decline, look for passing clouds in the night sky in the weather report. If you are looking for GHE, there it is.

            Can also see the clouds in the solar DW SW but much bigger, quicker hashier swings.

          • Norman says:

            Ball4

            Yes thanks, that is what I try to do but it can be a labor of love, it does take some time of which I do not have an unlimited amount.

            The Clear nights with calm conditions are easy with the available points. The Desert Rock, Nevada has many clear calm nights that do show the steady drop in temperature and Downwelling IR. The cloudy one is much more difficult because clouds often come with weather patterns that can have wind pulling warm air into the area or cold air distorting any possible effects of radiation on the sensors.

            Rain, as you point out, also will affect any results you are trying to see. Showing evidence of atmosphere warming the surface is much more difficult. Usually, even with clouds, the downwelling IR does not go above the upwelling, a lot of times they are even and the temperature does not change. You need to find an inversion to get the effect and a clear sky inversion of Arctic air will not help much since the surface is still cooling and the downwelling IR is not enough to actually warm the surface. I might get lucky and find the correct conditions but the problem will be that no one will be interested or care and it will not change anyone’s thought process, so it is a lot of work with zero benefit. You already accept the GHE so that is talking to the choir, it would be people like Kristian, Mike Flynn, Gordon Robertson and some others who would benefit but they will not accept this as valid evidence.

            Thanks again.

          • Gordon Robertson says:

            Norman…”You need to find an inversion to get the effect…”

            An inversion simply means there is warmer air over cooler surface air. That is not about radiation it’s about convection. There actually are warmer molecules of air above cooler molecules of air.

          • Gordon Robertson says:

            Ball4…”You can see the downwelling flux increase and then the cooling trend stops and reverses and the night-time temperature goes up for about 1/2 hour”.

            How about this. During the day, solar energy warms the surface, which is in contact with air. As the air warms it rises and is replaced by cooler air from above.

            When the Sun disappears over the horizon, the surface begins to cool. What you seem to be claiming is that GHGs making up 1% of the atmosphere can cause the surface to rewarm. That’s the basis of the AGW theory and it’s pseudo-science.

            If there’s any re-warming of air above the surface it involves the 99%+ of the atmosphere made up of N2 and O2, and it is due to convection.

            BTW…I experienced the greenhouse effect the other day, in a real greenhouse.

          • Ball4 says:

            Gordon, that was Norman writing.

            “What you seem to be claiming is that GHGs making up 1% of the atmosphere can cause the surface to rewarm. That’s the basis of the AGW theory”

            No.

            In your farmer’s green house visit, the GHE therein is from cats with digestive problems not the opacity of the atm. in there.

          • David Appell says:

            Gordon Robertson says:
            “What you seem to be claiming is that GHGs making up 1% of the atmosphere can cause the surface to rewarm.”

            Gordon, THIS is your fundamental error.

            You are only looking at CO2’s number density, but not how “big” the molecules are.

            At certain wavelengths, CO2 is *VERY VERY GOOD* at absorbing infrared radiation.

            At its maximum, its cross section is about 10,000 m2/kg.

            Imagine targets painted on the side of a barn. Now stand back, and throw a ball at the barn side.

            What’s your chance of hitting a target?

            Does it depend only on the number of targets?

            OF COURSE NOT.

            It also depends on the SIZE of each target.

          • Norman says:

            Gordon Robertson

            YOU: “An inversion simply means there is warmer air over cooler surface air. That is not about radiation its about convection. There actually are warmer molecules of air above cooler molecules of air.”

            Warmer air emits more IR than cooler air, so a warmer air mass above a cooler one will emit more radiant energy downward than the air below will radiate upward. This will create a NET IR flow greater to the surface than is leaving causing night time warming of the surface.

    • Gordon Robertson says:

      Massimo…”Since the upwelling temperature should reflect the ground temperature and it was declining too, how do you explain this?”

      Massimo…you are confusing IR with heat. Temperature applies to heat not to IR, even though a scale of colour temperature has been developed to equate EM to real temperatures. There is no upward and downward upwelling temperatures unless you are referring to convective heat transfer, which moves atoms.

      The temperature of the surface refers to the average kinetic energy in whatever atoms/molecules make up the surface. That has little to do with the LWIR measured from the surface although I’m sure they have a scale that equates heat to IR.

      If you think in reference to heat rising via radiation you get into that other nonsense about heat trapping and radiation from a cooler atmosphere transferring heat to a warmer surface.

  41. Mike Flynn says:

    Massimo,

    If I was a cynical person, I would say that Norman and his ilk haven’t got the faintest grasp on reality.

    But I’m not – so I won’t.

    I’m sure there’s some esoteric climatological sciency reason that reverses the normal laws of physics – cooling becomes warming, CO2 at 20C is hotter than air at 20C, and so on.

    Who knows – maybe Mann, Schmidt, and Hansen really do have first class intellects, and really did get Nobel Prizes!

    In the fantasy world of the GHE, anything is possible.

    Cheers.

    • Massimo PORZIO says:

      Hi Mike,
      I really didn’t read the discussion between you and Norman.
      I’m very busy these days and even if I take a look on daily basis here, I don’t read all the messages.
      Anyway, my impression is that sometimes there are misunderstandings between different posters.
      “CO2 at 20C is hotter than air at 20C, and so on.”

      I can’t believe Norman ever stated that, maybe it has been a question of wording, I guess.

      Have a great day.

      Massimo

      • Norman says:

        Massimo PORZIO

        The point brought up was not in my posts to Mike Flynn.

        It was between Mike and Tim Folkerts. Mike Flynn completely distorts the content of the initial post to form this absurd concept (he does this all the time and I don’t think he is able to stop doing it).

        Tim was explaining that Carbon Dioxide absorbs a lot more IR than Nitrogen or Oxygen (which is an experimentally proven fact).

        From that he made up this absurd conclusion to suggest that is what is being stated (which it is not).

        Hope that clears it up.

        Mike Flynn does not understand the concept of emissivity. He does not understand that two objects at the same temperature can have very different emission rates of IR radiant energy. I don’t think anyone can explain the concept to him.

        He also believes the Earth’s surface has been cooling for 4.5 billion years. He can’t grasp that in a molten state it cooled very rapidly and become solid but has not warmed or cooled much since then, it oscillates between some high and low points but shows no evidence of a continuous cooling.

        He is one strange person and does not seem to possess logical thought process. He just says things, not even sure why.

      • Mike Flynn says:

        Massimo,

        GHE supporters seem to think that in a sample of air, the CO2 is somehow at a different temperature, I guess. It’s extremely difficult to pin a GHE supporter into stating what the GHE actually is, how it is defined, quantified, and measured.

        Just assertions that CO2 is evil, and raises the temperature of thermometers placed on the surface – somehow, and by some amount – they just can’t say why or how much!

        Their non science continues when they continue to ignore the fact that photons have no rest mass, but do possess energy, which can be transferred to electrons either partially, wholly, or is some cases, not at all. An invidual gas particle can be travelling very slowly, or very fast. Momentum transferred by photon / electron interaction may be increased or decreased – the resultant sum of vectors may even be reduced to zero. This is used in practice to achieve temperatures within picokelvins of absolute zero.

        So, in the case of a group of gases being subjected to radiation of 10 um (around 20C), all gases will stabilise at 20C, although the individual photon/electron interactions make mockery of the concepts of heat and temperature. No GHE – regardless of the amount of GHGs present!

        GHE proponents rattle on about spectroscopy, and seem convinced that only certain wavelengths
        can be used to heat certain gases. They find themselves completely unable to explain how a sample of air can be raised to any reasonable temperature by merely compressing it in an enclosed space – regardless of any lower surrounding temperature.

        Oh well, it makes no difference. Facts are facts. Beliefs are beliefs.

        Cheers.

        • David Appell says:

          Mike Flynn says:
          “GHE supporters seem to think that in a sample of air, the CO2 is somehow at a different temperature, I guess.”

          You guess wrong.

          Now we’re finally getting somewhere….

        • Norman says:

          Mike Flynn

          Your scrambled thought process makes you a Legend on the boards. It is amazing!

          YOU: “GHE proponents rattle on about spectroscopy, and seem convinced that only certain wavelengths
          can be used to heat certain gases. They find themselves completely unable to explain how a sample of air can be raised to any reasonable temperature by merely compressing it in an enclosed space regardless of any lower surrounding temperature.”

          What GHE proponents feels this way?? Gases can be heated in various ways, conduction, convection. Nitrogen or Oxygen will not be heated by IR radiation, they are unable to absorb it but they can certainly be heated by other means. I really do not know why you post the material you do. I can’t understand your thought process.

        • barry says:

          GHE supporters seem to think that in a sample of air, the CO2 is somehow at a different temperature, I guess.

          You can add me to the list of “GHE supporters” that doesn’t think this.

          So who is Mike talking about?

  42. Mike Flynn says:

    Just for anyone who is besotted with Watts per meter – squared or otherwise.

    Ice (frozen water) emits more than 300 W/m2. It doesn’t matter if you’ve got millions of the buggers, you can’t even use them to make a decent cup of tea!

    Sad but true.

    Cheers.

    • Tim Folkerts says:

      Not sad at all! Just some cool (pun intended) physics for anyone willing to understand at more than a surface level!

    • ren says:

      Temperature anomaly over the South Ocean in March 2017.
      http://images.remss.com/data/msu/graphics/tlt/medium/s_pole/ch_tlt_2017_03_anom_v03_3.png
      And north.
      http://images.remss.com/data/msu/graphics/tlt/medium/n_pole/ch_tlt_2017_03_anom_v03_3.png
      Will April repeat the anomaly distribution in the Northern Hemisphere?

    • Norman says:

      Mike Flynn

      Your confusion on the matter can be alleviated by studying the material in this link about View Factors and how they work.

      You can thank me for leading you to some good information. Always wanting to help a fellow out.

      http://machineryequipmentonline.com/hydraulics-and-pneumatics/radiation-heat-transferview-factor-relations/

    • David Appell says:

      Mike Flynn says:
      “Ice (frozen water) emits more than 300 W/m2. It doesnt matter if youve got millions of the buggers, you cant even use them to make a decent cup of tea!”

      Does it work better than heating with a vacuum?

    • Gordon Robertson says:

      Mike Flynn…”Ice (frozen water) emits more than 300 W/m2. It doesnt matter if youve got millions of the buggers, you cant even use them to make a decent cup of tea!”

      Mike, don’t know where you got the 300 W/m^2. A watt is related to a horsepower, which is a measure of the rate of doing work. There are 746 watts per 1 hp. Heat is also related to doing work, in fact, heat and work are interchangeable even though there is no easy way to convert between the two mathematically.

      I would think the IR emitted by ice would lack the intensity and wavelength to warm much of anything. Mind you, if you put an ice cube from a fridge in an environment of -30C, it might produce a warming effect for an instant or two. It would likely radiate all it’s heat in a few seconds not to mention that lost by conduction.

      I’d like to know how the value of 250 W/m^2 was derived for the planet’s surface. It means essentially that the energy generated by 3 square metres of the surface has the capacity to do the work of a horse.

      I think something is wrong there.

      • Ball4 says:

        Gordon 5:25pm: “(The ice cube) would likely radiate all it’s (sic) heat…”

        Mistake!

        Gordon 4:44pm: The mistake many people are making is trying to pass of(f) radiant energy as heat…The point is that IR is NOT heat

        —–

        “..the energy generated by 3 square metres of the surface..”

        I think something is wrong there. The surface doesn’t generate energy. The surface does radiate energy at all wavelengths and all temperatures.

        • David Appell says:

          Ball4 says:
          “The surface doesnt generate energy.”

          The surface emits energy, upward.

          Some of that energy is absorbed by CO2, which then re-emits it in a random direction, depending on the molecule’s (random) orientation.

          Some of that re-emission is downward, warming the atmosphere and surface below.

          = AGW.

      • Mike Flynn says:

        Gordon,

        Sorry. I thought you were aware of the relationship between temperature and radiation.

        “All objects emit electromagnetic radiation. The amount of energy that is emitted by an object per unit surface area of the object is directly proportional to the surface temperature of the object (T is in the numerator). This is known as the Stefan-Boltzmann Law . . . ”

        At 273K, emission is 314.94 W/m2, given emissivity of 1. The emissivity of ice is around 0.98, so my > 300 W/m2 seems fair.

        You can look all this up yourself, if you’ve a mind to. It’s fairly basic physics, which most climatologists seem to ignore, or redefine if they can’t bully people into adopting their climatological silliness!

        As to the relationship between Watts and horsepower, you are correct. People tend to forget that something like ice is continuously emitting large amounts of energy. It’s just not easy to use in a heat engine, as it’s only hotter than colder matter. The heat from ice is ample to vapourise frozen CO2, but building an engine to utilise this principle is impractical, of course.

        I’m sure the GHE proponents will complain bitterly. They don’t seem to like inconvenient truths.

        By the way, pretending that adding wattages results in anything meaningful is just silly – or even stupid! Adding the 300W from a square meter of ice to 300W from another square meter of ice, gives 600 totally meaningless Watts! Maybe they are special climatological Watts, which result in a temperature rise compared with 300W from the same source.

        Cheers.

        • David Appell says:

          Mike Flynn says:
          “The amount of energy that is emitted by an object per unit surface area of the object is directly proportional to the surface temperature of the object (T is in the numerator). This is known as the Stefan-Boltzmann Law . . . ”

          OMG, no.

          It’s proportional to the 4th power of temperature.

          And the statement is about the energy flux emitted by the object, not the energy per square area.

          Basic physic, people.

          • Massimo PORZIO says:

            No David,
            you must read carefully Mike before criticizing him.
            1) He wrote “directly proportional” not specifying the the 4th power but he wasn’t detailing so he is still correct.
            2) He wrote “The amount of energy that is emitted by an object per unit surface area” which is exactly an energy “flux” indeed.

            What is the difference for you about “energy flux emitted by the object” and “energy per square area” of the same object?

            Have a great day.

            Massimo

      • David Appell says:

        Gordon Robertson says:
        “Id like to know how the value of 250 W/m^2 was derived for the planets surface. It means essentially that the energy generated by 3 square metres of the surface has the capacity to do the work of a horse.”

        Stefan-Boltzmann law.

        Basic physics, people.

  43. Bindidon says:

    Mike Flynn on April 6, 2017 at 9:00 PM (an at many many other places in this thread)

    It is amazing how far some people can go in keeping their ignorance alive against all odds.

    To Mike Flynn (manifestly one of these magnificent guys who never get tired of telling us “Well you know I have a degree in applied physics”), I suggest to leave his pseudoknowledge level and to move up to real knowledge about what people like barry, Norman and Tim Folkerts try to explain him.

    I’m talking here about the work of a humble science man named Joseph W. Chamberlain, who has been over 40 years ago a head man in explaining the effect of trace gases:

    Chamberlain, J.W., 1978. Elementary, Analytic Models of Climate: I. The Mean Global Heat Balance

    http://tinyurl.com/m4x3a8x

    (and select the pdf full text from there)

    and

    Chamberlain, J.W., Hunten, D.M., 1987. Theory of Planetary Atmospheres: An Introduction to their Physics and Chemistry.

    http://tinyurl.com/m2ad2r3

    Having (tried to) read that stuff, one begins to understand that the world of trace gases is a little bit more complex than you ever had imagined before.

    It is a hard but necessary way to grasp into it.

    May be then he manages to escape out of his boring monologues a la

    But all this is beside the point. Neither you, nor anybody else, can make a thermometer hotter by surrounding it with CO2.

    Still no GHE.

    How is it possible to stay so dumb?

    • Ball4 says:

      Demonstrably possible. Mike is always good for a few laughs at him not with him.

    • Gordon Robertson says:

      Bindidon…”It is amazing how far some people can go in keeping their ignorance alive against all odds”.

      This post of yours, which is essentially a smug attack on Mile Flynn, is one of the most ignorant, self-righteous bits of politically-correct nonsense I have ever read on Roy’s site. If you want to understand how trace gases operate in the atmosphere study basic chemistry not some yahoo writing a paper on climate models.

      The ideal gas equation is not that hard to understand, PV = nRT. It tells you using ‘n’, which represents the mass of a gas in a mixture, based on partial pressures, that a trace gas cannot possibly add much heating to a much larger gas mixture.

      In the atmosphere, where 99%+ of the gas mixture is nitrogen and oxygen, it is ludicrous to consider that CO2 at 0.04% could warm the mixture any more than a 1/10th of a degree C over a century.

      Furthermore, if you are really interested in heat transfer, go to the source, Clausius. He explains the 2nd law, entropy, and heat transfer subjectively without hiding behind meaningless equations. When he uses equations, he develops them piece by piece, explaining the meaning as he goes.

      Modern physicists have tended to steal his equations and add their own incorrect interpretations without having a clue what the equations mean. Hence we end up with a gross confusion between infrared energy and heat.

      • Ball4 says:

        Gordon 5:01pm: “In the atmosphere, where 99%+ of the gas mixture is nitrogen and oxygen, it is ludicrous to consider that CO2 at 0.04% could warm the mixture any more than a 1/10th of a degree C over a century.”

        How does added CO2 even warm the entire atm. mixture 1/10th of a degree C? CO2 isn’t burned as a fuel anywhere in the total system.

        Added CO2 extinction coefficient does add atm. opacity to the lower troposphere. So much so that it astonished Prof. Tyndall during his lab testing.

        • David Appell says:

          Atmospheric CO2 absorbs some of the upward infrared radiation given off by the Earth’s surface. It then emits it in a random direction. Some of that emission is downward, reaching the surface and warming it.

          • Ball4 says:

            Thus cooling the higher atm. with no net change in total atm. constituent KE.

          • David Appell says:

            Yes, the stratosphere COOLS with anthropogenic warming.

            This is the most significant prediction of greenhouse theory.

            And it’s been observed (you have to subtract out ozone loss, which is basically flat these days), and is the BEST evidence warming is caused by manmade greenhouse gases and not the Sun or something else.

          • Ball4 says:

            Concur.

      • David Appell says:

        Gordon, please read Clausius carefully…. His statement of the second law doesn’t apply to just ANY system.

        • Ball4 says:

          “(Clausius) statement of the second law doesn’t apply to just ANY system.”

          Name just any system then for which 2LOT as Clausius stated does not apply.

        • Gordon Robertson says:

          DA…”Gordon, please read Clausius carefully. His statement of the second law doesnt apply to just ANY system”.

          I am not referencing Clausius and the 2nd law to just any system. I am referencing him on heat transfer in the atmosphere.

          If you were talking about entropy, the system would have a bearing, as to whether it was reversible or not. That does not apply to the 2nd law, it is applicable anywhere heat is being transferred.

          Modern scientists have made the mistake of tying the 2nd law to entropy. That was not what Clausius intended and he explained that. He mentioned entropy as an aside to his development of the 2nd law not as a requirement of it.

          There is no need to reference entropy in any application of the 2nd law and doing so complicates matters in certain applications. The 2nd law is about the direction of the transfer of heat and losses but the implications of that are far reaching.

          Clausius went into great detail in his explanation of heat transfer and if you read him carefully he is talking about atoms and mass. He even equated the motion of atoms in a solid, as they vibrate, to work, and equated that work to heat.

          Some people argue that heat is internal energy only but what else could heat be? It cannot exist as energy outside the boundaries of a body, it is equated to the motion of atoms within a body. It’s the same with gases and liquids although gases have no atomic bonds holding them together.

          Others argue that heat is only the process of transfer and that it does not exist other than that. That’s not what Clausius said, he actually stated that heat is the kinetic energy of atoms.

          He also pointed out that at a macroscopic level we need not worry about the internal workings of the atom. I think that may have confused some people. Macroscopically, all we are concerned with is basically the relationship between heat and work.

          In the atmosphere, however, although we could relate heat to work, in the case of the GHE and AGW, we are concerned with the transfer of heat. The 2nd law has to apply.

      • David Appell says:

        Gordon Robertson says:
        “The ideal gas equation is not that hard to understand, PV = nRT.”

        You think heat can only be exchanged by conduction.

        Why are you ignoring other methods?

        • Gordon Robertson says:

          DA…”You think heat can only be exchanged by conduction.

          Why are you ignoring other methods?”

          With nitrogen and oxygen making up over 99% of the mass of the atmosphere I am not concerned about radiative transfer. It’s a red herring argument created by climate modellers because the equations for radiative transfer are already well established.

          I have already conveyed the message of Woods circa 1909 that radiation from the surface would be ineffective after a few feet due to the inverse square law.

          I think the average climate modeller is an idiot who has set science back a century. Same with quantum theorists. It’s about time we got back to observable science and away from our ego-oriented conditioned minds.

          The average modeller lacks the background in atmospheric physics to create a reliable model.

        • barry says:

          The average modeller lacks the background in atmospheric physics to create a reliable model.

          You have it backwards, Gordon. Astrophysicists are often the lead researchers on GCMs.

          Eg, lead author:

          https://www.aer.com/news-events/bios/michael-j-iacono

          On this GCM.

          http://onlinelibrary.wiley.com/doi/10.1029/2008JD009944/full

          Examples abound. GCMs are constructed with expertise in astrophysics pretty much always (I can’t find any examples against).

        • David Appell says:

          Gordon Robertson says:
          “DAYou think heat can only be exchanged by conduction.
          Why are you ignoring other methods?”

          No one is ignoring them. But that is not the mechanism by which the greenhouse effect operates — it does through radiative transfer, and you can’t ignore *that*.

  44. Norman says:

    Bindidon

    I looked at the book in the second link. Not only could Mike Flynnn benefit, it would also help Kristian. If he would read through pages 7 and 8 of the book he would see conventional physicists use two stream to describe the radiant flow, one up and one down and this author gives detailed equations to determine the intensity of each stream (or flux of energy…definitely bidirectional where it you look for the NET between the two).

    Thanks.

    • Bindidon says:

      Norman says:
      April 7, 2017 at 12:15 PM

      Don’t forget nevertheless to have a closer look at the paper pdf you access via the first link.

      The paper’s very kernel starts on page 9:

      4. Radiative Effects of Minor Constituents

      The addition to the atmosphere of a minor constituent that
      absorbs in the 8 to 12 pm window could be important.

      and tops on page 12 with equations (27) and (28), with a hint on

      … or a few parts per billion (ppb) for substances that have a single strong absorbing band in the 8 to 12 mu window.

      It’s easy enough to understand I guess.

    • JDHuffman says:

      “…definitely bidirectional where it [sic] you look for the NET between the two…”

      Pseudoscientists will be confused by this linked discussion of “NET”. They will assume the discussion applies to the atmosphere, not the model the author is discussing.

      They probably believe “MRE” refers to “Meals Ready to Eat”, rather than “Monochromatic Radiative Equilibrium”….

      Such is the vacuum of pseudoscience.

    • Gordon Robertson says:

      Norman…” If he would read through pages 7 and 8 of the book he would see conventional physicists use two stream to describe the radiant flow…”

      The point is to unify radiant flow with heat transfer while respecting the requirement of the 2nd law of thermodynamics, that in a context like the atmosphere, heat can only be transferred from a hot region to a colder region.

      The mistake many people are making is trying to pass of radiant energy as heat. Heat does not flow through space and anyone who thinks it does is sadly misinformed. I have seen thought experiments passed off on this site as suggesting that, or that heat flow can be blocked by GHGs.

      We need to agree on something. Who does or does not agree that infrared energy is electromagnetic energy and that heat is the kinetic energy associated with atoms and molecules? In fact, heat is the kinetic energy of atoms and molecules by definition.

      When a substance is heated by a flame, the electrons in the atoms of the substance have their energy levels raised instantaneously and they pass that energy to adjacent atoms. In that case, heat does flow, as kinetic energy, from atom to atom, like an electric current. Kinetic energy describes energy in motion, in this case the energy moving is thermal energy.

      I don’t think anyone here is arguing that heat is transferred from the heated end of an iron rod to the cooler end. The 2nd law is satisfied. Some seem to be arguing that a mutual heat transfer takes place with heat moving from the cooler end to the heated end, which is nonsense.

      In the atmosphere, heat is not transferred by an exchange of heat between bodies. A quantity of heat is not removed from one body and transferred to another. To do that, one would have to break off a chunk of mass from a hotter body and transfer it to the cooler body. To do that in the atmosphere requires convection.

      With only radiation, heat is transferred by infrared energy. However, heat does not leave the hotter body, it reduces in the hotter body. In the absorbing body, IR interacts with the electrons in the shells of the atom, causing them to rise to higher energy shells. That change in kinetic energy represent heating in the atom.

      The point is that IR is NOT heat. Trying to measure the up/down flow of IR does not measure heat transfer. Claiming a positive sign of the up/down IR flow satisfies the 2nd law is sheer bunk. The 2nd law is not satisfied in the atmosphere unless heat is transferred from the warmer surface to the cooler atmosphere and NOT is the reverse direction.

      You cannot have a body (the surface) lose heat through radiation, collect a small fraction of the radiated energy, re-radiate it back to the surface, and claim the surface will warm. That’s called perpetual motion.

      Until these basic facts are clearly understood about heat transfer there is no point discussing the problem though misguided thought experiments.

      • David Appell says:

        Gordon Robertson says:
        “The point is that IR is NOT heat.”

        GR, you get more preposterous, and dismissible, every day.

        • Ball4 says:

          Concur.

          Gordon 4:44: “The mistake many people are making is trying to pass of(f) radiant energy as heat.”

          Gordon 4:44 makes the same mistake he claims many people are making, passes off radiant energy as heat lost: “You cannot have a body (the surface) lose heat through radiation, collect a small fraction of the radiated energy, re-radiate it back…”

          “Heat does not flow…heat does flow..”

          Gordon remains somewhat confused. Let’s try to improve Gordon:

          The mistake many people are making is trying to pass off radiant energy as kinetic energy, the truth is photons have no mass so contain no KE (photons do possess EM energy, momentum, polarization).

          You can have a body (the surface) reduce the kinetic energy of its constituent particles through radiation…

          Heat does not flow from a body since heat is not contained in that body, the KE of constituent particles can transfer (via conductive, convective, radiative energy transfer) from/to that body decreasing/increasing the body temperature.

          I do not expect miracles.

          • David Appell says:

            Ball4 says:
            “The mistake many people are making is trying to pass off radiant energy as kinetic energy, the truth is photons have no mass so contain no KE”

            Photons have no kinetic energy???

            Al Einstein disagrees!

            E=hf

          • Ball4 says:

            “Photons have no kinetic energy???

            Correct.

            E=hf is energy David, that’s what the big E stands for. The E is not KE, which involves mass.

          • David Appell says:

            Ball4: But for a photon E = pc = hf, where p is its momentum.

          • Ball4 says:

            Yes and this shows our common understanding of momentum involving mass is not the whole story, much to read on that, try looking into the equivalence principle too.

          • Ball4 says:

            Oh, and should have noted photons have both linear AND angular momentum.

        • David Appell says:

          Ball4 says:
          “Heat does not flow from a body….”

          A cake doesn’t cool when taken out of an oven?

          • Ball4 says:

            There was never any heat existing in your cake David, only KE of its constituent particles which can be radiated/conducted away to cool to room temperature in your example.

            For entertainment purposes, you are free to invent your own mythology, superstitions about heat which others display repeatedly. I’ll go with Clausius definition of heat which has admirably survived the test of time.

          • David Appell says:

            No heat in the cake?

            So you think you can eat the cake the moment you take it out of the oven, without scalding your mouth?

          • David Appell says:

            What about a pie — can you eat a pie the instant after you take it out of an oven?

            Why not? Is it hot??

          • Ball4 says:

            No heat in the cake or pie David, that’s simply mythology. Plenty of constituent particle KE in your cake & pie though, readily detected by kitchen thermometers.

          • David Appell says:

            Ball4 says:
            “No heat in the cake or pie David, thats simply mythology.”

            So then why would your finger get burnt if you stuck it into the pie?

          • Ball4 says:

            The pie’s constituent particle KE.

        • Gordon Robertson says:

          DA…”GR, you get more preposterous, and dismissible, every day”.

          And the more you open your mouth without an intelligent scientific rebuttal the more I am convinced you have nothing more than high school science.

          Heat is NOT IR. They have nothing in common. Heat is associated with atoms and heat requires mass. IR is EM, which has no mass.

          Your misunderstanding of such basics is why you are so firmly entrenched in the pseudo-science surround catastrophic global warming.

      • David Appell says:

        “You cannot have a body (the surface) lose heat through radiation, collect a small fraction of the radiated energy, re-radiate it back to the surface, and claim the surface will warm. Thats called perpetual motion.”

        Ever hear of the Sun as a heating source?

        You really don’t have the slightest clue how radiative transfer works.

        • Norman says:

          David Appell

          I see you are back and recovered from your surgery. Saw it on your blog.

          • David Appell says:

            And why do you bring it up here?

          • Norman says:

            David Appell

            Sorry about that if it offended or bothered you. I was just wondering what happened to you.

          • David Appell says:

            It’s irrelevant here.

          • barry says:

            No need to be mean to a friendly gesture in any forum.

          • David Appell says:

            Discussions of my health aren’t “friendly,” and Norman well knows that it doesn’t belong here. He’s just being a dick on purpose. Can it.

          • barry says:

            Have you ever considered that a conversation can be more productive with some demonstrated good will? Tone matters – to lurkers, too, if that is your intended audience.

            Tone is irrelevant to truth. But it is relevant to getting people to listen to your point of view. Perhaps getting people to listen isn’t important to you?

        • Gordon Robertson says:

          DA…”Ever hear of the Sun as a heating source?”

          Ever heard of thermal equilibrium? There is an equilibrium established between solar energy reaching the surface and infrared energy being emitted from the surface and conducted from the surface.

          You are suggesting that the radiated energy can be sent back by GHGs in a cycle of perpetual motion to raise the surface temperature beyond what it is warmed by solar energy. You seem to buy into Rahmstorf’s theory that the energy radiated from the surface at a loss can be back-radiated and added to solar energy.

          Rahmstorf also thinks that the 2nd law is satisfied if the net IR energies up and down are positive. He obviously has not a clue what the 2nd law is about….heat, not IR.

          Please don’t talk to me about my understanding of the radiation theory till you understand the basic laws of thermodynamics.

          • David Appell says:

            Gordon Robertson says:
            “You are suggesting that the radiated energy can be sent back by GHGs in a cycle of perpetual motion to raise the surface temperature beyond what it is warmed by solar energy. You seem to buy into Rahmstorfs theory that the energy radiated from the surface at a loss can be back-radiated and added to solar energy.”

            Rahmstorf is absolutely right. But he’s just saying what *all* scientists know.

            “Please dont talk to me about my understanding of the radiation theory till you understand the basic laws of thermodynamics.”

            You completely fail to understand radiation theory. You don’t even understand that a heat can also be infrared radiation.

  45. Bindidon says:

    … it would also help Kristian.

    Indeed, Norman!

    • Snape says:

      To Mike Flynn:

      This idea that clothes can produce warming is utter nonsense. Neither you, nor anybody else, can make a thermometer hotter by putting clothes on it.

      Cheers

      • Mike Flynn says:

        Snape,

        You are absolutely correct. Wrap a thermometer in clothes, or an insulator, or a gas.

        It gets no hotter. As a matter of fact, if you prevent heat from reaching a thermometer, its temperature will drop. If you wrap a corpse in clothes, don’t expect it to heat up,and come back to life!

        Typical GHE supporter response – deny, divert, and confuse! Can you raise the temperature of a thermometer on the Earth’s surface by increasing the amount of GHG between it and the Sun? Rhetorical question, I know. Of course you can’t!

        Cheers.

        • Snape says:

          Mike

          We agree again! After I discovered that putting clothes on a thermometer didn’t actually make it hotter, I started going to work in my underwear. People are amazed that I never get cold!

          • Ball4 says:

            Yes, given Mike’s belief no need to check the temperature outdoors as selection of heavy long johns or shorts, clothes, jackets, heavy jackets to sally forth in the AM will not matter. People that move from Fla. to N. Dakota in Dec. can thus use their existing wardrobe according to Mike’s science recommendations. Save money.

            Oh, and by the way, people move from N. Dakota to Florida in the winter and do not die from their climate T change, so why all the hubbub about 0.1C/decade in global climate? Give me a break. There is no GHE worth worrying about. By test!

          • David Appell says:

            Ball4 says:
            “Oh, and by the way, people move from N. Dakota to Florida in the winter and do not die from their climate T change, so why all the hubbub about 0.1C/decade in global climate?”

            What was the difference in average global surface temperature between the last glacial period, 22,000 years ago, and the pre-industrial Holocene?

          • David Appell says:

            Ball4 says:
            Oh, and by the way, people move from N. Dakota to Florida in the winter and do not die from their climate T change, so why all the hubbub about 0.1C/decade in global climate?”

            How readily do plants and other species change climate regimes?

          • David Appell says:

            MF,

            Do you really not understand that insulation works both ways — heat doesn’t get in, and heat doesn’t get out????

          • David Appell says:

            No answer, Flynn?

          • Ball4 says:

            “How readily do plants and other species change climate regimes?”

            If people want to take plants with them when moving, they will do just fine as long as properly cared for & the border guards don’t confiscate.

          • Snape says:

            Ball4

            How do you feel when you’re temperature is 1.0 C higher than usual?

          • Snape says:

            When our bodies are 2.0 C warmer than usual, we are really sick.

          • Ball4 says:

            “How do you feel when you’re (sic) temperature is 1.0 C higher than usual?”

            That happens to me after reading a Mike Flynn comment, usually accompanied by laughter. People flying from New York at -10F getting off the plane in Miami at 72F experience a climate change delta T of 82F and are not dropping dead. They just take off their winter jackets which according to Mike the jackets had no effect anyway in NYC blizzard they left.

            Just thinking that I measure +1C higher right now, oh and Mike’s total ignorance of quantum mechanics 5:51pm may have helped.

          • Ball4 says:

            “What was the difference in average global surface temperature between the last glacial period, 22,000 years ago, and the pre-industrial Holocene?”

            Nobody knows.

          • David Appell says:

            Ball4 says:
            “If people want to take plants with them when moving, they will do just fine as long as properly cared for & the border guards dont confiscate.”

            A) So a cactus from Arizona can be transported and grown in Alaska?

            B) Regarding climate change, people don’t “take” plants, the plants are on their own. The only question is if they have the capability to adapt fast enough to continue to exist.

          • Ball4 says:

            “A) So a cactus from Arizona can be transported and grown in Alaska?”

            Yes. As I wrote with proper care, there are at least 4 cactus species native to Alaska, for example prickly pear which also grows in/native to Arizona.

            As far as “take with plants”, long ago Phoenix was a haven for pollen allergy suffers. No longer, the snow birds took their plants with.

        • David Appell says:

          Mike Flynn says:
          “As a matter of fact, if you prevent heat from reaching a thermometer, its temperature will drop.”

          What if you prevent heat from escaping a thermometer?

          • Mike Flynn says:

            DA,

            If you can prevent all energy from escaping from a thermometer, its temperature, of cours, will not drop.

            Unfortunately, no such perfect insulator exists. The flip side, of course, is that a perfect insulator would also prevent any external energy reaching the thermometer, being perfectly reflective by definition. The climatological one way insulator is a figment of fantasy.

            But I know you were only trying for another stupid “gotcha”, and trying to avoid facing the fact that the GHE doesn’t exist any more than the luminiferous ether.

            All your silly attempts to point out out that the human body is designed to maintain its core temperature at around 37C, has nothing to do with the non existence of the GHE.

            If you have any new information, I would like to hear it. Rabbiting on about the fact that overcoats don’t increase the temperature of corpses doesn’t seem to show that CO2 increases the temperature of thermometers.

            Cheers.

          • David Appell says:

            Mike Flynn says:
            “If you can prevent all energy from escaping from a thermometer, its temperature, of cours, will not drop.”

            Exactly.

            Insulation reduces heat loss.

            So does atmospheric CO2.

          • Mike Flynn says:

            David,

            As I pointed out, insulation also prevents heat getting in. That’s why firemen wear thick insulating clothes, and why the hottest places on Earth (arid tropical deserts) have the least GHGs between the surface and the Sun.

            Maybe you might consider using a less pointless and irrelevant analogy, and try science.

            Trying for “gotchas” doesn’t seem to be working out all that well for you. Maybe it appeals to the mentally deficient, or the gullible – if that’s your intended audience, you’ll do well.

            Cheers.

          • David Appell says:

            MF: Do fireman’s clothes prevent heat from getting in, or do they prevent heat from getting out?

          • David Appell says:

            Mike Flynn, again avoiding questions. Tsk, Tsk.

        • Norman says:

          Mike Flynn

          Your question: “Can you raise the temperature of a thermometer on the Earths surface by increasing the amount of GHG between it and the Sun?”

          The correct answer is you can. The Sun produces most its energy in the visible spectrum of EMR.

          You can thank me for this link to Plank’s Law and how it works.
          https://en.wikipedia.org/wiki/Planck%27s_law.

          GHG’s do not absorb much energy in the visible spectrum so most of the visible solar energy can reach the ground on cloudless days.

          Now the GHG will be warmed and start emitting IR toward the surface and based upon the classic heat transfer equation.

          Φ = εσA(T4 − T04)
          where

          Φ = (phi) net heat flow rate [W] emitted (+) or absorbed (−)
          ε = (epsilon) emissivity, a dimensionless (unitless) measure of a material’s effective ability to emit or absorb thermal radiation from its surface; ranges from 0 (none) to 1 (maximal)
          σ = (sigma) Stefan’s constant, 5.670 10−8 W/m2K4
          A = surface area [m2] of the object emitting or absorbing thermal radiation
          T = absolute temperature [K] of the object emitting or absorbing thermal radiation
          T0 = absolute temperature [K] of the environment

          Now can you do math? In the above equation what happens to the net heat flow rate as the temperature of the environment goes up?

          If you can do math you will answer correctly that as the surrounding temperature increases the heat flow from the surface goes down. If it has the same input energy and can not lose energy as fast the thermometer on the surface goes up. Are you glad I helped you learn something today? I hope so.

          • Mike Flynn says:

            Norman,

            Sorry Norman, but you are fantasising. On Earth, the absorbed radiation from the Sun is recorded as a temperature increase by a thermometer on the surface. At night, the temperature drops, as the thermometer emits more energy than it absorbs.

            Increasing the proportion of GHG in an enclosed space – say a room, bottle, or gas cylinder, changes the temperature not a bit.

            The hottest places on Earth (due to sunlight) are in arid tropical deserts. By definition, lacking that most important GHG, H2O. The less GHG between the Sun and the surface, the hotter it gets. Taken to extremes, the Moon has no GHGs at all, and achieves temperatures in excess of 107C after equivalent exposure times.

            John Tyndall pointed out (with measurements, of course), that the higher up a mountain you go, the higher the surface temperatures get – under windless conditions.

            You might have noticed your GHE doesn’t seem to work indoors, in the shade, at night, when it’s cloudy or raining, inside CO2 cylinders – and works negatively in deserts (the less GHG, the higher the temperature).

            Maybe you could try your maths under the conditions I have mentioned. Or apply them to a container of boiling water left out in the Sun – surrounded by GHG, as opposed to not surrounded.

            Still no GHE. Complete nonsense.

            Cheers.

          • David Appell says:

            Ignore him, Norman — MF is a troll who won’t answer any questions that challenge his denial.

          • David Appell says:

            Mike Flynn says:
            Wrap a thermometer in clothes, or an insulator, or a gas. It gets no hotter.

            Really??

            So if I put a thermometer at room temperature into an oven at 450 F, it gets no hotter?

            Then how am I cooking anything in there?????

          • David Appell says:

            Mike Flynn says:
            “Still no GHE. Complete nonsense.”

            Does the Earth’s atmosphere store heat?

            If so, it has a GHE.

          • Gordon Robertson says:

            Norman…”The Sun produces most its energy in the visible spectrum of EMR”.

            Over 50% of solar radiation is in the infrared. How does that incoming infrared affect GHGs in the atmosphere?

          • David Appell says:

            Gordon Robertson says:
            “Over 50% of solar radiation is in the infrared”

            But little of it is in the bands that CO2 absorbs.

        • David Appell says:

          Mike Flynn says:
          “Wrap a thermometer in clothes, or an insulator, or a gas. It gets no hotter.”

          Really?

          • David Appell says:

            Do you see, Flynn, finally, the absurdity of your claims that have no foundation in science?

          • Mike Flynn says:

            Really. Without heat, the thermometer will drop to absolute zero. So will whatever you wrapped it in. Maybe you have some magical self heating CO2 lying around, but I doubt it.

            Have you?

            Cheers.

          • David Appell says:

            MF: Finally you agree with the concept of insulation, which keeps a body warmer by reducing heat loss.

            That’s exactly what atmospheric CO2 does to the planet.

            See how easy that was?

          • David Appell says:

            Mike Flynn says:
            “Without heat, the thermometer will drop to absolute zero”

            But your clothes have a ready source of heat: your body.

            So does the Earth: the Sun.

            🙂

          • Gordon Robertson says:

            DA…”MF: Finally you agree with the concept of insulation, which keeps a body warmer by reducing heat loss.

            Thats exactly what atmospheric CO2 does to the planet”.

            Let me see if I have your reasoning straight. If I have a blanket over me as I snooze, it will keep me warmer provided the room temperature does not get too low. So, you’re suggesting CO2 in the atmosphere acts as a blanket.

            All CO2 in the atmosphere accounts for 0.04% of the atmosphere. All GHGs account for 1% roughly. Let’s give you the 1%.

            If I had a blanket that covered 1% of my body it would have to be very small or threadbare. If I had a blanket covering 0.04% of my body, exactly what warming effect would it or the one percenter have in keeping me warm?

        • barry says:

          Mike’s theory is lacking a heat source.

      • David Appell says:

        Snape says:
        “This idea that clothes can produce warming is utter nonsense. Neither you, nor anybody else, can make a thermometer hotter by putting clothes on it.”

        Why do you wear a coat in the winter?

        • Mike Flynn says:

          David,

          What has wearing clothes, or fur, or blubber, got to do with the non existent GHE?

          No one has managed to raise the temperature of a thermometer by surrounding it with CO2. Or by using the power of their mind – Uri Geller included.

          How hard can it be?

          If you can’t do it, maybe you could just deny, divert, and confuse the issue by talking about overcoats. That might work!

          Cheers.

        • David Appell says:

          Mike Flynn says:
          “No one has managed to raise the temperature of a thermometer by surrounding it with CO2”

          We do this every day, right here on Earth. Or Venus.

        • Snape says:

          David Appell

          Serious? You must have missed my follow up about how I started going to work in my underwear after finding out that clothes don’t make a thermometer hotter.

          • Mike Flynn says:

            Snape,

            Are all GHE supporters as silly as you are trying to appear? Or did you really not go to work in your underwear?

            I know Warmists live in a fantasy world, but going to work in your underwear because nobody’s managed to make a thermometer hotter by surrounding it with CO2, seems a bit extreme.

            Maybe just having a tantrum, lying down and beating your heels on the floor, might be just as cathartic. Do you think the Trump administration would be more inclined to believe in the non existent GHE if you run around in the nude?

            I’d be inclined to avoid very cold or very hot weather, if I were you.

            Cheers.

          • Snape says:

            Mike

            I’m pretty sure I’d get arrested if I actually went to work in my underwear.

            Besides the silliness, I was hoping to point out something you fail to notice:

            Clothes on a thermometer – not much happens

            Clothes on a warm body – helps keep it warm

            Co2 around a thermometer- not much happens

            Co2 around a warm planetary body – helps keep it warm

            Keep in mind that although both clothes and Co2 act as insulators, Co2 is clear and does not block sunlight as clothes do. Thus the term, “greenhouse gas”.

          • David Appell says:

            Snape says:
            “Serious? You must have missed my follow up about how I started going to work in my underwear after finding out that clothes dont make a thermometer hotter”

            So why *DO* you wear clothes?

            (Besides the social convention.)

          • Snape says:

            David

            See my above reply to Flynn.

          • Mike Flynn says:

            Snape,

            “Helps to keep it warm . . ” doesn’t seem to be causing a raise in temperature – as in “Hottest year EVAH!”

            I’m not sure how “Helps to keep it warm” leads to rising temperatures, and I suspect that you don’t either.

            At night, temperatures seem to fall – as they do in winter. Even a gas cylinder filled with compressed CO2 doesn’t seem to be popular as a heat source.

            It seems far too difficult for GHE supporters to actually demonstrate their effect, so they have to resort to the usual tactics of deny, divert and confuse. Uri Geller supposedly bent spoons with the power of his mind. His powers apparently vanished when unbelievers were present. Maybe the GHE obeys the same laws.

            Cheers.

          • Snape says:

            Mike

            You make the argument that if Co2 can’t make a thermometer hotter, how could it warm the earth? This struck me as particularly idiotic since you could ask the same about clothes, “if clothes can’t make a thermometer hotter, how could they possibly keep you warm?”

            Or how about, “I just wrapped some insulation around a thermometer and nothing happened! How could it keep my house warm?”

          • David Appell says:

            Which reply?

            If you have an answer, just give it. Can’t wait.

          • Snape says:

            David

            I was poking fun at Flynn’s bonehead argument that if you surround a thermometer with Co2 and it doesn’t get hotter, how could it warm the earth?

            I tried to point out (sarcastically) that putting clothes on a thermometer won’t make it hotter either.

          • Snape says:

            I realize you read so many knucklehead comments it’s hard to tell when someone’s not being serious.

          • David Appell says:

            Mike Flynn says:
            “It seems far too difficult for GHE supporters to actually demonstrate their effect”

            More Flynn evasions, more Flynn refusal to answer even basic questions or reply to simple comments.

          • David Appell says:

            Mike Flynn says:
            Helps to keep it warm . .

            Now you’re claiming that you don’t understand how clothing keeps up warm?

            You get more and more absurd with each reply.

          • David Appell says:

            Sorry, Snape, for confusing your replies.

  46. barry says:

    Bart,

    If CO2 changes are temperature dependent, we’ve had an an increase of 90ppm since 1959, alongside a temperature increase over the same period of 0.8C.

    If 0.8C rise causes 90ppm rise in CO2 and the planet was 5 C cooler during the last few glacial periods…

    What do you estimate the atmospheric CO2 concentration should be at the bottom of each ice age?

    Simple subtraction gets us into negative CO2 territory, so that can’t be right.

    Based on your hypothesis, what should CO2 atmospheric concentrations be during ice ages?

    • David Appell says:

      Always a great question.

    • bilybob says:

      Just out of curiosity why would this period be representative of the long term relationship?

      The reconstructed temp/co2 record shows that as global temperatures hit their peak and begin to fall co2 continues to rise, then eventually falls with temperatures. Then at the other extreme the temperatures begin to rise co2 concentrations eventually reverses itself and rises as well. Would not the reconstructed temp/co2 be a better source for your question?

      This pattern reinforces the notion that co2 is dependent on temperature and is consistent with known natural processes. It does not disprove that co2 levels also affects global temperature, however at the inflection points, there is a suggestion that other factors are in greater control.

      • barry says:

        In the case of ice ages, I completely agree that CO2 is led by temps over the long term. I am asking Bart to make a prediction of what CO2 temps should be based on his contention that temps have led CO2 over the ML record since 1959. That means that a 0.8C temp rise has caused a 90 ppm increase in CO2.

        For various reasons that seems wildly wrong. I asked to him to predict CO2 at the bottom of ice ages according to his hypothesis. Unfortunately, Bart’s model appears to be non-predictive for most things.

        Bart did predict (or claim) that the recent slowdown in global temps produces a slower acceleration in CO2. Unfortunately, he does not want to run the numbers to see if that has actually happened. when I do so, he claims my methods are wrong, and still won’t do the work himself to corroborate.

        Basically, I’m trying to get him to substantiate his hypothesis. He keeps showing me a graph of monthly CO2 acceleration (first difference CO2) tracking well with global temp fluctuations and claiming that this is easily viewable evidence of the long-term relationship (I think it only shows that the monthly acceleration changes correlate well with temp anomalies). He also claims that one only has to look to see than acceleration has slowed down post 1998. I don’t see it.

        http://www.woodfortrees.org/plot/esrl-co2/derivative/mean:12/to:2015/plot/esrl-co2/to:2015/derivative/trend

        Our conversation has been stuck in a loop because Bart won’t go further than insist I look at the graph and believe my (his) eyes.

        • Bart says:

          Our conversation is stuck in a loop because you are trying to nit-pick at non-issues so that you can keep the illusion of discrepancy alive and remain in denial. My doing extra work will not alleviate that. you will just train your microscope on some other imagined flaw to continue your self-deception.

          The result here is glaringly evident. I won’t give ground on that. To do so would be to deny reality itself, in order for you to indulge in the fiction that there is room for negotiation here.

          There isn’t. The rate of change of atmospheric CO2 tracks temperature anomaly. There is no doubt about it. No room for negotiation. No chink in the armor. It is a fact.

          • Nate says:

            Bart adds to his many logical failures.

            In order for your fact to, in fact, be a fact, then many other long established facts have to be wrong. Such as CO2 levels over the last millenia or more.

            Im sorry but that is simply the way it is in science and logic, one cannot prove a fact by throwing out other facts, unless you can convincingly disprove them. Which you havent.

            Then there is the mathematical sleight of hand in his arguments that he simply chooses to disregard.

        • barry says:

          The rate of change of atmospheric CO2 tracks temperature anomaly. There is no doubt about it. No room for negotiation. No chink in the armor. It is a fact.

          This is the loop we’re stuck on. I agree with that (now for the 453,276th time) and then probe the matter further, specifically to see if there is correlation on lower frequencies. I did that from the outset of our discussion 2 weeks ago.

          But you refuse to. You keep repeating this mantra which I agreed with 2 weeks ago and nearly every day since. I start investigating lower frequency correlation and you return to this.

          Again and again and again and again.

          We are stuck because you refuse to move beyond the first observation we both agreed on from the beginning. I even predicted that you would bring it up before you did. Your loop precludes you even seeing me agree with you. In print. Many times.

          That’s definitely your glitch, not mine.

        • barry says:

          Here is where 2 weeks ago I predicted you would produce the derivative graph.

          http://www.drroyspencer.com/2017/03/the-global-warming-debate-spectrum/#comment-241202

          And here is where 2 weeks ago, 14 hours later in the same thread, I agreed that “short-term matches do occur and temperature leads those events.”

          http://www.drroyspencer.com/2017/03/the-global-warming-debate-spectrum/#comment-241259

          You haven’t moved on substantively since then, let alone perceived that I agreed with you on short term correlation despite saying so many, many times to you since.

          Definitely your glitch, your loop.

    • Bart says:

      Barry –

      “If 0.8C rise causes 90ppm rise in CO2 and the planet was 5 C cooler during the last few glacial periods”

      You are still hung up on proportionality, when the relationship is to the rate of change.

      bilybob –

      “Just out of curiosity why would this period be representative of the long term relationship?”

      A cogent point. We are dealing with a massively complex, time varying, nonlinear system. There is no reason to expect that local approximations to specific behavior over a given time interval should extrapolate to general behavior over all time.

      “It does not disprove that co2 levels also affects global temperature…”

      At some level, it must. But, it is very state dependent, i.e., depends very much on the overall configuration that encompasses every physically relevant variable on the Earth, as well as on other bodies such as the Sun and the Moon which influence the Earth’s climate.

      Right now, in the present state of the system, as there is obviously a strong driving relationship between temperature and the rate of change of CO2, there cannot be a significant sensitivity of temperature to CO2, as that would produce an unstabilizable positive feedback loop, and we would be witnessing rapid exponential growth in both variables.

      • barry says:

        You are still hung up on proportionality, when the relationship is to the rate of change.

        I agree* that the relationship is to the rate of change (acceleration) – the instantaneous changes month to month.

        Where we part company is that you think this is also evidence that temps drive CO2 long-term in the period of the instrumental record.

        If you are saying that the overall change in temperature over the last few decades is not responsible for the rise of CO2, then we agree.

        But you keep saying the instantaneous relationship also shows the long-term relationship and pop up the first difference CO2 graph to demonstrate it.

        We have a good idea of the temp rise since 1959. We have an excellent record of CO2 over the same period. We have all we need to assess whether the instantaneous relationship holds good for the long term. After a bunch of different tests (some you haven’t seen) I conclude it is not.

        Pointing at the graph isn’t going to cut it, I’m afraid. You clearly don’t see what I see. When will you take the next, logical step in the discussion?

        * for the 234,657th time.

      • barry says:

        There is no reason to expect that local approximations to specific behavior over a given time interval should extrapolate to general behavior over all time.

        The given time interval is one month. That’s where the correlation is.

        Looks like you’re saying that you can’t extrapolate monthly behaviour to decadal/centennial. We may be on the point of agreeing.

      • Bart says:

        “But you keep saying the instantaneous relationship also shows the long-term relationship and pop up the first difference CO2 graph to demonstrate it.”

        There is long term, and there is very long term. I think perhaps you are purposefully blurring the concepts.

        “After a bunch of different tests (some you havent seen) I conclude it is not.”

        Not to put too fine a point on it, but I do not see any indication you are qualified to understand what you are doing.

        “The given time interval is one month>”

        One month is overwhelmingly dominated by noise. You can’t extrapolate anything on the basis of one month.

        • barry says:

          I’ve been clear about what I mean by long-term, and you’ve talked about it with me. Namely, the overall acceleration prior to and post 1998. 15-18 years prior and after.

          More shortly, decadal as opposed to monthly.

          Clear?

  47. ren says:

    CO2 radiates, and California is still snowing.
    http://images.tinypic.pl/i/00889/x0wmmqd0h1rq.png
    Probably too little CO2?

    • Obama says:

      California has a Cap & Trade scheme and also has climate taxes to fight climate change. The drought is over and it is still snowing is due to higher taxation to fight climate change and cap & trade.

      Proof positive that the government can control and regulate climate change.

      California is increasing the gasoline taxes to fight climate change. So we should see even more snow and less drought in the future.

      There is a direct correlation between California’s fight against climate change and more snow.

    • barry says:

      Is the difference between weather and climate not understood?

  48. ren says:

    Up to about 100 hPa (0.1 bar) of gas law and hydrostatic balance are strictly observed.
    To this height, the atomsphere is dense enough. This is also true on other planets with a dense atmosphere.

  49. Mike Flynn says:

    David Appell,

    I just placed a cake in my oven. The air contains around 400 ppm CO2, I believe. I left the cake for about 15 minutes. The temperature of the cake seemed quite unchanged. The oven appears fairly well insulated. Do you think more insulation would raise the temperature? Maybe the back radiation from the CO2 wasn’t working?

    The Sun is shining brightly outside. The GHE seems to have stopped working. I can’t see how wearing an overcoat will heat the cake (or me, for that matter). I’ve actually got the AC on at present. Maybe it’s the GHE in reverse, but the CO2 in the air doesn’t seem to be having any effect.

    Good luck with using CO2 to heat your oven. I find electricity works much better for me.

    Cheers.

    • Tim Folkerts says:

      The fact you would even write such a thing shows you have NO idea how the green house effect works.

    • Snape says:

      Mike says:

      “I don’t know how the overcoat will heat the cake (or me, for that matter).”

      So do some science. Put the coat on the cake and see if it gets hotter. Then put the coat on you and see if you get hotter.

      • Snape says:

        Mike

        Before conducting your experiment, consider that a cake, out of the oven, is losing heat. Your body, on the other hand, is simultaneously losing and generating heat.

        In this respect, the earth is more like your body than the cake. The sunny side is gaining heat while the dark side is simultaneously losing heat.

        • Snape says:

          Strictly speaking, the sunny side is loosing heat as well, but warming wins the battle. Warm weather systems can obviously bring warmth to the dark side, but this is kind of nitpicking the basic idea.

      • Mike Flynn says:

        Snape,

        The cake remained at the same temperature. Putting it the oven, or wrapping it a coat made no difference. The temperatures of the cake, the oven, the coat, the room, remained relatively unchanged. So did mine.

        Putting on a coat didn’t seem to make any difference to my temperature – it seems to remain at around 37C. Much the same as yours, or any other reasonably healthy human being.

        Does your temperature increase when you put on an overcoat? How high does it get? If insulation increases temperature, then mountain climbers would not get frost bite, I suppose. The finest and best engineered high altitude climbing boots, the inners, and the socks etc., cannot guarantee that you will descend with all your toes intact, rather than a blackened dead mess, requiring immediate amputation before gangrene sets in, and death results. Your overcoat certainly won’t stop your temperature dropping after you die.

        So what’s your next pointless and irrelevant clothing analogy? Can you not produce a copy of the AGW theory, supported by experimental evidence showing that the theory is no longer a hypothesis?

        I thought not – that’s why you adopt the deny, divert and confuse tactics of the gullible and misguided Warmist!

        How hard can it be? Surely you can make a thermometer hotter with some CO2 (or water vapour, perhaps)? Maybe re-reading the non existent AGW theory might help to achieve an impossible result!

        Cheers.

        • Snape says:

          Mike

          I wasn’t serious about the experiment because I didn’t think YOU were serious!

          It’s one thing not believe in AGW, but
          you don’t think WEARING CLOTHES keeps a person warm?

          • Mike Flynn says:

            Snape,

            Excuses, excuses. Your’e not serious? Or serious but ignorant?

            Why bother demanding that people do things you think are pointless?

            People wear clothing for a variety of reasons. For example, desert Berbers wear thick woollen robes in some of the hottest places on Earth. Their habits are supported by an Arab saying “If I’d known it was going to be this hot, I would have worn a thicker robe”. Maybe you think that people invariably wear clothes to “keep warm” (whatever those particular weasel words mean), but insulators work both ways.

            Deny, divert, confuse – typical Warmist nonsense in lieu of any facts. Telling me what I think (or don’t think) requires that you have mind reading abilities. Also typical Warmist thinking, it might appear.

            Maybe you could quote my written words, and then provide facts which show that I am wrong. Inconvenient, I know, but rational scientific discussion is often based on fact, rather than fantasy.

            So far, you’ve provided precious little fact to support your mad assertion that CO2 can raise the temperature of a thermometer. You are free to believe in AGW, the ether, phlogiston, or unicorns. I’m free to disagree. I prefer fact to faith, in general.

            Cheers.

          • Snape says:

            Mike

            A. We just proved that clothes don’t really keep a person warm (it’s been a 10,000 year urban myth).

            B. The experiment was flawed.

            Hmmmm…?

          • Snape says:

            Mike.

            I’ve made analogies to clothing because they are an insulator we are all familiar with. Because if you don’t believe in insulation (Don Quixote comes to mind), or are unable to understand it, there’s no point in debating anything to do with GHE with you.

          • Snape says:

            Mike

            I do want to apologize for telling you you to do an experiment, and then afterwards claiming it was flawed and I wasn’t serious. Seemed ok at the time.

          • David Appell says:

            It does appear that MF wrote that clothes don’t keep him warmer.

            More likely, he’s just too stubborn to admit it.

    • David Appell says:

      Mike Flynn says:
      “I just placed a cake in my oven. The air contains around 400 ppm CO2, I believe. I left the cake for about 15 minutes. The temperature of the cake seemed quite unchanged.”

      Tim is right, MF — you really don’t have a clue.

      Your oven is full of air, before and after you opened it to put the cake in. Did the amount of CO2 in the air in your oven change? Did the temperature in your oven change? No? Why not?

      (Sigh)

  50. barry says:

    Bart, I found a graph of CO2 acceleration in 5-year averages for the ML record.

    http://tinyurl.com/l2yxnww

    It shows that CO2 acceleration increased after 1998, contrary to what you said should happen. You said a lowering of the rate of global temp rise would reduce CO2 acceleration.

    Apparently this hasn’t happened. It would appear CO2 – rate or acceleration – is not determined by global temperatures over the long term, only short-term accel fluctuations.

    • Bart says:

      It doesn’t show that at all. It shows the leveling off of rate at the turn of the millennium, and then an uptick due to the El Nino just past. The data are heavily smoothed, so the transitions are not observable.

    • barry says:

      Disagree. The 5-year averaged rates after the turn of the century are higher than before 1998.

      Here’s a moving 5-year average to 2011 – no contamination from 2016 el Nino.

      http://www.woodfortrees.org/plot/esrl-co2/to:2011/derivative/mean:60

      The rate is higher after 1998. Acceleration looks pretty constant to me, with monthly fluctuations in the acceleration rate influenced by temperature still observable.

      Don’t like smoothing? We’ll go back to the original. Recent el Nino excised.

      http://www.woodfortrees.org/plot/esrl-co2/derivative/mean:12/to:2015

      The rate is generally higher after 1998.

      A few days ago I averaged the annual acceleration values pre and post 1998. Excluded data after Dec 2014. The post 1998 value was higher. No surprise. You can see that with your eyeballs in the graph.

      The rate of CO2 rise is higher after 1998 than before. The slowdown in temps didn’t change that.

      Any way I dice it, there is no statistical evidence CO2 acceleration slowed after 1998.

      http://www.woodfortrees.org/plot/esrl-co2/derivative/mean:12/to:2015/plot/esrl-co2/to:2015/derivative/trend

    • barry says:

      Take two long-term periods before and after 1998. Excise large swings from the beginning and end of the periods so that the results are not affected by ENSO events near the end points. This is what you get.

      http://tinyurl.com/jwaxjq5

      Now forget that these are trend lines. We could just do an average and look at the results as flat lines for the periods. The result would be the same.

      The rate of CO2 accumulation is higher in the later period. Rate has accelerated relative to pre 1998.

      But you are arguing the rate of acceleration has slowed since 1998: the rate of the rate of the rate is less post 1998.

      I point back to the graph above, but you say the trend lines are not appropriate, even though you said a few days ago that a linear regression trend line represents the overall acceleration (you said this when I posted a graph of the CO2 first difference since 1979 with trend line.

      You make your claims with eyeball and draw-a-line-with-a-ruler method, saying this is sufficient.

      But you also said the data is noisy and prone to uncertainty as a result, avowing that the technique to get quantitative trend and uncertainty estimates is complex.

      I don’t get any consistency in your argumentation on acceleration trends, let alone receive any quantified corroboration for them.

      I’m trying new ways to address the estimates. You won’t progress your argument or do any work to substantiate.

      We can’t move forward without you doing more. It’s not enough to continually assert your view without statistical analysis and to rubbish any attempt to subject your view to it.

      Your view on the above is unverified. It’s been clear for a while that you are never going to go any further than that. I suspect it’s because your view (lower acceleration after 1998 and statistical validity of same) will be rejected if you actually test it, and you probably suspect or know that already.

      • Bart says:

        “The 5-year averaged rates after the turn of the century are higher than before 1998.”

        Of course they are. So are the temperatures. I really don’t think you grok the rate of change relationship.

        “The rate of CO2 rise is higher after 1998 than before. The slowdown in temps didnt change that.”

        No, it isn’t. Yes, it did. You are very confused.

        “Excise large swings from the beginning and end of the periods so that the results are not affected by ENSO events near the end points.”

        That only excises the positive phase. Now, you are keying off the very significant La Nina that followed the 1998 El Nino.

        You can’t do it this way. You are making calculations based on noise and extraneous cycles. Just look at the plot. The curves lie practically right on top of one another. Get your head out of the trees, and look at the forest.

      • barry says:

        Yes, I grok the difference between rate of change and rate of rate of change. The latter is acceleration.

        Now, you are keying off the very significant La Nina that followed the 1998 El Nino.

        The time-period shortens. I think we are seeing you devolve to the short-term correlation, because the long term doesn’t suit your hypothesis.

        Acceleration (rate of rate) is essentially zero from 1975 to 1997. It is not for the period 2002 to 2015 (no la Nina now).

        The first-difference data is noisy. Statistical uncertainty caveats positive conclusions. You bring it up to argue against me, but omit it when advancing your perspective.

        You won’t do the work on statistical uncertainty necessary to corroborate your view. We both know why.

      • barry says:

        It’s because you know you’ll find that the acceleration changes you espouse are not statistically significant. And then you’ll have to eat your own criticisms of what I’ve attempted.

        That’s why you insist on “qualitative” methods. Actual statistical analysis would undo your claims.

  51. Tim Folkerts says:

    A brief overview…

    Yes, CO2 helps warm the surface of the earth. But this warming effect — the radiative green house effect — is only effective in specific circumstances. Those circumstances include …

    1) a warm object (like the earth).
    2) a source of thermal energy to the surface from other object (like sunlight from the sun).
    3) a low-temperature sink for thermal IR from the surface (like 3K space).
    4) some material between the warm surface of the object and the low-temperature sink that can absorb/emit significant amounts of IR (like CO2 around earth).

    There are a few more details, but that pretty much covers things. So a CO2-filled oven doesn’t fit the requirements. Nor does a CO2-fill room. Nor does a thermos with CO2 between the two walls. (However, a real greenhouse does!) Unless you are discussing a situation with those features, you are not discussing the radiative greenhouse effect.

    • Bryan says:

      Tim F says

      Nor does a CO2-fill room. Nor does a thermos with CO2 between the two walls. (However, a real greenhouse does!) Unless you are discussing a situation with those features, you are not discussing the radiative greenhouse effect.

      There is almost no radiative enhancement for a real greenhouse.
      Read this paper to find how small (if any) the radiative enhancement actually is in practice

      Basically the project was to find if it made any sense to add Infra Red absorbers to polyethylene plastic for use in agricultural plastic greenhouses.
      Polyethylene is IR transparent like the Rocksalt used in Woods Experiment.
      The addition of IR absorbers to the plastic made it equivalent to glass
      The results of the study show that( Page2 )
      IR blocking films may occasionally raise night temperatures (by less than 1.5C) the trend does not seem to be consistent over time
      http://www.hort.cornell.edu/hightunnel/about/research/general/penn_state_plastic_study.pdf

      • Bryan says:

        Sorry Tim the paper has now been made unavailable.

        I wonder why?
        Perhaps it was unhelpful to the warmist cause?

        This link shows how readily available is was until recently.

        I had referenced it several times.
        This link proves my point

        hightunnel/about/research/general/penn_state_plastic_study.pdf

        The paper showed that the difference of internal temperature within the polytunnels was very small.
        Sometimes the pure polyethylene produced higher temperatures than the IR enhanced polyethylene
        Sometimes the pure polyethylene produced lower temperatures than the IR enhanced polyethylene .
        But the difference in each case was very small

        • Kristian says:

          Bryan,

          Another empirical study (from the real world) worth reading is this one from 1989 showing what an incredibly poor insulator CO2 is, and how convection will effortlessly negate all potential radiative effects on heat transfer through an air column:
          http://gaia.lbl.gov/btech/papers/29389.pdf
          “The Effects of Infrared Absorbing Gasses on Window Heat Transfer: A Comparison of Theory and Experiment.”

          I’ve discussed it with Folkerts before, so he should know about it.

          • Tim Folkerts says:

            Kristian, Yes, I know that about CO2 in windows. That result is perfectly reasonable (as confirmed by their pretty good match between theory and experiment). But is it not really relevant here. A window with CO2 between the panes is VERY different from the earth. Some key differences include …

            1) Even pure CO2 in the short space between the panes will not absorb a great deal of thermal IR.
            2) Convection and conduction can occur between the source (inner warm pane) and sink (outer cold pane) for a window. Convection and conduction can NOT occur between the source (earth’s surface) and sink (outer space) for a earth.
            3) Temperature differences between panes are fairly small (maybe 290 K vs 260 K) between the two surfaces, vs larges difference between surface and space (maybe 280 K vs 3 K).

            (The window would actually be a better analogy for transfers WITHIN the atmosphere. The temperature gradient within the window is not really affected by GHGs. The temperature gradient within the atmosphere is also not really affected by radiation (it is set primarily by the adiabatic lapse rate). Not a great analogy, but better.)

          • Kristian says:

            Tim Folkerts says, April 8, 2017 at 2:32 PM:

            A window with CO2 between the panes is VERY different from the earth.

            No, that would be all those static CO2 lab experiments purporting to show how CO2 causes warming, Tim …

            A horizontally positioned window heated from above – the first thing they tried – is indeed a very different situation from the real Earth one. And note, even here they pointed out that:
            “(…) the effect [on the heat transfer through the window] of the infrared properties of CO2 is unnoticeable (…)”

            As soon as you tilt the window up into an upright position, however, you’re basically opening up for convective effects to take hold. And this is getting much closer to the actual situation on Earth. Much more realistic, much more dynamic.

            Here’s what the study found:
            “(…) from Glaser’s results for vertical windows it can be seen that the convective transfer becomes significant at around 9 mm for SF6 [a gas much more IR-active than CO2], while there is practically no convective transfer through an air-filled window at gapwidths up to 20 mm under these conditions. In fact, air outperforms SF6 at gapwidths greater than 9 mm in a vertical window and the benefits from infrared absorp tion by SF6 have been negated by the magnitude of the convection.”

            And:
            “For larger vertical gap widths, where energy savings from the use of infrared absorbing gasses may begin to accrue, convection effects will begin to take effect and negate the positive impact of going to larger gap widths.”

            Now that’s a significant finding right there, Tim. THE significant finding, I would say.

            Convection and conduction can occur between the source (inner warm pane) and sink (outer cold pane) for a window. Convection and conduction can NOT occur between the source (earth’s surface) and sink (outer space) for a earth.

            Uhm, that’s true, Tim. But irrelevant. We’re talking about the SURFACE heat loss here, not the ToA one. It is the SURFACE heat loss that’s supposedly being reduced by the radiative properties of CO2 in the air above it. Because of an increase in “back radiation”, right? And the more CO2 in the air, the more it’s allegedly reduced.

            Only problem is, convection. Convection effortlessly negates any potential radiative effects on the surface heat loss (the heat transfer away from the surface) at air column thicknesses beyond a couple of centimetres. I quote again:
            “For larger vertical gap widths, where energy savings from the use of infrared absorbing gasses may begin to accrue, convection effects will begin to take effect and negate the positive impact of going to larger gap widths.”

            And that’s over a few centimetres, Tim. Imagine what convection will do with an entire boundary layer at its disposal, or even a full tropospheric column. What happens to the sfc Q, you think? Stays at the bottom? Trapped? Blocked from escaping?

            You’re speculating about a final net change in real temperatures based on theoretical radiative effects seen in isolation, assuming all other mechanisms will simply stay constant, yet offer NO empirical evidence from the real Earth system to back these speculations up.

            Take note, I’m talking about the idea of an “enhanced GHE” here, not the “GHE” itself, which is a (slightly) different matter.

            Temperature differences between panes are fairly small (maybe 290 K vs 260 K) between the two surfaces, vs larges difference between surface and space (maybe 280 K vs 3 K).

            Why do you keep talking about surface and space. The temp gradients through these windows are MUCH larger than between the surface and the air directly on top of it, and also much larger than the general tropospheric temperature gradient.

            The window would actually be a better analogy for transfers WITHIN the atmosphere.

            Exactly. And that’s precisely what we’re talking about here.

            The temperature gradient within the atmosphere is also not really affected by radiation (it is set primarily by the adiabatic lapse rate).

            The environmental lapse rate (the tropospheric temperature gradient) is very much affected by radiation, Tim. And I think you know that. It settles at the balance point between the large-scale convective/advective heat transfers occurring within the tropospheric column on the one hand and the radiative surface heating by the Sun, in turn leading to heating by the surface of the lowermost part of the troposphere, plus the radiative cooling of the troposphere to space, on the other.

            The adiabatic lapse rate strictly applies to rising and falling ‘parcels’ of air only.

          • Tim Folkerts says:

            Kristian, I would love to actually get together and talk with you. You have a lot of good knowledge, but the limitations of typing back and forth (on someone else’s blog) just make this too cumbersome to really accomplish much. I fear we are talking too much past each other. (For example, you say you are focusing on the *enhanced* GHE from more CO2, but many people are saying that the whole idea of a GHE is false).

            Some basics can be presented — I try to stick to the underlying physics. But hashing out the details and feedbacks is basically cutting-edge research, which will not be accomplished here.

          • Kristian says:

            Tim Folkerts says, April 8, 2017 at 5:07 PM:

            Some basics can be presented I try to stick to the underlying physics. But hashing out the details and feedbacks is basically cutting-edge research, which will not be accomplished here.

            Ok, so let me just ask you this: Do you think that increasing the atmospheric concentration of CO2 will necessarily and inescapably lead to higher global temperatures (at all altitude-specific levels from the surface to the tropopause) at some “new equilibrium”? That there MUST be some degree of net warming from a simple rise in CO2_atm (assuming the solar input stays unchanged), no matter what?

            And if so, on what exactly are you basing this opinion? On mere radiative theory? Or on actual empirical observations from the real Earth system?

            I’m very interested to know …

          • David Appell says:

            Kristian: it’s based on both theory and observations.

            For example:

            https://www.giss.nasa.gov/research/briefs/schmidt_05/curve_s.gif

          • Tim Folkerts says:

            Kristian says: “Do you think that increasing the atmospheric concentration of CO2 will necessarily and inescapably lead to higher global temperatures … no matter what?”

            No. Otherwise every year would be warmer than the last. There are all sorts of variations on timescales ranging from days (eg weather) to years (eg el nino) to thousands of years (eg Milankovitch cycles) to millions of years (eg continental drift) that all impact climate.

            But I do think that adding more CO2 *tends* to warm the earth by impacting the escape of IR from the earth. So if we expand from your “assuming the solar input stays unchanged” to “assuming ALL other variables remain unchanged”, then more CO2 will make the earth warmer. So for example, MODTRAN (climatemodels. uchicago. edu/ modtran/)can calculate the IR escaping to space as you change CO2 and keep all other variables constant. More CO2 –> less IR escaping –> warmer earth.

            The trillion dollar question is how that relatively small effect at the top of the atmosphere “trickles down” to the surface. How would the lapse rate change? How would evaporation and cloud cover change? I don’t even try to answer THOSE questions.

          • Kristian says:

            Tim Folkerts says, April 9, 2017 at 11:42 AM:

            But I do think that adding more CO2 *tends* to warm the earth by impacting the escape of IR from the earth. So if we expand from your “assuming the solar input stays unchanged” to “assuming ALL other variables remain unchanged”, then more CO2 will make the earth warmer.

            Agreed.

            However, this is not what we see in the real world. There is NO empirical evidence anywhere from the real Earth system showing how an increase in CO2_atm causes T to rise. And there is NO empirical evidence whatsoever to suggest that an “enhanced GHE” is responsible for (or has even contributed to) ‘global warming’ over the last 3-5 decades.

          • Gordon Robertson says:

            Tin Folkerts…”But I do think that adding more CO2 *tends* to warm the earth by impacting the escape of IR from the earth”.

            What does absorbing a tiny amount of IR have to do with the surface cooling? When the surface emits the IR it has already cooled. You can’t change that by absorbing some of the emitted IR.

            The only thing that will warm the surface is more solar energy.

          • Ball4 says:

            “The only thing that will warm the surface is more solar energy.”

            No Gordon, Dr. Spencer demonstrated by test that added cloud radiation at night can also warm surface water as his result was: a higher temperature.

      • Tim Folkerts says:

        Bryan, yes, the “radiative greenhouse effect” is only a small part of a warming real greenhouse. That is one reason why the name is a bit unfortunate. That doesn’t stop the effect from being important for the earth.

    • Gordon Robertson says:

      Tim…”Nor does a thermos with CO2 between the two walls. (However, a real greenhouse does!)”

      Tim…you have not explained what the 0.04% of CO2 in a real greenhouse contributes to heating the greenhouse. Why should CO2 or even water vapour have anything to do with heating a real greenhouse?

      Circa 1909, Woods did an experiment to prove real greenhouses warm due to a lack of convection. My friend has a real greenhouse in which the temperature is controlled by an automated system that open windows on the roof of the greenhouse. The automated windows are obviously controlling the convection, hence the cooling.

      I don’t think CO2 has anything to do with either real greenhouse warming or atmospheric warming. I have supplied an analogy in previous posts using the ideal gas equation and partial pressures to show that atmospheric temperature is directly proportional to the partial pressures of gases in the atmosphere while holding the volume constant.

      I’ve had no responses to my calculations other than ad homs. Perhaps you’d care to comment. Basically, I am claiming that the major proportion of warming in the atmosphere is due to nitrogen and oxygen, based on the fact they make up over 99% of the mass of the atmosphere. Their partial pressures account for about 96% of the atmosphere.

      The partial pressure of ALL CO2, at 0.04% is negligible and the partial pressure of ACO2 I estimated at about 0.01 C over a century.

      Lindzen, who is light years ahead of me, did a similar calculation based on convective heat flow and suggested there is an upper bounds of CO2 warming over a century around 0.4C.

      • Tim Folkerts says:

        Gordon asks: “Timyou have not explained what the 0.04% of CO2 in a real greenhouse contributes to heating the greenhouse. Why should CO2 or even water vapour have anything to do with heating a real greenhouse?”

        You misunderstand! I said that real greenhouses will have warming due to a radiative greenhouse effect — but not that CO2 was the cause. For greenhouses, it is the glass that serves the purpose of blocking IR between a warm surface (inside the greenhouse) and cool surroundings (the atmosphere above).

        (and before anyone complains … for a real greenhouse this is not the primary cause of the warming. blocking convection is the main reason greenhouses are warm.)

        • Ball4 says:

          Consider the physics of a farmer’s greenhouse with thin walls, with standard lab glass, situated in very windy conditions.

          Now consider the physics of a farmer’s greenhouse with very thick, high R insulated walls, low E glass, situated in very calm conditions.

          Might learn something about their physics.

        • Gordon Robertson says:

          Tim…”For greenhouses, it is the glass that serves the purpose of blocking IR between a warm surface (inside the greenhouse) and cool surroundings (the atmosphere above)”.

          That was disproved by Woods in 1909. He did an experiment using real glass and a sheet of rock salt over boxes. Rock salt freely passes IR. After heating under the Sun there was no difference in the temperatures. Woods concluded that real greenhouses warm due to a lack of convection.

          • Ball4 says:

            “That was disproved by Woods in 1909.”

            R.W. Wood Gordon. Actually it was confirmed by Wood in 1909 when he found a 10C difference in T with the rock salt covered box. Only when Wood put a glass cover the rock salt plate was there no difference with the glass covered box.

  52. JDHuffman says:

    There are two 800# gorillas in the room.

    One gorilla, mentioned upthread, was the fact that CO2 levels are continuing to increase, but there is no corresponding increase in satellite temps, recognizable in the natural variability.

    This single fact destroys the CO2/AGW theory. As Dr. Christy has shown, NONE of the climate models predicted such unrecognizable warming.

    Second, the UAH troposphere temps are dropping back from the last El Nino rise. During an El Nino, the Pacific Ocean releases enormous amounts of heat energy. The heat energy moves through the atmosphere, until it is finally emitted to space.

    Again, this single fact destroys the CO2/AGW theory. According to the theory, the atmosphere traps heat. But, as we see, the atmosphere does not trap heat, it moves heat energy to space.

    Gorilla 1: “There is no meaningful warming!”

    Gorilla 2: “Even if there were some warming, the atmosphere easily transfers heat energy to space.”

    • Tim Folkerts says:

      “Again, this single fact destroys the CO2/AGW theory. According to the theory, the atmosphere traps heat. But, as we see, the atmosphere does not trap heat, it moves heat energy to space.”
      No, this destroys nothing. According to theory, an atmosphere with MORE CO2 traps MORE heat (to reuse the same slightly sloppy wording) than an atmosphere with less CO2. But both scenarios move energy through from the surface and eventually off to space.

      • Gordon Robertson says:

        Tim Folkerts…”According to theory, an atmosphere with MORE CO2 traps MORE heat …”

        Tim….with all due respect, CO2 does not trap heat. To claim it does is to confuse the infrared energy transmitted by atoms with the kinetic energy of atoms, which is heat.

        Electromagnetic energy exists in the universe only because atoms transmit it as they cool. As electrons in the shells surrounding atoms (to use the Bohr model) move between different energy levels they transmit EM as they drop to lower levels or absorb it as they move to a higher energy levels.

        Transmitted EM is not heat, the latter being a property of atoms while the former is a product of atoms.

        In order for CO2 to trap heat, it would have to trap atoms or molecules. Convection is the process of transporting and transferring heat by mass. Heat being a property of the atoms, it is transported/transferred with the atoms. That is not taking place with radiative transfer, the mass, as represented by the surface transmitting the EM, remains intact. Therefore the heat goes nowhere.

        Radiative heat transfer is a pseudo-heat transfer in that the heat is transferred as a net process, not physically. Radiative heat transfer means an emitting body is reduced in kinetic energy, aka heat, while a body absorbing the emitted EM increases it’s KE, hence warming.

        It’s like a radio signal. A person speaking into a microphone at one station has his/her voice audio converted to an electrical signal. The electrical signal is amplified, modulated onto a high frequency RF carrier signal,and applied to an antenna. As the HF RF runs up and down the antenna it is converted to EM and sent off into space.

        At a distant station, another antenna receives the transmitted EM and converts it to an alternating electrical signal. The signal is demodulated to audio and amplified. It can be run through speakers where the voice of the person at the sending station can be heard.

        The person sending the signal goes nowhere but he/she has communicated with a person at a distant station using EM. The only difference between the two scenarios is that audio is transferred in one while in the other heat is transferred.

        I call that a pseudo-transfer because there is no physical exchange between the stations of any kind other than by EM. The receiving station supplies it’s own power to run it’s receiver and it’s the same with a receiving station with heat transfer. The receiving station supplies the atoms to be heated by the absorbed EM.

        There is no physical transfer of heat in radiative transfer, heat does not flow through the atmospheric space between an emitting body and an absorbing body. There is an EM flow from a transmitting body to an absorbing body but EM is not thermal energy. EM has no mass and it cannot possible transfer heat physically.

        The atmosphere is a gaseous mass and it can transfer heat atom to atom by collison. However, radiative transfer does not occur with nitrogen and oxygen, which make up 99%+ of the atmosphere. Therefore, heat transfer in the atmosphere has to be largely by conduction and convection involving mainly N2 and O2.

        • Mike Flynn says:

          Gordon,

          I hope you don’t mind if I add a little detail.

          With great respect, your explanation may inadvertently reinforce a misconception widely held by supporters of the mythical GHE.

          I find no reason to disagree with Richard Feynman who said that all physical processes apart from gravity and nuclear processes can be explained in line with the following :

          1. An electron moves from one place and time to another place and time.

          2. A photon moves from one place and time to another place and time.

          3. An electron emits and absorbs a photon.

          Note that there is no requirement that an electron must emit a photon of identical energy to that which it absorbed. Such a thing would be nonsensical in general, as after the exchange, the atom itself would be unchanged in all respects, having emitted precisely as much energy as it absorbed. There would be no way of establishing the existence of either the photon or electron, if you think about it. Measurement would be impossible, if your measuring instrument was completely unchanged after interacting with what it was trying to measure!

          In fact, there may merely be an effective change of momentum of the atom which contains the electron in question, accompanied by a change in the momentum of the interacting photon. Hence temperature rises if a gas is compressed, or heated by friction. As you say, heat cannot be trapped. It is impossible to stop electrons emitting photons of progressively less energy as the matter in question heads remorselessly towards absolute zero in the absence of an external heat source.

          Anyway, considering that the leading lights of the Warmish movement include a self proclaimed distinguished professor, who apparently didn’t have the wit to know whether he had received a Nobel Peace Prize or not, an undistinguished mathematician who seemed to think that a probability of 0.38 meant certainty (as in “Hottest year EVAH!”, and a retired anti-coal activist who thinks that climate change will result in storms which will pluck giant boulders from the sea bed, and rain them down on our unbelieving heads!

          Strange but true.

          People like Tim Folkerts say –

          “According to theory, an atmosphere with MORE CO2 traps MORE heat (to reuse the same slightly sloppy wording) than an atmosphere with less CO2.”

          He can’t actually provide a copy of this non-existent theory, although he can, no doubt, provide endless links to speculations and unproven assertions by the usual crowd of Warmists.

          The GHE doesn’t seem to apply unless direct sunlight is present – except in the arid tropical deserts where less, not more, GHG results in the highest surface temperatures ever recorded.

          I haven’t seen a copy of this alleged CO2/AGW theory (Tim’s wording), and I doubt anyone else has, either. The GHE is nonsense. Obviously, some not terribly bright person misunderstood what a greenhouse is for, and how it works. A catchy name, but quite nonsensical.

          Luckily, it seems that even politicians – who are not generally known for their intellectual objectivity – are facing facts at last.

          Cheers.

          • barry says:

            This discussion [atmospheric GH effect] is not happening between politicians. And if you’re talking about the US government, I see little interest in a decent review of facts there, only a highly selective, little understood collection of talking points. They provide news paper articles as sources. Where they cite research, the researchers tend to point out that their work has been distorted.

            IOW, a politician is a terrible source for understanding the science. By definition, their expertise is the political angle. You can include Al Gore in that lot, even if he did study science decades ago.

            In any case, no US politician I ever read rejects the ‘greenhouse effect’ of atmospheric gases that strongly absorb IR. They’re not in line with the *facts* as you seem to see them.

        • ren says:

          Forecast jet stream indicates that winter in Canada will not forgive.
          http://virga.sfsu.edu/gif/17040900_jetstream_h72.gif

        • David Appell says:

          GR says:
          “EM has no mass and it cannot possible transfer heat physically.”

          EM has energy. EM is the movement of energy from one point to another. This is commonly called “heat.”

          Your definition of “heat,” applying only to the movement of atoms, is just a different colloquial use, but with kinetic energy instead of EM energy.

          You are hung up on semantics, with no gain in physical understanding.

          • Gordon Robertson says:

            DA…”EM has energy. EM is the movement of energy from one point to another. This is commonly called heat.”

            EM ‘IS’ energy. It’s called electromagnetic energy. It’s comprised of an electric field and a transverse magnetic field. I have been studying it for decades in my studies of electronics and electricity.

            There is nothing in an electric field or a magnetic field that is remotely associated with heat. Heat is related to mass and the development of the Clausius theory of heat delves deeply into that.

            I don’t care what modernists call heat, the wiki articles on the Net are full of pseudo-science.

            The movement of energy from one one point to another is generally called kinetic energy but that is a generic term. Kinetic energy with machines is different than kinetic energy in a chemical reaction. With reference to atomic motion and the movement of electrons between atomic energy levels, that KE is called heat.

          • David Appell says:

            Gordon Robertson says:
            “There is nothing in an electric field or a magnetic field that is remotely associated with heat.”

            EM waves carry energy — right?

      • JDHuffman says:

        ‘But both scenarios move energy through from the surface and eventually off to space.’

        Tim, don’t let the facts confuse you. Since you realize that the atmosphere moves heat energy to space, rather than “trapping” it, the CO2/AGW theory is destroyed.

    • David Appell says:

      JDHuffman says:
      “One gorilla, mentioned upthread, was the fact that CO2 levels are continuing to increase, but there is no corresponding increase in satellite temps….”

      UAH LT v6.0 linear trend = +0.12 C/decade.

  53. ren says:

    The 11-year cycle in CR is delayed
    (from a month up to two years) with respect to the sunspots (Usoskin et al. 1998).
    The time profile of cosmic-ray flux as measured by a neutron monitor (NM) is shown
    in Fig. 4 (panel b) together with the sunspot numbers (panel a). Besides the inverse
    relation between them, some other features can also be noted. A 22-year cyclicity
    manifests itself in cosmic-ray modulation through the alteration of sharp and flat
    maxima in cosmic-ray data, originated from the charge-dependent drift mechanism.
    One may also note short-term fluctuations, which are not directly related to sunspot
    numbers but are driven by interplanetary transients caused by solar eruptive events,
    e.g., flares or CMEs. An interesting feature is related to the recent decade. The CR flux
    in 2009 was the highest ever recorded by NMs (Moraal and Stoker 2010), as caused
    by the favorable heliospheric conditions (unusually weak heliospheric magnetic field
    and the flat heliospheric current sheet) (McDonald et al. 2010). On the other hand,
    the sunspot minimum was comparable to other minima. The level of CR modulation
    during the cycle 24 was moderate, much more shallow than for the previous cycles,
    reflecting the weak solar cycle 24. For the previous 50 years of high and roughly-stable
    solar activity, no trends have been observed in CR data; however, as will be discussed
    later, the overall level of CR has changed significantly on the centurial-millennial
    timescales.
    When an energetic CR particle enters the atmosphere, it first moves straight in the
    upper layers, suffering mostly from ionization energy losses that lead to the ionization
    of the ambient rarefied air and gradual deceleration of the particles. However, after
    traversing some amount of matter (the nuclear interaction mean-free path is on the
    order of 100 g/cm2 for a proton in the air) the CR particle may collide with a nucleus in
    the atmosphere, producing a number of secondaries. These secondaries have their own
    fate in the atmosphere, in particular they may suffer further collisions and interactions
    forming an atmospheric cascade (e.g., Dorman 2004). Because of the thickness of the
    Earths atmosphere (1033 g/cm2 at sea level) the number of subsequent interactions can
    be large, leading to a fully-developed cascade (also called an air shower) consisting of
    secondary rather than primary particles. A schematic view of the atmospheric cascade
    is shown in Fig. 6. Three main components can be separated in the cascade:
    The hadronic nucleonic component is formed by the products of nuclear collisions
    of primary cosmic rays and their secondaries with the atmospheric nuclei,
    and consists mostly of superthermal protons and neutrons.
    The soft or electromagnetic component consists of electrons, positrons and
    photons.
    The hard or muon component consists mostly of muons; pions are short lived
    and decay almost immediately upon production, feeding muons and the soft
    component.
    The development of the cascade depends mostly on the amount of matter traversed
    and is usually linked to residual atmospheric depth, which is very close to the static
    barometric pressure, rather than to the actual altitude, that may vary depending on the
    exact atmospheric density profile.
    http://jultika.oulu.fi/files/nbnfi-fe201703061963.pdf

    • ren says:

      In general, the following main features are observed in the long-term evolution of
      solar magnetic activity.
      Solar activity is dominated by the 11-year Schwabe cycle on an interannual
      timescale. Some additional longer characteristic times can be found, including
      the Gleissberg secular cycle, de Vries/Suess cycle, and a quasi-cycle of 2000
      2400 years (Hallstatt cycle). However, all these longer cycles are intermittent and
      cannot be regarded as strict phase-locked periodicities.
      One of the main features of long-term solar activity is that it contains an essential
      chaotic/ stochastic component, which leads to irregular variations and makes solaractivity
      predictions impossible for a scale exceeding one solar cycle.
      The sun spends about 70% of its time at moderate magnetic activity levels, about
      1520% of its time in a grand minimum and about 1015% in a grand maximum.
      Grand minima are a typical but rare phenomena in solar behavior. They form a
      distinct mode of solar dynamo. Their occurrence appears not periodically, but
      rather as the result of a chaotic process within clusters separated by the 2000
      2500 years (around the lows of the Hallstatt cycle). Grand minima tend to be of
      two distinct types: short (Maunder-like) and longer (Sprer-like).
      The recent level of solar activity (after the 1940s) was very high, corresponding
      to a prolonged grand maximum, but it has ceased to the normal moderate level.
      Grand maxima are also rare and irregularly occurring events, though the exact rate
      of their occurrence is still a subject of debates.
      These observational features of the long-term behavior of solar activity have important
      implications, especially for the development of theoretical solar-dynamo models
      and for solar-terrestrial studies.

      • ren says:

        Sorry.
        The sun spends about 70% of its time at moderate magnetic activity levels, about 15-20% of its time in a grand minimum and about 10-15% in a grand maximum.

    • ren says:

      Ionization in the southern hemisphere is currently higher (90S-20S) than in the northern hemisphere. Depends on atmospheric pressure.
      http://sol.spacenvironment.net/raps_ops/current_files/index.html

  54. Mike Flynn says:

    Snape,

    All good. Thanks.

    The problem with claiming that the GHE is explainable by the insulating properties of GHGs is that it is literally impossible. As I’ve mentioned, both the hottest (and coldest) places on the surface have the least GHGs between them and the Sun. Normal radiation physics and quantum electrodynamics seem to be functioning as usual.

    No miraculous one way insulator exists. The concept of GHGs accumulating heat over time, resulting in the Earth becoming hotter day by day, year by year, and century by century, is as silly as it sounds. Hopefully, Governments will choose to fund useful scientific research, rather than climatological pseudoscience.

    And now, I must away. No doubt Nature will take its course.

    Cheers.

    • Snape says:

      Mike

      I like your observation about the hottest and coldest places having the least GHG’s. You’ve mentioned this before and I had go read about it – now I’ve mostly forgotten what I read.

      • Snape says:

        I just realized that my understanding of insulation had a big flaw. It’s commonly explained that insulation works by slowing the rate of heat loss or gain, and that’s of course true, but this effect is ONLY TEMPORARY. Not sure why it’s taken so long for me to figure this out…maybe I didn’t pay attention in high school physics!

        • Snape says:

          Maybe I still don’t really understand how it works.

          • Snape says:

            Anyway, I think insulation INITIALLY reduces the rate of heat loss. After that, the rate returns to normal. It’s the TRAPPED HEAT that, for example, keeps us warm when we wear a coat.

          • Snape says:

            This would be true of GHG’s in our atmosphere. If levels weren’t increasing, they wouldn’t be slowing the rate of heat loss, they would simply act as a HEAT TRAP.

            I’ve never read this anywhere, but, like I said earlier, maybe I just didn’t pay attention in high school physics.

          • Snape says:

            A coat traps heat next to your body. It doesn’t slow the rate of heat loss (except initially).

            Is this common knowledge and I’ve just been clueless?

          • Ball4 says:

            You’ve been evolving (Snape term).

          • Snape says:

            Ball4

            Just to be clear, my new understanding of insulation (maybe not new to anybody else) does not in any way change my position on AGW.

          • Ball4 says:

            They may also evolve.

          • Snape says:

            Ball4

            Our discussion of how an insulated room effects an attic makes me think you don’t know what I’m talking about.

          • Snape says:

            Ball4

            I take that back. That was a pretty confusing scenario….I’m still confused.

            My recent idea is much more straightforward.

          • Ball4 says:

            Perhaps. Show/cite me a test of what you are talking about.

          • Snape says:

            Ball4

            I haven’t seen anything to support my views, just thinking.

            Here’s something similar:

            Imagine a small, constant stream of water coming out of your faucet. Then place a sponge under it.
            As the sponge absorbs the water, the “outflow” will initially be much less or nonexistent. Less water will be reaching the drain. As the sponge becomes saturated, the outflow rate will return to normal. The sponge will, however, will always continue to trap water.

            So the sponge initially reduced the rate of flow down the drain, but once saturated, the rate returned to normal.

          • Snape says:

            So, in my view, the atmosphere is like a giant heat-filled sponge that keeps the planet warm, but it doesn’t slow the rate of heat loss.

            However, start adding GHG’s….?

          • Tim Folkerts says:

            Snape, I think you have some very good points here. Here are two (relatively minor) additional thoughts on your analogies.

            1) Humans are different from planets in that humans have a thermostat that tries to maintain a specific temperature (37C). Putting on a coat on a cold day DOES decrease the heat generated by the person. You will indeed burn fewer calories when you put on a coat (rather than having your body warm up from 37C to say 40 C). So this is NOT a particularly good analogy for planets and their energy balance.

            2) I have used a slightly different sink analogy — a bucket with several small holes near the bottom. When you turn on the faucet, the water will collect in the bucket and the level will rise until the inflow = outflow. If you plug a few of the holes, the water will rise further until the pressure increases and the flows again balance. In the analogy, water = thermal energy; depth (pressure) = temperature.

            The sponge and bucket serve the same basic purpose. The bucket allows a little more flexibility.

          • Snape says:

            Tim

            I appreciate the vote of confidence!

            Regarding your first point, I was thinking about the same thing this morning. Yeah, the human body is an irregular heat source, which really complicates the analogy. Thinking it through, I found that it still works, but it gave me a headache! (I had to picture a lizard instead of a person because my imaginary guy kept dying of hypothermia).

            I also considered insulation in a house, but a furnace is constantly turning on and off, which again complicates the analogy.

            The bucket with holes is really good.

          • Ball4 says:

            Now we have the sponge analogy. All…ALL analogies are imperfect, nonzero possibility all this brouhaha started over MSM (et.al.) using analogies. Go back to the actual stuff Snape. Let clothiers worry about the jacket market.

          • Snape says:

            Ball4

            Who brought up the hypothetical of raising Tyndall’s lab to 800 C. in order to prove I was wrong?

            I have an analogy that demonstrates how dumb it is for people to argue there was no “pause”. You might like that one. (Saving it for next month).

          • Snape says:

            Ball4

            I didn’t mean to imply my analogies were perfect.

            Show me the research that proves there’s no such thing as a perfect analagy! 😊

          • Ball4 says:

            Using Tyndall’s room was Snape’s analogy, I merely added a number.

          • Ball4 says:

            Start by assuming that the opposite proposition is true, there is a perfect analogy, and then show that such an assumption always leads to a contradiction.

          • Snape says:

            Ball4

            I don’t know if there is or isn’t a perfect analogy. Who cares? You, on the other hand, claimed there isn’t, but didn’t explain why you think this.

            No big deal. I make claims without evidence all the time. I do however, try really hard to explain the logic behind my points of view.

          • Ball4 says:

            I’ve just never seen a perfect analogy, the original set up is always the one & only. There are some that come close to be useful like water current and electrical current along with similar equations showing up in different fields of science but always go with the original when trying to make a point.

          • Snape says:

            Ball4

            “The boy’s room was like a disaster zone.”

            Is the analogy perfect? Far from it. Does it make clear the boy’s room was really messy? Perfectly.

    • David Appell says:

      Mike Flynn says:
      “The concept of GHGs accumulating heat over time, resulting in the Earth becoming hotter day by day, year by year, and century by century, is as silly as it sounds.”

      What’s not silly is that you constantly misunderstand basic physics.

      And clearly have no interest in learning it.

  55. martinitony says:

    A shadow can cause cooling.
    The Sun is not the Earth’s only source of warmth and energy.
    The Universe is pretty big.
    If there were only two planets in the universe, one near the edge and the other near the middle, which would have a warmer climate given all other atmospheric conditions were the same?
    Do you think its shadows or lack of shadows could affect the climate on Earth?

  56. Norman says:

    Mike Flynn

    I do hope you are done posting exposing your ignorance and now have gone to look at information and become educated (a distant hope!).

    If not YOU: “Putting on a coat didnt seem to make any difference to my temperature it seems to remain at around 37C. Much the same as yours, or any other reasonably healthy human being.

    Does your temperature increase when you put on an overcoat? How high does it get?”

    Your ignorance is truly outside the box of people who know nothing but need to talk about it. Not only do you completely lack any understanding of the science of heat transfer, now you show complete lack of knowledge of human biology. Wow! How uniformed are you?? Will you keep showing us or maybe learn to read again and get off the computer.

    The human body regulates its internal core temperature. If the outside is cold it will increase metabolism to try and keep the core at the constant temperature of 98.6 F (37 C)which is ideal for the chemical reactions that keep us alive.

    If it is hot outside the body moves blood circulation to the outer perimeter and induces sweat glands to activate to cool by evaporation.

    So with clothes. If you go out naked in subzero conditions the amount of heat lost by your surface will overwhelm your body’s ability to maintain core temperature as it can only increase metabolism so much. Your core temperature will drop and you will suffer hypothermia and if not treated you will die. When you put a coat on in cold conditions or insulated boots, it greatly slows the loss of energy from your surface and allows your internal metabolism to keep the core at 98.6 F and you do not freeze to death.

    I really should not have to explain this to an adult. I think it is really good that you post such totally ignorant and ridiculous posts, even the scientifically illiterate that may read the comments will reject your posts. The scientific literate already know you know nothing about science and post garbage every time, I just worry about those who only know a little science and your preaching may convert them, thankfully you are so uniformed your preaching will not even reach that audience. Praise the Lord! Science can remain an honest quest for the truth about the natural world!

    • Ball4 says:

      Mike Flynn’s comments are intentionally for entertainment purposes only. Some are not even wrong.

      • Kristian says:

        A perfect description of your own comments, troll.

        • Snape says:

          Why are the differences between Co2 and other insulators almost never discussed? Clothing, blankets, the fiberglass insulation in our homes, the glass in a greenhouse…..these all insulate by trapping warm air.

          This is clearly not the case with Co2.

          • Ball4 says:

            CO2 in a planetary atm. is an IR active gas which when combined with total atm. pressure increases the opacity of the total column of air looking up from the surface. These physics are different from that of a jacket worn in the NH winter but the effects are similar so the MSM chooses to describe the effect in terms the avg. reader can understand.

            You should too, then when you accomplish more study and feel ready to tackle optics theory go ahead move up to the actual atm. physics.

          • Snape says:

            Ball4

            I wouldn’t know if your description of Co2 is accurate or not. You’re probably right, though, about the science be dumbed down for public consumption.

            I enjoy learning, but I like trying to figure things out on my own more. This approach is fun, like brain teasers, but, yeah, I won’t be able to figure out anything very advanced.

            Sort of like trying to learn math without using a math book. You might figure out some basic stuff, but not much more.

          • Ball4 says:

            Take time read Tyndall 1861, he could not see the opacity increase with his eyes but the instrumentation measured it and he was astonished that his needle pegged with no observed change in the tube. He screwed in thermometers to be sure.

          • David Appell says:

            Ball4 says:
            “These physics are different from that of a jacket worn in the NH winter but the effects are similar so the MSM chooses to describe the effect in terms the avg. reader can understand.”

            Yes, but the term goes way back, at least to 1908:

            “The greenhouse theory and planetary temperatures,” Frank Very, Philosophical Magazine, 6, 16, 478 (1908).

          • David Appell says:

            Actually the term seems to go back to Fourier in 1827. This is from Arrhenius’s 1896 paper:

            “Fourier maintained that the atmosphere acts like the glass of a hothouse….”

            and he references Fourier’s work.

            Links here:

            http://www.davidappell.com/EarlyClimateScience.html

          • Ball4 says:

            Yes David, Fourier built a little box (charcoaled black inside) to act as a farmer’s greenhouse and ran crude tests on it, later authors were trying to improve. Tyndall 1861 is the first I know published on GHE in well instrumented tube, though like Stigler’s law tells us, he probably learned from earlier others to conduct & improve the Fourier concept testing rigorously.

            So how early did farmers start using greenhouses, anyone know?

          • David Appell says:

            Fourier’s deduction was about the atmosphere, not a box.

          • Ball4 says:

            Fourier built the box and tested it David. He inferred from the tests what his experimental results would mean for the atm.

  57. Norman says:

    Ball4

    Thanks for letting me know. I was not sure what the goal is. You do know that a vast amount of US citizens are illiterate when it comes to science and they may come or be linked to various climate blogs to try and sway opinions.

    Mike Flynn may be joking around but there will be lots of people that hear what he says and go “that makes sense, yeah, the scientists are fools and we know better!”

    When policy and science research are based upon public opinion and the issues become political and activist the science drowns in the ocean of ignorant thought and there is no way to change it with actual science thought as the people are not able to understand what you are saying (no background in the subject discussed).

    Already science suffers from politics. Researchers scramble for dollars and produce rapid shoddy work. The Truth suffers when those engaged in research must produce of perish! That is why I think there are so many research articles (and these appear in peer reviewed science journals) blaming Climate Change for all types of ills and problems, that is the direction of the Politics and the direction of the research money flow. The noise becomes so loud you can no longer look for the actual signal.

    Anyway thanks for you point of consideration. I hope you are correct about Mike Flynn. I do not think g*e*r*a*n was joking even though everything was hilarious to him. I see him on other blogs saying the same things he did here (like on CO2isLife blog). Makes me think he was not joking but actually thinks his view is sound science.

    • Snape says:

      Norman

      I mentioned this earlier, but some of Flynn’s comments make me think of Don Quixote. Are you familiar?

      • Ball4 says:

        I lost a longer comment in working off my phone, Norman and Snape can evolve works Ng with texts not blogs. Kristian is on right track using Zemansky but limits understanding of Zemansky energy flux by Kristian’s insistence on heat flux.

        • Norman says:

          Ball4

          Yes most thanks for you point.

          YOU: “Kristian is on right track using Zemansky but limits understanding of Zemansky energy flux by Kristians insistence on heat flux.”

          I do try to ignore the term heat but it does creep up. I have never stated the cooler atmosphere downwelling IR is a heat flux (unless it would exceed the upwelling IR flux, which it does on some rare occasions). I have only referred to this down flux as energy. It is valid for climate scientists to consider it an energy input into the surface as that is what it is in actuality. It is NOT a heat flux unless the energy is above the surface outgoing energy flux (then the downwelling IR will increase the internal energy of the surface that is considered a heat flux at that point).

          You have to consider both the solar flux and downelling flux as energy inputs into the surface. The molecules of the surface do not determine from where the energy comes from. A 15 micron IR photon from the atmosphere will still be absorbed by the surface molecules and converted into K.E. to be distributed among the molecules connected to it. I envision a surface to be like a bunch of balls connected by springs. If you disturb one part of the configuration the springs carry the disturbance throughout the configuration. So an IR photon is absorbed by a surface molecule and the molecule starts vibrating more which then causes the surrounding molecules to vibrate more and then they will emit an IR photon based upon the excitation and relaxation time and it can be a multiple of various wavelengths of IR but it will be a discrete amount based upon the energy of the emitted photon that carries the energy away from the surface.

          • David Appell says:

            Admittedly the word “heat” does get used colloquially, even by physicists, as a synonym for temperature, but strictly speaking “heat” is the transfer of energy.

            So properly one should say that a gas has an energy (and a temperature), not that it has heat.

            But radiation, like downwelling IR — energy in motion — is heat.

          • Kristian says:

            David Appell says, April 9, 2017 at 11:40 AM:

            (…) strictly speaking “heat” is the transfer of energy.

            Not THE transfer of energy, David. A transfer of energy.

            So properly one should say that a gas has an energy (and a temperature), not that it has heat.

            Bravo, David!

            But radiation, like downwelling IR – energy in motion – is heat.

            LOL! No, David. DWLWIR from a cool atmosphere to a warm surface of course isn’t heat.

            Why is this so hard!?

            Heat, Q, is the energy spontaneously transferred between two regions at different temperatures as a result of the difference in temperature. It ALWAYS flows from hot to cold only. It doesn’t matter if the energy is transferred by way of conduction, convection or radiation. In terms of radiation, the radiant heat is simply equal to the NET radiation, ‘net sw’ or ‘net lw’.

          • Ball4 says:

            “But radiation, like downwelling IR – energy in motion – is heat.”

            Another cue for Gordon now David is trying to pass off radiant energy as heat.

            David, radiation has no KE in its constituent particles (photons) or EM waves if you prefer. Check with your guru Al.

          • Ball4 says:

            Q, is the energy transferred between two bodies at different temperatures as a result of the difference in temperature. Q ALWAYS flows increasing universe entropy. It doesn’t matter if the energy is transferred by way of conduction, convection or radiation. In terms of radiation, the total radiant energy is simply equal to the NET vector sw plus lw radiation.

            Clearer physics now? I removed the mythology for Kristian.

          • David Appell says:

            Kristian says:
            “LOL! No, David. DWLWIR from a cool atmosphere to a warm surface of course isnt heat.”

            Radiation is energy.

            So DWLWIR is downward energy.

        • Norman says:

          David Appell

          I think “Heat” is only a subset of energy flow. A specific type of flow where the NET energy is from Hot to Cold. It is a NET flow after all flows are balanced out, so it would not just be an energy flow in of itself unless a warm object was by itself (then it would have positive heat flow and its internal energy would go down which is how you can determine heat flow if you know nothing else about the system).

          Heat flow can be positive or negative. If the external source is warmer than your object, the energy from the external source will warm your object and the heat flow from your object is negative.

          In a case I described above. If you have two plates that face each other (and relatively close) at 300 C each you have a tremendous flow of energy from each surface but you have zero heat flow (neither surface is gaining or losing internal energy). So you could not label either radiant flow of energy as “heat” since neither flow is changing the internal temperature. That is why I think Ball4 wants to keep the discussion to energy flows and not “heat” to prevent massive semantic battles that really are confusing and do not lead to any more insight into the debate about Climate Change or even the GHE.

          • David Appell says:

            Norman says:
            “I think Heat is only a subset of energy flow. A specific type of flow where the NET energy is from Hot to Cold.”

            Fine with me. But it still comes down to semantics.

            DWIR (etc.) is more usually described as a “energy flux.” But it’s still a transfer of heat.

          • Norman says:

            David Appell

            It is only a transfer of heat if the internal energy of the Earth’s surface changes. If the Earth temperature (equilibrium state) does not change than there is no heat flow and the Downwelling IR could not be considered a heat flux. That is why I like that Ball4 is aggressively taking on the semantics, it seems to cause much discussion and not much progress. Gordon Robertson jumps on it, Kristian jumps on it. I think Kristian is a very intelligent poster but I think he gets stuck in the semantic debate and makes these really long posts about it on numerous threads. If at least on this blog, posters (at least the regular posters) could come up with a mutual and acceptable definition of heat, a lot of wasted effort on semantics could be avoided. I think Ball4 may have the most reasonable definition of all so far. IR is an energy flux unless it causes the temperature to change.

            I can think that you might also be correct in your application since the increase in Carbon Dioxide did increase the downwelling IR some (0.2 W/m^2 increase in a decade which was a measured value, but for valid science it would have to be duplicated by other researchers but I will accept it as valid for now), the downwelling IR flux does become a heat flux. But not exactly because without the solar flux the increased 0.2 W/m^2 would still not warm the surface as the outgoing flux is still going to be 398 W/m^2 and the increase downwelling would make it 345.2 so it would still not be a heat flux to the surface. The combination of the solar AND downwelling IR would now be a heat flux (but only in combination). You would have a NET downward flux of 510.2 W/m^2 in a decade from 2000 to 2010 and it would warm the Earth surface some because its outgoing flux was 510 W/m^2 and something has to change in the outgoing fluxes to balance the incoming to reach an equilibrium state. As long as the surface is shown to be warming or OHC continues to increase there is most definitely a Heat flux into the surface. It can be from increased radiant energy from the two streams or from a change in the outgoing balance (change in evaporation or convection). Hard to pinpoint for sure what the source of the heat flux is but it is certainly a reality. Even Roy Spencer’s work shows an increase in global temperature over time.

          • Kristian says:

            Norman says, April 9, 2017 at 2:48 PM:

            That is why I like that Ball4 is aggressively taking on the semantics, it seems to cause much discussion and not much progress. Gordon Robertson jumps on it, Kristian jumps on it. I think Kristian is a very intelligent poster but I think he gets stuck in the semantic debate and makes these really long posts about it on numerous threads. If at least on this blog, posters (at least the regular posters) could come up with a mutual and acceptable definition of heat, a lot of wasted effort on semantics could be avoided. I think Ball4 may have the most reasonable definition of all so far. IR is an energy flux unless it causes the temperature to change.

            *Sigh*

            I know what heat [Q] is in physics. So I don’t have to “debate” its meaning. I will only EXPLAIN its meaning. Tim Folkerts knows what heat is too. You, Gordon Robertson, Ball4 and David Appell are all hopelessly confused.

            And now you want the regular posters here to “come up with a mutual and acceptable definition of heat”. How sad and laughable is this at the same time? Pick up the first thermodynamics textbook that you can find, look up the term “heat”, read about the 1st and 2nd Laws of Thermodynamics, and you will get the clear and unambiguous definition there.

            Stop this nonsense!

            I can think that you might also be correct in your application since the increase in Carbon Dioxide did increase the downwelling IR some (…), the downwelling IR flux does become a heat flux.

            SAY WHAT!!!!??

            But not exactly (…)

            Ok, so sort of a heat flux, but not quite, is that it?

            Give me strength!

            The combination of the solar AND downwelling IR would now be a heat flux (but only in combination).

            No, no, no, no, no. The SOLAR flux (net SW) is a heat flux. Because it comes from a warmer place. The DWLWIR is NOT a heat flux. Because it comes from a cooler place. You can’t add together a heat flux and a non-heat flux and get another heat flux, Norman. That’s not how thermodynamics work, sorry.

            YOU NEED TO READ UP ON WHAT CONSTITUTES A HEAT FLUX. Simple as that.

            As long as the surface is shown to be warming or OHC continues to increase there is most definitely a Heat flux into the surface.

            Yes, it’s called the SOLAR flux. The ASR. The net SW. TSI minus refl SW (albedo). The DWLWIR is part of the net LW, the heat moving OUT from the surface.

            It’s like teaching preschool kids … This is sooo elementary.

          • Norman says:

            Kristian

            I don’t mind you having your own opinion and feeling strongly about it. What causes me to react to your opinion is when you say I am confused about my understanding of heat transfer.

            In a previous thread I linked you to three different sources from experts on heat transfer and they all state it like I do. You feel differently, fine, but you are not on any high ground to call others (who actually read what the textbooks say and understand the content) confused. I take issue with that. Go back and look at my links, explain (NOT from your own opinion but from the textbooks) why my understanding is wrong or confused because it lines up exactly with the textbooks and it also lines up with my understanding of Chemistry and the electronic structure of matter.

            The Sun’s incoming flux will only be a heat flux until an object’s internal temperature no longer changes. Once the internal energy does not change their is no longer a heat flux, only two energy fluxes. One solar into the object and the other emission of the surface away from the surface. Both will be equal and no heat will flow.

          • Ball4 says:

            It comes down to the mythology of heat not the semantics David, plug in any word to google and you can get the def. so fast (0.57 sec!) semantics is not a problem.

            —–

            “The SOLAR flux (net SW) is a heat flux.”

            Cue for Gordon. Kristian is trying to pass off radiant energy as heat again.

            “The DWLWIR is NOT a heat flux. Because it comes from a cooler place.”

            Then DWLWIR must be a cold flux, maybe Gordon can fill us in on that too. Is radiant cold a problem Gordon?

          • Tim Folkerts says:

            Norman says: “The Suns incoming flux will only be a heat flux until an objects internal temperature no longer changes. Once the internal energy does not change their is no longer a heat flux, only two energy fluxes. One solar into the object and the other emission of the surface away from the surface. Both will be equal and no heat will flow.”

            Sorry, I can’t agree with this. Let’s use wikipedia for simplicity. “In physics, heat is the amount of energy flowing from one body to another spontaneously due to their temperature difference, or by any means other than through work or the transfer of matter.”

            Restating those same words, the amount of energy flowing from one body (the sun) to another (the earth) spontaneously due to their temperature difference, *is* heat. This does not stop being heat just because the second body (the earth) might happen to be at a steady temperature.

            There is a *separate* heat from from one body (the earth) to another body (the atmosphere).

          • Ball4 says:

            Tim: “Restating those same words, the amount of energy flowing from one body (the sun) to another (the earth) spontaneously due to their temperature difference, *is* heat.”

            Tim, energy also flows from one body (the earth) to another (the sun) spontaneously due to their temperatures which then *is* cold flow by your reasoning.

            Actually, radiative transfer exists sun to earth, earth to sun. There is no need to call out one as heat transfer and one as cold transfer, radiant energy transfer is sufficient and accurate.

          • Tim Folkerts says:

            Ball4. Implicit in that definition of “heat” (and stated explicitly in other places) is that heat is the NET flow of such energy.

            So there there are thermal photons generated by the sun that get absorbed by the earth. And, yes, there are also thermal photons generated by the earth flowing to the sun. But the net flow of thermal energy is always from the hotter object to the cooler object.

            * there is an ENERGY flow of thermal photons from hot to cold — call it E(hot->cold). This is not “heat flow”.
            * there is an ENERGY flow of thermal photons from cold to hot — call it E(cold->hot). This is not “cold flow”.
            * there is HEAT from hot to cold — call it Q(hot->cold) = E(hot->cold) – E(cold->hot).

          • Ball4 says:

            Tim, in your own 5:03pm post you say energy flow *is* heat, then you write 6:49pm energy flow is not heat.

            Even you are having trouble keeping your mythological heat existence straight. I know of no examples using your myth of heat existing leads to increased physical understanding.

            Rubbing your hands together to warm them on a cold morning is a common experience . You might write this generated some heat. Or you could write the temperature of your hands increased. The second can be experimentally verified; the first can not.

            As you can tell from these blog threads, I have become absolutely convinced commenters have become deluded into thinking they have explained something using the heat term yet all they did was invoke a nonexistent entity, a myth.

            It is very easy to deal with the definition of heat: Heat does not exist. Why in the world is so much time & effort wasted, in so many ways defining something that does not exist? Rhetorical question, let loose the hounds.

          • Tim Folkerts says:

            “Rubbing your hands together to warm them on a cold morning is a common experience . You might write this generated some heat.”

            Actually, this is a very clear example of WORK done to raise the temperature of your hand. It is NOT an example of HEAT; there is NO HEAT in this example. Either can change the internal energy (and temperature) of an object.

            delta(U) = Q + W

            The change in U was due to W and not Q here. In the same way, compressing a cylinder to raise the temperature of gas is W, not Q.

          • Ball4 says:

            Had you not known the hands were rubbed together, whether the increase in T came from work or a temperature difference could not be determined.

          • Ball4 says:

            Once you know the hands were rubbed together, a force though a distance, the hands internal energy was raised, their constituent KE was higher. Their temperature was increased.

            Had the hands been warmed by a chemical pack, the hands internal energy was raised, their constituent KE was higher. Their temperature was increased.

            Both of those statements explain the observations with no need at all to invoke a mythical entity.

          • Norman says:

            Tim Folkerts

            I could be wrong but I am not convinced by your post I am (not at this time anyway).

            Here is something for you to read straight from physics: “As we have seen in the zeroth law of thermodynamics, when two objects are placed in contact heat (energy) is transferred from one to the other until they reach the same temperature (are in thermal equilibrium). When the objects are at the same temperature there is no heat transfer.”

            Link:
            http://www.physics.louisville.edu/cldavis/phys298/notes/heat_thermeq.html

            The hottest an object can get with non concentrated solar energy is 120 C at the distance the Sun is from Earth. It does not matter that the surface of the Sun is much hotter, the energy spreads out and the maximum flux will bring an object to thermal equilibrium at 120 C and then no more heat flows based upon the zeroth law. The object is at the same temperature as the Sun at Earth distance.

            I believe this would mean (I could be wrong, I will think on it more) that if you expanded the 5500 C solar surface to the area it would have at Earth distance, the surface would then be 120 C.

          • Tim Folkerts says:

            “The hottest an object can get with non concentrated solar energy is 120 C at the distance the Sun is from Earth. “

            Not quite. The hottest a *blackbody* object radiating *to 0 K sp