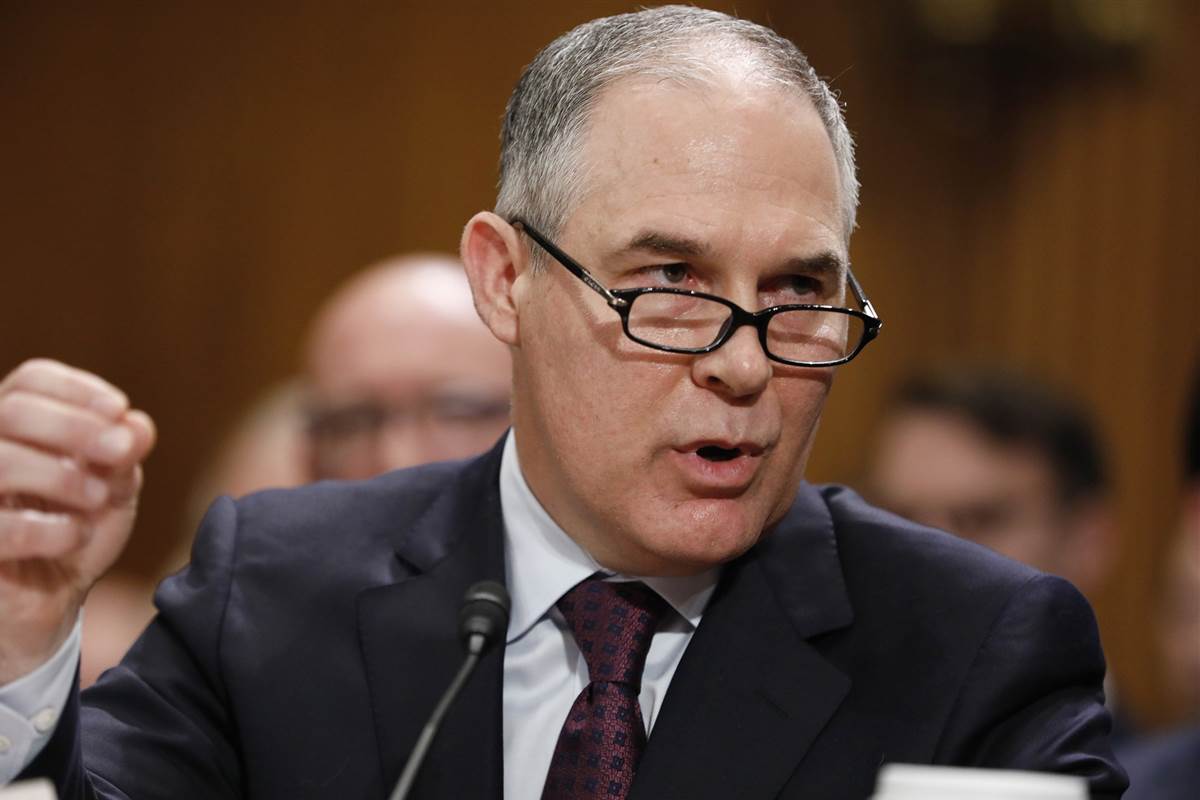
A new paper in Nature: Scientific Reports by Santer et al entitled Tropospheric Warming Over the Past Two Decades begins with this:
After a recent Senate confirmation hearing, Scott Pruitt the new Administrator of the U.S. Environmental Protection Agency received a written question regarding observed warming estimates. In response, Mr. Pruitt claimed that over the past two decades satellite data indicates there has been a leveling off of warming. We test this claim here.
Now, exactly how does one scientifically test a claim of “leveling off of warming”?
First, the claim would have to have some unambiguous meaning which can be evaluated quantitatively. Does it mean that warming has decelerated in the last two decades, and is approaching zero? That would be my first interpretation of “leveling off”.
And by “two decades” did Pruitt mean exactly 20 years?
The wording is ambiguous. But the authors decided Pruitt meant “there has been zero warming” for exactly 20 years. They proceeded to evaluate this interpretation with a statistical analysis of the various satellite temperature datasets, as well as with climate models.
The result is a peer-reviewed study which took less than one month to sail through peer review.
Wow. If I only knew earlier that I could get peer-reviewed scientific papers by evaluating the silly climate claims made by politicians (Al Gore, Barack Obama, et al.) over the years.
Oh, that’s right. I’m on the wrong side of the issue. The reviewers would have said, “C’mon, that’s a politician generalizing. You can’t get a peer-reviewed scientific paper out of that!”
Why the Global Warming Pause (Hiatus, Leveling Off) is a Poor Metric
I’ve warned people not to place too much emphasis on the claim that there has been zero warming over the last x number of years.
First of all, when the next big warm El Nino occurs, the zero trend will end. And that’s exactly what happened, with the 2015-16 El Nino. A trend is very sensitive to what happens at the end of a time series, and a big (natural) warm blip from El Nino is just what the doctor ordered. No more zero trend. (Admittedly, I’m ignoring statistical uncertainty here..one might still argue there has not been any statistically significant warming in the last 20 years, depending on the error bars you assume.)
Now Santer et al. can get press saying, in effect, “See? Those silly global warming skeptics are wrong.” Of course, the authors know full well that the reason the pause/hiatus/leveling-off ended was due to a NATURAL event (El Nino).
You can’t build a case for human-caused warming by relying on natural warming! (But, they did anyway.)
So, they fault Pruitt on a technicality, straining a gnat while swallowing a camel.
This then distracts attention from the real issue: that the climate models on average produce about twice as much warming as has been observed over the last few decades.
The Santer paper also makes quite a bit out of the fact that warming exists in the satellite datasets at all, and that climate models do not produce that level of warming from their internal variability, suggesting an anthropogenic cause. Of course, they fail to mention that models are lousy at producing realistic multi-decadal time scale natural variability anyway, so this is hardly proof of an anthropogenic source of recent warming.
Nevertheless, as a “lukewarmer” I tend to believe about half of recent warming is indeed human-caused. There’s no way to prove it because there is no fingerprint of anthropogenic warming (warming from, say, a slight decrease in ocean mixing and overturning would look the same as human-caused warming, with greater warming over land than ocean, and over the Northern than Southern Hemisphere).
So, I consider the “no warmers” to be on shaky ground, both theoretically and observationally. But that doesn’t mean they are wrong…we just don’t know yet.
The Santer et al. paper is a good example of what often happens in political debate. Your opponent takes one ambiguous thing you said, interprets in a specific way, dissects it, destroys it, and in the process leaves the impression that you are an idiot who should not be listened to.
At the same time, it performs a very important function: distracting attention away from other, more important issues and lines of evidence — like the fact that observed warming has only been occurring at about half the rate climate models say should be occurring. And those model predictions are the basis for energy policy changes.
It’s sad to see how far peer-reviewed climate science has fallen.
Dr. Spencer, I am not familiar with the term “no warmers”. Do you have a definition? Also, please consider the “Luke Coolers” which I will include myself in. Not that I think the Earth is cooling, but I believe we should be 2.5C warmer now and 20 meters higher in sea level given CO2 levels. Think of it like politicians view the federal budget, an increase of 2% is a cut compared to an increase of 4%, and therefore women, children and the elderly will all die. /Sarc
Seriously though, why are we not much warmer given the reconstructed history of CO2/Temperature/Sea Level. At north of 300 ppm, the Earth should be warmer, no?
If you are referring to the ice core data, I’m not convinced of how much it applies to today’s climate system. But, yes, I believe that we should be warmer at 400 ppm than at 270 ppm. Just by how much is debatable.
Roy said:
‘A trend is very sensitive to what happens at the end of a time series, and a big (natural) warm blip from El Nino is just what the doctor ordered. No more zero trend. ‘
But its equally true that a trend is sensitive to what happens at the beginning of the time series. All these years of talking about the pause since 98, but failing to make this caveat, until now.
Also: ‘Of course, the authors know full well that the reason the pause/hiatus/leveling-off ended was due to a NATURAL event (El Nino).’
Again before recent El Nino the natural events at the beginning were not noteworthy?
What about the natural large La Nina events in 08 and 11-12? You could easily have said in 2012-13 that the apparent leveling off was due to NATURAL events at the end of the series. but I dont recall this comment from anyone then.
No, the correct analysis is to look at a long enough time period that it encompasses several of the natural ENSO events, and be careful about the error bars
Ah, but then you start running into various medium-long period oscillations, e.g. the AMO and PDO, both with about a 60 year period.
’tis a challenge.
Nate…”its equally true that a trend is sensitive to what happens at the beginning of the time series”.
Not true, any spike at the beginning is averaged out by what follows. The 98 EN was averaged first by the following La Nina then by years of relative flatness. A spike at the end skews the preceding average.
Why are you alarmists always on about the 98 EN as if 98 was picked out of a hat? The sat record shows the previous 18 years as being below the baseline (1980 – 2010 global average) mainly. Suddenly, in 98, the average shot up in one year to 0.8C above the baseline.
98 was the logical place to start since it indicated the first true warming in the record.
‘The spike in 98 averaged by what follows’ ..Sure, to some extent. Just as the spike 2015-16 was averaged by dips that preceded it (2011-12).
Point is all the data counts, cant just ignore ones you dont like.
Nate…”Just as the spike 2015-16 was averaged by dips that preceded it (2011-12)”.
You can’t average a current set of data by what preceded it. The current data becomes part of the overall average and modifies the overall average.
If I pick up Roy correctly, he is claiming Santer is playing games by placing too much emphasis on the 2016 El Nino. He can do what he likes but it is patently dishonest to claim the 2016 EN spike wipes out the flat trend from 1998 – 2015.
One of the alarmist whines is that you cannot rely on a short-term trend. I don’t call 18 years of a flat trend an insignificant trend. I do call a few months of an EN spike an insignificant trend. We’ll need at least 5 years to see where it’s going.
Gordon
Yes, 1998 – 2015 was nearly flat in the satellite data. Who is saying it’s not and who cares anyway?
Nate, I thoroughly agree with you. Why two decades only? Why not start the trend in 1936, which would then show no significant warming for eight decades? Why not go back eight centuries, eight millennia? We would then have a cooling trend. Picking two decades does in fact make good sense because we start and end with an El Nino, comparing apples with apples.
Why not 8 centuries? Really?
Point is to test predictions of agw which would have begun contributing a century ago with stronger contributions late 20th century.
‘Why not 1936’ to see no warming in 8 decades. Ok here u go:
http://tinyurl.com/y83sfeed
Sorry Nate but repeating that long refuted propaganda only shows you don’t understand math. All you have to do to realize your claim is wrong is look at the trend starting in 2001 as well as 1998.
http://www.woodfortrees.org/plot/rss/from:1998/to/plot/rss/from:2001/to:2015/trend/plot/rss/from:1998/to:2015/trend
As is obvious the trend is identical to starting in 1998. The 1998 El Nino simply balances out the La Nina events that followed. You remove all the early ENSO events and the trend is the same. Those weather events do not change the trend.
However, when you add the 2016 weather event it makes a big difference.
http://www.woodfortrees.org/plot/rss/from:1998/to/plot/rss/from:2001/to:2015/trend/plot/rss/from:2001/to/trend
Do I need to go on?
Yes you could go on. I see what you are saying, but it also illustrates clearly that which year you start or end with makes a big difference for these short spans.
I would suggest starting in 2000, because that removes one El Nino year and one La Nina year. You get a very different trend then starting 2001.
You want to not count 2015-2017, even though it was ‘balanced’ by 2011-2012?
Point is to fit long enough period that moving end or beginning by a year makes little difference. Try 30-40 y.
This one is a fair comparison, equal span but start 1998 or 2000:
http://www.woodfortrees.org/plot/uah6/from:1997/to/plot/uah6/from:1998/to:2013/trend/plot/uah6/from:2000/to:2015/trend
very different result
Nate…”You want to not count 2015-2017, even though it was balanced by 2011-2012?”
No, we want to wait to see where the 2016 EN warming ends up. It has already dropped back to near the flat trend level. There is word of an EN following it without an intervening La Nina. In that case, there will be a slight trend but we’ll still have to wait to see if a significant La Nina appears in the near future.
In that case, we might extend the flat trend. Santer is not allowing for that possibility. Eco-alarmists are like that, they have referred to the flat trend as a hiatus and a pause, meaning they expect the warming trend to continue.
You might say that Santer’s paper presumes a warming trend and he has found a way to create one.
Nate…”very different result”
Exclude the 2016 EN and see if there is a flat trend over the 18 years from 1998 – 2015.
Lindzen claims a flat trend from 1995 onward. If you don’t like 1998, start at 1995.
‘No we want to wait and see where 2016 EN warming ends up’
Sure Im interested to know where things end up. If we have to assess with what we know now, then look at all Global Temp series.
All show a clear upward over last ~ 50 y, with some wiggles and waggles, and the current data fits this trend. But you think a couple more years of continued trend or flatness will change anyones mind?
Nate, let’s say we all agree that global temps have gone up the last 50 years. Clearly we don’t all agree on that, but suppose we did.
Now, where is the proof that that 50-year warming was due to CO2?
We know it wasn’t caused by “natural variability”! (Insert smiley face here.)
So, did you consider Starbucks coffee establishments? 50 years ago, Starbucks was nothing. Now, they are all over the World. And, the coffee is HOT! Get it? HOT!
Are you in denial?
As i told you already, you may believe you are hilarious, but this is a tough crowd. Dont quit your day job.
Nate, I already showed you it takes the full compliment of La Nina years to balance out the 1998 El Nino. This is because El Nino events are stronger and La Nina event tends to be weaker but a little longer. You are using linear thinking.
It is also clear your bias is influencing your thinking. The 2011-12 La Nina years were balancing the 2010 El Nino. Already accounted for in the trend.
Nothing has yet balanced the 2014-16 El Nino. Even the weak 2016-17 La Nina was not as a big deal as the Nino 1+2 area was very warm which has not been the case in other La Nina events. This has shown the Nino 3.4 index is not always a good measure of tropical Pacific’s influence on global temperature. I would hope NOAA is reassessing what it uses. Trenberth has been proven to be wrong once again.
You really need to ask yourself why you are in such denial of the lack of warming over the past 20 years.
Richard,
You can call it my bias, but its based on looking at the data. Look any of the srface data sets overvlast 50 y and put a linear trend, and you will see the recent years are above the trend line, while priorvyears are below, ie as you would expect for a long term contining trend.
You seem tovthink every el nino will be balanced by a following la nina. Thats not the case. The decade prior to 2015 was dominated by strong la ninas and weak el ninos. Can look at 2015 strong el nino as restoring that imbalance.
Restoring balance
Nate, I also did a little exercise to make sure I wasn’t letting any bias influence my thinking. I created a trend of only ENSO neutral months over the last 20 years. Guess what? No warming.
This method eliminates any possible influence from the position of the El Nino and La Nina events.
Gordon Robertson says:
“Exclude the 2016 EN and see if there is a flat trend over the 18 years from 1998 2015.”
Shorter Gordon:
Ignore all the data points Lindzen I me don’t like, and tell me what the trend is then!!
Nate, compare peak to peak temperatures. Before NASA adjusted the sea surface temperatures with a declaration that ship engine intakes in the 1950s are more accurate than buoys in the 2010s, the trend of peak to peak was about .5C per century(even less than .1C at one point).
Not sure where u get 0.5C from? Dont like NASA, use had*crut.
Whichever surface data set u use, Berk*ley, NO*AA, GI*SS, or Had*crut, or JAXA they give similar 1.8C/century over last 50 y
See comparison here Gi*SS and had*crut
http://tinyurl.com/y9vgurrj
Roy W. Spencer, Ph. D. says:
“If you are referring to the ice core data, Im not convinced of how much it applies to todays climate system. But, yes, I believe that we should be warmer at 400 ppm than at 270 ppm. Just by how much is debatable.”
Roy, have you published on this? If so, I’d like to read it/them — can you please provide a citation(s)? Thanks.
DA…”Roy, have you published on this? If so, Id like to read it/them can you please provide a citation(s)?”
Why don’t you try addressing the point in the context of this blog rather than whining and sniveling about peer review.
Once again, peer review is NOT a requirement of the scientific method nor is it a requirement of stating an opinion in a blog.
Besides, you are not here to participate in a blog, you are here purely to disrupt participation by interjecting meaningless drivel that suits your climate alarmist views.
I have yet to see you contribute a meaningful rebuttal to a point using your understanding of science.
Gordon, how many peer reviewed publications have you published?
David A,
How many papers have YOU published….
Gee that didn’t help you at all. Try sticking with the topic at hand instead.
David, You missed Dr. Spencer’s point:
“Its sad to see how far peer-reviewed climate science has fallen.”
Here is a peer reviewed analysis of ice cores as well as other aspects of the CO2 measurements.
z. JAWOROWSKI, T. V. SEGALSTAD & V. HISDSAL
Atmospheric C02 and global warming:
A critical review
Second revised edition
a .pdf is available on google scholar.
One of the interesting things about the ice core data as a historical reference is that while it may provide a somewhat usable record of atmospheric CO2 content as well as most other “greenhouse” gases — except for atmospheric water content — ice cores become becomes helpless and hopeless when the need is to know atmospheric H2O content. Without knowing atmospheric water molecules content, say, 200 years ago, how can anyone know how much aggregate greenhouse effect has been increased by the addition of about 120 ppmv CO2 over that two century period?
— Without knowing atmospheric water molecules content, say, 200 years ago, how can anyone know how much aggregate greenhouse effect has been increased by the addition of about 120 ppmv CO2 over that two century period?–
It seems that if had more water vapor, more H20 ice would sublimate on the polar ice- particularly with ice at higher elevation.
So I googled: sublimation accumulation of ice antarctica
It seems wind is problem, so what about caves,
added caves and not much. To keep simple we got wiki:
“Evaporative cooling – In winter, dry surface air entering a moisture-saturated cave may have an additional cooling effect due to the latent heat of evaporation. This may create a zone within the cave that is cooler than the rest of the cave. Because many caves have seasonally-reversing draughts, the corresponding warming of the cave through condensation in summer may occur at a different location within the cave, but in any event a moisture-saturated cave environment is likely to experience much more evaporative cooling than condensative warming.”
[ok, what about “non-moisture-saturated caves”, do they exist??] And:
“Airborne moisture (water vapor) Freezing vapor can form frost crystals, frost feathers and two-dimensional ice plates on the cave walls and ceiling.”
And:
“A considerable effort has been made to determine the accumulation (precipitation minus sublimation, P− SU) in Antarctica (e.g.,Giovinetto et al.,1992;Van de Berg et al.,2006).
The contribution of SUds to the SMB, however, is largely unknown because direct measurements are unavailable (Pomeroy and Essery,1999).
http://www.the-cryosphere.net/4/179/2010/tc-4-179-2010.pdf
[[And other complained about it as general problem- so briefly I will assume it’s not done.]]
Roy W. Spencer, Ph. D. says:
“If you are referring to the ice core data, Im not convinced of how much it applies to todays climate system.”
Roy, would you care to expand on this? I’m genuinely interested in reading your thoughts that leads you to this opinion….
Roy,
You’ve conceded far too much to the alarmist point of view, IMO.
RW, I would disagree with that. From what I read, Dr. S. is very cautious in his conclusions. ie He says he thinks the earth should be warmer due to higher levels of CO2, ‘but he’s not sure by how much’. (paraphrased)
Notice the qualifiers – should , not sure.
This, to me, seems to be a hallmark of someone who is trying to be accurate when they make a definitive statement.
I, on the other hand, being a died in the wool non-believer, would have something much stronger to say.
This is the same Ben Santer whose erroneous statistical analysis smeared a bit of Antarctic peninsula warming across the whole continent. Better look closely at this testing of a claim.
This is the same Ben Santer (of dubious scientific and personal honesty) who in the 1995 IPCC report, once all scientist had gone home, erased the conclusion “there is no evidence of a human intervention in the climate change”, and gave birth the hoax with his “From the body of evidence since IPCC (1996) we concluded that there has been a discernible influence on global climate”.
“In 2011, Santer was elected as a fellow of the American Geophysical Union and as a member of the National Academy of Sciences.”
https://en.wikipedia.org/wiki/Benjamin_D._Santer#Honors
DA…”In 2011, Santer was elected as a fellow of the American Geophysical Union and as a member of the National Academy of Sciences.”
Such a shame, NAS used to be an honourable outfit till the climate alarmists infiltrated and took over.
Gordon, as a rank amateur you get no opinion here.
What a shame,that David A, didn’t addressed what Edwardo was really talking about, “of dubious scientific and personal honesty”. It would have been interesting, but alas…..
Trying to pull the boring Authority Fallacy on us, David A?
Sunset,
David is not the least bit interested in trying to have a reasonable discussion with anyone. He is interested in furthering his own self inflated hysteria. He comes here because his own blog finds few visitors and he must spout his blather hither thither and yon, seeking solace in the fact that some will read and respond, hence verifying his usefulness to society.
DA…”Gordon, as a rank amateur you get no opinion here”.
Weren’t you banned? Seems you snuck back on. I think you missed my insights into real science.
Pal reviewers obviously also elect pals to institutions such as the AGU
You mean like in climategate email 1196872660 where Mann is nominating Jones?
“[…]By the way, still looking into nominating you for an AGU award, I’ve been told that the Ewing medal wouldn’t be the right one. Let me know if you have any particular options you’d like me to investigate…
thanks,
mike”
Gary…”This is the same Ben Santer whose erroneous statistical analysis smeared a bit of Antarctic peninsula warming across the whole continent”.
Him too. I thought it was just the Stieg-Mann study.
https://www.epw.senate.gov/public/index.cfm/in-the-news?ID=FC7DB6AD-802A-23AD-43D1-2651EB2297D6
Even alarmist Kevin Trenberth expressed skepticism claiming it’s hard to make data where none exists.
Mind you, Santer is an uber-alarmist.
And don’t forget the 1995 IPCC caper … An interesting way to launch a career.
Somebody mention me?
Personal experience in Scientific Report is that the review process of SREP is not of the highest standards. Sometimes only one referee, and from the “aims and scope”:
“Referees and Editorial Board Members will determine whether a paper is scientifically valid, rather than making judgements on significance or whether the submission represents a conceptual advance.”
SREP also focusses on fast publication (preferably within 45 days).
Ben Santer, the Texas sharpshooter, draws his bulls eye on the straw man. But what else is new?
The test is now on and within 2 years we will know much more as to which school of thinking is correct.
We now have very low solar (cooling) versus increasing co2 (warming). I am so glad the test is on.
Depending on which way the temperatures go from here given the above scenario we have a very good idea as to which school of thinking is correct.
Already one can start to see signs that the temperature trend is looking like it is starting to trend lower, especially in the N.H.
This temperature drop will not be gradual if it occurs rather it will be in fits and starts with sometimes maybe a .2c drop in global temperatures within a month only to level off.
In order for my solar/climate tie to be correct I only have to be correct on one solar /climate connection much less many of them which range from lower sea surface temperatures due to less UV light, to an increase in major volcanic activity due to an increase in galactic cosmic rays.
Other connections could be an increase in global cloud coverage snow coverage (increase in albedo) due to an increase in galactic cosmic rays less EUV light.
Not to mention even a slight decline in solar irradiance of say .15% would equate to a .2c drop in global temperatures.
Salvatore Del Prete says:
“The test is now on and within 2 years we will know much more as to which school of thinking is correct.”
You’ve written this many, many times in the past, Salvatore, and you were always wrong. Why should anyone think you are right now, Salvatore, when wrong then?
“Dont you realize that, the warming that has now ended, that took place last century was one of the weakess warming periods the earth has undergone ,lets take a time period ,of the last 20,000 years.”
– Salvatore del Prete, April 7, 2011
https://bbickmore.wordpress.com/2011/04/05/roy-spencers-non-response/
Salvatore,
Man, your insistence that climate response to any force is instantaneous is going to sink your credibility. LAGS man, Lags.
A
That is why I did say a year or two but you are correct lags.
I sympathize with Salvatore’s problem with near-term projections; beginning in 2014 we had a series of strong warming weather patterns. The Blob. The aborted 2014 El Nino. The 2015-16 Super El Nino.
I think we need to back off for a few more years before making any definitive statements in either direction.
In any case, IPCC climate models are running hot by 2 to 3 times actuals.
https://www.iceagenow.info/ice-core-records-show-profound-temperature-decline/
In the big picture due to Milankovitch Cycles, Land /Ocean arrangements one can clearly see global temperatures since the Holocene Optimum have been in a gradual overall down trend independent of CO2 concentrations.
False:
http://www.realclimate.org/images//Marcott_PAGES2k.png
Very, very false.
DA…”Very, very false”.
False by itself works, but you as a blatant alarmist cannot resist adding drama and emotion.
Quoting the climate alarmists at realclimate as a reliable source of climate theory is akin to quoting a gun collector on gun control. Their resident guru, Raymond Pierrehumbert is a geologist who needs to bone up on physics.
During climategate, realclimate jumped to the defense of Michael Mann when the emails exposed his trick of hiding declining temperatures. They tried to pass it off as a harmless saying. Of course, realclimate is run by Mann and Gavin Schmidt of NASA GISS.
That’s basically why I regard anything coming out of GISS or rc as utter rubbish.
Gordon, as someone who recently admitted they don’t even know what an electromagnetic wave is — and as someone who makes one big scientific boner after another — you don’t get an opinion here.
So move aside for those who do know what they’re talking about.
David, are you making the rules for this blog? You, who are so consistently rude and condescending? Bah!
DA
Clearly you don’t know what you are talking about!
I’ve told you once before when you brought up the Marcott study that even he proclaimed that centennial and bicentennial measures cannot be compared with modern instrumental records.
But you obviously are a self proclaimed guru and can’t seem to learn.
DA…”David, are you making the rules for this blog? You, who are so consistently rude and condescending? Bah!”
For someone who has expressed disdain for Roy and who continually disrespects him, Appell sure has a lot to say about who belongs and who doesn’t.
DA…”Gordon, as someone who recently admitted they dont even know what an electromagnetic wave is…”
Anyone who claims he/she ‘knows’ what constitutes EM is a liar. I have worked with it for decades, in the field of electronics and communications, that’s a damned sight more than you could ever claim.
Any idea how to demodulate an FM EM signal using a ratio detector?
I didn’t think so.
Any idea how to use a Smith chart? I didn’t think so. You’re specialty is ad homs with nothing pertinent to justify them.
If you insist on using ad homs, at least have the science to back them up without running to the wiki or offering lame links to realclimate.
In the big picture due to Milankovitch Cycles, Land /Ocean arrangements one can clearly see global temperatures since the Holocene Optimum have been in a gradual overall down trend independent of CO2 concentrations.
Until the 20th Century, I agree with that (contrary to David).
The same point is made by the mainstream. After the Holocene Optimum at the end of the temperature rise due to orbital variation, there had been a long slow reduction in surface temps (with fluctuations).
That changed since the beginning of the 20th Century. Along with fluctuations, the general trend has been upwards since then.
I know of very few ‘skeptics’, now, who dispute that the globe has warmed over the last 100 years or so.
The RHS of the graph in Salvatore’s link is bunk, though. There’s no references cited, so the blog article should get exactly the credence that merits. The ‘skeptics’ here who insist on data-based analysis (I agree) should be writing that blog post off instantly, Salvatore.
barry dreams: “Along with fluctuations, the general trend has been upwards since then.”
barry, would the “general trend” be affected by “adjustments”, by any chance?
Nup. It’s in the raw data, too.
barry…”I know of very few skeptics, now, who dispute that the globe has warmed over the last 100 years or so”.
I would say ‘re-warmed’, not warmed. There is ample evidence that the Medieval Warm Period, circa 1000 AD was as warm as today. The Vikings were supposedly farming on Greenland during the MWP.
Between 1000 AD and now something happened to cause the Little Ice Age, in two stages from about 1400 to 1850. There is evidence the cold period was related to solar radiation. Since 1850, we have re-warmed.
Claiming the warming was due to anthropogenic causes is short-sighted when you have proof of global temps being up to 2C cooler during parts of the LIA. There is evidence that glaciers expanded right across valleys in the Alps, the opposite of what is happening in many places today. Glaciers don’t expand like that unless the global average is conducive.
Minoan, Roman, Medieval warm periods warming then today when CO2 concentrations were less.
Do you have proof those periods were global phenomena?
Proof? Geez, we can’t even agree what land or satellite records say today. There’s a lot of evidence to support those warm periods were global, but I doubt there’s enough to make you say the idea has merit.
Ric…”Proof? Geez, we cant even agree what land or satellite records say today”.
Don’t pay any heed to Appell. Even if you supply the proof he will just come back and ask for more.
Gordon, you’ve never supplied a proof for any of your claims I’ve called B.S. on.
You have no science, ever.
DA…”youve never supplied a proof for any of your claims Ive called B.S. on.”
You call B.S. on everything with which you disagree. It’s you MO.
Ever heard of a discussion involving intelligent debate? Of course not, another part of your MO is to further the propaganda underlying climate alarm. Intelligent discussion does not suit such propaganda.
Ric Werme says:
“Theres a lot of evidence to support those warm periods were global,”
Please cite the evidence to backup your claims.
THanks.
You first.
David, I’ll use one of your proofs –
I’m smart and I said so.
lewis,
I agree, You’re smart, and you said so.
Where’s David’s proof to the contrary?
I could call him as dumb as a box of hair, but I wouldn’t want to insult the hair.
Hair is useful.
Cheers.
David Appell writes “Do you have proof those periods were global phenomena?”
Perhaps we could ask Ben Santer whether the models show regions having sustained warming similar to the Minoan, Roman and Medieval warming periods during their control runs?
I think it may be time to do a 1 question global survey of all parties involved in this debate.
1- Would you rather sweat or shiver?
I don’t think Cook or Doran/Zimmerman could even screw this up 😉
Ossqss:
First there was, “Global warming is a hoax!”
Now it’s, “Would you rather sweat or shiver?”
At least you folks are making progress.
Snape…”First there was, Global warming is a hoax!
Now its, Would you rather sweat or shiver?”
I prefer ‘freezing in the dark’. That’s where we’ll be if climate alarmists have their way.
I dunno, doesnt take much in the way of modern technology to deal with cold. Ask neolithic people. Dealing with heat requires an electrical grid and more.
Nate, if you don’t plan to use “modern technology” to deal with cold, are you promoting the burning of fossil fuels?
(A Warmist burning fossil fuels—love it!)
ossqss says:
“1- Would you rather sweat or shiver?”
What says everyone on the planet would have the same answer to this question.
About 3B people live in the tropics, a region that is already near heat stress.
Do you really think they want more heat? The workers? Do the plants and animals there?
—
Your question is extremely simplistic and, well, not very smart.
David, you’re projecting.
Tropics – heat – Where’s your proof? Do you have a citation?
Please, stick to provable facts. Your opinions are spineless.
DA…”About 3B people live in the tropics, a region that is already near heat stress”.
With the pythons, anacondas, cobras, lions, tigers, poisonous snakes and insect produced malarial infections to name one of many. Not to mention crazy humans who tend to inhabit the warmer parts of the world.
I’ll stick to my temperature northern climate with my fossil fuels, thank you.
But GW isn’t ‘happening’ in the tropics. It’s a high latitude phenom. Didn’t you hear?
https://cdn.meme.am/cache/instances/folder948/56805948.jpg
I believe the warmers are right, we can look forward to higher ocean levels, flooding much of the coasts from melting ice caps. Higher CO2 levels and higher temperatures. I have one small disagreement, I think it will be over 25,000 years not 10.
Why?
And who exactly says “10 years?”
Bruce, if it continues to warm, as it has these past 20,000 years, and the oceans continue to rise, due to melting ice caps, glaciers etc, then why should we not expect the change to continue at the historical rate of about 1/10th of an inch per year? (agreeing with you)
The low lands will continue to be inundated, as in the past, while the northern climes will become more available for agriculture.
Change, the only constant is change.
Yet we have some, many now, who believe mankind has the power to stop this change, to deflect it. Bah! Man has no such power yet (probably never)
For me, I hope it continues to warm as cold is much more difficult to deal with.
,
why should we not expect the change to continue at the historical rate of about 1/10th of an inch per year? ‘
Is that what you really believe? That sea level was 200 inches ( 16 feet) lower in Roman times? And 40 feet lower in Egyptian kinggdom?
Well we know that the sea at coastal roman cities in Italy, where aquaculture was done, were essentially at todays level. So it is not likely sea level has risen at todays rate for a long time.
“First of all, when the next big warm El Nino occurs, the zero trend will end. And thats exactly what happened, with the 2015-16 El Nino. A trend is very sensitive to what happens at the end of a time series, and a big (natural) warm blip from El Nino is just what the doctor ordered. No more zero trend.”
You are neglecting to state the equally valid fact. A trend is very sensitive to what happens at the *beginning* of a time series. Without the largest El Nino in recorded history happening in 1998, there would not have been a zero trend for so long after 1998. Denialists are sad because they can no longer say “no warming since 1998”. Google that phrase and see how many times it has been said. But they should have never been saying that anyway. If you do a multiple regression using the El Nino index ONI (lagged 4 months) and temperature, you see that once the El Nino effects are accounted for, there was no “pause”. Unfortunately, it seems that people who want to deny warming are only capable of linear regression (or just saying the graph looks flat). Or worse, they use a cubic polynomial fit to give the illusion of imminent cooling.
Dr. Roy, I challenge you to publish a graph on this website of the regression done with ONI affects included. I will send you the code to do it if you are not capable of writing it yourself.
For those you you who don’t understand multiple regression, here is the idea. Linear regression on temperature vs. time finds a line to fit the data such that
Temp(t) = a*t + b
The slope of this line, or trend, is given by “a”. In effect, we are assuming that temperature changes only depend linearly on time, which we know is not true by looking at the plots published every month here. The biggest deviation from a linear trend is due to the El Nino/La Nina cycle. So let’s include it!
We find the best fit for
Temp(t) = a*t + b +c*N(t)
Where N(t) is the El Nino index (take your pick which one). If we lag N(t) a few months (we know the temperature changes lag El Ninos by 4-6 months), this simple regression fits the temperature data dramatically better than a linear fit. It also shows there was no “pause”.
Yes I’ve done this before, and John Christy has done it and published the results. The downside is that it only removes the short term effects of El Nino, our 2014 paper showed stronger events cause storage of additional solar energy in the ocean, leading to long term warming. It’s difficult to separate this from anthropogenic warming.
Roy
Pruitt’s claim is sort of correct (20 years is close to 18, right?) if you include the 97/98 el nino and exclude the most recent one.
Santer’s response takes both into consideration.
Cherry picking.
Says David Appell, good grief
Roy, how about a calculation that includes autocorrelation? Rank-1, at the very least.
If you do so, you’ll quickly see that 20-yr trends are almost never significant.
I dont understand that. Don’t these ‘storage of additional solar energy’ get undone later, with La Nina events? How does this lead to long term warming?
Nate, the oceans store “solar energy”. When they get bored, they release this energy. When this happens in the ENSO waters, it is called “El Nino”.
Now you can go back to your pseudoscience psleep.
Even Dr. Trenberth suggested watching out for ENSO residuals.
Rilly T you are looking backwards not forward.
Notice how Salvatore avoids talking about all his past, failed predictions.
Rilly T…”Without the largest El Nino in recorded history happening in 1998, there would not have been a zero trend for so long after 1998″.
You need a course in basic calculus and on how to read graphs. The EN spike of 98 was brief and very skinny. The area under its curve is minimal compared to the area under the curve from 2002 – 2008, where the average was flat and minimal. The data following 2008 shows a near perfect cosine wave and we know the average over a cosine is zero.
I’d like to know the source of the alarmist whine that 98 is a poor place to select a starting point. Did it come from skepticalscience, realclimate, scienceofdoom or perhaps desmogblog, all known uber-alarmist sites who preach climate gloom and doom using pseudo-science.
The skinny EN spike was followed by a wider but shallower La Nina slump. The EN temperature gain was fairly well nullified before 2002.
Gordon Robertson wrote:
“The data following 2008 shows a near perfect cosine wave and we know the average over a cosine is zero.”
Good god you are an idiot.
DA…”Good god you are an idiot.”
Do you have any idea, whatsoever, what a cosine wave looks like? What do you call the curve on Roys red running average curve from mid 2007 to 2011? It has an arrow pointing right at it.
Looks an awful lot like cosines I have been seeing in electronics the past few decades.
Do you ever take your foot out of your mouth at any time?
Santer himself proved global warming is all natural from at least 1993:
http://www.nature.com/ngeo/journal/v7/n3/fig_tab/ngeo2098_F1.html
That’s a complete misinterpretation of that 1993 paper.
Congratulations.
Why can’t you explain WHY you think so,David A?
Life is short. I expect people who make claims to prove them. Something you rarely do.
David,
I claim you’re an irrational true believer.
The proof is found in your blathering.
David A, writes,
“Thats a complete misinterpretation of that 1993 paper.”
I asked you to explain why you think so,you come back with nothing,which means your quoted statement is unsupported.
Cheers.
Santers paper shows that subtraction of the ENSO, El Chichn and Pinatubo signals from the original TLT data that the temperature residuals show no significant warming from 1993 on.
Here is another one for you David Appell (all natural!):
https://thsresearch.files.wordpress.com/2016/09/wwww-ths-rr-091716.pdf
John Bills….–> Appell’s reply… “Thats a complete misinterpretation of that 1993 paper”.
You see, John, when Appell disagrees he asks for proof. When you supply proof, he disagrees.
You see, Appell studies at the pseudo-science schools at realclimate, skepticalscience, and so on. You can catch him sitting in the front row wearing a beanie and short pants constantly raising his hand to attract the attention of the main propagandist. They teach him how to preach the gospel of catastrophic climate change and how to disrupt intelligent conversations while trying to focus attention on their climate propaganda.
Too bad it doesn’t work.
It is easy to go with the trend or status quo and hard to call for a new trend in global temperatures which is what I am doing.
Salvatore
Are you predicting a new long term trend or just a new short term trend?
Long term
Salvatore
So it would take a long time for you to be proven correct, right?
Wrong it will be a short time because if the trend in global cooling does not start within a year or two I will be wrong.
One or two years to be proven wrong, but how long to be proven right?
Salvatore, you’ve been wrong for 15 years now:
“Your conclusions are in a word wrong, and that will be proven over the coming years, as the temperatures of earth will start a more significant decline (which started in year 2002 by the way)….”
– Salvatore del Prete, Reply to article: IC Joanna Haigh – Declining solar activity linked to recent warming, 10/8/2010
– http://climaterealists.com/index.php?id=6428
Wrong it will be a short time because if the trend in global cooling does not start within a year or two I will be wrong.
How would you establish a trend from only 2 years worth of data?
Are you saying that if the next 2 years are not as hot as 2016 (which had a super el Nino), this demonstrates a cooling trend?
Or did you have a different start date in mind?
Salvatore: Your predictions of a new trend have been huge, rotten failures:
—–
“….here is my prediction for climate going forward, this decade will be the decade of cooling.”
– Salvatore del Prete, 11/23/2010
http://ourchangingclimate.wordpress.com/2010/10/20/andrew-dessler-debating-richard-lindzen/#comment-8875
Not so much. The AMO did enter its downcycle somewhere in the years 2000-2010. The PDO had a sudden anomalous upward shift in about 2013 that has been masking the cooling, but it is living on borrowed time.
He who laughs last laughs the loudest. We shall see if Salvatore or you has the last laugh. My bet is on Salvatore.
Here is what I wanted to say in the previous post which is the mainstream or semi mainstream when it comes to the climate will never oppose a trend that has been established.
They will never call for a reversal they just go with what ever happens to have been taken place because it is safe.
“Dont you realize that, the warming that has now ended, that took place last century was one of the weakess warming periods the earth has undergone ,lets take a time period ,of the last 20,000 years.”
– Salvatore del Prete, April 7, 2011
https://bbickmore.wordpress.com/2011/04/05/roy-spencers-non-response/
Dr. Spencer not included in my above statements.
I have no way out because the sun is now meeting my criteria which I said would lead to cooling.
So if the sun remains as it is over the coming years and temperatures stay like they are I will have to admit to being wrong.
It is all on the line for me sink or swim.
Salvatore
How come you can’t look backwards and compare changes in solar conditions with global temperature anomalies? Is there a strong correlation or not?
There is in my opinion look at the Maunder Minimum, Dalton Minimum and look at the global temperature trend . Look at the medieval solar maximum look at the temperature.
Global cooling has started, and it will be here for sometime to come. All the factors that control the climate are now in, or going toward a colder phase.
– Salvatore del Prete, December 31, 2010
http://www.drroyspencer.com/2010/12/dessler-and-spencer-debate-cloud-feedback/#comment-8257
SUNSPOT “MINIMA” – 14C ANOMALIES
Damon AD 1880-1930 Global Temp 0.5 oC lower (Jones, 1988)
L
I
A
5
Dalton AD 1795-1825 “Year Without Summer” 1813
Maunder AD 1650-1710 Little Ice Age, Global Temp 1-2 oC lower
Sporer AD 1420-1540 Second Little Ice Age event
Wolf AD 1280-1340 The Great Drought
Greek 330 BC
Homeric 750 BC
Egyptian 1370 BC
Silver Lake 1870 BC
Noachan 2850 BC
The Greek and Homeric events together have been called the “Hallstat Period”
– a precurson or the Little Ice Age. REF
All names informal, those in bold are in common usage.
Salvatore…thanks for info.
None of these episodes were global, Salvatore.
Thus they represent a random shuffling of heat, not an addition of heat.
Why are you doing this David A. when you know you are deliberately lying?
YOU have been shown that the MWP,LIA were global in effect,but you never accept the published evidence given to you in the past.
You are here to fog it up.
Also, the MWP and LIA were not global in extent:
—
“There were no globally synchronous multi-decadal warm or cold intervals that define a worldwide Medieval Warm Period or Little Ice Age.”
— “Continental-scale temperature variability during the past two millennia,” PAGES 2k Consortium, Nature Geosciences, April 21, 2013
http://www.nature.com/ngeo/journal/v6/n5/abs/ngeo1797.html
David refers to a paper that irrationally defines a very tight definition by using the words “GLOBALLY SYNCHRONOUS”
“There were no globally synchronous multi-decadal warm or cold intervals that define a worldwide Medieval Warm Period or Little Ice Age.”
Nobody has said it was that way anywhere,it is a dishonest attempt to avoid HUNDREDS of published science papers showing that MWP,LIA was indeed global. Those papers themselves NEVER said it was synchronous globally.
Meanwhile the paper you linked to also sated in the abstract:
“but all reconstructions show generally cold conditions between ad 1580 and 1880, punctuated in some regions by warm decades during the eighteenth century. The transition to these colder conditions occurred earlier in the Arctic, Europe and Asia than in North America or the Southern Hemisphere regions.”
Oops… there goes your misleading claim…….
The purported “Global Warming” of today isn’t “globally synchronous”. Just look at the graph of the NH versus the SH:
https://tinyurl.com/ybyzokmv
‘Synchronous’ refers to the sign of change, not the amplitude. You can see synchronization over the longer term, with the mid-century flattish period evident in both hemispheres.
http://tinyurl.com/ybatwbnb
David’s argument is that MWP (and LIA?) were not globally synchronous – that various large-scale regions (or hemispheres) were not all warming at the same time over century-scale periods.
I don’t agree. While the preponderance of evidence might support that view, I don’t think it’s conclusive.
There is a region in the North Atlantic that bucks the overall warming trend from the beginning of the 20th century. David’s argument is, to be more (qualitatively) accurate that the MWP warming is much more patchy than modern.
Hard to know. Proxy ‘thermometers’ have less resolution than the modern instrumental record.
by backwards I had meant the last 20 years going back to 1998 or so.
Salvatore
We have UAH records going back almost 40 years. Do solar variations match up or not?
Yes they match because up to year 2005 the sun was very active which equates to warm.
Post 2005 the sun has been inactive which should lead to cooling especially now that the sun is becoming very inactive.
Salvatore thought cooling began 15 years ago…..
“Your conclusions are in a word wrong, and that will be proven over the coming years, as the temperatures of earth will start a more significant decline (which started in year 2002 by the way)….”
– Salvatore del Prete, Reply to article: IC Joanna Haigh – Declining solar activity linked to recent warming, 10/8/2010
http://climaterealists.com/index.php?id=6428
” Theres no way to prove it because there is no fingerprint of anthropogenic warming ”
Yes, but there may be a way to set an upper limit on man’s influence:
The fact that your current UAH graph shows last month was cooler than the peaks in 1988, 1991 and 1995 shows that any man caused warming is less than the natural noise/variations over that 29 year period.
Thanks
JK
Jim
What is the the natural noise/variations we should have expected over that 29 year period?
Jim
How do we know that minus AGW there wouldn’t have been a natural cooling trend during that period?
And why start your comparison in 1988? Does including the full record weaken your argument?
“How do we know that minus AGW there wouldnt have been a natural cooling trend during that period?”
Because the IPCC said we are warming. /sarc
jim says:
“The fact that your current UAH graph shows last month was cooler than the peaks in 1988, 1991 and 1995 shows that any man caused warming is less than the natural noise/variations over that 29 year period.”
You have a major misunderstanding of the science.
David A. Why don’t you enlighten us,instead of your boring … you are wrong, or stupid or you don’t understand, lines.
You quickly become a bore,as many here are barely noticing your juvenile ankle biting. Some quit replying you for a good reason,as your communication skills are bad!
With your big PHD in your back pocket, it should be easy for you to make interesting cogent comments.
Sun: Do you have anything but personal insults?
Like maybe some science?
David,
All you have is personal insults, yet you deride others from doing the same. Can you spell hypocrite? D-a-v-I-d!
Fortunately, you’re not very good at it, much as you practice.
David A hypocrite,
your reply to Jim was this:
“You have a major misunderstanding of the science.”
You say he doesn’t understand science,I then ask if you can elaborate on why you think he doesn’t understand.
You reply to me with the same nothing you gvbe to Jim.
Nothing.
Meanwhile I didn’t insult you at all,as I wrote:
“David A. Why dont you enlighten us,instead of your boring you are wrong, or stupid or you dont understand, lines.”
I was talking about what you write to others.
Dr. Roy says: Oh, that’s right. I’m on the wrong side of the issue. The reviewers would have said, “C’mon, that’s a politician generalizing. You can’t get a peer-reviewed scientific paper out of that!”
Excellent point!
“The academic paper that claimed penises cause climate change was reviewed and approved with no changes by two peer reviewers at a scientific journal.”
http://freebeacon.com/issues/penis-causes-climate-change-hoax-paper/
jimc,
Ah, but they were only conceptual penises!
Just like Gavin’s conceptual knob, which regulates global temperatures. Twiddling his real knob might serve to increase his breathing rate, but not much more.
Or climatology’s conceptual GHE, which David Appell assures us is only a metaphor.
So many concepts. So little fact. Ain’t climatology grand?
Cheers.
At least we have honed it down to “change”.
MF: Glad to see I am in your head.
David,
Maybe you’re in fantasy land again. Your ESP and parapsychology skills might need a brush-up.
I suppose your tenuous grip on reality is better than no grip at all.
What I your opinion? Apart from the GHE being a metaphor, or course!
Cheers.
All scientific models are metaphors.
You’d know that if you knew any science.
g*e*…”The reviewers would have said…”
The reviewers would actually have said, “Oh, it’s Spencer again, let’s see what we can do about holding up his paper, or disqualifying it altogether”.
They have already done it to John Christy at the highest level in the IPCC. They actually bragged about doing it in the Climategate emails.
They did this to Christy? Let’s see your evidence of this, GR.
I’m sure you don’t have any. But go ahead and try.
@Appell: Search “christy” here:
http://di2.nu/foia/foia.pl
Roy: I’m sure you realize this, but of course your UAH measurement papers are going to take a lot more time to go through peer review — they involve many very technical calculations that require expert agreement. It’s so esoteric there are few qualified to get down into the weeds, as required.
You know this. But it still doesn’t excuse releasing UAH v6.0beta before publishing — who else does such a thing?
David,
in defense of Dr. Spencer, I think he was talking about a study critiquing a statement by someone like Al Gore.
“The reviewers would have said, Cmon, thats a politician generalizing. You cant get a peer-reviewed scientific paper out of that!
Al Gore submitted a scientific paper for peer review?
David,
Did he really? I suppose that some journal might accept a paper from a deluded politician who stated that the temperature of the interior of the Earth was millions of degrees.
If he included a reference to climate change occurring in response to conceptual penises, his chances of publication would practically be assured.
Just look at all the nonsense that people such as Schmidt, Mann, Santer and all the rest, manage to get accepted for publication. All dreams and fantasy, but passed peer review nevertheless.
Gore would look good by comparison, I’m sure. He even made a mockumentary, I believe.
I prefer your statement that the GHE is a metaphor. Seems reasonable to me.
Cheers.
Citation?
Mike…”Just look at all the nonsense that people such as Schmidt, Mann, Santer and all the rest, manage to get accepted for publication. All dreams and fantasy, but passed peer review nevertheless”.
Schmidt and Mann sat as editors of the Journal of Climate at one time. The editor in chief of JOC at the time was climate modeler Andrew Weaver, now sitting as a Green party leader/politician in the BC legislature in Canada. His party now has the balance of power in a minority government with 3 seats and he’s talking as if he has a mandate.
Gordon, let’s see you discuss the science, and not make random and unproven claims about journal editors.
David Appell,
What’s wrong with making making random and unproven claims?
Schmidt claims to be a scientist. Mann claimed to have been awarded a Nobel Prize. Witless Warmists claim that increasing the amount of CO2 between the Sun and a thermometer makes the thermometer hotter!
Wayward Warmists make all sorts of random and unproven claims. Maybe you want to claim that the claims are not random, but intentionally fraudulent? Where’s your proof, David?
Cheers.
No. It was a hypothetical. If Al Gore had made an inaccurate statement about global warming, and Roy had written a paper that pointed out the mistake, and then submitted it for peer review, the reviewers would have told Dr. Spencer,
” Cmon, that’s a politician generalizing. You can’t get a peer-reviewed scientific paper out of that!”
This is his claim and he might be right.
Snape, Why discuss an unlikely hypothetical, let alone pretend what anyone else would do?
David
Geez! It wasn’t my hypothetical and I never wanted to discuss it. I was trying to clear up a misunderstanding you had about Dr. Spencer’s comments.
ok — my bad. Sorry.
The endless reexamination of historical weather records is a completely pointless waste of time, effort. and money.
The only thing that you can say with certainty about a trend is that you have no idea if it will continue.
Nobody has ever managed to successfully predict the future, based on past weather observations.
A 12 year old child can do as well, if not better than a climatologist, at predicting future climate states (whatever that’s supposed to mean), using naive persistence projections!
Foolish Warmists are a pack of deluded charlatans. Cut off their funds, and give the money to real scientists. Or nurses, or teachers, or police. Heck, you might even spend a billion or two fixing spillways, or clearing highways blocked by landslips.
Santer and his motley crew share a common delusion – convinced that increasing the amount of CO2 between the Sun and a thermometer on the surface will make the thermometer hotter. Thermometers respond to heat, not CO2, which provides no extra heat at all.
A real scientist might observe rising temperatures, and cast his mind about, wondering why. He might even write a peer reviewed paper, setting out his hypothesis as to the origin of such heat, and providing examples and measurements which seem to support his hypothesis.
Anathema to foolish Warmists who screech “The science is settled.” Good. They don’t need any more money for researching settled science then, do they?
No doubt the universe is unfolding as it should. I predict Nature will win.
Cheers.
“No doubt the universe is unfolding as it should.”
And how do you, or the Desiderata, know this? You can read God’s mind now?
Actually there’s a rather voluminous book about it. I didn’t think it was being kept secret.
Which book is that?
You don’t know,David A?
WOW!
You think the bible is factual??
Wow, David thinks I said something about a book I never mentioned at all.
You are funny.
David Appell,
Why would you think my assumption Is wrong? Have you a better one?
Foolish Warmist. I decline to respond to your other stupidity.
Cheers.
Mike Flynnn says:
“Why would you think my assumption Is wrong?”
Because I’m a skeptic.
You should try it sometime.
David,
Thanks for your interest. I’ll do as I wish. Your unsolicited opinion is worth what I paid for it – precisely nothing.
I agree with your opinion that the GHE is a metaphor, however. Maybe one day you could explain what the metaphor relates to.
No GHE. CO2 heats nothing.
Cheers.
More running, MF. More dishonest running.
“Mike Flynn” wrote:
“A real scientist might observe rising temperatures, and cast his mind about, wondering why. He might even write a peer reviewed paper, setting out his hypothesis as to the origin of such heat, and providing examples and measurements which seem to support his hypothesis.”
“The Artificial Production of Carbon Dioxide and its Influence on Temperature,” G. S. Callendar, Quarterly Journal of the Royal Meteorological Society v64 Issue 275 pp 223-240 (April 1938).
https://www.rmets.org/sites/default/files/qjcallender38.pdf
David,
Obviously, I wasn’t referring to that paper. CO2 doesn’t make thermometers hotter.
By the way, you forgot to mention that the discussions at the end of the paper showed unanimous disagreement with Callendar’s ideas, methodology, and assumptions, to one degree or another, by scientists. Hardly a ringing endorsement.
I’ve no doubt Callendar was intelligent – it’s just that he was wrong. That’s the trouble with trying to appear erudite by posting links – someone might actually read them.
Callendar was a steam engineer. I believe Pachauri of IPCC notoriety was a railway engineer. Any connection, do you think?
Maybe you should stick with your statement that the GHE is a metaphor?
Cheers.
Mike Flynnn says:
“CO2 doesnt make thermometers hotter.”
Prove this claim. I dare you.
David,
Prove it does. I dare you. Foolish Warmist.
Next you’ll no doubt be demanding that I prove that unicorns don’t exist, or that Michael Mann is not deluded!
Demand away – i have no intention of dancing to your tune. You’re just too thick to realise it, I guess.
Cheers.
I knew you couldn’t prove your claim.
That’s very typical of everything you write.
If you say so, David, if you say so.
Cheers.
You made a claim.
Now you can’t prove it.
Do you really think no one notices your games?
Flynn is playing you,David A. you didn’t notice the obvious?
Sun: Please try to stop your obsession with me.
Thanks.
Davie, maybe if you sought a cure for your addiction to pseudoscience, we would not make fun of you so much.
(But, on the other hand, it IS fun.)
Yes,
And the many thousands of papers since Callendars, that confirm and expand this idea, giving ‘ providing examples and measurements which seem to support his hypothesis’.
All of these can be equally dismissed with a wave of the hand by a dude on a blog?
Nate, the dude that has to use his whole hand is a wimp!
I can dismiss “papers of ominous pseudoscience” (poop) with my little toe.
Nate,
I just wave my imaginary hand to dismiss the imaginary fantasies of foolish Warmists. Saves actual physical effort.
I characterise Completely Random And Pseudoscientific publications as “crap”, rather than “poop”. Others may differ, of course. Even Supremely Hubristic Intellectual Twaddle, or Slimy Hopeless Inferior Trivialities amount to the same thing, so I won’t argue.
David Appell describes the GHE as a metaphor- possibly for a banana. What’s your considered opinion?
Cheers.
MF, you can wave way loads of actual research and evidence away with your imaginry hand and Ger* can with his little toe.
So good to know that your posts shouldnt be taken seriously and can be disregarded.
As we wave away your fatuous nonsense.
Davie, I quickly scanned the Callender paper. He made the usual mistake of assuming that CO2, absorbing IR, would be magically turned into a “heat source”. Boring.
I did smile briefly at “sky radiation”. That sounds even scarier than “back-radiation”. I’m surprised Warmists didn’t grab that phrase. (“Run for you lives, SKY RADIATION is falling!”)
But the paper was not nearly as funny as your favorite one, where the Earth could warm to 800,000K, due to 965 Watts/m^2 from the Sun.
Now, that WAS hilarious.
You aren’t even close to Callendar’s league.
Thanks Davie, but Callendar does get some of the credit. After all, we learn from the mistakes of others.
You’re still trying to play in the wrong league.
I’m in science. You must be in a bowling league when your not in pseudoscience.
(Got any more hilarious pseudoscience papers? The 800,000K still makes me chuckle!)
climatology + criminology = a nice little earner
Harry, I’ve responded to you in the past, but you never answer. Do you have any game, or only snark?
Mike…”The endless reexamination of historical weather records is a completely pointless waste of time, effort. and money”.
Not to charlatans who have an investment in controlling public opinion on the pseudo-science of catastrophic warming. Not to mention the lucrative rewards from being onside.
Is someone controlling your opinion, Gordon?
If so, they’re doing a lousy job of it.
THINK FOR YOURSELF!
David Appell,
Maybe he is?
Cheers.
The Earths surface receives an average of 240 W/m2 from the Sun.
Yet the Earths surface radiates an average of (at 15 C) 390 W/m2.
Explain.
David Appell,
Once again you demand that I explain something to you.
No. I do as I wish.
Cheers.
I demand nothing. I simply pose questions that, you, if you were a curious student of science, seeking to learn, would find intriguing enough to address.
But you’re not a curious student of science — that’s very clear. You have no interest in learning anything.
David Appell,
Thanks for your input.
You’re right. You have nothing to offer me. Maybe another time.
Cheers.
Mike, are you really claiming that adding CO2 to a column of air between the sun and a thermometer placed on an infrared absorbing black surface will not read a higher temperature? Because it DOES. Simple second year student engineering calcs will show you. You are kind of right, not to do with the CO2 heating anything, but a lot to do with the CO2 being warmed a bit by the infrared from the black surface, and the old q=K(Thot^4-Tcold^4) laws. The amount is really too small to show in the Bill Nye, Mythbusters’ experiments due to conduction and convection to surroundings…but your flat earther approach to this topic is getting stale and your being a denier of basic science is a disservice to those who are labelled “deniers” simply because they do not agree with the magnitude of the warmunists hype.
DHMacKenzie,
Yes. Exactly. You cannot show your calculations, can you? Because they don’t exist.
I dont know who denies basic science, apart from foolish Warmists who believe in the GHE myth – undefined as it is.
I just don’t believe in the non-existent and undefined GHE. As even David Appell (and others) say, the GHE is a metaphor – for something unspecified. This is your science?
If you’re so certain that I’m wrong, it should be easy to show an experiment demonstrating how increasing the amount of CO2 between the Sun and a thermometer on the surface, causes the thermometer to get hotter.
Or maybe you could show how reducing the amount of CO2 between the Sun and a thermometer on the surface, causes the thermometer to become colder.
You might care to explain the calculations that show the Earth’s temperature being above that of molten rock, just below the melting point of rock, just above the boiling point of water, just above the freezing point of water, and accounting for current surface temperatures between 90 C and -90 C.
Some calculation, I would think. Certainly nothing to do with the non-existent GHE.
Show me some facts. No GHE whatsoever. Not even a teensy, teensy bit. None.
Cheers.
Flynn 4:40am: “If you’re so certain that I’m wrong, it should be easy to show an experiment demonstrating how increasing the amount of CO2 between the Sun and a thermometer on the surface, causes the thermometer to get hotter.”
Many commentators here are certain Flynn is wrong because the experiments easily demonstrating how increasing the amount of CO2 between the Sun and a thermometer on the surface, causes the thermometer to get hotter have already been performed, the data replicated in the lab and outside.
The experiments also easily demonstrate how reducing the amount of CO2 between the Sun and a thermometer on the surface, causes the thermometer to become colder in the lab and outside.
It is obvious from comments, Flynn only has a political agenda which must ignore these experimental facts in order to gain adherents; for Flynn science is never allowed to influence his political agenda.
In response, Flynn has not conducted any experiments supporting his views. At all.
the authors decided Pruitt meant “there has been zero warming” for exactly 20 years
Did they? I couldn’t find the “quoted” phrase, or argumentation to support that interpretation in the paper.
Are you quoting a media article, Roy?
Yes, barru I am just as puzzled as you are that Roy has put that statement in quotes.
As you point out there is no reference to zero warming anywhere in the Santer paper. Instead the authors found that the probability of just natural cycles causing the measured trends was close to zero.
I would be interested to know where Roy obtained that phrase. A cursory Google search shows the closest is Ted Cruz (there has been zero warming for 17 years”) and Glen Beck (10 years).
So essentially Roy employs the philosophy he decries by putting words into the mouths of the authors via his own interpretation.
It makes his statement “interprets in a specific way, dissects it, destroys it, and in the process leaves the impression that you are an idiot who should not be listened to” very relevant in a self referential way.
The only significant difference for Roy’s use of this tactic is the first word in the quote above which should read “misinterprets…….. “.
Dr Spencer,
If I only knew earlier that I could get peer-reviewed scientific papers by evaluating the silly climate claims made by politicians (Al Gore, Barack Obama, et al.) over the years.
From your list of published papers here…
http://www.drroyspencer.com/2014/05/yes-i-do-publish-papers-too/
Spencer, R.W., 2008: An Inconvenient Truth: blurring the lines between science and science fiction. GeoJournal (DOI 10.1007/s10708-008-9129-9)
“…Former-Vice President Al Gores movie An Inconvenient Truth offers a particularly extreme interpretation of the state of global warming science”
Seriously, Barry. It is a lot harder to get a paper past peer review when you take a position contrary to the editors who review the papers. It is an impedance, ironically not unlike the impedance produced by “greenhouse” gases that makes it more difficult for surface radiation to make it to space.
Think of Dr. Spencer as the surface emitting papers instead of photons, and the atmosphere as composed of the reviewers. Add more hostile reviewers to the atmosphere, and Dr. Spencer’s papers have a harder time getting through.
You’re the second person to say this, as if it had something to do with Dr Spencer’s quote and my reply to it.
He sarcastically professed ignorance that papers rebutting the “silly claims” of politicians (he named Al Gore) could be published. Seems he forgot that he has already had one published – rebutting Al Gore.
Nature is rather significantly higher stature than GeoJournal, a publication which does not even exist anymore in its original form. If you think Dr. Spencer could get that paper through the gates of that well-fortified warmist fortress, I have a bridge I would like to sell you.
Nature Scientific Reports is like a Harvard Extension school course. It has a famous name attached but other than that….
Other than that, the famous name is officially attached to it, and they have a vested interest in maintaining its reputation.
Whether GeoJournal has a lower bar than Nature is beside the point Dr Spencer made.
I don’t think so. Whether its reputation is warranted or not, getting something published in Nature is a BIG deal. Getting something published in Geojournal… not a big deal.
Whether GeoJournal has a lower bar than Nature is beside the point Dr Spencer made.
Why are you shifting the goalposts?
Why are you inordinately concerned with a precisely literal interpretation of an offhand, sarcastic remark? Does it in any way contradict the fact that scientists who disagree with the narrative are systematically prevented from presenting their results in the most highly recognized journals, while authors of dubious talent and poor scholarship are provided with express entry?
Inordinately concerned? If only I’d written about it more than once!
</offhand remark>:
As a scientist in a different field than climate science, I can assure you the attack on Sec. Pruitt is based on “parsing of words” not scientific thought. I need not remind anyone posting on Dr Spenser’s blog that when a conclusion is accepted, followed by a search for supporting data–such endeavor has Nothing To Do With the Scientific Method.
All discussions with persons holding this view are worthless and fruitless and devoid of true advancement.
If you’re really a science, then start presenting science.
*scientist
He did, Davie. You just can’t recognize science.
“…when a conclusion is accepted, followed by a search for supporting datasuch endeavor has Nothing To Do With the Scientific Method.”
No science.
Typical.
(Davie doesn’t understand that the “scientific method” is a major part of science!)
g*e*r…”(Davie doesnt understand that the scientific method is a major part of science!)”
Appell thinks science is done by peer review and consensus.
Gordon, you’re already admitted you don’t know freshman physics.
So tell us, why do you think you get an opinion on the physics of climate change?
David Appell,
Maybe because “climate change” is a stupid and pointless term, used by foolish Warmists to harvest money.
Climate is the average of weather. Weather changes. Climate, being the average of past occurrences, also changes.
What “physics” do you think is involved in calculating the average of a set of numbers?
None at all. Foolish Warmist. “Climate science” is an oxymoron.
Cheers.
Mike Flynn says:
May 23, 2017 at 5:16 PM
“I hate to bore you the real science, but the transmittance of the atmosphere increases as the amount of GHGs in it drops.”
http://www.drroyspencer.com/2017/05/uah-global-temperature-update-for-april-2017-0-27-deg-c/#comment-247988
DA…”If youre really a science, then start presenting science”.
He just did. With your seriously biased climate filters turned on you won’t be able to receive it.
No evidence produced, just an opinion.
T. Johnson, which view are you talking about? This one,
“such endeavor has Nothing To Do With the Scientific Method.”?
David Appell wrote –
“All scientific models are metaphors.”
He can’t actually define which scientific models he is referring to, or what they are metaphors for. I suspect he’s trying to justify previously saying the GHE is a metaphor, and trying to deny, divert and confuse, by implying that the GHE is a scientific model, or metaphor, or non-existent or something. He may correct me, of course, if I’m wrong.
Quite apart from all that, the main incorrect assumption David promotes is that climatology is a science (which is patent nonsense, of course). Climate is the average of weather, and even David could calculate an average – I assume.
The second assumption might be that the GHE is actually defined in any scientific fashion. David claims that it is a metaphor, but cannot explain further – what a surprise!
Be that as it may, nobody has ever managed to demonstrate that increasing the amount of CO2 between the Sun, and a thermometer on the surface, makes a thermometer hotter.
No GHE. None. Complete nonsense, and no amount of fervent belief will convert fantasy to fact!
Ah, the rich tapestry of life. People like Ben Santer apparently going out of their way to insult a person who might have some input into decisions on continued funding of fools such as Ben Santer. He seems to have remarkably cavalier attitude to the “golden rule”. “He who has the gold, makes the rules”
Maybe David and Ben Santer think they are latter day Gods, worshipped by all and sundry. Of course they demand that the worshippers fund their useless so-called research. It appears the Ben Santer might specialise in the statistical analysis of sea called “climate data sets”.
In other words, the endless reanalysis of pointless weather observations – mainly temperatures.
I very much doubt that David or Ben Santer can point to a single measurable benefit to humanity at large from all this “climatological” research. I Invite them to try, if they wish to appear foolish
Cheers.
Mike Flynn admits there is a greenhouse effect:
May 5, 2017 at 9:22 PM
“Less GHGs less impediment to radiation reaching the surface from the Sun, or being emitted by the surface to outer space.”
http://www.drroyspencer.com/2017/05/uah-global-temperature-update-for-april-2017-0-27-deg-c/#comment-245860
David Appell,
There, there, David.
Don’t get upset.
I understand.
Cheers.
You stepped in it. No reply, as usual.
David Appell,
I always appreciate your interest.
Thank you so much.
Cheers.
Spencer, you write:
Then why do you “believe” it? Based on what observations …?
This is simply not true. And I don’t know why people keep claiming it. The signal (‘fingerprint’) to look for is pretty obvious. All you need in order to find out what it is, is to read what the “enhanced GHE hypothesis” is actually postulating as its warming mechanism: “the raised ERL” (‘effective radiating level’):
http://www.climatetheory.net/wp-content/uploads/2012/05/greenhouse-effect-held-soden-2000.png
Take careful note of what it says: As Z_e (the ERL) moves up the tropospheric column, “the effective emission temperature (T_e) remains unchanged.”
THIS is the warming mechanism to look for. The “greenhouse” warming mechanism, distinct from all other warming mechanisms, because it works specifically by reducing the OLR at any given altitude-specific temperature between surface and tropopause. The OLR stays unchanged while the temps go up. Over time. THAT’S the signal. THAT’S the fingerprint.
And so what does the relevant, available observational data has to say about it? Do we by any chance see the clear, systematic manifestation of this particular signal in the real Earth system? The OLR at the ToA trending significantly lower than the tropospheric temperatures (corresponding through the Stefan-Boltzmann equation) over time …?
The short answer: No. Not at all!
The radiation flux data at the ToA (ERBS+CERES) over the last 32 years shows us that the OLR-T_tropo relationship has stayed completely natural, meaning that they’ve simply tracked each other tightly over time, just as one would expect in a world where there is NO discernible “GHE enhancement” going on:
https://okulaer.files.wordpress.com/2017/03/erbsceres-vs-uah1.png
https://okulaer.files.wordpress.com/2017/05/olr-vs-dwlwir-vs-tlt.png
What, then, is behind the warming?
There’s a small, but significant positive imbalance at the ToA, which means that more heat is coming IN than going OUT, which in turn means that there will be a net accumulation of energy inside the Earth system. Most of this ‘excess energy’ ends up in the ocean (+OHC), but some of it also stores up at the surface and in the troposphere (+T_sfc, +T_tropo).
This is the cause of ‘global warming’.
Now, from the same radiation flux datasets as above (ERBS+CERES), the evidence is very clear in suggesting that our current positive heat imbalance at the ToA is the result SOLELY of an increase in the heat IN (Q_in: ASR, net SW, TSI minus albedo), and rather countered somewhat by a parallel increase also in the heat OUT (Q_out: OLR, net LW).
What we can plainly read from this, when comparing this radiation flux data with (significantly, tropospheric) temperature data, is a straightforward causal chain that goes like this:
+ASR => +T => +OLR
The increase in solar heat input (ASR) causes the increase in temperature (T), which in turn naturally causes an increase in Earth’s heat output to space (OLR), as simply a direct radiative effect.
The idea of the “enhanced GHE”, however, doesn’t really expect a positive imbalance at the ToA to be observed at all. The ASR, after all, is assumed to stay relatively constant over time, and so is the OLR (remember, Z_e rises, but T_e stays unchanged => +T; that’s the postulated “greenhouse” warming mechanism). If ANYTHING, if there is a positive imbalance to be observed, it will have to be the result of a reduction in OLR rather than an increase in ASR. If an “enhanced GHE” is to be the culprit.
But we just don’t see this at all …
— Kristian says:
May 25, 2017 at 11:33 PM
Spencer, you write:
Nevertheless, as a lukewarmer I tend to believe about half of recent warming is indeed human-caused. Theres no way to prove it ()
Then why do you believe it? Based on what observations ?–
Well doesn’t IPCC say at least 1/2 of warming is caused by CO2
Or maybe it’s 1/2 warming since mid 20th Century is caused by rising levels of CO2 [which is assumed to be solely caused by human fossil fuel use].
So Spencer say “about” 1/2 recent warming is human-caused [which he probably means mostly human added Co2 to atmosphere by fossil burning].
I tend to assume [or believe] that less than 1/2 of warming is due to human activity- everything that humans are known, or imagined known, and/or any and all unknown unknowns.
So things like increased farming needed to feed 7 billion people. Human pollution in all it’s aspects [real pollution not CO2 emissions]. As guess we probably have more primitive
people doing their traditional lifestyle stuff [ having “more” due to them not dying off from diseases, plagues and wars, etc plus their general stupidity is probably diminished- so could this counts as “human caused”].
And the added greenhouse gases, including CO2.
And I’m unaware of anything humans do which could cause a cooling effect- though it’s possible- and I wouldn’t count planting trees as something causing cooling. Though if increase human population add to warming, then the collective action of politicians could count a cooling effect by their variety of actions which have resulted in tens to hundreds million people which they have caused to suffer and die. And also got things like China’s one child oppression, and we got the governmental assisted abortion efforts. But one shouldn’t think that the evil, inept, and forever lazy politicians are only causing cooling effect [or have net cooling effect], but merely that their vast carnage over the years could be counted as a cooling effect.
— () there is no fingerprint of anthropogenic warming ()
This is simply not true. And I dont know why people keep claiming it. The signal (fingerprint) to look for is pretty obvious. All you need in order to find out what it is, is to read what the enhanced GHE hypothesis is actually postulating as its warming mechanism: the raised ERL (effective radiating level):
http://www.climatetheory.net/wp-content/uploads/2012/05/greenhouse-effect-held-soden-2000.png
Take careful note of what it says: As Z_e (the ERL) moves up the tropospheric column, the effective emission temperature (T_e) remains unchanged.–
Well perhaps this is why IPCC say at least 1/2 caused by human caused CO2. Or if it was measurable they would say they are certain all is caused by human CO2 emission.
Or lacking any evidence, their welfare depends upon them selling their product.
Or I assume there is a degree of uncertainty in the measurements- and they are capitalizing on this uncertainty. They are politicians. Well paid politicians who are unaccountable.
gbaikie says, May 26, 2017 at 3:09 AM:
If you’ve read the AR5, then you would know that the IPCC do in fact assume (according to their “best estimate”) that ALL ‘global warming’ (100 % of it) since the 1950s is caused by us. Which goes directly against all relevant observations from the REAL Earth system … IOW, the claim is all model-based. Which is astonishing and appalling.
Kristian writes incorrectly 11:33pm answering his own question with a self-cite: “And so what does the relevant, available observational data has to say about it? Do we by any chance see the clear, systematic manifestation of this particular signal in the real Earth system? The OLR at the ToA trending significantly lower than the tropospheric temperatures (corresponding through the Stefan-Boltzmann equation) over time…? The short answer: No. Not at all!”
The CERES Team publication(s) report the longest meaningful data observed in the various CERES instrumental records shows a slight decrease in Earth OLR. The short answer by observed meaningful data is actually YES to Kristian’s questions.
The true unknown is why Kristian persists in making a claim opposite to the CERES Team publications (Loeb et. al. 2016 Table 4).
You know, CERES have since finalized and published the full dataset, AFTER the paper you’re referring to came out. That is, the very same dataset they use and discuss in that paper. But you know that, of course. Wouldn’t try to pretend otherwise, would you …?
Here’s the period in question from Loeb et al., 2016 (light green rectangle):
https://okulaer.files.wordpress.com/2017/05/erbsceres-vs-uah1.png
And here’s the EBAF Ed4 “Data Quality Summary”:
https://ceres.larc.nasa.gov/documents/DQ_summaries/CERES_EBAF_Ed4.0_DQS.pdf
Enjoy!
Kristian 10:16am, first you need to acknowledge their differences from your charts. It would be really cool then if you could extend the work of CERES Team in between their reports as new data is added.
To show you can do that, at the needed level of expertise and confidence, you will first have to show you can duplicate their de-seasonalized monthly anomaly down trend OLR chart in Fig 7 for all 3 instruments.
You will also have to show you can then replicate their Table 4 for all 3 instruments including the confidence intervals. As they write, your “most challenging measurement (in the LW) is during daytime, as it involves removing the contribution from the SW portion of the TOT channel with the SW channel radiance measurement.” Their work to do that is explained in remainder of that paragraph so as to enable your replication.
Ball4 says, May 26, 2017 at 11:21 AM:
I don’t “have to show” anything. It’s the EBAF Ed4 dataset, Ball4. They use Ed4 data. And now it’s officially published. Quality checked. For everyone to use. There are no “differences” from what I show. It’s the same data.
Fig.7 vs. the older (and still nearly identical) EBAF Ed2.8:
https://okulaer.files.wordpress.com/2016/08/olr-30-30-paper.png
And the same EBAF Ed2.8 data vs. UAHv6 data for the 30N-30S latitude band, 2003-2014:
https://okulaer.files.wordpress.com/2016/08/tlt-30-30-uahv6.png
Same, only for 2000-2016:
https://okulaer.files.wordpress.com/2016/08/tlt-30-30-2000-2016-uahv6.png
And globally:
https://okulaer.files.wordpress.com/2016/08/uahv6-tlt-90-90.png
I showed you these plots already ages ago. You can check them for yourself. All data lies publically available online.
And still you’re on about how this paper somehow disagrees with my charts. When it’s evident it doesn’t. It’s clear it does the opposite. It verifies and validates them. Yes, the OLR went down for a while. Because the T_tropo went down for a while. OLR tracks T_tropo over time.
I’m not saying OLR can’t be observed to go down during particular intervals. I’m saying it isn’t observed to trend significantly lower than T_tropo over time. And it isn’t …
Done.
Kristian 1:26pm: “I’m not saying OLR can’t be observed to go down during particular intervals.”
The record in Fig. 7 & Table 4 shows OLR anomaly has trended down monotonically Kristian. For the entire statistically meaningful dataset of 3 different observing instruments.
What has happened since then (~2 years) has not been published by Loeb et. al. If, as you say the trend has actually meaningfully changed in the more recent EBAF data that would be of major interest. If true then you should be the first to get your work into press.
The currently published CERES Team observed data does not agree with your conclusion: “The increase in solar (energy) input (ASR) causes the increase in temperature (T), which in turn naturally causes an increase in Earth’s (energy) output to space (OLR), as simply a direct radiative effect.”
btw, when Kristian writes: “I dont “have to show” anything.”
True, if Kristian does not care about his credibility. To achieve credibility, Kristian will need to replicate CERES Team published work.
To achieve scientific notice, Kristian will need to actually publish up to date extensions of their work. IIRC Dr. Loeb emailed Norman in the past: he doesnt have time to keep up with blogs.
Kristian,
You wrote –
“Theres a small, but significant positive imbalance at the ToA, which means that more heat is coming IN than going OUT, which in turn means that there will be a net accumulation of energy inside the Earth system.”
What a load of rubbish! No magical one way insulator. No “accumulation”.
The Earth has cooled for four and half billion years. Cooled. No sign of heat accumulation there.
You can’t even define this “greenhouse effect”. Nobody can, of course, because increasing the amount of CO2 between the Sun, and a thermometer on the surface, does not make the thermometer hotter.
No GHE. No CO2 heating. None.
These sorts of things only exist in the foolish Warmist fantasy world.As David Appell, another foolish Warmist said, the GHE is a metaphor. For what, nobody knows!
Maybe you could throw in some more sciency, yet meaningless, acronyms. TOA, GHE, ASR, ERL, OLR, LWIR, DWLWIR, and all the rest of the nonsense.
Try heating something with CO2. Nope, doesn’t work. Tell us all about how the surface gets hotter at night, due to all that back radiation. Nope, that doesn’t work either. Pity.
Cheers.
Most people are here as students of science, to learn.
You, Mike Flynn, are here to obscure, deny, and lie.
It’s nothing to be proud of. In fact, it’s shameful.
David Appell,
Thank you for your interest.
Cheers.
Mike,
We’re still all waiting for your explanation of why the T_sfc of Venus is higher than that of Mercury, even with a much smaller heat input from the Sun.
Still intent on “dismiss, deny, divert”?
Kristian,
Wait on, lads. I’ve already told you, but you confused yourselves with bowling balls and marbles. Maybe you lost some of the latter.
Work it out for yourselves. You could always invoke the non-existent GHE (a metaphor, according to the all-knowing David Appell, 15 hours of journalism and all), if you can’t be bothered finding a physical reason.
How’s your “gotcha” working out? Do you think you need to seek advice from David Appell?
Cheers.
Mike Flynnn says, May 26, 2017 at 4:26 AM:
No, you haven’t. Trying to bluff your way out won’t do, Mike.
Kristian,
It’s hardly my fault if you can’t understand basic physics. Shriek and complain all you want.
Maybe you fail to understand that I’m under no compulsion at all to bow to your demands.
What you feel, or don’t feel, is of precisely no import to me. Your opinion is worth what I paid for it – nothing at all. If you unexpectedly turn up a fact of which I was previously unaware, I’ll likely change my views, as would any rational person.
But you haven’t, so I won’t.
Cheers.
Mike Flynn says, May 25, 2017 at 11:47 PM:
Peculiar. Because YOU’RE the one invoking a “magical one way insulator”, Mike. Not us. The atmosphere insulates the surface against the heat from the Sun (=> slower heating), but cannot and does not – according to you – insulate the solar-heated surface against the cold of space (=> slower cooling) at the same time.
You have nothing. And we all know it. So why are you still here?
Kristian,
Who’s the “us”? Do you have a split personality? That might well explain why you appear to enjoy setting up fake arguments, and then arguing with yourself.
Are you seriously disputing my statement that there is no magical one way insulator?
The Earth has cooled for four and a half billion years, by all accounts. Maybe you and yourself could have a good argument with each other. I’m sure one of you would win, although two foolish Warmists could snatch defeat from the jaws of victory without too much trouble.
Thank you for your final remarks. I am glad you take the time to tell me what I have, what you and yourself know. And of course, in answer to your final witless Warmist enquiry – I am, therefore I am.
If you require any further assistance, please let me know.
Cheers.
Mike Flynnn says, May 26, 2017 at 4:39 AM:
The ones you’re arguing against. Like barry, Folkerts, Appell, Norman, Ball4. And myself.
I think you knew that already, didn’t you?
What “fake arguments”? It is evident you can’t explain why the T_sfc of Venus is higher than the T_sfc of Mercury, even though Venus receives a lot less heat from the Sun than Mercury. We all see it. It’s plain to see for everyone. You’re left flailing. “Dismissing, denying, diverting.”
No. Didn’t you read what I wrote? YOU seem to dispute the fact that the atmosphere acts as a TWO-way insulator. Not us.
Does the presence of an atmosphere on top of a planetary surface slow the cooling of that surface at any given T_sfc as compared to a situation where it wasn’t there? Or doesn’t it?
Does it ONLY insulate against excessive heating? Or does it also insulate against excessive cooling?
Kristian,
You wrote –
“Does it ONLY insulate against excessive heating? Or does it also insulate against excessive cooling?”
I can easily believe you don’t understand about insulation, so I assume you are seeking knowledge. I’m probably wrong, I know.
First you must define “excessive” and also “cooling” and “heating”.
What definition of “insulate” are you currently using? Are you happy for me to explain the operation of insulation using your definition?
It’s fairly simple, but so are most foolish Warmists.
Maybe you could arrange a talk between “barry, Folkerts, Appell, Norman, Ball4. And myself.”, and work out why you need my help. You question is, like most foolish Warmist questions, not very clear.
You see, any normal and rational person would know the answer to your question. Maybe your group (I presume you have been appointed spokesman, although I suspect the other foolish Warmists might not agree), are a little slow. Tell me who you judge to be the least intelligent, and I will endeavour to talk down to their level.
Adding the individual IQs of your group won’t make any of you smarter. The collective intelligence of 1000 foolish Warmists, is no greater than that of its most intelligent member, low though that may be. In addition, a person afflicted with delusional psychosis may be very intelligent, and barking mad, simultaneously.
I’m always glad to help the less fortunate, but I have a nagging suspicion that you think you already know the answer to your question, and are merely trying to make me dance to your erratic and dismally out-of-tune dirge.
Any, toss a couple of definitions and a bit of clarification my way, and I’ll set you straight, as usual.
Cheers.
IOW, you’re stumped, and you haven’t got a clue how to wriggle your way out of your corner.
You simply cannot find a way to explain why the T_sfc of Venus (with atm) is higher than the T_sfc of Mercury (w/o atm), even with a much smaller heat input from the Sun.
And so you rather lash out, in classic style. In a hopeless attempt to divert the attention of those who read your nonsense from this blatant fact.
Sorry. You can’t.
Kristian,
You witless Warmist.
You can’t believe that there are any alternatives to your stupid GHE (which even David Appell says is but a metaphor for something as yet undefined – a banana perhaps?), can you?
If you explained to readers what you know of the geophysics of Venus, you might have a chance of convincing them that your silly assertions are fact. GHE – a joke.
I don’t care what you (or anybody else, for that matter, thinks). Your opinions, if unsupported by fact, are worth somewhat less than what I think of them. I’m sure you would agree, as would any rational person.
Stupid “gotchas”, particularly when you haven’t got a clue what you are talking about, are quite pointless. You may have noticed that others, having the brains to follow up on the facts, are not falling over themselves to point out that I am wrong. That is, perhaps unsurprisingly, because I’m probably right.
Bad luck. No GHE. Keep up the fight! Miracles are possible, I suppose.
Cheers.
Mike Flynn says, May 27, 2017 at 4:24 AM:
LOL! That’s the whole point, Mike. They ARE supported by fact: The fact that the T_sfc of Venus is higher than the T_sfc of Mercury, even with a much smaller heat input from the Sun.
It is also a fact that you can’t explain why that is. Because you think an atmosphere’s presence on top of a solar-heated planetary surface only insulates that surface against the heat from the Sun. You know, a “magical one-way insulator”.
Or do you indeed have an explanation? Let’s hear it now. Let’s hear your explanation. Is it somehow (supported-by-facts) “geophysics” …?
Kristian,
Your comprehension is obviously that of someone of small brain, as they say.
Yes, the surface temperature of Venus seems to be higher than that of Mercury. Why you find this at all strange, would be a matter of puzzlement to any real scientist with a reasonable knowledge of physics.
I get a strong impression that you wish me to spoon-feed you with the answer. I also get the impression that you believe that I should give a damn about what you allegedly think. I don’t care what you think. As anyone who gives a toss knows, the answer to your question can be found with no more than 30 minutes searching on the internet.
I’m assuming that you are 10 times slower than me. Please excuse me if I’m a bit optimistic.
Cheers.
Again MF has wriggled out of an actual science answer. He insists there is altrnative to GHE, for example to explain Venus v Mercury, but cannot tell us what it is. Have to assume he has none.
Mike Flynno says, May 27, 2017 at 7:04 AM:
Yup. Please spoon-feed me with your answer.
Does that mean it’s finally coming? No more diversions? Excellent! Let’s hear it, then.
MF mentions me with almost every reply now.
Good to see that I’m deep into his head.
There’s no real hope for him, but who knows.
Mike Flynn says:
“You cant believe that there are any alternatives to your stupid GHE (which even David Appell says is but a metaphor for something as yet undefined a banana perhaps?”
Name me one scientific model that isn’t a metaphor.
You can’t.
Kristian,
What part of “no” do you not understand? Please let me know, if you wish.
Cheers.
David Appell,
Are you truly stupid, or just pretending?
You wrote –
“Name me one scientific model that isnt a metaphor.”
No. Why should I? I have no intention of naming anything for a foolish Warmist. I’m not concerned with your opinion of my capabilities. Maybe someone else might, but I doubt even that.
Cheers.
Mike Flynn says, May 28, 2017 at 3:30 AM:
I understand perfectly fine. You haven’t got an answer, Mike. You can’t explain it.
Which means all your arguments fall to the ground. Powerless. Void of any credibility. And everyone here sees it and knows it.
We’re right and you’re wrong.
Cheers!
David A. it bothered you when I made 5 polite comments to you,after that you asked me to leave you alone.
Now David A. brags about being in Mike Flynn’s head.
What a silly inconsistent guy you are!
Appell, if your mission here is to make people believe you are an idiot, please stop. You’ve succeeded
Got any science? Or just banal insults?
Empirical evidence has to the most casual observer says that you are, in fact, and idiot.
Something tells me you never learned how to play nice in the sandbox.
David is a Very, very, very slow learner.
lewis,
I find it helps to type very, very, very, slowly. Even then, David’s comprehension comes up a bit short from time to time.
Maybe the 15 hours of journalism he completed didn’t include the reading lessons.
Cheers.
All MF can accomplish are personal insults, and inaccurate ones at that.
(I have never taken any courses in journalism.)
Looking for the reasons for the rise in temperature, you can not pretend that solar activity is constant. In fact very different in long time periods.
https://solarscience.msfc.nasa.gov/images/ssn_yearly.jpg
https://solarscience.msfc.nasa.gov/images/bfly.gif
http://images.tinypic.pl/i/00904/3vyvxbyygqne.gif
http://files.tinypic.pl/i/00904/slqch8a04sop.jpg
You need to consider how much solar energy is able to absorb the oceans.
http://www.ospo.noaa.gov/data/atmosphere/radbud/swar19_prd.gif
The chart below shows that between 1979 and 2007 the sun was very active and the solar wind was strong. Galactic radiation is strictly dependent on the velocity and density of the solar wind.
http://images.tinypic.pl/i/00904/3vyvxbyygqne.gif
According to the experts who wrote Restoring the Quality of Our Environment, 1965, which was quoted in the Nixon white house archives, at our current CO2 level we should be under another 27 feet of sea level rise.
Mind you, this prediction was made more than half a century after arrhenius identified CO2 as a greenhouse gas, and after the experimental radiative forcing of CO2 had been measured to extreme precision and even calculated with computers.
They still missed by almost 27 feet and counting.
Are you sure you got the history right?
Ktm: cite please.
ktm, when hundreds of papers are published on a subject, partcularly at a time of limited data, not hard to find one that is compltely wrong. Not very meaningful.
When the solar wind is weak, the winter polar vortex weakens. This is visible this year.
Ice extent in the Arctic this year was low due to weak polar vortex (very low solar activity).
Evidence of this is the current low temperature in the north.
ftp://sidads.colorado.edu/DATASETS/NOAA/G02186/plots/4km/r13_Baltic_Sea_ts_4km.png
CO2 Cant Cause the Warming Alarmists Claim it Does
CO2 covers the globe in a 405 ppm blanket and increases in a linear fashion, yet temperatures are very non-linear. The above graphic is a 12 month moving average of global, land and ocean temperatures. The 12-month average is significant because it removes the variation that occurs throughout the year due to the seasons. Every data point includes data from each month of the year. If in fact, CO2 was the only factor driving temperature, the 12-month moving average would be linear, or logarithmically related to CO2. It is neither. The other point to note is that global temperatures and ocean temperatures are very tightly correlated, whereas land temperatures differ substantially. Land temperatures are corrupted by the urban heat island effect, so the difference between land and ocean temperatures cant be explained by CO2.
https://co2islife.wordpress.com/2017/05/10/co2-cant-cause-the-warming-alarmists-claim-it-does/
Good article co2 is life. It really dents AGW theory.
It’s pseudoscience.
Yet you provide no examples of “pseudoscience”
Too hard to do?
CO2isLife says:
May 26, 2017 at 4:40 AM
“If in fact, CO2 was the only factor driving temperature,”
Not a single scientist claims this is so.
Strawman argument.
David has convinced himself (wishful thinking) that CO2 is the reason why the climate changes which of course can be proven false.
If one reviews the historical climatic record one will see CO2 lags the global temperature changes by hundreds of years therefore strongly suggesting it is the climate which determines CO2 concentrations and not CO2 concentrations that determine the climate.
In addition as CO2 is added to the atmosphere it’s effects lessen.
Salvatore, you have been wrong so many times now that your claims and opinions carry a weight of zero.
Sorry, pal — you shot your wad, and it missed.
https://edmhdotme.wordpress.com/2015/06/01/the-holocene-context-for-anthropogenic-global-warming-2/
This is a good article
“2016 will not be s warm as 2015….”
– Salvatore del Prete, 12/3/15
http://www.drroyspencer.com/2015/12/2015-will-be-the-3rd-warmest-year-in-the-satellite-record/#comment-203097
Snape,
I noticed you said:
No. It was a hypothetical. If Al Gore had made an inaccurate statement about global warming, and Roy had written a paper that pointed out the mistake, and then submitted it for peer review, the reviewers would have told Dr. Spencer,
“C’mon, thats a politician generalizing. You cant get a peer-reviewed scientific paper out of that!”
This is his claim and he might be right.
You might be interested in this.
http://www.drroyspencer.com/2017/05/santer-takes-on-pruitt-the-global-warming-pause-and-the-devolution-of-climate-science/#comment-248304
Dr Spencer did indeed get a paper published (2008) that took on Al Gore’s views of climate change.
From Spencer’s article above:
If I only knew earlier that I could get peer-reviewed scientific papers by evaluating the silly climate claims made by politicians (Al Gore, Barack Obama, et al.) over the years.
Well he did just that. And about Al Gore, no less. Maybe he forgot?
Barry, you are very astute.
Maybe the papers Roy wrote took a long time to make it through peer review, while the Santer report flew through?
Maybe so. But that’s not the point he made.
barry: Al Gore isn’t a scientist, and he doesn’t write peer reviewed journal papers.
He was/is a politician.
Yet,YOU David A. accepted his deceptive,dishonest Video presentation as if he was a …. “scientist” way back in the first decade.
Snicker……..
I can predict with a certainty what your reply will be,if you make one.
The only people that care what Gore says are the skeptics here.
Yep. That’s the point.
I’m new to this site and have a genuine question, and hoping to avoid abuse.
“Of course, the authors know full well that the reason the pause/hiatus/leveling-off ended was due to a NATURAL event (El Nino).””Nevertheless, as a “lukewarmer” I tend to believe about half of recent warming is indeed human-caused.”
When these two statements are put together, would that also mean the El Nino (plural) would be influenced to the same extent by human causation, therefore not completely natural. Is this wrong?
Also, if all the El Nino events and La Nina events are graphed alone would we still see a similar rise in temperature as is seen in the full mix?
El Ninos and la Ninas are naturally occurring events that occur every few years and usually last a few months or a bit longer. Without going into detail, their effect is to temporarily warm (Nino) and lower (Nina) global surface temperatures.
In the context of a slow, long-term rise in global average surface temperaturs, these events keep happening naturally. If the surface temp rises, these temporary peaks (Ninos) and troughs (Ninas) also reach higher temps in general.
Think of waves and rising tide. The wave amplitude above the level of the water may remain the same, but as the tide rises the height of the peaks and troughs in the waves gets higher relative to the sea floor.
If we measure actual temps during Ninos and Ninas, with an underlying warming global average over time, they will, in general, get progressively warmer, even if their amplitude around the warming trend remains the same.
barry believes: If we measure actual temps during Ninos and Ninas, with an underlying warming global average over time, they will, in general, get progressively warmer, even if their amplitude around the warming trend remains the same.”
barry, if Warmists spout pseudoscience, over a long enough time, without knowledge of the underlying science, in general, they will get progressively more devoid of the facts, everything else remaining the same.
Hope that helps.
g*e*r*a*n* No, it doesn’t help.
Well, don’t expect your money back.
There are NO refunds!
I don’t know what G takes exception to. What I wrote makes no mention of ‘greenhouse’ warming. The sun or any other phenomena could cause the warming and the result would be the same. ENSO events would in general get warmer relative to some baseline temperature.
barry,
You wrote –
“Without going into detail, their effect is to temporarily warm (Nino) and lower (Nina) global surface temperatures.”
Are you sure? Has anybody actually measured global surface temperature with any reasonable accuracy. You can’t even give useful definition of “surface” that applies across the globe.
Just more baseless assertion, until backed up by a fact or two. If you decide to define “surface”, I’ll see if I can find fault with your definition, of course.
Go for it, if you wish.
Cheers.
I get a strong impression that you wish me to spoon-feed you with the answer.
MF: Spencer and Christy claim they are measuring temperatures with sufficient accuracy.
What about their claims do you find scientifically problematic?
And why?
Thanks Barry, that is how I expect it would be. I wonder if Dr. Roy agrees.
Geoffrey,
Or you could believe the IPCC – (Working group 1 – The scientific basis) –
“The climate system is a coupled non-linear chaotic system, and therefore the long-term prediction of future climate states is not possible.”
Sort of says it all, really. Occasionally I agree with the conclusions of the IPCC. This is one example.
Even the IPCC has to face reality from time to time.
Cheers,
“long-term”
Geoffrey
I have studied and followed the el nino/la nina cycles closely for several years now, and In my opinion Barry’s description was very good.
Snape,
I’m shocked! Shocked, I say!
Don’t you accept the IPCC’s statement? Surely the science is settled!
Iconoclast!
Cheers.
Snape, “I have studied and followed the el nino/la nina cycles closely for several years now, and In my opinion Barrys description was very good.” Thanks.
You’re welcome, Geoffrey.
I wonder if Dr. Roy agrees.
I would think so. What I outlined is not controversial.
That’s a reasonably simplified description. However, in actuality, wave amplitude is extremely variable. There’s not a lot of information to be gleaned from El Nino peaks. It is probably best, in diagnosing long term behavior, to ignore them altogether.
Theres not a lot of information to be gleaned from El Nino peaks.
Agreed.
There sure is info from El Nino peaks — like how the peaks all get higher through the decades now….
The troposphere is unable to accumulate heat. Already at 5 km, the temperature in the troposphere is below the freezing point.
https://earth.nullschool.net/#current/wind/isobaric/500hPa/overlay=temp/equirectangular
Things below freezing can’t accumulate heat?
Dumb. Plain dumb. Beyond dumb.
DA…”Things below freezing cant accumulate heat? Dumb. Plain dumb. Beyond dumb”.
You must be pretty bored…or stupid…or both…if you have to follow me and ren around making dumb comments.
ren said…”The troposphere is unable to accumulate heat. Already at 5 km, the temperature in the troposphere is below the freezing point”.
He did not say bodies below freezing could not accumulate heat, he said the troposphere can’t. ren’s statement is true, there is no mechanism to accumulate heat and the only source of heat is a constant supply from the Sun.
Even you have argued for thermal equilibrium and now you seem to be denying it.
“He did not say bodies below freezing could not accumulate heat, he said the troposphere cant. rens statement is true, there is no mechanism to accumulate heat and the only source of heat is a constant supply from the Sun. ”
What accumulates heat is the ocean. The atmosphere can accumulate heat but a very tiny amount in comparison to ocean.
The global atmosphere in terms of how warm it is, is controlled by the heating in the tropics. Or more specifically from the absorbed sunlight of the tropical ocean- where most of energy sunlight enters the system.
If tropical surface waters cool, global average air temperature would cool, And likewise were tropical surface water to warm, global average air temperature would warm.
But this too simplistic, basically tropical ocean surface temperature remain near constant- has done so for millions of years and will do so for millions for years.
What changes over tens of thousands of years is average ocean temperature.
The average ocean temperature is about 3 C, were the average ocean temperature to get to 10 C, our atmosphere would accumulate more heat- it would have a higher heat content than it does now.
In distant past earth’s ocean average ocean temperature was higher than 10 C and we had no polar ice caps, but in the most recent 10 million year, Earth average ocean temperature has not been as warm as 10 C.
We are currently in one the most coolest periods of Earth’s billions of years of history, and this period is called the icebox climate- which is characterized as cool oceans and polar ice caps.
http://www.climatedepot.com/2017/05/26/arctic-sea-ice-bounces-back/
More evidence that the global warming that is suppose to get worse and worse as we move forward is not happening.
This makes you feel free to say what you really feel, agree or disagree. Refreshing.
“I think this blip ends before NOV. is through and if solar conditions continue to be sub par cooling in a more pronounced way will start in year 2014.”
– Salvatore del Prete, 11/15/2013
http://www.landscheidt.info/?q=node/4#comment-1047
This site cor
I’m still waiting for a response from Warmists to my question:
“How have you personally been harmed by global warming in your lifetime? Please provide the empirical evidence of your personal harm/loss over the decades of your lifetime. Be specific and accountable in providing the empirical evidence of personal harm.”
Just the biggest most obvious specific harm you have personally encountered in your lifetime.
Personally, I am unable to identify how my family has been personally harmed by global warming in our lifetime. We have had lots of bad things happen but nothing related to global warming as far as I can tell. Nothing detectable or identifiable.
So again, I don’t understand what is the point of this debate if nothing can be proven empirically in real world life experience.
Come to think of it it, yes it has cost a lot.
I was used to the comfy T only to have Sept 2016 turn out to be the coldest in over 120 years (Perth, West Australia). A shock I tell you.
My power prices have jumped dramatically. A real shock I tell you . When I last looked subsidies to renewable energy was about $0.26 per kWh (I just divided subsidies by the the energy produced Oz wide). Much of these subsidies now comes from a tax (RET) of about 8c per kWh for grid power.
Guess it may seem right that poor people or renters subsidize rich people to put solar panels on their roofs. A bit of a shock, I tell you.
A few years back Oz had a Carbon tax with tithes being sent to the UN. No wonder Pachauri called it his religion. Now that was a shock, a real shock.
Droughts were here to stay according to Flannery, self appointed climastrologist. So we spent $ billions on many desal plants with take or pay type arrangements. Subsequent floods have ensured that the annual output of these plants would not fill public swimming pools. They are simply not needed! A shock, a real shock!
As a consequence of various renewable decisions all we have ended up with is blackouts in SA and threats to our power supplies. Dunderheads leading the charge into oblivion and yet Oz will soon be the biggest Nat Gas exporter in the world without enough gas for ourselves. A shock, a real shock I tell you.
Don’t recall any of this before the Global/Climate Change liturgy played out. A shock! Really! Let me take my anti shock meds before I retire. Have a nice day.
Tony. that’s that’s the reality of politics. the poor always foot the bill.in the UK we now have food poverty.yet the 2008 climate change act has cost in the region of 100 billion pounds.for no gain.at the end of its term of 20 years it will have cost 300 billion pounds.as they say .The road to ruin is paved by good intentions.
It is a stark reminder that humans are also herd animals, and will stampede over a cliff in a heartbeat. Those who shy away from the cliff will be trampled underfoot.
One would think, by this time in our evolutionary trajectory, we would have learned to resist the herd instinct. One would be wrong.
UK Ian…”the poor always foot the bill.in the UK we now have food poverty.yet the 2008 climate change act has cost in the region of 100 billion pounds”
And they are Tories of the uber-right. Leftists get blamed for it but here we have Tories pushing eco-alarmist policies that have no science to back them.
Ironically, the entire AGW mess was started by another UK Tory, Margaret Thatcher. She was in a heated beef with the coal miners’ union and she was having trouble handling them. She had a degree in chemistry and an advisor suggested she use her knowledge in chemistry to baffle the idiots at the UN regarding emissions from coal.
Voila!! The IPCC is born. That’s right, an uber-right-wing Tory badgered the UN into creating the IPCC to investigate the human cause of global warming. Thatcher was not alone in this, she was being advised by climate modeler, John Houghton, who became the first co-chair of the IPCC.
Now the same Tories are taxing UK citizens to death over pseudo-science.
Gordon. There is some truth in what you say.Thatcher was an advocate of nuclear power and had plans to build nuclear power stations at many coastal sites.the next Labour government abanded those plans .And in 2008 introduced the climate change act, with all the baggage that goes with it.i remember the then environment minister Ed Milaband calling anyone who questioned the science.flat earthers.
As a Yank, I may not be entirely clued into the scene. But, it appears to me the problem is not Labour vs. Tory, just as here it is not Democrat vs. Republican. It is Elite vs. Commoner. Here, the elites on both sides of the isle are in favor of many ill-considered policies for which they do not have to bear the consequences.
Tony M…re Oz
I have nothing against Aussies and when I lived in New Zealand for a bit I had a great Aussie friend and coworker. However, when I was participating in Australian Jennifer Marohasy’s blog I became concerned about Australian government policy regarding global warming. They seemed a Neanderthal lot.
http://jennifermarohasy.com/
Nothing much has changed. The alarmists are still just as thick. Even though I can’t identify with Trump’s policies on social programs I was delighted when he was elected with his belief that global warming is a hoax.
The guy he appointed to oversee the EPA, mentioned in this article, seems level-headed. He has acknowledged that satellites have shown a long period of no average warming, which is a start.
Even our PM in Canada, Justin Trudeau, acknowledges that the economy is a priority. He supports pipelines but still talks about a carbon tax. I think his wife has a strong influence on him regarding political-correctness regarding AGW theory.
Gordon Robertson:
Not totally sure of your comparative reference points nor endorsement of Trudeau on the basis of what you think he means. I viewed his repetitive answers to your Parliament re his freebie holiday and would hardly feel comforted by his continued evasion.
Every political leader acknowledges the economy as a priority. We had one Labor (equivalent to Democrats in US) Treasurer forecast a surplus budget for six years running. Failed every time and left our National accounts in disaster territory in 2013!
The history is that the Oz Conservatives (LNP, the equiv to US Republicans) would not ratify Kyoto. We were in lockstep with the US. This changed with the election of the Labor Govt in 2007 just prior to Obama’s election. We ratified Kyoto then seemed to lead the charge into Copenhagen until the Chinese rat fuxked us (no rather r-f our ambitious Labor PM Rudd-a-dud-dud).
Labor introduced a direct CO2 tax which was repealed with the change of Govt – back to the LNP in 2013.
Labor left a minefield much like the current Paris accord. It is not such a simple process of POTUS withdrawing; it takes nearly four years to actually implement such a withdrawal.
The politics of this game are long and tortuous; the stakes are huge with the big bankers and carpetbaggers playing it for all it is worth….. multi $trillions!
Gordon,. The problem we have is a muddyan of the waters between politicians who think they are scientists,and scientists who want to be politicians,each with their own agendas,and a nasty mix of power and egoes,beware of false prophets
Obama
We are in the lag phase of an exponential change.
Why do you expect serious damage so early inthe process?
“Lag phase”?
“Serious damage so early in the process”?
Aren’t the oceans already boiling? Didn’t the ice caps melt 10 years ago? All ski resorts shut down years ago. The catastrophic temperatures have exceeded the IPPC projections.
As an Alarmist, you didn’t know this? Where have you been?
G,
Alarmists live in encapsulated emotional igloos from which they see nothing but what CNN tells them or, on a bad day, NPR.
Got any science, lewis.
or just dumb insults?
Davie, you believe “science” is a “dumb insult”!
You much prefer pseudoscience, where the Sun can radiatively heat the Earth to 800,000K.
Did David A. really say that?
“You much prefer pseudoscience, where the Sun can radiatively heat the Earth to 800,000K.”
Obama. You won’t get a responce they don’t have one .Most of them have never left their back yard.after almost 50 years of world travel I have found no change in the climate of the many places I have visited over the years. from Africa to Cuba .Indonesia to Europe.no change .If you look at the average historical temperatures for these places.you will find no change from today’s . travel mags are a good place to start.you don’t need a PHD
UK Ian Brown
Same question. Why are you expecting to see big changes in climate when the process of climate change is still in its early stages?
If you were freshly diagnosed with melanoma, would you ignore it because it had not yet seriously affected your health?
Oh, that’s GOOOOOD! AGW is now melanoma!
Egad, the Alarmists are getting desperate!
Entropic Man,
You wrote –
“If you were freshly diagnosed with melanoma, would you ignore it because it had not yet seriously affected your health?”
Wha has an imaginary melanoma to do with the climate changing? Or is the melanoma imaginary?
Maybe it’s a metaphor? David Appell said the GHE was a metaphor- for what, he didn’t know. Maybe a melanoma, or a banana?
If you were a realist, would you still be a foolish Warmist?
The world wonders.
Cheers.
Entropic Man!
Whatever do you mean: the climate has just begun to change?
Where have you been the past 2 million years, sleeping? Just 25,000 years ago my yard was inundated with glaciers, then, suddenly it seemed, it started melting off about 20,000 years ago. My house at the beach lost it’s shoreline, became the shoreline and is now 200′ underwater and is miles from the shoreline – the wrong way.
But, maybe, you’re one of those who believes climate has only existed for the past 35 years or so, you know, since the satellite record came into existence.
Personally, I enjoy watching the graph Dr. Spencer publishes, along with the snow extent graphs published by Rutgers, but my bible on the subject are the gardening books which show planting dates and first and last frost dates, which don’t seem to have changed since their publication decades ago.
My point would be: Alarmism is bad for your health, no different than any other religious cult.
lewis says:
“Whatever do you mean: the climate has just begun to change?”
He means it’s now warming fast, far faster than when the Earth left its last glacial period, and there’s no scientific reason whatsoever to expect warming to stop now — in fact, with feedbacks now starting to kick in significantly, warming is accelerating (as ocean heat data shows).
MF: All models are metaphors.
If you don’t know that, you are not qualified to speak about any science.
DA…”MF: All models are metaphors. If you dont know that, you are not qualified to speak about any science”.
You obviously don’t know the meaning of metaphor. Models these days are computer programs designed to replicate a physical actuality. What’s metaphorical about that?
The GHE is a metaphor because its a term used to represent a condition that does not exist. It’s not even a model, it’s a mental fabrication, and it’s wrong. A computer program exists and if it represents a model of reality the model obviously exists as the program.
If you want to get down to brass tacks, a program is ultimately a collection of 1s and 0s stored in memory as voltages and on hard drives as magnetic poles. The output can be visualized on a display, printed, or today, used by a 3D printer to create real objects. We have not reached the stage yet where the printer will create an electronic circuit but I’ll bet someone is working on that.
If a model was a metaphor for reality it could not be created as a reality. I gave an example of a metaphor as a ‘sea of grief’. You cannot turn grief into a sea or take grief from a sea. You can contemplate a sea of grief if you’re an artsy poet. You can, however, turn a model into a reality.
In electronics, I can create a model in a computer of a circuit. If I build the circuit with real parts to represent the model, and it works, the model has been validated.
That has never been done with a climate model.
Mike…”Maybe its a metaphor? David Appell said the GHE was a metaphor….”
That was me, Mike. Appell couldn’t tell a metaphor from a simile.
I referred to the GHE as a metaphor because a metaphor is essentially an impossibility. Here’s a metaphor, ‘a sea of grief’. We can stretch the meaning of sea to a great extent but it’s a stretch to have a real sea of any kind filled with grief.
By the same token, the GHE represents nothing real. It’s supposed to represent a real greenhouse but there is absolutely nothing in the atmosphere that can replicate a real greenhouse. In essence, calling the atmosphere a greenhouse is equivalent to the term sea of grief, hence a metaphor for who knows what.
What the GHE represents is someone’s IDEA of what is going on in the atmosphere re the trapping of heat. The atmosphere cannot trap heat since heat is related to mass and there’s nothing in the atmosphere to trap mass as does the glass in a greenhouse.
Might as well claim ‘an atmosphere of grief’.
Entropic man says. Why are you expecting to see big changes in climate? I’m not.i was only pointing out my own observations.as for comparing climate with melanoma. one is a canundrum the other a proven medical condition.climate predictions are not.
Obama
It’s my guess that 100 years from now global warming will be like a giant wrecking ball for life on earth, but for right now, in much of the world, its business as usual. So to answer your question, no, I don’t have any friends or family who are adversely affected by climate change, and I don’t expect this to change anytime soon.
Would that the birds of prey, carrion fowl, and bats minced and ruptured by wind farms, and other flora and fauna poisoned by rare Earth mining and materials processing waste, could say the same.
Snape…”Its my guess that 100 years from now global warming will be like a giant wrecking ball for life on earth…”
WHILE WE’RE GUESSING, IT’S MY GUESS THAT GLOBAL WARMING HAS RUN IT’S COURSE.
Sorry for caps, I had the caps key on and I’m too lazy to go back and correct it. Meantime, I write more than I had to correct explaining it.
We had to re-warm from the Little Ice Age and astronomer Syun Akasofu claimed we should warm at about 0.5C/century. I think we’re about there.
There may be fluctuations but I think we’ve seen the worst of it. Could get warmer but nothing catastrophic.
I am more concerned with the Sun running out of fuel and expanding into a Red Giant. Now, that would be global warming.
Obama, I haven’t done a study to get “empirical evidence”, but I am sure I have lost more and more time not being able to work on the farm due to increased heat. It gets more and more unsafe through the heatwaves. My elderly mother suffered more than I can remember in the last record summer a few months ago. Our plants suffered more than I can remember. It is pretty tough on them when the temperatures soar.
Geoffrey,
I’m sure all the flora and fauna buried under kilometres of ice on the continent of Antarctica would have been happy if it didn’t get quite so cold there.
When do you think Antarctica will revert to being fertile and ice free again? 50 years? 100 years?
Or am I just being ridiculous expecting the world to go back to the way it used to be? Maybe things change all by themselves. Maybe they don’t.
How would you know? I suppose you could always believe an undistinguished mathematician pretending to be a scientist, or someone who wasn’t quite bright enough to realise they didn’t actually get a Nobel Prize for anything at all.
Your choice.
Cheers.
Mike Flynn, thanks for that. I was just answering a question on possible personal effects from climate change. I was not giving an opinion on the existential future or past of the earth/universe.
Geoffrey,
Fair enough. I thought you were responding to Obama. “Possible effects” from anything are in the future of course, so I presume you meant something else.
I’m curious as to your use of the term”climate change”. Are you possibly confusing the weather with climate? Climate cannot be calculated until you average the weather.
Temperature would appear to relate to weather. Yes, I’m being picky, but that’s the nature of Nature.
Elucidate if you wish, or not, as you choose.
Cheers.
Temperature, obviously, applies to both weather and climate.
Deep, man, huh?
And no, the ocean still isn’t emitting blue light, as MF claimed.
Geoffrey
It’s very hard to know what is the result of climate change and what is just natural variation. The warm summer’s you’re talking about?….you would need to look at long term temperature trends in your area before attributing them to global warming.
Snape, thanks for that. “you would need to look at long term temperature trends in your area before attributing them to global warming”. They were the hottest temperatures in 158 years of measurements. 10 summer days over 35C. I still don’t know if they are attributable to global warming, but I was just answering a question on possible personal effects of climate change.
“They were the hottest temperatures in 158 years of measurements.”
Geoffrey, all-time records like that are hard to ignore! I’m no skeptic, just wanted to point out that looking at long term trends is the only way to see the “big picture” of climate.
Hope this summer is kinder to your mother.
Geoffrey
I see now you had already mentioned the summer’s were record hot. My mistake.
Snape,
Are you another foolish Warmist who believes the future can be predicted by detailed analysis of the past? The future hasn’t occurred yet, I believe.
I assume that if anybody could predict the future in any useful way (better than a 12 year old child, for example), someone might have discovered the fact by now.
Even the IPCC accepts that future climate states are unpredictable, and the IPCC is not infested with deniers or unbelievers, as far as I know. Maybe I’m wrong – maybe the IPCC is under the control of Big Oil, Big Boobs, or even the Big Kahuna?
What do you think?
Cheers.
Flynn
Sometimes the future can be predicted, sometimes it can’t. Often it’s somewhere in between.
So if you want to talk about predictions, give me a specific situation.
Snape,
The future hasn’t happened yet. One might hope it will, but you can’t be sure.
Any fool can predict the future, and many often do. I assume you’re actually claiming that people can usefully predict what will come to pass in the future.
Here’s a specific situation – you can’t predict the boiling temperature of a beaker of water in your own kitchen Any 12 year old can say “It’s 100 C”. No it’s not. It varies. So take a properly calibrated temperature sensing unit – climatologists claim temperatures can be measured to 0.001 C, so stick with that. Boil your beaker. Measure the temperature. Not 100.000 C. Prediction busted.
The future hasn’t happened yet. Nobody can usefully predict the future any better than a 12 year old child. This gets rid of the dills who loudly proclaim “I predict the sun will rise tomorrow!”
Not useful, and an assumption that is easily made by a 12 year old. Even the somewhat slow IPCC abandoned predictions in favour of projections and scenarios.
So go on, tell me about a useful prediction that couldn’t be made by a 12 year old.
Not so easy, is it?
Cheers.
Flynn.
What will the exact temperature of boiling water be? This is the situation you want to discuss?
I check weather predictions on my phone almost every day. Not 100% accurate, but very useful nonetheless.
I certainly don’t consult my kids.
Snape,
You asked –
“So if you want to talk about predictions, give me a specific situation.”
I give you a specific situation. You complain. What is it you want me to give you?
One of the reasons I usually can’t be bothered with foolish Warmists is that they ask stupid questions. Maybe you could tell me what sort of a situation you want to be given?
Maybe I didn’t make myself clear. Neither you, nor anybody else, can make a useful prediction about the future any more accurately than a 12 year old child. Easy to prove me wrong, I
suppose. If you like, I’ll proffer myself in the stead of the 12 year old child.
Go for it. Make your prediction. Or is every situation you can devise one your “. . . sometimes it can’t.” situations.
Your’e confusing guesses or assumptions with predictions possibly?
So you check weather predictions every day, do you? You find them useful in what way? I’m sure they predict that there will be weather. That doesn’t seem terribly useful, and you or your children could perform simple naive persistence forecasts.
Or you could just look out the window and guess. Might it rain? Do you think you might need to take sunshade?
Nobody can predict the future, in any useful sense. Not you. Not the smartest man in the world.
Cheers.
Mike,
You’re wrong about some predictions and you know it.
Short term weather predictions have become fairly accurate. Short term being less than 7 days.
Farmers rely on them.
Lewis
lewis,
You wrote –
“Youre wrong about some predictions and you know it.
Short term weather predictions have become fairly accurate. “
Deny, divert, confuse – standard foolish Warmist fare.
But thanks for telling me what you think I know. You wouldn’t have a clue what I know, would you? Are you claiming particular knowledge of mind-reading? No? I thought not!
As to short term weather forecasts, you could provide some proof that you can forecast the weather better than I, I assume? No? I thought not.
As an example of predictive believability,, if an airline predicted that is was “fairly likely” that I would reach my destination alive, I would consider that prediction not particularly useful. As to your comment that farmers rely on “fairly likely” short term forecasts – name one farmer, and tell me why the forecast is better than a naive persistence forecast. Silly request I know. You can’t.
Go for it. Astrologers apparently receive more money from real paying customers than climatologists, if judged by the amount of paid advertising I’ve seen. Should astrological predictions be accorded more weight, because more people are believers?
Silly, silly, silly. The future is unknowable. Even the IPCC agrees. Bad luck for you.
Cheers.
Mike Flynn
Here is a prediction a 12 year old could not make but highly trained scientists are making and actually showing the path and time of this years total solar eclipse in the US (August 21). So ask you 12 year old on the street some cities that will be in the total eclipse and ask them at what time the eclipse will take place and see if they can provide you the answer. Now we will wait until August 21 an this will totally prove you don’t have a clue what you are talking about and just waste people’s time with your empty and not thought out posts. Your boiling point example was very lame when you go to several decimal points to “prove” no one can predict the boiling point of water. Not a really good or intelligent argument.
Anyway take to the street and start asking the 12 year-olds you meet and we can see how you are the clueless on August 21 (which is not too far from now).
You read one science book by Fenymann and now you know more phyicis and understand more about the topic than the people who have spent years studying the material.
Norm, I don’t think Mike meant for you to take this personally. He was talking about 12-year-olds in general, not you specifically.
Norman,
You’re not doing too well, are you? The method of predicting eclipses, total and partial, goes back maybe 2000 years. Any competent 12 year old can plug the relevant figures into an app, these days.
I hope you’re not suggesting that a climatologist would have either the knowledge or inclination to predict the location or timing of the 2017 total solar eclipse, are you?
My prediction is that the full eclipse will first be visible at around 18:21 UTC, Aug 21.
You, of course, will claim that I have used existing science to make this prediction. You’re right. I hope it comes to pass. I’m also predicting that you and I will be alive at that time. Any 12 year old could do as well, I think you’d agree.
I’ve actually read more than one book by Feynman, and more than one by other authors as well. You don’t have to believe me, of course. Others may.
I don’t care what you think, of course.
Maybe you’re making yourself look like a foolish Warmist, maybe you’re not. Can you make a prediction more accurately than myself (or a 12 year old, if you think I’m too clever for you)?
Foolish Warmist! No GHE! Climatology is not science.
Cheers.
Mike,
Too much caffeine will be the end of you.
Beyond that, I’m beginning to think you and David should stick to his blog where the two of you can jabber all you wish.
Best wishes for a sunny day (according to the weather man)
Lewis
lewis,
You wrote –
“Beyond that, Im beginning to think . . . “
Excellent. A good start. Do you think you can keep it up? I wish you every success!
Cheers.
Mike,
You should try it yourself.
Weatherman said a beautiful day. She was correct.
Lewis
Mike…”Boil your beaker. Measure the temperature. Not 100.000 C. Prediction busted”.
PV = nRT…pressure…altitude. Climbers on Everest complain about how long it takes to heat water at altitude on Everest.
Feynman told us we cannot rely on a reality like the boiling point of water. In the limit, reality as we know it tends to disappear.
Gordo, what did Feynman say, exactly?
As a student of science, I’m interested.
Snape says:
“Its very hard to know what is the result of climate change and what is just natural variation.”
Yes. But over a long-enough period of time, the natural variations average to zero, and climate change is what’s left.
How long? A couple of decades for ENSOs, the primary natural variation. Longer for natural variations like the PDO and AMO, though they aren’t extreme as are the ENSOs.
The WMO recommends looking at a period of 30+ years to discern climate change.
You can go longer if you want — the climate has been obviously warming since the 1970s — and, very arguably, since the beginning of the industrial era — and there’s no scientific doubt this warming is due primarily to human CO2 emissions.
David
Why did you quote 1/2 my comment and ignore the other half? So you could have the pleasure of lecturing me?
I wrote, “Its very hard to know what is the result of climate change and what is just natural variation. The warm summers youre talking about?.you would need to look at long term temperature trends in your area before attributing them to global warming.”
Mike…”Are you another foolish Warmist who believes the future can be predicted by detailed analysis of the past?”
Ironically, skeptical climatologist, Patrick Michaels, and others, have had better success predicting future climate states using past trends than climate modelers have using their witchcraft.
Gordon,
I did a little exercise calculating tomorrow’s maximum temperature based purely on today’s. From recollection, 93% accurate within 1 sigma. I’m in the tropics, near the sea, with two distinct seasons, so the results are not too surprising.
Generally, in temperate regions, 85% success rate for a naive forecast that tomorrow will be the same as today seems to be about right for temperatures.
Commercial wind forecasts for wind turbine power outputs are usually naive persistence forecasts.
The problem occurs when you need something useful – say if you’re going to lay an exterior concrete slab. Will it rain? How much? When?
I like my aircraft to have 100% accuracy in predicting my safe carriage. 99% is not nearly good enough for me!
Cheers.
Gordon Robertson says:
“Ironically, skeptical climatologist, Patrick Michaels, and others, have had better success predicting future climate states using past trends than climate modelers have using their witchcraft.”
Prove it.
Go ahead. Prove it.
That happens from time to time. The Dust Bowl days were no picnic, either. The questions are whether we have anything to do with it, and whether we can do anything to stop it, and the answers are no, and no.
But, maybe if your resources weren’t being diverted to supercomputer facilities that are still nowhere near powerful enough to adequately model the planetary climate, and hordes of rent seekers getting subsidies (from your pocket) to provide useless, intermittent power, you could afford to take ameliorative action.
First you people whine that climate can’t be projected (which it has been, quite accurately), then you whine that the attempts are costing too much money, which they’re not.
How well are your own projections doing, Bart?
Pretty well, DA. Temperatures are plunging as we write, and the rate of change of atmospheric CO2 continues to move in lockstep.
As for accurate projections from the Klimate Klowns… this is a joke, right?
Bart says:
“Temperatures are plunging as we write…”
Prove it.
Do a calculation.
Cite a number.
You never have.
You can’t.
Bart…”The Dust Bowl days were no picnic, either. The questions are whether we have anything to do with it…”
They (you know who…) tried to blame the dust bowl on farmers plowing their fields in the wrong direction, resulting in wind blowing down the furrows and gather loose soil.
They (them again…) also went into complete denial that the early 1930s were as warm as today, even warmer, in the US and Canada. The land in certain parts, like the prairies, had obviously dried out in the heat.
1934 is still the warmest year in the US despite continual attempts by NOAA and NASA to wipe out that record. Why they are so concerned with it is the question, which is obviously a political question.
1934 is still the warmest year in the US despite continual attempts by NOAA and NASA to wipe out that record.
What evidence do you have that 1934 is warmer compared to 2015 or 2012?
2015 is the hottest year in the satellite record for the US. In the surface record 2012 is the hottest year
You’ve made an absolute claim, and we all agree that you need data for that. Do you have it? Or will you complain that there is only adjusted data and you have no source to verify your claim?
How have you personally been harmed by global warming in your lifetime?”
I have not been personally harmed by global warming.
I have not been personally harmed by war.
Or poverty.
Or by polio, smallpox, whooping cough, Spanish Flu or rotavirus.
I have not been harmed by criminals assaulting me.
I have never been so injured that I had to take an ambulance.
I have never sickened from breathing heavily polluted air, or from drinking from an industrially polluted river.
Come on, barry. You can think of a lot more bad things to compare to “global warming”.
For example, you left out brain disorders….
I’m less sure about that. I do reply to you, after all.
Well, if you’re “less sure”, just check your list. That way you can be “sure”, and maybe you won’t try to “spin” the facts.
But, as usual, you didn’t get the point at all.
The “point” is that you are so biased in your thinking you fail to recognize facts.
You may just be one of the stupidest people I’ve ever encountered. Most of your replies are completely tangential. Unless you’re saying you have the ‘facts’ on what I’ve personally suffered.
But you forgot what I’d written the moment you finished reading it. What superlative solipsism.
barry gets his mask pulled off, and responds with insults.
(It’s every time with these types.)
It takes a lot of needling me with derisive, intellectually vacant posts to get the stupid label. You’re in a very exclusive club. Well done.
barry, one of the advantages of pseudoscience is that your opinions are all that count, as you so clearly demonstrate.
Then you are the supreme pseudoscientist. I rarely see you reference sources. When replying to me, pretty much never. As is demonstrated by perusing this thread.
barry, I don’t need “reference sources” when replying to you.
Thus becoming what you criticise.
barry,
You wrote –
“I have not been personally harmed by global warming.”
A succinct answer. Well done! Maybe you can name someone who has?
Make sure you specifically indicate the instance of global warming. Any 12 year old knows about weather variations. Some places get quite hot, on a regular basis. Death Valley, for instance.
Cheers.
barry…”I have not been personally harmed by war.
Or poverty. Or by polio, smallpox, whooping cough, Spanish Flu…”
You can prove there is war, poverty, polio and other diseases, criminals, ambulances, and pollution. However, you cannot prove catastrophic global warming or its relation to anthropogenic causes. All you can do is speculate on that.
My ‘speculation’ is beside the point.
We haven’t ever had a land war in Australia, but the Oz govt speculates that this is possible and spends money on it.
Much of governent policy/spending is on preventing harm. You’re welcome to take this up with the Oz government.
Gordon Robertson says:
“However, you cannot prove catastrophic global warming or its relation to anthropogenic causes.”
What do you mean by “catastrophic?”
It’s not a scientific term, so it depends on the user’s values. What are yours?
Davie, “catastrophic” is when you get drop your slice of pizza face down into the cat litter box.
Now, you can understand “cat–astrophic”!
no, i havent been personally harmed yet by gw. Nor have i been personally harmed yet by drought, poverty, famine, sexual assault…
Whats your point? These problems dont exist?
It’s not global warming, but the cold front will bring massive storms to the central US states.
http://virga.sfsu.edu/gif/17052612_jetstream_h48.gif
Increasing precipitation is the first sign of cooling.
http://www.lightningwizard.com/maps/North_America/gfs_cape_usa45.png
Sorry,sorry,sorry.
http://files.tinypic.pl/i/00904/1wxbwrradety.png
Great points Roy, agree with everything.
What’s really awful about this debate is that there is so much variability and uncertainty in the climate system that trends probably had a decent chance at following the official predictions even if the anthropogenic portion is only 50% — imagine the tone of the debate if the world looked like the Hansen 1988 temperature predictions.
I’m still hoping temperature prediction markets will eventually become a facet of the debate. When climate science can actually predict the future with reliability, it will be self-funding too!
With all due respect. Your comment “Its sad to see how far peer-reviewed climate science has fallen.” You really think you are that exclusive?
You should see what I have to deal with each time I get new engineers!! (disclosure: I am an environmentalist, working on O&G midstream facilities. Energy and Environment)
https://www.iceagenow.info/demolishing-link-co2-climate/
This is pretty much my argument when it comes to co2 and the climate.
There are a lot of flawed assumptions, holes and lack of referencing in that paper.
It is based on the premise that CO2 is the only climate driver in the modern age – and implies this is the view of the IPCC and climate researchers.
The publication states that “Mathematical articles are outside the scope of Energy & Environment,” which may explain why there is no math, and many of the values are wrong. Energy and Environment is a social-sciences, policy-interest publication. (Not to be confused with the better-known Energy & Environment published by Elsevier).
The two authors are from Principia Scientific, who don’t believe in the ‘greenhouse’ effect. WUWT bans these people, and Dr Spencer does not welcome their nonsense here.
The text is blog-standard. It’s non-scientific, and could only have been allowed (if it received peer-review at all) by a social studies journal. It even uses the term “Orwellian.”
There are many flat out errors that should instantly have precluded publication in any reputable journal. Here’s one…
Paper cites the US Department of Energy to say that the anthropogenic proportion of CO2 is only 4 – 5%. However, the DOE reference is for one year. That’s a Class 1 mistake.
Amusingly, paper says that the DOE value is “shown below.” It is actually shown above (page 7). Reviewers, if any, are mighty slipshod.
Cites Petit’s 422,000 yr Vostok ice core record for values as low as 125ppm in the ice core. But the record has no values lower than 180ppm.
Paper says the processes associated with orbital dynamics must be the cause of recent CO2 rise, just as before. But the ice core records show maximum CO2 levels at 300ppm for the whole record of various glacial/interglacial periods. The atmosphere is now at over 400ppm. And this at a time when orbital mechanics should be producing a slow cooling (with lower CO2) for the last 8000 years.
I’m pretty sure the authors do not realize that the ice core data they are citing stops at 1950.
This is an egregiously flawed paper. One doesn’t have to be partisan to spot bald errors of fact.
I do not wish to carry any of Principia Scientific’s water. While I do believe that there are reactions within the climate system that render the additive GHE from increasing CO2 essentially nil, I do not consider GHE theory wrong on first principles.
However, I do want to take issue with a few of your points:
“It is based on the premise that CO2 is the only climate driver in the modern age and implies this is the view of the IPCC and climate researchers.”
This is a cop-out. The AGW hypothesis is based on the premise that, circa 1970, increasing CO2 became a dominant influence on planetary temperatures. It is totally inconsistent to ascribe the temperature increase from 1970-2000 to rising CO2, then posit that natural variability stifled the influence in the 2000’s. If natural variability is large enough essentially to cancel the CO2 effect, then it is not dominant, and there is no basis to ascribe the earlier warming episode to CO2.
“Paper cites the US Department of Energy to say that the anthropogenic proportion of CO2 is only 4 5%. However, the DOE reference is for one year. Thats a Class 1 mistake.”
It is not possible to alter a natural balance by a greater proportionality than one’s proportionate addition to the input which maintains the balance. Atmospheric CO2 is dominated by natural influences.
I do not expect you to believe me – most people are too invested in post-hoc-ergo-propter-hoc rationalization about this issue to consider the flaws in the reasoning. But, if temperatures going forward continue to stall, or even decline, the rate of change of atmospheric CO2 will follow.
Emissions are not going to decline in any honest accounting. So, either the divergence will eventually become too stark to ignore, or they will fiddle with the emissions data to try to preserve the narrative – fiddling with the data to preserve the narrative is something we have witnessed all too often in this sorry drama.
“But the ice core records show maximum CO2 levels at 300ppm for the whole record of various glacial/interglacial periods.”
The ice core records are low resolution. Nobody really knows what the resolution is. But, if it is low enough, then the current rise is unremarkable in that record. See especially figure 9 here:
https://tinyurl.com/ybsbkhtb
bart, interesting article. What do you make of the graph showing, even in the highest resolution record, the LIA reduction in CO2 is < 10 ppm.
How can this possibly be explained by temp driving co2 then and now?
I think it is entirely speculative. We know the ice cores lose resolution over time, but we don’t know how they do it. Applying a linear time invariant filter to the data gives us a qualitative feel for how smoothing over time works, but it is not a validated model. The true dynamics are probably time varying, possibly even chaotic to some degree.
Who knows? Who cares? Why bother speculating about unverifiable proxies when we have modern direct data that show a clear relationship over the time of particular interest?
‘Who cares?’ You should care because it means either slow temp variations over last millenia are much MUCH smaller than those of last 100 y, or CO2 doesnt respond very strongly to slow temp variations In temp.
Take your pick, but i think it is the latter.
Or, its just total garbage, and doesn’t mean much of anything. You are presenting an either/or fallacy, also known as a false dilemma.
‘Or, its just total garbage’
certainly can say the same thing about your notions
Bottom line is, we don’t need it. The best, most modern, and direct measurements we have taken since 1958 tell the story. No need to speculate on something unverifiable. We’ve got enough good data to see what is happening.
Bart,
Even if everything you say is true, the paper is still astoundingly flawed for the reasons I gave (and others).
The author’s selected the 422k year Petit data and then cited values that are not supported by that data. For all we know, they made them up.
They do not make your argument about CO2, they argue that the ‘recent’ anthropogenic increase is 4 – 5 %, citing the DOE value that refers to the annual proportion of anthro CO2 to total emissions. They are citing a single year’s data and saying it represents the total of anrtho CO2 emissions over time.
Whatever else we disagree on (and we do), these points alone are enough to discredit the study. They’re not subtle nuances.
Barry – As I said, I am not on “their” side. But, you err here:
“They do not make your argument about CO2, they argue that the recent anthropogenic increase is 4 5 %, citing the DOE value that refers to the annual proportion of anthro CO2 to total emissions. “
It was specifically my point that if the annual proportion of anthro CO2 to total emissions is not more than 5%, then the increase due to anthro emissions cannot be greater than 5%. They are on solid ground here.
True, you will find few who currently agree with that, even among self-styled skeptics. But, the number of people who disagree with a concept is not a reliable gauge of scientific validity. It is a very basic principle that a stable equilibrium established by two opposing forces cannot be perturbed by an addition to the inputs by an amount proportionally greater than the proportion of the added input.
Eventually, when the contradictions in the paradigm become too obvious to be swept under the rug, the current consensus will collapse. The debate will come back down to Earth, and people will wonder why they ever abandoned elementary physical constraints to hypothesize an impossible effect.
Atmospheric CO2 concentration is overwhelmingly a temperature dependent process. Human inputs have negligible impact on it.
There is no doubt about it.
https://tinyurl.com/y7z3ylpk
Feel free to believe what you want to believe. I don’t want to argue about it. I’ve watched too many educated fools deny what is right in front of their eyes, and come up with hopelessly convoluted rationalizations for why it isn’t true, to have much desire to debate it anymore. Time will tell.
Bart says:
“Atmospheric CO2 concentration is overwhelmingly a temperature dependent process.”
Look at the math major, who is so convinced he’s smarter than everyone else but doesn’t understand a lick of physics.
Shame, really. Except for the arrogance.
Keep telling yourself that, and rock yourself to sleep and dream sweet dreams.
Bart, they do not make your argument. They mistake annual contribution for total.
But this is beside the point. Of 16 references cited by the paper, 6 are journal papers and their data sets, and 10 are from blogsites, youtube and wikipedia.
They cite numbers that are unsupported by their references (eg pre-industrial minimum CO2 value 125ppm – their source goes no lower than 180ppm).
Before arguing the fine details, could you at least agree that the ‘paper’ is woefully sub-par as a scientific source? That would give confidence that a discussion on the details would be worthwhile.
I have already made my statement on the organization, as much as I will. In a world where alarmists still try to push the serially debunked “hockey stick” as scientific fact, I am loath to train my fire on my own side.
That’s what happens when science is allowed to be politicized. I didn’t politicize it, but I’m not going to cooperate in a divide and conquer strategy that goes against me.
In a world where alarmists still try to push the serially debunked hockey stick as scientific fact, I am loath to train my fire on my own side.
I have made this observation about skeptics many times here. Some ‘warmists’ have a simlar bias, and quite obviously. I’ve got no problem criticising whatever source. I’ve done so regarding skepticalscience, for example.
But I hear you on Principia-Scientific. I won’t use this concession as some kind of political gotcha. That kind of discussion tactic is contemptible.
The truth is all that matters. For a science-based discussion to progress, trust in the intellectual fidelity of your opposition, to the exclusion of political concerns, has considerable currency (at least to me).
That’s why I tipped my hat to Kristian downthread. I trust that his view, or at least his reasoning, is not shaped by political ideology. I think he’s someone worth spending time talking to.
If you want to talk about the details in the paper, I’m up for it. Continuing below…
The AGW hypothesis is based on the premise that, circa 1970, increasing CO2 became a dominant influence on planetary temperatures. It is totally inconsistent to ascribe the temperature increase from 1970-2000 to rising CO2, then posit that natural variability stifled the influence in the 2000s.
It’s not inconsistent if the natural variability is internal to the climate system. We’re speaking hypothetically so…
If rabbit population was a (proven) function of habitability area, and the habitable area was constantly expanding, fluctuations in rabbit population that are not dependent on area do not disprove the causation of the long term population growth.
However, there are external forcings on climate that could also explain (partly) short-term (decadal-scale) fluctuations. Atmospheric aerosol loadings, for example.
And this is the point where the discussion could move to non-theoretical.
It is beside the point. I distanced myself from the organization when I first replied. Everything after that was focused on your points. Not to prove them right, but to help you refine your own arguments.
It is not possible to alter a natural balance by a greater proportionality than one’s proportionate addition to the input which maintains the balance.
Interesting comment. Here’s a theoretical experiment.
A dam is receiving constant annual stream flow. An aperture at the bottom is spilling the water out at an equal rate. Dam water stays level.
Another stream is diverted to to the lake adding 10% of the original stream flow to total input. The outflow from the aperture increases by 5%.
If input has increased by 10%, and output has increased by 5%, wouldn’t the increased input add more total water to the dam, after a time, than it’s percentage input?
You may remark that the analogy to the real world is flawed in some way, but this a a hypothetical based directly on your quoted comment, so can we confine our discussion to that comment for the moment? I’m interested in testing that validity of that statement at first.
“If rabbit population was a (proven) function of habitability area, and the habitable area was constantly expanding, fluctuations in rabbit population that are not dependent on area do not disprove the causation of the long term population growth.”
Ah, but are you not stacking the deck here, by suggesting the relationship is “proven” before the evidence is in “proving” it? If “fluctuations” are so large as to flatten the population curve, the “proof” of a significant relationship with habitable area would be very suspect.
You have, of course, chosen a relationship that, on its face, seems intuitively obvious. But, is it really?
In fact, habitable regions for rabbits are very extensive, and I doubt that is a serious limiting factor on populations. They are persistent and rapidly reproducing critters – I have a colony living somewhere near me in an area significantly covered by human development, and regularly see them hopping through my yard.
But, they are also very tasty. I would expect predator-prey relationships would likely be the dominant factor in rabbit populations. Only to the extent that the expansion of “habitable area” meant area without predators would I expect a dominant relationship to hold. That is, an area without a feedback dynamic that would tend to reduce the population, and hold it in check.
Just as, only to the extent that all other influences remain constant would I expect increasing GHG concentration necessarily to lead to surface warming.
The ice core records are low resolution. Nobody really knows what the resolution is. But, if it is low enough, then the current rise is unremarkable in that record. See especially figure 9 here:
I see nothing in that whole article that supports the 125ppm figure.
But to your general point:
No ice core of any resolution registers a CO2 change of more than 10ppm over a few years. The about 1000 year DE08 record, which the author posits has a resolution “at least as fine as 30 years, has a maximum deviation of 10ppm (around 1610), and is constrained from 270ppm to 285ppm over the pre-industrial period, whereupon it shoots up rather dramatically from about 1800 to 1950. As we know, the rise has been even more dramatic since then.
At best, your argument could be “we don’t know if there have been more dramatic changes at decadal/centennial scale than from the beginning of the 20th Century to present”.
It may be possible that there has been another sharp (100ppm) increase in global atmospheric CO2 over a century in the last 800,000 years, but none of the evidence remotely supports that.
“If input has increased by 10%, and output has increased by 5%, wouldnt the increased input add more total water to the dam, after a time, than its percentage input?”
Output is governed by pressure at the aperture, and pressure is proportional to height of the water column above the aperture. So, once the water has risen 10%, the outflow will have increased 10%, and the new output will balance the input.
Bart
You you are totally misunderstanding the situation. In this scenario, water pressure would NOT increase in proportion to greater inflow.
If the dam had a ceiling, and the water was not allowed to rise, then, yes, the extra inflow would be forced down the aperture. This is not the case because the water level of the dam is free to rise.
“It may be possible that there has been another sharp (100ppm) increase in global atmospheric CO2 over a century in the last 800,000 years, but none of the evidence remotely supports that.”
Neither does it contradict it.
There is a fundamental problem with the hypothesis that CO2 levels were rock steady for tens of thousands of years, and were suddenly perturbed by our small inputs. I think I have described it to you before. I will be glad to review it with you again tomorrow, but right now, my wife is calling me, and I must go.
Ah, but are you not stacking the deck here, by suggesting the relationship is proven before the evidence is in proving it?
Indeed I am. I’m testing the logic of your posit.
So, once the water has risen 10%, the outflow will have increased 10%, and the new output will balance the input.
Agreed.
Would you agree that the size of the aperture is relevant to the water level?
If we suddenly widen the aperture, outflow increases and the dam lowers its level until pressure reduces at the aperture. This takes time. You imply that in your comment (“once the water has risen…”)
If we increase the flow but keep the aperture the same size, it also takes time for the level of the lake to stabilise at a higher level.
And this is the point. The DOE chart gave a fixed value for a short interval. The paper treated it as if it was the long-term value.
Let’s add one more detail to the analogy.
What happens if the additional input increases over time?
That’s another point the paper overlooked. (Proportions are values as of 1995).
right now, my wife is calling me, and I must go
Ok.
I can’t remember you discussing rocksteadiness of CO2 levels prior the IR. Yes, let’s chat about that when you’ve time.
I’ll start off with a few points.
“Rock steady”: I’m aware of qualitive statements on global atmos CO2 levels, but am also aware that the estimated numbers fluctuate around those means during interglacials and depths of ice ages. Around 10-30ppm, at most. I seem to recall slightly higher regional variations, but not global.
The range between glacial/interglacial is consistent across many ice cores (and other proxies, like boreholes) for the late quaternary period. None show global maximum of up to 400ppm. Possible, I suppose, but no evidence to support.
People cite Beck for early 20th century annual concentrations fluctuating wildly (about 50ppm at least IIRC), but I can’t take it seriously in light of the much more robust sampling since the mid 1950s, which shows no such wild variation at all. Beck’s methods were pretty poor – he sampled from CO2-rich sites (cities, industrial areas) at random times. I just can’t buy that CO2 levels magically smoothed out from precisely the time Keeling started measuring it.
Jaworowski, for similar and other reasons, is highly unconvincing. It’s hard to give credence to maverick views. FTR I’ve spent some time assessing the details of his few papers on the topic of CO2 from ice cores – I haven’t written him off only because his view is a virtually unique outlier.
Would you agree that the size of the aperture is relevant to the water level?
Yes, but not to the proportion of the level that is due to the main flow versus that due to the added flow.
If we increase the flow but keep the aperture the same size, it also takes time for the level of the lake to stabilise at a higher level.
This particular system is first order – at no time will the increase in the lake level proportionately exceed the added proportion of the input. Once the lake level has risen 10%, the outflow rapidly equilibrates, and the rise ceases.
An underdamped system response could produce a transient exceedance of the proportionality, but that is really reaching. There is no reason to expect the CO2 regulatory system to be significantly underdamped, and the data indicate it is not, as the increase over at least the past 59 years, and almost surely before, is overwhelmingly temperature related.
What happens if the additional input increases over time?
When it is 1% of the main flow, it can raise the level by 1%. When it is 5%, it can raise it by 5%. When it is 10%, it can raise it 10%.
I cant remember you discussing rocksteadiness of CO2 levels prior the IR.
Tight regulation is a property of wide bandwidth feedback systems. Low bandwidth regulation tends to produce widely varying output which over relatively short term intervals is indistinguishable from a random walk, with variability increasing essentially as the square root of time.
A system that maintains CO2 in a tight band over 10s of thousands of years is necessarily high bandwidth. Yet, a system which is inordinately sensitive to small perturbations is inherently low bandwidth.
You cannot have both high and low bandwidth at the same time. Thus, there is a fundamental contradiction in the narrative. Unfortunately, climate scientists are not feedback engineers, and they do not understand these things.
Ive spent some time assessing the details of his few papers on the topic of CO2 from ice cores.
Ive not spent a lot of time. In my book, a process which cannot be verified in an end to end test is an exercise in confirmation bias. Ive seen way too many seemingly solid expectations refuted in lab experiments to ever consider otherwise.
I know the ice core narrative has problems, for the reasons I have given above. I know that direct measurements from MLO are far superior. And, the tale they tell for the last 59 years is consistent and clear. As that is the era over which the lions share of the purported rise has been observed, that is sufficient for me. The rest is academic.
Snape says: @ May 28, 2017 at 12:14 PM
“This is not the case because the water level of the dam is free to rise.”
And, underwater pressure does not increase with depth. Sure thing. Weird physics you got there on your planet.
I’ve seen dumb responses before, but this one really does take the cake. I don’t know whether to laugh or cry.
Warning: may be NSFW: https://tinyurl.com/j9rvb24
Bart
Sorry, I was confused by the situation. I had never thought about this idea in terms of percentages.
Of course I knew water pressure increases with depth, but that was about all I knew.
The ice core data is pretty uniform presenting that sawtooth shape, no matter where the ice core is drilled. Methane proxies match. Proxies from other sources match the ice core proxies.
I guess they could all be ‘wrong’, but the consistence of evidence (within the bounds) is remarkable. I’m not sure how a random walk applies with such regularity and with multiple corroboration of it.
“The ice core data is pretty uniform presenting that sawtooth shape, no matter where the ice core is drilled.”
That only tells us the physics of the ice cores are consistent and repeatable. It does not tell us what they are.
“Methane proxies match.”
A “match” is often in the eye of the beholder. I am not aware of this “match”. However, all proxy measurements which rely upon measurements of diffusive gases have to make assumptions about diffusion rates and resulting resolution, and resolution is necessarily limited. What would appear to be spikes in a 100 kyr record, but in reality are extended periods of elevated CO2, would be smoothed out and lost.
“Proxies from other sources match the ice core proxies.”
Not so much. Stomata measurements, for example, disagree. This has been ascribed (rationalized) to various causes, but the bottom line is, they don’t agree.
“Im not sure how a random walk applies with such regularity and with multiple corroboration of it.”
That is the point. If the CO2 regulatory system is low bandwidth enough to be so sensitive to our forcing, then it should have shown a lot more variation in the past.
Of course, it is my contention that there was a lot more variation in the past, and it is masked by loss of resolution in the ice cores. But, that only means there are no data to indicate that our era is in any way special.
The current paradigm holds that CO2 was maintained in a tight band for millennia, then took off due to our puny forcing. That paradigm is internally inconsistent. Strike one.
Then, we have the problem with the purported response to our input proportionately exceeding its proportionate addition to the natural input flows. Strike two for the paradigm.
Then, we have the fact that the best, most accurate, most modern and direct measurements show that the rate of change of atmospheric CO2 is proportional to temperature anomaly relative to an appropriate baseline. One can reconstruct the CO2 record to high fidelity simply by applying the appropriate affine coefficients to the temperature anomaly record, and integrating. Human inputs are not needed, indicating that they do not have a significant impact. That is strike three for the paradigm.
If the historical temperature pattern holds, we should soon be entering, or have already entered, an extended period of about 30 years of relative stasis or even decline in global temperatures. That will produce either a stasis or decline in the rate of change of atmospheric CO2. Emissions will almost certainly continue to increase. That will produce a marked divergence between emissions and atmospheric content which will become undeniable.
There is already such a divergence (see https://tinyurl.com/ycl644a6), but it has not yet reached such a critical level that it can collapse the paradigm. The paradigm of anthropogenic forcing of atmospheric CO2 levels is a post-hoc-ergo-propter-hoc fallacy that has become so firmly rooted that most people are not yet even willing to consider an alternative. It is going to take a major discrepancy to overcome it, and we are just not there yet. You guys now have front row seats to the unfolding drama. Grab your popcorn and buckle up.
Then, we have the fact that the best, most accurate, most modern and direct measurements show that the rate of change of atmospheric CO2 is proportional to temperature anomaly relative to an appropriate baseline.
CO2 rise is also proportional to anthropogenic emissions. The fit is excellent. It’s also an excellent fit to increasing CO2 emissions.
So both our ‘models’ look good. But, as you know, I think yours is more a feature of small-scale deviations rather than the overall rise. I can explain your model, but I think you have trouble explaining mine, without invoking the notion that the year-on-year anthro output is swallowed up by all other sources and magically disappeared.
A match is often in the eye of the beholder. I am not aware of this match.
Ice core researchers usually do more than just look for CO2, they look at temp, aerosols and other gases. The methane profile is an excellent fit to the CO2 profile.
Here’s a comparison with ice core and benthic &13C proxies for CO2.
https://tinyurl.com/y8orr5me
That’s from this paper.
Similar results from this paper, which uses boron isotopoes in sea shells as a proxy.
The fit is remarkable, considering they are very different proxies and have different resolutions. It’s something of a stretch to hope that 100ppm departures on centennial scale might be present if none of the proxies (not even leaf stomata) of any resolution capture that amplitude.
Methane: ice core researchers don’t just look for CO2 records, they also look at aerorosls, temperature etc. From the early papers to present, methane and CO2 have always showed close correlation. Here’s one of the famous early ones.
https://tinyurl.com/y8p7l8ec
The evidence combines well for the mainstream view. The evidence of 100ppm rises in global atmos CO2 on centennial scale in the geological record is very thin (does it even exist?).
“CO2 rise is also proportional to anthropogenic emissions. The fit is excellent.”
It is poor. Just a vague movement in the same direction. Really just a coin flip.
“But, as you know, I think yours is more a feature of small-scale deviations rather than the overall rise.”
That is what makes it far superior. It matches at every scale, not just in the sense that they are vaguely going in the same direction.
“…without invoking the notion that the year-on-year anthro output is swallowed up by all other sources and magically disappeared.”
That is how feedback systems work. They can seem magical because they often go against intuition. But, the behavior is quite ordinary.
“The methane profile is an excellent fit to the CO2 profile.”
Meh. Hardly surprising that ice core measurements are consistent with one another.
https://tinyurl.com/y8h9xfvf
Barry: “CO2 rise is also proportional to anthropogenic emissions. The fit is excellent.”
Bart It is poor. Just a vague movement in the same direction.
This assertion just looks like a denial of facts.
Averaging a rate of 44% of global anthro emissions, annual atmospheric CO2 has increased in virtual lockstep over the time of the keeling curve.
Whereas annual temperatures have been far more erratic.
From 1940 to the mid 1970s global temperatures were flat or cooling, depending on data set.
From 1958, the beginning of the Keeling record, temps were still cooling to 1977.
Yet CO2 rose in that period.
http://tinyurl.com/y9gl56hl
That’s a very poor fit. CO2 did not follow global temperature change for 20 years, and almost certainly it did not for more than 30 years.
You’re focusing on acceleration, I’m focusing on total concentration. Let’s get a visual on that.
Atmos CO2 / derivative (scaled to compare)
You are focused on minute changes (in acceleration) and claiming these represent the overall rise of CO2. Sure doesn’t look like it, does it?
Now let’s add in global temperatures.
Atmos CO2 / derivative CO2 / global temps since 1959
Again, minute changes in acceleration CO2 compared to total change, scaled to global temps.
I agree that temperature affects CO2 levels – at a very small percentage of total on monthly/annual time scales. When temperature spikes, CO2 often spikes at a fraction ppm with it.
Where we disagree is with the overall contribution to changes in atmos CO2 levels. Annual anthro emissions provide a far better fit with cumulative CO2 concentrations, with atmospheric addition being about 44% of anthro emitted, fairly consistently over time.
Atmos concentration / anthro emissions (/ global temps)
“Averaging a rate of 44% of global anthro emissions, annual atmospheric CO2 has increased in virtual lockstep over the time of the keeling curve.”
Why would you scale by such an arbitrary number? Why would you expect the atmospheric level to be proportional to the sum total of anthro emissions? Going back to our lake analogy, is the level of a lake proportional to the sum total of water provided by the sources over the years? If so, shouldn’t every lake overflow in time?
“CO2 did not follow global temperature change for 20 years, and almost certainly it did not for more than 30 years.”
This is difficult to discuss with you because you do not know calculus. But, the relationship is between the rate of change of CO2 and temperature anomaly:
https://tinyurl.com/mmlp2lu
To get the comparison of absolute CO2 for this model, you must integrate:
https://tinyurl.com/kwmmsvk
It’s a really good match, particularly because it matches both in the rate domain, and the absolute domain. The emissions do not match in the rate domain much at all. They just have a superficial resemblance on a low order polynomial, low information basis in the absolute domain.
“Annual anthro emissions provide a far better fit with cumulative CO2 concentrations…”
Not really. Note that, in the plot, the only relevant lines are the red and blue one. The red is purported to track the blue one by the factor of roughly 1/2 (your 44%), but it’s just two largely unrelated, approximately 2nd order polynomial curves. It’s always easy to get a superficial fit between such items – you just compute the affine coefficients from a least squares fit of the one against the other. But, it’s essentially meaningless. It does not match in the fine detail.
In response to my criticisms, Ferdinand has played around with his model, and now includes temperatures to get a match with the fine detail. But, it’s a nonphysical exercise, because he has natural and anthro CO2 treated differently by the sinks, and nature has no means of distinguishing the two.
Bart,
‘You cannot have both high and low bandwidth at the same time.’
I dont see the problem you’re having with this. Clearly the ocean surface ~ 100 m responds quickly to co2 in the atmosphere. At the same time, the ocean as a whole will respond much more slowly. The deep ocean is not exposed to the atmospheric co2 concentration changes immediately. It takes, probably, several hundred years for the deep ocean to overturn and equilibrate with the atmosphere. This was the argument made in the original Callendar paper.
So you have a system with both a high bandwidth component and a low bandwidth component, intrinsically built-in. No?
No. But, you have touched upon the reason that we have a rate dependent relationship between atmospheric CO2 and temperature. It takes a long time for the oceans to equilibrate from top to bottom to a change, including a change in temperature. A long term response naturally looks like it is tracking the integral of the input over a given near term interval of time.
No? Why no? Pls explain.
if, as you agree, we have reservoir with a very long time constant, the deep ocean, then the rate of flow of co2 into it could easily be < than the anthrop production rate. Then we get a growth in ppm. Done.
“Then we get a growth in ppm.”
This is unrelated to the question of the consistency of the purported levels via the ice cores vs. the alleged sensitivity, which I have explained.
But, I have always said human inputs do contribute to the level. The question is, how much? And, the answer is, not significantly compared to the natural, temperature dependent change.
‘unrelated to the question of the consistency of the purported levels via the ice cores vs. the alleged sensitivity, which I have explained.’
Is absolutely related to your assertion that there is bandwidth problem, that the response of CO2 to emissions cannot be both high BW and low BW.
‘But, I have always said human inputs do contribute to the level. The question is, how much? And, the answer is, not significantly compared to the natural, temperature dependent change.’
Here you are making an assertion about magnitudes, ‘not significantly’. Then you need to show a calculation that demonstrates this. Cant just make a hand-waving argument.
On the other hand, Callendar shows a calculation and shows significance of the anthro contribution.
Can you find the fault with his calculation?
https://www.rmets.org/sites/default/files/qjcallender38.pdf
“Can you find the fault with his calculation?”
Sure. He is just guessing at the rate of uptake by the oceans, and he has no temperature dependence of it, and a temperature dependence is clearly indicated in the data we now have, but he did not.
‘He has no temp dependence’ . He certainly does have temp dependence of seawater solubility of co2, and uses it.
You on the other hand gloss over this issue while asserting that a co2 ppm rise of 50% can arise from warming seawater by < 1C. Do you know if that is even possible?
Again do you have any calculations?
barry…”The two authors are from Principia Scientific, who dont believe in the greenhouse effect. WUWT bans these people, and Dr Spencer does not welcome their nonsense here”.
So, because they don’t believe in the GHE, the entire site has to be wrong?
Barry, I pick you up as being an intelligent person, full of good intention, but with a serious blind spot when it comes to climate-related matters.
Have you tried reading any of the arguments on the site in question? Before panning realclimate, desmogblog or skepticlscience I read widely through their articles. I am not familiar with the site per se, but I just read an article on there about Venus that made perfect scientific sense.
https://plus.google.com/+ChrisReeveOnlineScientificDiscourseIsBroken/posts/hdDa75Zk3sd
There is a paradigm that the atmosphere on Venus is due to a runaway greenhouse effect. However, the Venus Pioneer probe launched in 1978 measured a surface temperature near 460 C. That is far too hot, given the solar heating of the planet, to come from a greenhouse effect. Such a temperature contradicts the 2nd law, according to astronomer Andrew Ingersoll, if a greenhouse effect is the cause.
Despite such blatant proof based on direct measurement, many scientists still cling to the old notion that Venus has an atmosphere caused by a greenhouse effect.
As the probes descended through the atmosphere they measured a ratio of Argon to Argon isotopes not found in Earth’s atmosphere, further proof that the Venusian atmosphere and the Earth atmosphere had different origins.
The current AGW theory was pushed by James Hansen who was an astronomer before taking up climate modeling. Hansen believed strongly in the theory of Carl Sagan that the Venusian atmosphere came from a runaway greenhouse effect. In other words, modern AGW theory depends strongly on Venus having developed its atmosphere from a runaway greenhouse effect.
gordon, again you demote Hansen from climate scientist to astronomer, but whatever you call him he was and is an expert on planetary atmospheres. Quite useful expertise for this issue.
No one has a viable alternative explanation to explain Venus’s temp vs Mercury’s vs Earth’s other than GHE.
Gordon,
I’ve been reading pro and con blogs for 10 years. One thing I learned very early on was to check their source material.
I read the scientific study that the linked blog page uses as the reference for its “argument.” I made specific criticisms about that paper (the authors beliefs were given for context).
Have you anything to say about those specific criticisms? Note: you’d have to read the blog post first, and if you’re going to be serious, the ‘paper’ that it rests on.
barry…”Ive been reading pro and con blogs for 10 years. One thing I learned very early on was to check their source material”.
I was not talking about the paper per see but about your criticism of the site and your claims that the site does not believe in the GHE. You also inferred Roy does not welcome their ‘nonsense’ here.
I gave an example of their so-called nonsense and it sounded pretty scientific and factual to me. I can’t say the same for nonsense I have read on realiclimate or skepticalscience, where posters are banned for offering an opposing opinion.
I was not talking about the paper per se
Then you are not talking about what i’m talking about.
but about your criticism of the site and your claims that the site does not believe in the GHE.
The authors of the paper are not the authors of the blog site. I haven’t checked to see if “it” believes in the GHE or not. And considering the site references a deeply flawed paper, I’m not inclined to conduct a review of it.
In any case, blog sites are not the ideal source for scientific information. They can be useful gateways, though.
I gave an example of their so-called nonsense
You supplied a different source on Venus.
and it sounded pretty scientific and factual to me.
I had a quick look at your link. It doesn’t explain Venus surface temps at all.
barry…”There are many flat out errors that should instantly have precluded publication in any reputable journal. Heres one
Paper cites the US Department of Energy to say that the anthropogenic proportion of CO2 is only 4 5%. However, the DOE reference is for one year. Thats a Class 1 mistake”.
Barry…did I say in another post that you are intelligent. Sorry about that.
The article to which Salvatore linked is by a meteorologist and a research chemist. One of the pieces of evidence they offer is satellite data. Here you are on the very site that provides that satellite data and you are in abject denial.
You claim the DOE claim of anthropogenic CO making up only 4% of all CO2 in the atmosphere was for one year. That’s the Obamaized edition of DOE. The previous version produced a table based on the IPCC 4th review. That table has disappeared in the Obama version of DOE.
Anyway, the IPCC stated in words that ACO2 makes up only a small fraction of all CO2 and they based that on an atmospheric concentration of 390 PPMV, NOT one year.
The DOE gave figures in it’s data that translated a graph produced by the IPCC, that followed their claim of 4% by one page. You can work it out for yourself and it comes to a bit under 4%.
It’s on actual page 515 and 17 of 90 in the pdf. On the preceding page you will see “Although the anthropogenic fluxes of CO2 between the atmosphere and both the land and ocean are just a few percent of the gross natural fluxes…”
http://www.ipcc.ch/pdf/assessment-report/ar4/wg1/ar4-wg1-chapter7.pdf
You’ve got it all wrong.
The IPCC quote (p514, not p515) is about annual flux CO2, not the long-term increase.
The DOE graph in the paper also represents the annual flux, not the long-term contribution.
But the paper represents this as the long-term increase.
That’s where the paper gets it wrong.
The DOE chart in the paper was posted in 1996. Nothing to do with Obama. And it states clearly that it is representing annual values.
Here it is:
http://tinyurl.com/yax7qovt
“Annual Increase Gas in Atmosphere”
This is the reference the paper cites to make claims about overall increase anthro CO2.
The error is clear as crystal.
Not an error. See above.
I’m talking about Gordon’s errors here. Eg:
You claim the DOE claim of anthropogenic CO making up only 4% of all CO2 in the atmosphere was for one year. Thats the Obamaized edition of DOE.
The “4%” chart was posted by the DOE in 1996, not during Obama’s term.
I also answered you above.
Barry, Gordon is too wrong for his words to be considered “errors.”
He falls into that Pauli category of “not even wrong.”
Salvatore Del Prete says:
“https://www.iceagenow.info/demolishing-link-co2-climate/
“This is pretty much my argument when it comes to co2 and the climate.”
Salvatore, you’ve been wrong for 15 years now.
Why should anyone believe the commenter who cried wolf?
Your conclusions are in a word wrong, and that will be proven over the coming years, as the temperatures of earth will start a more significant decline (which started in year 2002 by the way).
– Salvatore del Prete, Reply to article: IC Joanna Haigh – Declining solar activity linked to recent warming, 10/8/2010
http://climaterealists.com/index.php?id=6428
DA…”Your conclusions are in a word wrong….”
How do you prove something wrong in the short term if it’s a prediction? You seem to find 15 years significant to prove Salvatore wrong yet you think it’s insignificant when there is no average warming for 15 years.
Bingo!
Gordie: Salvatore made a prediction.
It was wrong.
Everything he’s ever predicted has been wrong.
I’ve quoted many other wrong predictions from Salvatore.
They’ve all been wrong. Without exception.
The IPCC has been wrong, the “consensus” has been wrong….
See where this is going David A?
Kudos to Kristian for arguing against people who are nominally on the same ‘side’ as he in the general debate. I almost never see that happen.
barry, you’re hilarious!
In your comment above, you mentioned a HUGE argument among various goupings of “skeptics”:
“The two authors are from Principia Scientific, who dont believe in the ‘greenhouse’ effect. WUWT bans these people, and Dr Spencer does not welcome their nonsense here.”
And yet, you write you “almost never see that happen”!
Open your eyes.
I give Kudos to Anthony Watts and Roy Spencer for not even bothering to argue with these people.
You may want to check your dictionary under the heading ‘almost’.
And every once in a while, considering doing more than sniping. Unless that’s all your capable of.
barry, just one of the things I am capable of is pulling the mask off those that believe they are unbiased.
But, I’m willing to help you understand the flaws in “CO2 is heating the planet” anytime.
No, you just needle people until you get a reaction. Don’t flatter yourself that you’re doing anything more elevated than that.
It’s amazing that such an “intellectual” as yourself could ever be “needled” by little ol’ me, huh?
You deserve a medal.
Ah, shucks, if you insist. (Please make it gold.)
Barry
Are you familiar with Sunshinehours? It’s a skeptic website, but has really nice, up-to-date graphics for Arctic, Antarctic and Global sea-ice extent.
I can’t figure out what their source is, though. Do you know?
https://sunshinehours.net/
I could possibly figure out their source by combing various data sets and matching them to the latest value on that website.
But I can’t be bothered. Unreferenced graphs are frigging irritating. It’s just as easy to go to source and work from there. Here’s a good page that lists many of the major sources and displays their products.
https://sites.google.com/site/arcticseaicegraphs/
Barry
Thanks. I agree it’s annoying. I thought maybe I was missing a place where they reference their source.
If there is, it’s buried in the site somewhere. I looked for about 3 minutes and gave up.
Sunshinehours is denialism at its worst.
If you can’t quote real science, you have no business commenting here, so get lost and don’t come back.
Unnecessary. Snape’s participation is quite reasonable in general.
David
Is someone embarrassed they couldn’t understand Dr. Spencer’s
simple complaints about peer review?
– I don’t quote sunshinehours
– I spent about 10 minutes looking for the source of their graphs – because they look suspiciously like sea-ice extent graphs produced by Wipneus.
– I was incredulous when I couldn’t find a source, decided to check with Barry.
So why did you feel compelled to insult me?
Also noticed you took one of my comments out of context – presumably as an excuse to give me a lecture about long term trends?
David
You also mocked my claim that westerly-wind bursts initiate Kelvin waves – leading to or strengthening el nino’s. Very rude.
Here’s a quote from a recent study:
“Although the genesis of the canonical cycle can be readily explained by classic theories, we suggest that the asymmetry, irregularity and extremes of El Nio result from westerly wind bursts, a type of state-dependent atmospheric perturbation in the equatorial Pacific. Westerly wind bursts strongly affect El Nio but not La Nia because of their unidirectional nature. We conclude that properly accounting for the interplay between the canonical cycle and westerly wind bursts may improve El Nio prediction.”
http://www.nature.com/ngeo/journal/v8/n5/full/ngeo2399.html
David
Real science? My next door neighbor is a scientist. She’s busy with research, teaching classes, giving lectures, writing papers, etc.
You, on the other hand, spend hours upon hours upon hours bickering with people like Mike Flynn and Gordon Robertson. It’s pathetic.
Here’s more on westerly-wind bursts.
http://onlinelibrary.wiley.com/doi/10.1002/asl.669/full
The current ice cover in the Antarctic.
https://seaice.uni-bremen.de/data/amsr2/asi_daygrid_swath/s6250/2017/may/Antarctic/asi-AMSR2-s6250-20170526-v5_visual.png
BUSTED!! Be careful when you argue with Mike Flynn. His mind is like a steel trap.
“you cant predict the boiling temperature of a beaker of water in your own kitchen Any 12 year old can say Its 100 C. No its not. It varies. So take a properly calibrated temperature sensing unit climatologists claim temperatures can be measured to 0.001 C, so stick with that. Boil your beaker. Measure the temperature. Not 100.000 C. Prediction busted.”
Snape,
Precisely what part of what I wrote do you disagree with, and why?
Foolish Warmists claim that the GHE (or something – the GHE is apparently only a metaphor) will result in certain things occurring in the future – generally to the detriment of mankind, I gather.
These “predictions” are supposedly based on “science”, using specialised climatological knowledge not known or available to the general public. Codswallop!
Even the IPCC states that future climate states are not predictable. Of course, foolish Warmists disagree!
My assumption, like the IPCC, is that the atmosphere and all the other components of the Earth act in chaotic fashion. If this is so, there is no minimum quantifiable change in the inputs at any given time which determines chaoticity to not.
So, being unable to predict the boiling point of beaker of water accurately, where the physics involved are relatively simple, makes mockery of foolish Warmist claims that the average of weather (climate) can be accurately predicted.
Maybe you’ll be able to produce a fact to support any Warmist claims to be able to peer into the future any better than a 12 year old (with 30 minutes instruction from me, if that’s OK).
Fantasy, analogies, and imaginary scenarios are not facts.
Go for it.
Mike
I thought it was a funny example, that’s all. The poor 12 year old gets his prediction “busted” by the wise Mike Flynn.
You wrote, “Fantasy, analogies, and imaginary scenarios are not facts.”
Are you laying down the law and forbidding me from using a metaphor? Ah, shucks
Flynn wrote, “So, being unable to predict the boiling point of beaker of water accurately, where the physics involved are relatively simple, makes mockery of foolish Warmist claims that the average of weather (climate) can be accurately predicted.”
Mike, as you pointed out earlier, a 12 year old boy would not likely be able to accurately predict the temperature of boiling water in his kitchen. This does not mean a scientist would not be able to – maybe not perfectly, but very close. Certainly a lot closer than the boy.
Snape,
Unlike foolish Warmists, I forbid nothing.
If you consider fantasy, analogies, and imaginary scenarios to be facts, you are in good company with foolish Warmists.
As to laws, so far I have found physical laws, such as Ohm’s Law, don’t care about opinion, or what you may think of them. You can’t take a plea, and the judgement is instantaneous and final. No appeals are countenanced.
I don’t lay down laws. I wouldn’t be able to enforce them, anyway.
I leave that sort of thing to foolish Warmists, who call for opponents to be incarcerated, banned, and so on. They can’t actually enforce any of their nonsense, unless they find a legislator gullible enough to believe that their religious utterances are fact. And, of course, there are often weak-minded politicians silly enough to believe that foolish Warmists are presenting fact, rather than unsubstantiated assertion.
As to metaphors, David Appell says the GHE is one of unspecified definition, and I’m reasonably sure you’ll continue to use it.
Be my guest. Maybe continued use of the GHE metaphor will impart a highly polished surface, and a glittering and shiny GHE might appear even more impressive! Nothing under the shiny surface, of course.
Cheers.
Snape,
You wrote –
Mike, as you pointed out earlier, a 12 year old boy would not likely be able to accurately predict the temperature of boiling water in his kitchen. This does not mean a scientist would not be able to maybe not perfectly, but very close. Certainly a lot closer than the boy.
And you base this on what, precisely?
What would a scientist predict the boiling point of water to be, if not 100 C? A 12 year old could do as well, surely. If you wish to go further, you’ll find that the 12 year old can read the same tables that the scientist can. Even use the Internet and a computer.
The point is that the scientist cannot predict the measurement outcome any better than you or I (or my notional 12 year old – I’ll replace him with me, if you prefer).
When dealing with chaos, very close may not be good enough. Lorenz’ research into chaos and the atmosphere started with the realisation that even almost perfect doesn’t necessarily help.
Cheers.
Mike wrote, “maybe youll be able to produce a fact to support any Warmist claims to be able to peer into the future any better than a 12 year old (with 30 minutes instruction from me, if thats Ok)”
Are you sure you still want to go with this, Mike?
Snape,
You wrote-
“Are you sure you still want to go with this, Mike?”
Sure. Why not? I suspect that you’re trying the worn-out foolish Warmist bluff, but correct me if I’m wrong. Am I supposed to be terrified? Panic stricken? Well, I’m not. If you can produce new information, I’ll no doubt change my thinking.
Here’s your chance to flatten me with some facts that I haven’t already considered, if you wish.
Cheers,
Mike
How a scientist could accurately predict the temperature of a pot of boiling water in someone’s kitchen (using the Snape method):
Determine a “standard situation” in which water boils at 100 C
– a specific pressure at sea level
-distilled water
-a particular vessel (glass,copper
etc.)
2. Examine the conditions
present in the kitchen.
– what is the atmospheric pressure
-what impurities are in the
water
-what is the vessel made of
3: note how kitchen conditions differ
from standard situation
4. Calculate the affect these
differences would have
on standard situation
5. Use the information to predict
temperature of boiling water
In kitchen
The prediction would be much more accurate than a 12 year old child’s, especially given only 30 minutes training by you. (the poor kid!)
It also proves your earlier statement false –
“So, being unable to predict the boiling point of beaker of water accurately, where the physics involved are relatively simple, makes mockery of foolish Warmist claims that the average of weather (climate) can be accurately predicted.
MF: The Earths surface receives an average of (1-0.3)*1365/4 = 240 W/m2 from the Sun.
Yet the Earths surface radiates an average of (at 15 C) 390 W/m2.
Explain.
http://www.drroyspencer.com/2017/05/santer-takes-on-pruitt-the-global-warming-pause-and-the-devolution-of-climate-science/#comment-248834
Snape,
Assertions are not fact. Imaginary scenarios are not fact. Claims that something can be done, are not fact.
Your opinion is proof of nothing.
How do you intend ensuring that I, (or my protege,) don’t come up with the same answer as your supposed scientist? You’re waffling. Pious hope doesn’t create fact.
Do you have any facts? Have you actually tried the experiment? No? I thought not. Don’t be surprised if you can’t find an actual scientist prepared to put their name to an actual experiment, given the conditions imposed.
Fantasy is not fact. Opinion is not fact. Keep at it – maybe you can wish the GHE into fact!
Cheers.
Flynn
Your a broken record.
I had to read about boiling water just to get started. Very interesting! Then I enjoyed working out the problem you proposed. Not the boring discussion I had originally thought it was. My apologies.
I’ve learned a lot about science in my efforts to disprove your nutty assertions. 😊
Cheers
Snape,
I’m glad you have learned something.
How are you proceeding towards disproving my supposedly “nutty” assertions? What’s your definition of nutty?
Maybe you could quote me, and provide some facts to support your opinions.
You’re unlikely to disprove a fact, but feel free to try. Still no GHE, however. Can’t even be observed in any repeatable fashion, let alone described.
Maybe you can provide some facts to the contrary?
Cheers.
Mike Flynn says:
“Do you have any facts?”
Ha ha.
When did you suddenly become so interested in facts?
Dear Roy,
As I understood part of the missing heat, relative to the models, is attributed to sea water heating. That would mean that sea water levels should have risen more over the past 2 decades. I don’t remember seeing any evidence of that, which would negate their arguments. So did we observe accelerated sea water rise or not..and are observations in agreement with newish explanations?
But regards, Dagmar
Thermal expanse of the ocean is component of rising sea level- something 1/3 of it. In last century, sea levels have risen more than 8 inches.
And if there was tremendous amount of warming of entire ocean over couple centuries it would be something like 1/10th of C or in terms of couple decades 1/100th of C.
Plus one has all kinds streams with different temperatures/salinity swirling about in the deep ocean.
Dagmar…”As I understood part of the missing heat, relative to the models, is attributed to sea water heating”.
The notion of warming oceans is in part attributed to Kevin Trenberth. He was caught in the Climategate emails admitting in private that global warming has stopped and it was a travesty that no one knew why. When he was exposed in the emails, he started back-peddling and coming up with ludicrous explanations.
One explanation was that our instrumentation was inadequate to detect the warming behind natural forces like El Nino. Then he offered the propaganda that the missing heat was being absorbed by the oceans.
It’s thermodynamically impossible for the oceans to warm while the land surfaces remain at a flat average temperature. Except for the El Nino of 2016, which has largely cooled off, we’ve had 18 years of no average global warming, including the oceans.
Gordon Robertson says:
“Its thermodynamically impossible for the oceans to warm while the land surfaces remain at a flat average temperature.”
Why?
PS: Have you figured out yet
what an electromagnetic wave is?
PPS: Do you need a suggestion for an
online freshman course in physics, Gordy?
” David Appell says:
May 27, 2017 at 8:02 PM
Gordon Robertson says:
Its thermodynamically impossible for the oceans to warm while the land surfaces remain at a flat average temperature.
Why?”
David asks a good question.
One start with question does land warm the ocean.
Or perhaps it’s matter of measurement and the land is supposed to be more accurately measured.
How about question is land currently warmer than the ocean?
In terms of average surface temperature, the average surface temperature is said to be 17 C.
One do simple math and determine what land surface temperature would be if the assumption is the average global surface temperature is 15 C and average ocean temperature is 17 C. Or simply know that roughly the land average surface temperature is much cooler than the average temperature of 15 C.
One can also confirm this roughly by knowing that the two largest countries are Russia and then Canada and both and average temperature somewhere around or below 0 C. And the Antarctic land is larger than Russia and it’s average temperature is suppose to be about -50 C. And then Greenland is colder than -10 C.
One could say the only continent which could increase the average land air temperature would the continent of Africa:
“Africa is the world’s second-largest and second-most-populous continent. At about 30.3 million km2 (11.7 million square miles) including adjacent islands, it covers 6% of Earth’s total surface area and 20.4% of its total land area.” -wiki
And continuing from wiki:
“Africa is the hottest continent on earth and 60% of the entire land surface consists of drylands and deserts. The record for the highest-ever recorded temperature, in Libya in 1922 (58 C (136 F)), was discredited in 2013.”
Though one say it’s got somewhere close to the highest temperatures ever recorded. But officially the highest is Death Valley, California, US on July 10, 1913 [56.7 C (134.1 F) }.
Anyways not sure what Africa’s average temperature is and it’s twice the land area of Antarctic continent. But wild guess is it is somewhere around + 15 C. Or if just averaged Africa and Antarctic [the coldest and hottest land masses] the average should be well below 0 C.
Now one could claim in the contest of land vs sea, that Land has the distinct disadvantage of have a higher elevation of it’s air temperature. But it’s nitpicking, and Antarctic has highest average elevation: “Antarctica is the highest continent on Earth: average elevation is 8,200ft (2500m)”
https://antarctic-logistics.com/about-antarctica/antarctic-environment/
And if removed Antarctic and Greenland from land areas to average with, then land area still has lower average than ocean area.
Now of course land surface temperature can become much hotter than any ocean temperature. Or a typical summer day high air temperature exceeds highest ocean surface air temperature, and the surface of the ground can get much hotter than surface of the ocean. But this simply amounts to more energy radiated into space during such mid day higher temperatures [as compared to the ocean- and partially explain why land has lower average temperature as compared to the ocean]
gbaikie says:
“How about question is land currently warmer than the ocean?”
That is not the question I asked.
–David Appell says:
May 28, 2017 at 6:54 PM
gbaikie says:
How about question is land currently warmer than the ocean?
That is not the question I asked.–
You asked, “why?”
To Gordon Robertson statement of:
“Its thermodynamically impossible for the oceans to warm while the land surfaces remain at a flat average temperature.”
Had Gordon Robertson said” “Its thermodynamically impossible for the oceans SURFACE to warm while the land surfaces remain at a flat average temperature”
It’s sort of self evidence. I wouldn’t say impossible, but I happen to believe that land surface average temperature can’t increase without an increase in ocean surface temperature.
If one isn’t looking human timescales- say you interested in fluctuations on order of thousands of years, Gordon Robertson statement seems plausible but I would say our current interglacial seems to prove the statement wrong. Or I assume the average temperature of the oceans have increase or timescales of thousands of years, and land surface temperatures have decreased. Or their frozen tree stump near arctic region, in region that presently can’t grow trees, but tree were growing there +6000 years ago. And I assume that over a period of +6000 years sea levels have risen and the entire ocean has warmed.
Therefore it seems to challenge my assumptions- therefore interesting question for me.
As said it is good question, I will add some more [long posts tend not to post].
How is it thermodynamically possible for ocean to warm?
Now I think it’s fair to eliminate the idea that continental land masses warm the surface of the ocean and the depths of ocean [or the ocean’s average temperature].
There could be some caveats, such as perhaps land mass may be factor in causing wind. Or land mass act as barrier to ocean currents, etc.
Also it been long argued that the continent of Antarctica cools the world. And in the pseudo science of climatology less cooling can be counted as warming. So if Antarctica does cool, and for whatever reason cools less, then that might be counted as “warming”.
Anyhow, how does the ocean area warm itself?
It seems to be the main mechanism is related to Earth rotation. A pool of warm tropical water builds up, and wind blows it so builds to lower depths of the water. So your basic El Nino event, huge amounts of warm ocean water is pushed towards Asia.
And the fundamental mechanism is that ocean water are transparent to sunlight. And wind mixes and causes the thermocline:
“Most of the heat energy of sunlight is absorbed in the first few centimeters at the ocean’s surface, which heats during the day and cools at night as heat energy is lost to space by radiation. Waves mix the water near the surface layer and distribute heat to deeper water such that the temperature may be relatively uniform in the upper 100 m (300 ft), depending on wave strength and the existence of surface turbulence caused by currents.”
https://en.wikipedia.org/wiki/Thermocline#Oceans
I would say most of the near infrared sunlight [which one could badly label “heat energy of sunlight”] is absorbed in top first few inches of the ocean. But with other 1/2 of sunlight [roughly] which is visible light and UV this mostly penetrates a few meters below below the ocean surface. And it’s this other sunlight is what allow the sunlight’s energy to be “trapped”/absorbed.
Roughly, I would say most of the energy of sunlight which reaches to ocean surface in the tropics is absorbed below 1 meter depth of ocean water and the rate or speed of this absorp**tion is near the speed of light.
And the rate that warmed water can rise due buoyancy is a obviously much slower than speed of light. And the rate of heat convective depends upon temperature difference. Or the mixing by waves makes a more uniform temperature and reduces the differences in temperature.
So you get a pool of warmed water because sunlight is transparent to the ocean and because the top couple hundred meters of ocean water is mechanically mixed.
So if all of sunlight [1120 watts per square meter- when sun is at zenith and clear sky] were absorbed within a few centimeter [one had a different sun or different water [say muddy water] then one would not get such a pool of water which is blown across the ocean [and build up]
[try, try again with trick learned and remembered re: absorb**ation
[This absorb**ation trick is something I will need to keep foremost in mind when posting here. absorb**ation is quite important term in the topic of “global warming”] Anyhow:
So the above indicates how one could lower global temperature- ie, put muddy water in big spot in middle of the tropical pacific ocean. But why you want to do this, lower the average temperature of the entire ocean, seems like questionable plan or purpose. And this give now meaning to long term planning- it would take centuries to have a significant effect.
But rather than human schemes, are there natural mechanisms which could result in a less transparent ocean?
What comes to my mind is volcanic eruptions, particularly volcanic eruptions which occur in the tropics [where most of the heating of earth by sunlight occurs- and again due to Earth rotation, the ejecta thrown into the sky travels eastwards [as does a rocket going into space, btw- or cannon round.]
Now most focus of ejecta from volcanoes is related to billions of tons which can be put into the stratosphere [and remain in stratosphere for enough time for it to have any cooling effect]. And regarding purpose of ocean transparency, the dust needs to cover a large region and how long it remains in the surface ocean water- say within top 5 to 10 meters of ocean water- with the top 1 meter having the largest effect.
In the metaphors regarding CO2 and global warming, sometimes one hears about a little bit of ink, affecting the transparency of the water.
Ink being a solid suspended in a liquid. More precisely metaphorically, I am talking about putting ink in the ocean waters.
Much said about the incredible transparency ocean water or the incredible sterility of ocean water- adjective like pure or pristine also employed. But quantitatively, how pure is our ocean at the present? Were there times when it was more pure, and other times when less pristine?
In addition to volcanoes occasionally throwing billions tonnes of dust skyward [rare events] one could have oceanic volcanoes spewing black smoke up to the surface. Or roughly something like a bigger version of the black smokers and events like when islands are made. A difference being it does not need to be explosive. One say the black smoker seen on TV programs would not reach the surface [in any significant way] but larger ones could do this.
Though obviously with ocean water vs stratosphere, biological activity will strongly affect duration of the non-transparency of open oceans. Life processes could add to decreased transparency, but in months to years might also consume most it.
Gordon Robertson says:
“Its thermodynamically impossible for the oceans to warm while the land surfaces remain at a flat average temperature.”
That statement is simply wrong, as is the claim that the land has remained “flat average temperature.”
Gordon is a liar.
CRUTEMP4:
warming in 10 years = +0.54 C
warming in 15 years = +0.41 C
warming in 20 years = +0.47 C
warming in 30 years = +0.70 C
All significant.
Gordon, here’s the deal: I will keep calling you a liar as long as you keep lying about the data. OK?
Source:
http://www.cru.uea.ac.uk/cru/data/temperature/CRUTEM4-gl.dat
Cold front with snow is approaching Denver. In the evening, storms on the front line will intensify.
Many more papers showing co2 is not the climate control knob
Here is a nice background of past published science papers showing CO2 follows Temperature changes:
IPCC AR4 (2007): Atmospheric CO2 follows temperature changes in Antarctica with a lag of some hundreds of years.
Caillon et al., 2003 The sequence of events during Termination III suggests that the CO2 increase lagged Antarctic deglacial warming by 800 200 years and preceded the Northern Hemisphere deglaciation.
Fischer et al., 1999 High-resolution records from Antarctic ice cores show that carbon dioxide concentrations increased by 80 to 100 parts per million by volume 600 400 years after the warming of the last three deglaciations.
Monnin et al., 2001 The start of the CO2 increase thus lagged the start of the [temperature] increase by 800 600 years.
Kawamura et al., 2007 Our chronology also indirectly gives the timing of the CO2 rise at [glacial] terminations, which occurs within 1 kyr of the increase in Antarctic temperature.
Indermuhle et al., 2000 The [CO2] lag was calculated for which the correlation coefficient of the CO2 record and the corresponding temperatures values reached a maximum. The simulation yields a [CO2] lag of (1200 700) yr.
Landais et al., 2013 [F]rom 130.5 to 129,000 years ago, the rise in atmospheric CO2 concentrations lagged that of Antarctic temperature unequivocally.At mid-slope, there is an unequivocal lead of δ15N [temperature] over CO2 of 900 325 yr.
See more at: http://notrickszone.com/2017/05/22/new-paper-geothermal-heat-a-leading-driver-of-surface-temperatures/#sthash.gE6zR5N1.dpuf
======================================
Go into the Notrickszone link, to see the individual links that leads to the science
Salvatore…”Many more papers showing co2 is not the climate control knob”
I think that’s pretty obvious to anyone with objectivity. The argument that CO2 is causing global warming/climate change of a catastrophic nature is based on a purely theoretical argument that it could not be anything else.
There is no proof of a correlation between CO2 and atmospheric warming, just a consensus that nothing else could be causing the warming. Those using that argument seem to be overly narrow minded with their observations.
Your argument that solar variations will soon lead to cooling have been verified in the past, at least. I think it’s far more than coincidence that the Maunder Minimum coincided with one part of the Little Ice Age.
Gordon Robertson says:
“There is no proof of a correlation between CO2 and atmospheric warming, just a consensus that nothing else could be causing the warming.”
Wrong.
Study the PETM. And read
Atmospheric CO2: Principal Control Knob Governing Earths Temperature, Lacis et al, Science (15 October 2010) Vol. 330 no. 6002 pp. 356-359
http://pubs.giss.nasa.gov/abs/la09300d.html
Salvatore Del Prefer
Most scientists studying the Ice Age will agree with you that CO2 is not the control knob controlling the change between glacial and interglacial periods, (the common theme of the papers you mention.)
The control knob for glacial/interglacial periods is changes in the Earth’s orbital pattern,( Milankovich Cycles). These change the radiation absorbed by the Northern Hemisphere,which changes the temperature, which changes the a pint of CO2. One would expect the orbital changes first, with a lag to the temperature change and a further lag to the CO2 change. These natural changes are very slow, so they discuss timescales over centuries to millennia.
Unfortunately the modern situation is not comparable. The orbital changes should be producing slow cooking and a decrease in CO2. Instead In 130 years CO2 increased by 40% and temperatures increased by 1C.
The lag papers show that under the natural conditions of an Ice Age CO2 is not the control knob, but part of a feedback cycle.
The papers do not disprove the possibility that modern fossil fuel sourced CO2 is the control knob for modern warming.
EM: Without the temperature-CO2 mutual feedback, the glacial-interglacial temperature difference of 5 C (global average) would only be 2/3rds-3/4ths as much.
Yes, IPCC cites such papers (Petit’s and Caillon’s are famous in the ice core community).
Those papers contend that orbital variations lead to insolation changes, causing the polar ice sheets to melt and outgassing of CO2, that then contribute to the warming already underway – a feedback process. The feedback stabilises a few thousand years after orbital variations cause cooling, and atmos CO2 drops slowly down to around 180ppm at the bottom of each ice age.
Modern CO2 rise doesn’t have a preceding warming sufficient to explain it. Atmospheric amounts during interglacials are around 280/300ppm, having been outgassed as the planet warmed by 5 – 6C. We’re now at 400ppm, and no 5 – 6C global warming preceeding it.
Salvatore can’t provide links to his cites — the first suspicion anyone needs to dismiss them.
Yet David A, you said NOTHING about all those peer reviewed published papers from No Tricks Zone,that all say CO2 FOLLOWS temperature changes.
Snicker……….
When people emit CO2 into the atmosphere, it obviously leads temperature change.
This is so obvious it’s hard to believe even the most obtuse deniers, like Sun*, can’t understand it.
Your reply is to insult,make unsubstantiated opinions.
Here is what the IPCC says:
“IPCC AR4 (2007): Atmospheric CO2 follows temperature changes in Antarctica with a lag of some hundreds of years.
and,
“Caillon et al., 2003 The sequence of events during Termination III suggests that the CO2 increase lagged Antarctic deglacial warming by 800 200 years and preceded the Northern Hemisphere deglaciation.
and,
Fischer et al., 1999 High-resolution records from Antarctic ice cores show that carbon dioxide concentrations increased by 80 to 100 parts per million by volume 600 400 years after the warming of the last three deglaciations. – See more at: http://notrickszone.com/2017/05/22/new-paper-geothermal-heat-a-leading-driver-of-surface-temperatures/#sthash.NNNHntj1.dpuf
===============================
More in the link.
Humans emit CO2 into the atmosphere BEFORE any temperature change and REGARDLESS of any temperature change.
This is completely utterly obvious. It’s so obvious its hard to believe even the most obtuse deniers, like Sun*, cant understand it.
David A. apparently disagrees with the IPCC and many published science papers. Doesn’t provide an explanation on why he thinks that way.
Marvelous!
Yes, we all know that CO2 lagged temp changes during the ice age transitions, when the planet heated and cooled by 5-6C. Problem is we don’t have the 5-6C warming 800 years ago to account for the extra 100ppm. So CO2 rise from a large warming event is ruled out for the modern period.
Gordon Robertson says:
“Your argument that solar variations will soon lead to cooling have been verified in the past, at least.”
Really? Let’s see your proof of this.
“I think its far more than coincidence that the Maunder Minimum coincided with one part of the Little Ice Age.”
Yet another thing you’re wrong about, Gordon. I’d love to see your estimate of how sensitive the Earth’s climate is to changes in total solar irradiance.
Show us.
Here’s lewis, convinced it is possible to peer into the future –
“Weatherman said a beautiful day. She was correct.”
Is that really the best you can do?
Cheers.
Good to see raw deniers fight among themselves.
David,
Where? Where? I see no deniers! What are they denying? What are they fighting about?
Can I join this denier organisation? Do they accept unbelievers? What about Pastafarians? Do I have to wear a colander on my head?
Have you the faintest notion what you are talking about?
I won’t abate my breath while waiting, I suppose.
Cheers.
What are they denying?
Roy wrote:
“First, the claim would have to have some unambiguous meaning which can be evaluated quantitatively. Does it mean that warming has decelerated in the last two decades.”
Roy, serious question: why “two decades?”
Because that’s what almost kinda shows up in your data?
Why not three decades, which the WMO considers the shortest time period applicable to climate change?
Why not your entire data set?
Why not consider ocean heat content foremost, which is where almost all the trapped energy goes (90%+)?
David Appell,
Just in case anybody is curious, Here’s what the Washington Post quoted Mr Pruitt as saying –
“. . .over the past two decades satellite data indicates there has been a leveling off of warming.
I accept “two decades” as meaning “two decades”. Not three decades. Maybe you should ask Mr Pruitt why he said what he did.
From the WMO website –
“Climate, sometimes understood as the “average weather, is defined as the measurement of the mean and variability of relevant quantities of certain variables (such as temperature, precipitation or wind) over a period of time, ranging from months to thousands or millions of years.
The classical period is 30 years, as defined by the World Meteorological Organization (WMO). Climate in a wider sense is the state, including a statistical description, of the climate system”
It may have escaped your notice that 30 years, starting now, and counting the last 30 years, defines the most recent climate range.
No mention of “climate change”.
There is no “heat trapping” of insolation energy by the ocean after sunset. Water heated by the Sun sits on top of the cooler denser water below it. At night, it radiates its energy, cools, and falls, displacing less dense, now warmer, water to the surface, which cools, and so on.
Basic physics which you may be unaware of, or may not understand.
I cannot speak for Dr Spencer, but anybody can see that your questions are fairly poorly framed, and fairly pointless, it might appear to some, possibly based on incorrect assumptions.
Cheers.
“mike flynn” (fake name) again avoids all science.
He’s like a criminal who wants — needs — to confess his crime.
Even worse — even that criminal admits the truth. MF, so far, has lied forever.
Afraid to even look at the scientific data.
ha.
Einstein wrote:
“There is no heat trapping of insolation energy by the ocean after sunset. Water heated by the Sun sits on top of the cooler denser water below it. At night, it radiates its energy, cools, and falls, displacing less dense, now warmer, water to the surface, which cools, and so on.”
Such a mechanism would not lead to a warming of the ocean, just more of an equilibrium.
(And, really, a cooling, since solar intensity has been declining since the 1960s.) Ha.
And, no, the ocean STILL doesn’t emit blue light, MF.
If you say so, David, if you say so.
Maybe it’s red, or yellow. Looks blue to me.
Cheers.
MF thinks the ocean emits blue light!!!
Ha ha.
Sad.
David, the ocean is blue because it reflects mostly blue light. Are you complaining that “emit” is not as accurate as “reflect”? Kind of picky.
https://www.scientificamerican.com/article/why-does-the-ocean-appear/
I should say, “appears to be blue” because it reflects mostly blue light to our eyes.
Of course, you could correctly argue the ocean is actually red because that’s the color it mostly absorbs.
Snape,
From your link –
“So when white light from the sun enters the ocean, it is mostly the blue that gets returned”
“Returned” seems to be code for “emitted”.
Electrons may “return” photons, I suppose. I follow Feynman’s useage, and use “emit”. How photons are supposed to reach the eye without being emitted by an electron is a mystery to me. Maybe David is stuck in a time warp, and doesn’t accept Feynman’s ideas on quantum physics.
Sorry if I sound picky, but using “return” in place of “emit” serves only to cloud the meaning – in my opinion, of course, which is worth what you paid for it.
What happens at the quantum level is completely crazy, but it still happens.
For example, Richard Feynman said –
“The electron does anything it likes. It just goes in any direction at any speed, forward or backward in time, however it likes…”
In time? Wrap your head around that at your peril! As far as I know, experiments to date support Feynman’s conclusions, without exception. It’s good enough for me, until something better comes along.
Whoops. I nearly forgot. I agree with you.
Cheers.
Mike,
Emit, reflect and return all seem fine. Are you and David arguing about semantics?
The point is that white light from the sun lands on the ocean, but then mostly blue light is reflected back to your eyes.
Snape,
I’m not arguing. Facts are facts. I believe David Appell is wrong.
The language needs to be clear. In my opinion, David Appell is confused about the nature of light. I invite others to decide for themselves – there are options available.
I choose to use emit.
Cheers.
Mike Flynn says:
“I believe David Appell is wrong.”
Why?
Mike Flynn says:
“How photons are supposed to reach the eye without being emitted by an electron is a mystery to me.”
Ever heard of reflection?
Snape says:
“David, the ocean is blue because it reflects mostly blue light. Are you complaining that emit is not as accurate as reflect?”
Reflection and emission are two very different phenomena.
DA – you are a very silly person.
https://tinyurl.com/lvvnusm
Re reflections.
Anyone who is interested will find that “reflection” at the quantum level is not the gross macro “reflection” that David is talking about.
I could have been clearer, but my point is that if an object absorbs all incident light, it will show no colour whatever – it will appear black.
If there is any colour to be seen, it will come about because photons are emitted by electrons. There is no known mechanism by which a photon can magically change direction without being absorbed by an electron, and another subsequently emitted. From memory, this takes around 1/10^8 sec, but I could be wrong.
But what the heck. If you wish, the sea generally looks blue because it reflects the blue of the sky, or yellow or red if you’re looking at the sun reflection at dawn or sunset. Sometimes green, or gray if there’s a lot of cloud, or matter in the water. Water is colourless as far as reflection is concerned, if the angle is less than the relevant Fresnel angle. Moonlight on the water, or even a reflection of the Moon, is not coloured by the water contents at low angles. If the sea is coloured by something – dye, plankton, particulate matter, or similar, the situation will change.
David Appell does not seem to understand modern physics, and seems to reject any idea that he cannot comprehend, rather than accept there might be some things with which he is not conversant.
Having said the above, I should point out that Nature does completely inexplicable things at the quantum level. As a small example, a photon beetling along a c (the speed of light) does not just slow down when it is absorbed by an electron. It just ceases to exist. When an electron emits a photon, the photon is travelling at the speed of light – no acceleration at all – and has no mass at all! It just pops into existence. Just to make things really interesting, the action of trying to observe what’s going on changes what’s going on!
Once you’ve worked that out, try chaos. That’s really confusing.
Cheers.
Flynn the politician tries his hand at science as usual incorrectly 9:25pm: “There is no known mechanism by which a photon can magically change direction without being absorbed by an electron…”
Incorrect Mike, a photon of a certain energy level can be absorb-ed by a molecule (of say CO2) and change its rotational energy up that level not its electronic level. The molecules rotation energy level reduces when the photon is emitted. Same thing with vibrational levels in CO2.
Leave science to the scientists actually doing experiments Mike, or start doing them yourself. If you do proper experiments on regular pure water you will find it is a weak blue dye. Heavy water will have no color at all. Measure it.
—–
Bart 8:42pm, I think color is fascinating, you have picked a source that apparently hasn’t done any actual spectrum measurements either. Your source claims a very frequent error found across the internet: “So if an object absorbs all of the frequencies of visible light except for the frequency associated with green light, then the object will appear green in the presence of ROYGBIV” – this seems to be equiv. to daylight but not sure, very close if not.
A banana is yellow because our brains interpret its spectrum that way. Actually, measure the spectrum of a banana illuminated by daylight and find its spectrum is far from being a reflector of only yellow light. The visible band radiance (~400 to 700 nm) will consist of every wavelength ROYGBV. Not just yellow. Actual banana spectrum measurements show radiance fairly flat green to red wavelengths.
Ball4,
Maybe you need to understand quantum mechanics a little better. You wrote –
“Incorrect Mike, a photon of a certain energy level can be absorbed by a molecule (of say CO2) and change its rotational energy up that level not its electronic level.”
I’ll stick with Feynman –
“A photon goes from one place and time to another place and time.
An electron goes from one place and time to another place and time.
An electron emits or absorbs a photon at a certain place and time.”
Apart from gravity and nuclear processes, all physical processes can be explained in terms of the above.
I don’t blame you for being misled. Many scientists do not understand either quantum physics or chaos well. It often makes no difference.
No “gotcha” for you. Well, unless you can demonstrate Feynman was wrong, I suppose.
Cheers.
Flynn: “unless you can demonstrate Feynman was wrong, I suppose.”
Flynn is wrong, as usual.
Apolitical scientist Feynman is right of course, it is the political Flynn that is wrong based on numerous experiments.
Mike: experiments show when x amount of photon energy absorb-ed raises a CO2 molecule quantum rotational energy a level, it takes then ~300x that amount of photon energy absorb-ed to raise the CO2 molecule an electronic level.
Feynman explains the various quantum energy levels in a molecule experimentally able to abs-orb and emit a photon, look it up Mike, drop your political agenda and learn some science to for this science blog.
I’m not sure I should have stuck my nose in this. Mike holds a few views with which I disagree. But, he is quite right about the physics of reflection. A photon cannot magically change direction. Momentum is always conserved.
Ball4:
“A banana is yellow because our brains interpret its spectrum that way.”
Indeed. We had a lot of fun with this puzzle in my office a few years ago. I’d say maybe 2/3 of the group saw a black and blue dress, and 1/3 saw white and gold.
“A photon cannot magically change direction. Momentum is always conserved.”
Mike was incorrect (as usual being a politician) writing only electronic levels can change the “direction” of a photon. Photons posses both linear and angular momentum, both are conserved so that when photons are absorbed will thus change molecular rotational energy.
Photons do not change direction, properly defined. They always follow null paths in the local spacetime.
A reflection is not a null path, hence it is not the trajectory of a solitary photon.
If reflection of a photon is not that same photon (different polarization), what is it?
A different photon. The original photon ceased to exist when the velocity became discontinuous, and a new photon was born.
Bart 11:40am, now that’s actually a very interesting debate instead of the normal fare around here.
If you had written that in EMR language I may not have noticed.
In EMR language, the incident wave on say a smooth (on the scale of the wavelength) surface of a glass on a mirror excites molecules in the glass to radiate and nature allows for a net reflected wave and a net transmitted wave by refraction. No perplexity.
But you framed it in photon language. Is the reflected photon the same as the incident photon? Photons are indistinguishable. No one can tag a photon and follow its progress. Thus, if you want to believe that the reflected photons are different photons you may do so. No one can prove you wrong. There is also no test you can do to prove yourself right.
For me, I think in photon language easier because can kick them and get kicked by them, EMR continuous through space is harder, more intense thinking. So I will go with the reflected photon exact same as the photon incident. You cannot prove me wrong. Or right. There is no experiment. Some incident photons are reflected (life) some transmitted (life) some absorbed (death) is all I can write in photon language.
I will concede the wave language has been way more productive of inventions than photon language.
“There is also no test you can do to prove yourself right.”
It’s tautological. A photon is a massless particle that travels at the speed of light along a null trajectory. If you have a particle that is not traveling at the speed of light along a null trajectory, then it is not a photon.
In this case, in the instant the trajectory deviates from a null worldline, you don’t have a photon. When an object ceases to exist, it ceases to exist. Can’t get more tautological than that.
There is no experimental evidence following the progress of your photon through the change in its direction to prove if that is right or wrong.
“…following the progress of your photon through the change in its direction…”
That is self-refuting. Photons do not change direction.
“Photons do not change direction.”
Show this by experiment. You will find there is no such experiment.
Mike Flynn says:
“Just in case anybody is curious, Heres what the Washington Post quoted Mr Pruitt as saying ”
Nobody is going to use “Mr. Pruitt” and “scientific accuracy” in the same sentence.
First is the question of whether 20 years is use as indicative of true climate change. (It is not.)
Put, to play along…let’s note that NOAA’s surface temperature change in the last 20 years is +0.33 C.
UAH’s LT change for the last 20 years is +0.12 C, which doesn’t equal zero.
The top fourth of the ocean, 0-700 m in depth, has absorbed an average of 170 trillion watts over the last 20 years.
Does Scott Pruitt know about any of these data?
Me to barry –
If you decide to define surface, Ill see if I can find fault with your definition, of course.
Go for it, if you wish.
Cheers.
barry says:
I get a strong impression that you wish me to spoon-feed you with the answer.
Not at all, barry. All the supposed definitions of “surface” are defective, from a scientific point of view. Maybe you have a scientific one, hidden with the explanation of the GHE metaphor, and Trenberth’s missing heat?
You call climatology “science”, I suppose.
Cheers.
I get a strong impression that you wish me to spoon-feed you with the answer.
I hope you realize I’m quoting you directly there.
When you “spoon-feed” me the answer to the Venus/Mercury riddle, I’ll return the favour on the definition of “surface.”
barry,
What riddle would that be?
I suppose you believe the bizarre assertions of James Hansen. Odd chap.
Your definition of the surface is unlikely to be any worse than the others I’ve read, but is irrelevant anyway. Any observed changes to thermometers results from variations in heat – not CO2. Only a foolish Warmist like James Hansen could convince himself otherwise.
Maybe you’re too lazy or thick to seek alternative solutions to your riddle. If you believe the answer to be a non-existent GHE, nothing is likely to change your mind. Religious fervour often persists in the face of fact to the contrary.
Keep the faith!
Cheers.
Just more pathetic name calling from (fake name) “Mike Flynn.”
He offers no science whatsoever.
I’ve sought alternative explanations for Venus av surface temp being hotter than Mercury’s. None have been remotely plausible (pressure/density/rotation/diameter etc).
Thank you for your interest.
barry,
You’re most welcome. Your pleasure.
Cheers.
Mike, why do you have 3 different handles on this website?
Mike Flynn / Mike Flynnn / Mike Flynno
That’s for me to know, and not to tell you!
Only joking. Fat finger syndrome, I suppose – or should I blame it on the GHE metaphor? The GHE has amazing powers, according to foolish Warmists.
If it can heat an entire planet, putting an extra letter at the end of a word should amount to small beer!
There you go – it’s settled. It’s the GHE.
Cheers.
The Earths surface receives an average of 240 W/m2 from the Sun.
Yet the Earths surface radiates an average of (at 15 C) 390 W/m2.
Explain.
David Appell,
The most probable explanation is that you are as thick as two short planks.
Well, maybe three.
Have you an alternative? Maybe it’s the GHE, which as you say, is a metaphor for something as yet undecided. Or maybe not.
Your supplied figures are nonsense, by the way.
Cheers.
Notice how “mike flynn” is afraid to even mention these numbers.
He’s just a dirty denier.
David Appell,
Are you off in your fantasy world again – the one where you’re delusional enough to think that my care factor about anything you say or think is significantly different to zero?
“Just a dirty denier”? Phew. For a split second, I thought you were going to try to insult me! Maybe you’re a slow learner David. I generally decline to feel insulted or offended, unless you can provide a convincing argument to the contrary. So far, you haven’t met the minimum requirement. Maybe you could try harder?
You’re a capricious little rascal, aren’t you?
Keep it up. A bit of comic relief does nobody any harm.
Cheers.
Still afraid to discuss the facts, MF.
You’re even worse than a denier.
240 vs 390–Davie, your question should be “Why does pseudoscience NEVER work in the real world?”
The average of 190 W/m^2 and 590 W/m^2 is 390 W/m^2. But the average of the respective S/B temps (240.6 K and 319.4 K) is 280 K! (280 K = 6.9C, 44.3F)
So, once again, your pseudoscience fails you.
Interesting. I never have to type my handle. It’s done automatically. Maybe it’s different if you’re using a phone or something. Thanks for the reply.
Barry
Here is a comment from an earlier discussion. Your initial claim seems correct. Bart’s response, however, is complete nonsense. In this scenario, water pressure would NOT increase in proportion to greater inflow.
If the dam had a “ceiling”, and the water was not allowed to rise, then, yes, the extra inflow would be “forced” down the aperture. This is not the case because the water level of the dam is free to rise.
You wrote, If input has increased by 10%, and output has increased by 5%, wouldnt the increased input add more total water to the dam, after a time, than its percentage input?
Bart wrote, “Output is governed by pressure at the aperture, and pressure is proportional to height of the water column above the aperture. So, once the water has risen 10%, the outflow will have increased 10%, and the new output will balance the input.”
Next time you’re taking a bath, unplug the drain and then turn the faucet on full blast. Your bathtub will soon overflow. The small increase in water pressure (down the drain) will be no match for the greater inflow.
So, underwater pressure does not increase with depth, huh? All these years, we could have been building submarines out of plastic. And, who needs scuba gear when all you really need is an extra long snorkel? And, people who get the bends must just be faking it.
What a mind-bogglingly stupid response. I had no idea you were this dumb.
“…submarines out of plastic.”
Great line, Bart!
(But, the pseudoscience types will probably not understand it.)
You watch. He’s going to come back with some phantasmagorical rationalization as to why he is right, and I just don’t know physics.
I don’t know what it is with this generation. I think they played too many computer games, and think whatever they can imagine, they can make real.
It’ll probably be something along the lines of pressure only acts in a particular direction. And, I will go blue in the face explaining it is a scalar quantity that has no preferred direction, and he will just tut-tut and say, again, I just don’t understand physics. Aye-yi-yi.
Well, I’ve got things to do, so I’ll just leave this as my preemptive comeback.
Bart
Read more carefully, Bart. Of course water pressure increases with depth.
But I wrote, “In this scenario, water pressure would not increase in PROPORTION to greater inflow. This is what your not grasping.
Were you unable to understand the very simple and familiar bathtub example? Yes, water pressure in the tub would increase as the water level rises, but, like I said, if you turned the water on high enough, it wouldn’t matter. Water would continue to rise and eventually overflow. Increased water pressure would not magically match greater inflow.
Bart, you could try this in your kitchen sink, for crying out loud. It’s an experiment so simple it would bore a five year old.
On the other hand, if the water was contained in a tower instead of a bathtub, and the water was allowed to rise high enough, eventually the outflow from increased pressure would be equal to the increased inflow. Like Barry said, this would take time, maybe a very long time.
Snake considers this an experiment: “Next time youre taking a bath, unplug the drain and then turn the faucet on full blast. Your bathtub will soon overflow. The small increase in water pressure (down the drain) will be no match for the greater inflow.”
Snake, you’re trying to prove pressure does not increase with depth? And, this is your “prooF’? Do you not understand all the things wrong with that?
Obviously not.
Hilarious.
Whatd I tell you? Does anyone have a link to a Quadruple Picard Facepalm?
Like Barry said, this would take time, maybe a very long time.
And, after that time, the water level will have risen wait for it 10%.
You can try this experiment in your kitchen sink, Mr. Fictitious-Character-From-A-Childrens-Book. Partially block the drain. Turn on the water. Wait until it settles to an equilibrium level. Turn the water up 10%. Watch the water level rise 10% and stop.
Geez, this is high school physics. Get a grip.
Bart
“You watch. Hes going to come back with some phantasmagorical rationalization as to why he is right, and I just dont know physics”
Nope. Now I see that you were right all along, and I was the one who misunderstood the situation. I’ve been making a total ass of myself.
Sorry, Nate
Sorry Bart, not Nate
This is why foolish Warmists resort to foolish and irrelevant analogies.
Just more deny, divert, and confuse.
Ask them to define the GHE, and they’ll talk about overcoats.
Ask them about an experiment demonstrating that reducing the amount of energy reaching a thermometer causes the temperature to rise, and you’ll likely get called a dirty denier!
I’m not sure why foolish Warmists have a horror of dressing scientific matters using scientific terms, but I suspect they don’t actually understand what they are talking about.
Try to get foolish Warmist to talk about a thermometer heating mechanism involving CO2. Good luck with that!
Cheers.
Snape @ May 28, 2017 at 9:14 PM
Thanks for that. Sorry if I was harsh. I’ve just gotten so tired of jerks trying to brazen things out when they are caught in the wrong. The internet is full of them. Glad you are not one of them.
Bart
No worries. After all, I was the one who called your comment “nonsense”.
Barry
To give you 3 goes at getting it right
Regards
HC
Observant, barry.
Perhaps Roy is trying to block him and his ridiculous comments, must like he did to D**g C*tt*n.
Wrong planet, again, Davie.
(Maybe try not eating out of the cat litter box.)
I reckon Mike’s version is the truth. I’ve seen him complain about his fat fingers before.
And his regular handle has not been banned.
Some researchers in the US may not be aware of the following (from the cendi.gov website) –
“3.2.5 Many U.S. Government employees are under the impression that they must transfer copyright in works prepared as part of their job to the publisher of a journal or book in order to have an article published. Is this true?
No, a paper, report, or other work prepared by an employee of the U.S. Government as part of that person’s official duties is a U.S. Government work. Copyright protection is not provided for U.S. Government works under U.S. Copyright Law. Therefore, there is no U.S. Copyright to be transferred. U.S Government employees should inform the publisher of their employment status and should not sign any document purporting to transfer a U.S. copyright as a prerequisite to publication.
Additionally, a U.S. Government work may be protected under foreign copyright laws. The law of the foreign country governs ownership of foreign copyrights in U.S. Government works. The owner of the copyright may license or transfer a foreign copyright. The transfer of a foreign copyright owned by the U.S. Government must be executed by an authorized official of the Agency, who is almost never the U.S. Government author.”
I wonder if any US Government employees have broken any conditions of their employment?
Cheers.
The GHE evidence “Mike Flynn” (fake name) is afraid to look at:
https://www.giss.nasa.gov/research/briefs/schmidt_05/curve_s.gif
David,
I assume that’s a link to the same silly graphic you’ve posted 50 or so times previously. Or has it magically changed? You haven’t overwhelmed me with reasons why I should look at a steaming turd more than once.
If you want me bury my nose in it, you’re doomed to be disappointed. One sniff is quite enough. It must have a hypnotic effect on you. You can’t help posting it time after time.
Colour me less than totally hypnotised.
Cheers.
Davie’s indicates a “spectral flux” at TOA. He believes that is “proof” of the GHE.
But, pseudoscience types also claim that DWLWIR is “proof” of the GHE.
Everything they see if “proof” of the GHE!
Hilarious.
MF, you never take any science seriously. You’re contemptuous of science. For some reason you get your jollies by expressing this contempt. It’s a very weird hobby.
Davie, you never take any science seriously. Youre contemptuous of science. For some reason you get your jollies by expressing this contempt. Its a very weird hobby.
David Appell,
Your vaunted ESP powers have, sadly, let you down – yet again.
I just checked – my name seems to be in its usual place.
Now, just in case you make a fatuous foolish Warmist demand to “prove it”, I can predict that my response, if I were to be uncouth, would be to tell you to “Piss off!”
Being the very model of couth, however, I will not tell you to “Piss off!” Instead, I’ll gently smile at the presumption and ill-mannered oafish behaviour of a foolish Warmist, who through no fault of his own, happens to be less fortunate than myself.
I wish you well, David. It’s not your fault that you suffer from certain intellectual disabilities. With time, I am sure you will come to terms with your deficiencies.
In the mean time, carry on as normal, if it makes you feel better. I sympathise with your frustration.
Cheers.
You avoid any and all real world data.
It’s the only way you can keep you lies & denial going — and even then, barely at that.
Mike Flynn says:
“Now, just in case you make a fatuous foolish Warmist demand to prove it, I can predict that my response, if I were to be uncouth, would be to tell you to Piss off!”
Proving yet again that you’re not here to discuss science, just for the little jolts of testesterone you get from using a fake name to make online insults read by about 5 people across the globe.
Davie, the pizza delivery place called. Your credit card bounced again.
David Appell,
You wrote –
“Explain”
No, but thank you for your interest. Do you suffer from a cognitive defect, by any chance? What part of “no” do you not understand?
Cheers.
David Appell wrote –
“Look at the math major, who is so convinced hes smarter than everyone else but doesnt understand a lick of physics.”
Gavin Schmidt actually has a PhD in mathematics, David.
I agree with you about the rest.
Cheers.
I meant (obviously) Bart, no Gavin.
Davie, stay out of the cat litter box, PLEASE!
David Appell wrote –
“(I have never taken any courses in journalism.”
I apologise David. It was actually “Graduate Program in Creative Writing (15 hours completed), Arizona State University.” that I was thinking of.
I hope you’ll excuse me for thinking you had some formal training as journalist. Your resum states –
“BACKGROUND: Writer and journalist with broad technical and scientific knowledge.”
I’m sure you are. In your own mind, and obviously in the mind of anyone who would pay you for your broad technical and scientific knowledge.
How did the creative writing course turn out? Did it broaden your outlook, or any other part of your anatomy?
If you want to take offence, help yourself. Take as much as you like.
Cheers.
Journalism isn’t that difficult — you just have to aspire to digging out the truth and communicating it. For science journalism, a science degree is far more helpful, since science training teaches critical thinking skills better than does journalism training, IMO.
Probably not a profession for you.
Davie, so when are you going to start working on that “science degree”?
David,
Couple of points. How many compliments slips did you ever get from the senior sub editor of a major national daily newspaper for your efforts? None? I thought so.
I support your aspirations to dig out the truth, but maybe you’re doing a good job of digging everywhere else, and digging yourself a deepish hole in the process.
Your science degree seems to have helped neither your critical thinking skills, nor your journalistic efforts. Which do you think needs the most improvement?
Once again, thank you for your unsolicited opinion. I’ll ignore it as usual.
Cheers.
You always have an excuse for not discussing the actual science.
I think you’re afraid of it.
You always have an excuse for not publishing your actual job history. I think you’re ashamed of it.
Large hail fell near Adrian, Missouri. KMBC viewers sent in pictures of baseball-sized hail. Bates and Cass counties reported softball-size hail.
https://earth.nullschool.net/#2017/05/28/1500Z/wind/isobaric/700hPa/overlay=temp/orthographic=-108.06,45.79,1037
Fascinating, if completely irrelevant to the topic.
What does this imply for climate sensitivity, ren?
Davie, you’re irrelevant, but not fascinating.
(Did you ever publish your annual income for the last five years?)
Oh, and if you think you know science, show the equations how the Sun can heat the Earth to 800,000K. That’s what your hero, who publishes “papers” says.
(“Papers” full of pseudoscience are useful as bird cage floor liners.)
Here’s a little gem from the UK horticultural society,last week they held their annuall flower show .And they suggested that UK temperatures would rise 4.5 degrees centigrade by 2050,and we should change our growing habits and plant cactus and succulents.i live in the North East of the UK at 55% North,people who give out that advise should be locked up.food for the gullible.
Daily mean temperatures for the Arctic area north of the 80th northern parallel, plotted with daily climate values calculated from the period 1958-2002.
http://ocean.dmi.dk/arctic/plots/meanTarchive/meanT_2017.png
Time-series representation of temperatures at the 30-hPa level over the North Pole
The black line shows daily temperatures, and the gray line indicates the normal (i.e., the 1981 – 2010 average).
http://ds.data.jma.go.jp/tcc/tcc/products/clisys/STRAT/gif/pole30_nh.gif
Ian, do you have a link? They’re almost surely wrong….
Here you go Davie. Glad to help.
https://www.amazon.com/Arm-Hammer-Double-Duty-Litter/dp/B00HR4OBXO?psc=1&SubscriptionId=AKIAILSHYYTFIVPWUY6Q&tag=duckduckgo-d-20&linkCode=xm2&camp=2025&creative=165953&creativeASIN=B00HR4OBXO
This doesn’t even make the pseudoscience grade. It’s… what is it? Ah yes, needling. Trolling.
Yes, David, that estimate is way too high. I’d link to see a proper reference, too.
David you asked,do I have a link? No nothing that tells me where they got their info, it was a two minute report on the annual coverage of the Chelsea flower show by the BBC,not even the IPCC make that prediction.it was around 7 o’clock in the evening on prime time TV,there is misinformation on both sides of the camp I wish it would stop,
In the winter polar vortex works in the mesosphere, stratosphere and troposphere. On the border of the mesosphere and the stratosphere reaches a speed of over 90 m / s.
http://ds.data.jma.go.jp/tcc/tcc/products/clisys/STRAT/gif/zu_sh.gifLatitude-height cross section of zonal mean zonal wind in the Northern Hemisphere
The contour interval is 5 m/s.
http://ds.data.jma.go.jp/tcc/tcc/products/clisys/STRAT/gif/zu_nh.gif
Sorry.
http://ds.data.jma.go.jp/tcc/tcc/products/clisys/STRAT/gif/zu_sh.gif
“More than a third of British Airways flights from Heathrow have been cancelled as disruption to passengers enters a second day.
The airline was hit by a worldwide computer system power failure on Saturday, causing cancellations and delays for thousands of passengers.”
There is a strong geomagnetic storm. The storm was triggered by a strong jump in solar wind density.
http://images.tinypic.pl/i/00904/zad694ggt4ts.gif
Dr Spencer wrote –
“So, I consider the no warmers to be on shaky ground, both theoretically and observationally. But that doesnt mean they are wrongwe just dont know yet.”
Just in case anybody’s interested, it seems that thermometers have generally shown increases in temperatures over say, the last century.
This hardly surprising, given the increase in population, the greater per capita energy consumption, and the enormously greater heat production that accompanies this. It doesn’t matter whether the source of electricity, for example, is fossil fuel, wind power, tide power, nuclear power, or solar or hydro. The end result is heat. Thermometers respond to heat, not CO2.
So I’m a warmer. A realistic one, I hope.
I’ll go further, and say that there are foolish Warmists, who believe that increasing the amount of CO2 between the Sun and a thermometer on the ground causes the thermometer to get hotter.
I am sure that I can defend my position with reference to real science – the sort that involves disprovable theories, and reproducible experiments – as opposed to the non-disprovable cargo cult version put about by foolish Warmists.
Realistic Warmists – fine. Foolish Warmists – fumbling bumbling second rate buffoons deserving of the derision they attract.
If I understand Dr Spencer correctly, anybody who claims that thermometers don’t react to changes in heat, must be a “no warmer”. I would consider such a person not to have any grounds at all, let alone shaky ones!
Ah, the rich tapestry of life.
Cheers.
Flynn 8:45pm: “thermometers have generally shown increases in temperatures”
Mike is correct for the industrial age but changes his political stories yet again from that of Earth having continuously cooled for ~4.5 billion years.
“Thermometers respond to heat..”
Incorrect Mike you were right the first time: thermometers measure temperature not heat. Stick to politics, so your stories can change with the political winds.
Ball4 says, May 28, 2017 at 10:25 PM:
And how exactly do “thermometers measure temperature”? Is there an entity out there called “Temperature” that they just simply make contact with and then somehow quantify out of thin air? Or do they reach a thermal equilibrium with the ambient air mass surrounding them? If the latter, then how and when is a thermal equilibrium between the thermometer and the ambient air reached? And what defines a thermal equilibrium?
Thermodynamic internal (thermal) energy equilibrium is achieved when there is no longer any change in thermodynamic variables i.e. at universe max. entropy.
Thermometers measure temperature calibrated to known natural constants. There are several kinds each accomplishing the same task. Possibly on different scales. Check out the zeroth law governing the operation of thermometers.
I know about the Zeroth Law, Ball4. That’s why I asked you about how thermometers actually measure temperature. It looked as if you, when stating the following: “(…) thermometers measure temperature not heat” assumed that these are two completely unrelated phenomena, when in fact they can almost be said to be two sides of the same coin.
The answers to my questions:
Do thermometers measure the air temperature by reaching a thermal equilibrium with the ambient air mass surrounding them?
Yes. In reality they are measuring their OWN temperature upon reaching such a state. This is where the Zeroth Law comes in.
How and when is a thermal equilibrium between the thermometer and the ambient air reached?
When there is no more net energy (heat, Q) being transferred between them. At this point, they have the same temperature, and thus the temperature of both – but most notably, of the thermometer – will stabilise.
What defines a thermal equilibrium?
Just this. The two regions or objects in thermal contact have the same temperature, which means that there is no longer any net energy (heat, Q) being transferred between them; the net exchange is 0.
“What defines a thermal equilibrium? Just this. The two regions or objects in thermal contact have the same temperature, which means that there is no longer any net energy (heat, Q) being transferred between them; the net exchange is 0.”
Not if their entropy is still increasing Kristian as entropy is a thermodynamic variable. The only way to stop entropy from increasing is to isolate a universe and allow enough time to pass until universe entropy is maximized.
Kristian,
You claim not to know what the readings on a thermometer mean, but claim there is a GHE? How would one measure the GHE?
Best try for a “gotcha” elsewhere. I’ll answer genuine questions (if I feel like it).
Foolish Warmist. No GHE. None.
Cheers.
Ball4,
Surface temperatures do not indicate the heat content of the Earth except in the minds of foolish Warmists.
As long as the Earth’s surface is at a lower temperature than the interior, the Earth will continue to cool. Even if you could somehow manage to raise the surface temperature to above 100 C everywhere, the Earth would continue to cool, just as it did in the past. That’s physics for you!
As to your foolish second comment, thermometers do indeed respond to heat. Not CO2 or weight, not bananas or retail sales figures. Measurements of temperature are a different thing.
No “gotcha” for you this time. Try again later.
Cheers.
Mike Flynn
Here is a post from another blog that you may want to consider.
“Dung, yes I read that.
Hockeyschtick said “Physicist Richard Feynman proved the Maxwell gravito-thermal greenhouse theory is correct & does not depend upon greenhouse gas concentrations”.
That is not really true. Look in the chapter of Feynman’s lectures on physics referred to ( The Principles of Statistical Mechanics. 401The exponential atmosphere ). You will not find the term “the Maxwell gravito-thermal greenhouse theory” in it anywhere and, likewise, you will find no mention of greenhouse gases or their concentrations.
In that chapter, Feynman showed how the pressure of a gas at a given height in a gravitational field can be calculated (together with other things such as how classical mechanics does not correctly explain the specific heats of gases).
A problem that I see with Hockeyschtick is that he takes various incorrect explanations of the greenhouse effect (for example “backradiation heats the ground”) and then proceeds to show that the incorrect explanation is bollocks. But it’s the various incorrect explanations that are bollocks, not the greenhouse effect itself.
In this case, apparently somebody somewhere has stated that if it were not for the presence of greenhouse gases, the atmosphere would be at uniform temperature at all heights. That is bollocks. The lapse rate (https://en.wikipedia.org/wiki/Lapse_rate), by which it gets colder as you go higher, does not depend on the presence of greenhouse gases.
I think, in referring to Feynman’s lecture he was invoking the authority of Feynman to make that point”
Norman says, May 29, 2017 at 12:51 AM:
I’m so glad to see you’re FINALLY acknowledging this, Norman. Can we then at long last perhaps move on to a proper, physically coherent way of describing the “Greenhouse Effect”? That is, the atmosphere does NOT force the average global surface temperature to be higher than it would’ve been without one by ADDING more energy to it. Only the Sun ADDS energy to the surface to raise its temperature. Because that’s direct HEATING. No, the atmosphere, in being IR active and nearly as warm as the surface itself, continuously EXCHANGE energy with it, reducing the NET flow of energy out of it (its heat loss, radiative, conductive AND evaporative), which means, the surface LOSES less energy to the atmosphere than it would to space. At any given temperature. That’s how INSULATION could and would force the temperature to rise. Reduce the OUTPUT, not increase the INPUT. That’s heating.
You’re right, the flaw is in the EXPLANATION, not in the EFFECT itself.
Can we just agree on this proper way of describing the “atmospheric thermal effect” on the solar-heated surface?
If so, then the only thing we really disagree on is the role of the IR-active gases in the raising of the average surface temperature. Are they the actual CAUSE of it? Or are they but an enabling TOOL, necessary to make it possible in the first place …?
And from this we can then move on the whether an “enhanced GHE” is possible or not.
Kristian,
You wrote –
“Reduce the OUTPUT, not increase the INPUT. Thats heating.”
No its not, foolish Warmist. It’s called cooling. As in, insulation reduces the rate of heat loss (in simple terms) – the insulated object still cools. Just as the Earth at night. Just as the Earth itself, over four and a half billion years.
No GHE. You can’t even describe the GHE, in any scientific way.
No increase in temperature due to CO2. None. No “heating”.
Complete unsubstantiated assertion.
Cheers.
Flynn 8:45pm: “Just in case anybody’s interested, it seems that thermometers have generally shown increases in temperatures over say, the last century.”
Flynn 11:19pm: “As long as the Earth’s surface is at a lower temperature than the interior, the Earth will continue to cool.”
Politicians often change their stories as does political Flynn.
Scientists know thermometers measure temperature, politicians think thermometers measure heat.
Flynn 5:44am: “No GHE. You cant even describe the GHE, in any scientific way. No increase in temperature due to CO2. None. No “heating”.”
Scientists have shown experiments proving political Flynn is wrong and Flynn counters with a a political agenda devoid of experimental evidence. Not sure what office Flynn is running for, possibly science blog Chief Dunce but I could be wrong.
Mike,
Read the whole paragraph, not just the particular sentence that you quoted. Context, my friend, context. It should be pretty clear what I actually mean. Although I still see how my wording there at the end could be misinterpreted as saying the opposite of what I actually meant. So, for the sake of clarification:
What I said in full was: “That’s how INSULATION could and would force the temperature to rise. Reduce the OUTPUT, not increase the INPUT. That’s heating.”
IOW, insulation works by reducing the output, while heating works by increasing the input.
Better?
“What I said in full was: Thats how INSULATION could and would force the temperature to rise. Reduce the OUTPUT, not increase the INPUT. Thats heating.
IOW, insulation works by reducing the output, while heating works by increasing the input.
Better?”
Every object insulates. A block of granite is insulation.
A block of granite is insulation which works by reducing the output.
Warmed by the sun, a block of granite could conduct heat within the block of granite- thereby reducing the output from the by surface more than thinner slab of granite.
In such context a cool block of granite insulates better than a warmer block of granite- or cool block of granite can conduct more heat from it’s warmer surface than a warmer block of granite.
When including an atmosphere, the warmed granite can also transfer kinetic energy to the molecules of the gas- and likewise would transfer more kinetic energy to a cooler atmosphere as compared to a warmer atmosphere. So the hotter the surface of the granite the more energy is transfer to gases of atmosphere and energy conducted beneath it’s surface.
So everything that absorb energy and thereby be measured to have been warmed, functions as “reducing the output” or delaying the output or trapping the energy of the sun or functions as insulation.
But matter is different and functions as better insulation in certain contexts- such as some things can absorb more of the energy of sunlight than other things. Or a block of copper conduct heat better than a block of granite- so a block copper of can [or could] reduce the output better than a block of granite.
In terms of the greenhouse effect hypothesis, on a planet the greenhouse gases are thought to reduces the output “better” as compared not having the greenhouse gases in the atmosphere, and these greenhouse gases with an exponential doubling has a greater effect [reduces output more].
Kristian,
Thanks for telling me what to do. Maybe you could ask me if I’ve already done it first?
You wrote –
“IOW, insulation works by reducing the output, while heating works by increasing the input.
Better?”
Still pointless and irrelevant.
The Earth has cooled. Leave an object on the surface of the Earth, and check to see how much hotter it has become after 10, 1000, or 1,000,000 orbits. It hasn’t, if you’re depending on the Sun.
However, if someone has built a civilisation within a few thousand kilometres, you might find a bit of stray heat has elevated the object’s temperature above that due to sunlight. Hardly surprising.
No GHE. None.
Cheers.
Mike says:L As long as the Earths surface is at a lower temperature than the interior, the Earth will continue to cool.
Do you *honestly* think that “global warming” is about the temperature of the *core*?
Do you *honestly* think that the surface (where people live!) has not gotten warmer and cooler multiple times in the last million years (as glaciers advanced an retreated)? That sort of makes any discussion of the *core* getting cooler moot.
Kristian
I think you are saying exactly the same thing I have been saying.
YOU: “No, the atmosphere, in being IR active and nearly as warm as the surface itself, continuously EXCHANGE energy with it, reducing the NET flow of energy out of it (its heat loss, radiative, conductive AND evaporative), which means, the surface LOSES less energy to the atmosphere than it would to space.”
I do not believe I have ever stated anything other than what you say here.
Yes, you have, Norman. You have been quite consistent in positing that the atmosphere actually ADDS energy to the surface and that it is directly because of this extra ADDITION of energy – right next to the solar input – that the average surface temperature of our planet is higher than, say, that of the Moon.
You have also shown that you do not fully grasp the thermodynamic concept of HEAT, in that you have repeatedly claimed that the solar flux + the DWLWIR from the atmosphere TOGETHER make up a total flux of incoming energy raising the final temperature of the surface way beyond the potential of a purely solar equilibrium. Such a distinct flux, however, would constitute a HEAT flux. (You have even called it a “heat flux”.) And that is a big no-no! Only the solar flux is a heat flux. The DWLWIR isn’t. And so the two components of your “total flux” are fundamentally different thermodynamic entities, part of two completely separate (in fact, opposite) heat transfers, one INCOMING and one OUTGOING. They can and should NOT be combined into ONE! It will make you confuse cause and effect.
The atmosphere does not ADD energy to the surface to make it warmer, Norman. The Sun does that. Thereby heating the surface. The surface in turn adds energy to the atmosphere, heating it. The surface LOSES energy to the atmosphere. But LESS to the atmosphere than to space. Per unit time. At any given surface temperature. THAT’S insulation!
MICRO vs. MACRO. Quantum vs. thermo. My dime analogy really explains the distinction between ‘adding’, ‘losing’, and ‘exchanging’ energy. The first two are basically net results of the latter. The first two are temperature-affecting, that is, thermodynamic quantities. The last one is more of a quantum perspective, considering individual ‘packets’ of energy effectively swapping places with other individual ‘packets’ of energy. In themselves, these individual exchanges don’t affect overall temperatures. They are not thermodynamic ‘events’. Only the NET of ALL individual exchanges does. Leading to a gain in internal energy [+U], a loss in internal energy [-U], or no change at all in internal energy [=U].
Kristian
Neither the Sun nor the atmosphere alone can raise the Earth’s surface to the observed average temperature. Neither will heat the Earth. Removing the GHG in the atmosphere at current conditions will result in the surface cooling.
I may have used “heat” in the past to describe it. I have since chosen to use just energy, energy flows and fluxes and leave the “heat” term out of it.
Here is the situation and maybe after I explain it you will see what I have been saying.
Three different situations to describe it.
In the first the surroundings are -100 C and you have a heating plate that has a total 1 meter squared surface area. The next at 0 C and the last at 100 C.
The amount of energy added to the heater in each case is 60 watts. For ease of calculation there will be no convection, conduction or evaporation to complicate the examples. I will make them act like blackbody radiators to ease the calculation.
In the first one, with the heater off, it will absorb the energy from the surroundings until is reaches -100 C.
It will be absorbing energy from the surroundings still as well as emitting it. It is both gaining energy from the surroundings and emitting it as well. That is why it is correct to say the atmosphere adds energy to the surface (but not heat).
1) Surface temperature with plate off. The surface will be radiating IR at 50.97 Watts. You will agree that if you turn the heater on (which you can see in the real world with any heater regardless of the external environment).
The surface is constantly absorbing 51 watts from the surroundings and emitting the same amount to maintain the temperature it has of -100 C. Now when you turn the heater on, there are 60 watts added. The 50 watts supplied by the surroundings does not just stop, it is still there and will be a factor in the final temperature of the surface of the heater. Now you have 50 watts absorbed, 50 emitted and now you are adding 60. Your heater will surface will now warm until it is emitting 110 watts. The surface will keep rising until it is emitting 110 watts so the the final temperature of the surface of the heater will reach an equilibrium state at -63.28 C which is considerably warmer than the -100 C it had been at. A rise of 36.72 C.
Yet you can see that the surrounding flux makes a huge impact on the final temperature and the IR is does not just bounce off the surface.
In condition 2) The plate surface off will be emitting 315.64 Watts. If you turn the heater on in this environment it will still warm but the extent will be less. Now it will warm from 0 C to 12.15 C (a rise of 12.15 C).
In the third state the plate, while off, will absorb surrounding energy until it is emitting at the same rate as it is absorbing the incoming energy which will be 1099.3 watts at 100 C. When you turn it on you will still get some warming but the amount of temperature rise gets less and less. In this case the 60 additional watts of energy will raise the temperature to 105 C or just 5 C.
But in each case the surrounding environment sets the energy the surface will reach equilibrium, and adding energy to this equilibrium raises the temperature.
The downwelling average flux of the atmosphere will keep the surface at 4.85 C until it cools. This will be the baseline temperature for the Earth’s surface. Then if you add any energy (be it solar or geothermal) the surface will warm above this baseline temperature and reach a higher equilibrium.
–Three different situations to describe it.
In the first the surroundings are -100 C and you have a heating plate that has a total 1 meter squared surface area. The next at 0 C and the last at 100 C.
The amount of energy added to the heater in each case is 60 watts. For ease of calculation there will be no convection, conduction or evaporation to complicate the examples. I will make them act like blackbody radiators to ease the calculation.–
Vacuum has no temperature, but you could have walls, ceiling and the floor at -100 C. And be in a vacuum- and as long as something doesn’t evaporate, one will have no convection.
And the room can surrounded by rock which -101 C, and walls are kept at -100 C [or whatever doing in the room would probably warm the walls, so walls, floor, and ceiling are kept uniformly cooled to -100 C. [As far as blackbody, walls could be plate copper with a coating that absorbs [and would emit] whatever blackbody radiation is planned to occur in the room].
“In the first one, with the heater off, it will absorb the energy from the surroundings until is reaches -100 C.”
Say heater are designed to work with output of 60 watts of electrical power [in a vacuum] and up to 200 watts of electrical power [in vacuum], so first one is off. The off heater may take some time to cool [or warm] to the -100 C walls but will not cool to lower temperature than -100 C.
“It will be absorbing energy from the surroundings still as well as emitting it. It is both gaining energy from the surroundings and emitting it as well. That is why it is correct to say the atmosphere adds energy to the surface (but not heat).”
Nothing in the room will be warmed higher then -100 C from the energy emitted from the walls.
“Your heater will surface will now warm until it is emitting 110 watts. ”
It would only emit 110 watts if one increased the electrical power to the heater to 110 watts. These heater could be simple incandescent light bulbs [200 watt lightbulb which are given 60 watts of electrical power for the need of 60 watts of IR radiation.
Normal light bulbs could be problematic in vacuum, but one can design them to work in a vacuum.
But the heater could also be something like a coffee hot plate if you want- it doesn’t much matter- except that off the shelf stuff would be designed with idea that one would have conventional heat loses.
My brother was talking me how 60 watt lightbulb burnt down a house- the person used large extension cord to power a single reading light, but extension cord had far more length then was needed, so coiled up beside the lamp and then later piled lots of newspapers on top on that coiled extension cord- it built up heat melted the insulation then shorted the wires- and got a fire. If newspapers were not piled on top it if it would not have been a problem.
Or in vacuum don’t coil up heavy extension cords to power your reading lamp- it could build up heat- fortunately one would not get a fire in a vacuum, but it could short out [and wreck your extension cord- and flip a breaker].
gbaikie
Thanks for the reply.
In your post you state this comment: “Your heater will surface will now warm until it is emitting 110 watts.
It would only emit 110 watts if one increased the electrical power to the heater to 110 watts. These heater could be simple incandescent light bulbs [200 watt lightbulb which are given 60 watts of electrical power for the need of 60 watts of IR radiation.”
That may seem possible at the colder end but what happens when you get to the hotter side of my long comment? When the surroundings are 100 C and radiating 1099 Watts to your one meter squared surface?
In order for your surface to reach an equilibrium temperature with its surroundings (100 C) it must be emitting the same as it is absorbing (or its temperature would change). Would the hot plate that is confined to a 60 Watt maximum only get the surface to reach a temperature of 60 Watts since that is all the energy the external power is adding to it?
You can test it very easily that regardless of the power setting the surface will get warmer than the surroundings. The fire example you gave is one point, when the wire was not allowed to lose energy at an equal rate that was going into it, it ended melting the wire and burning down the house.
The point I am making is the surroundings have a large impact.
I can agree with Kristian that Water Vapor GHE is extremely complex and difficult to determine which direction an increase would go. He has a good study on his blog about Wet/Dry areas on how Water Vapor works in the real world of energy exchange. It will increase the GHE in a region but it will make clouds that cut of solar input, it will greatly remove surface energy by evaporation, what it will do in the real world is complex and from all my looks on CERES (all-sky vs Clear-sky) it seems more energy and temperature occurs in clear-sky conditions. I could be wrong but will keep an open mind and continue to research. There is a Truth out there but too many are agenda driven to want to honestly seek it.
Norman:
“That may seem possible at the colder end but what happens when you get to the hotter side of my long comment? When the surroundings are 100 C and radiating 1099 Watts to your one meter squared surface?”
What comes to mind as to do with the nature of the watts per square meter. Or if trying to warm a surface, it will radiantly warm from directed light as compared to diffused light.
Or wiki says sunlight with sun at zenith and clear skies has about 1050 watts per square of direct sunlight [directed light] and if include indirect light, sunlight has 1120 watts per square meter. It’s the 1050 watts which “explains” why sand or sidewalks can reach 70 C.
Or as sunlight is further from Zenith [45 degrees or less] one gets less direct sunlight and more indirect sunlight and the power of sunlight to heat a surface [even if perpendicular to the sunlight] is diminished- of course it’s also diminished in regard to on a level surface [not perpendicular to the sunlight- because the sunlight is spread over more surface area [and not what I am talking about].
The sunlight has directed light mainly [considering it’s large distance] is because it’s a very large object [and it’s intensity of light, is because it’s pretty hot].
Norman says, May 29, 2017 at 4:41 PM:
True.
This, though, is a strange statement. The Sun clearly heats the Earth, Norman. That’s what it does. It is “the heater”. Mainly, it heats the surface. The atmosphere, on the other hand, does NOT heat the Earth, and it does NOT heat the surface. It INSULATES the solar-heated surface. That is what IT does.
“Heating” of a system is a thermodynamic process whereby energy is ADDED to that system by way of Q (a transfer of heat); +Q. Adding energy to a system in this way without equal cooling (below) will increase the total content of internal energy [U] of the system, and thereby its T.
“Cooling” of the same system is the opposite thermodynamic process, whereby energy is REMOVED/LOST from the system by way of Q (a transfer of heat); Q. Removing/losing energy from a system in this way without equal heating will reduce the total content of internal energy of the system, and thereby its T.
What “insulation” does is reduce the cooling (energy LOSS) of a system. It does NOT increase its heating (energy GAIN). It does not add energy. Ever.
If you simply understand and apply these basic thermodynamic principles, Norman, then everything will become so much clearer. It becomes SO obvious what the atmosphere does and what it doesn’t do. It DOES NOT ADD ENERGY to the surface. It simply draws LESS energy out and away from it per unit time than what space would do, at any given surface temperature. Because it is, in being heated by the surface, so much ‘warmer’ than space. The atmosphere is simply ABLE to be heated by the surface. It is thereby ABLE to acquire a temperature. Space isn’t. And that’s the whole secret.
This is most likely also true. But it would only happen because you then effectively disconnect the two systems (sfc and atm) thermodynamically. You would then basically make space itself the immediate thermal surroundings of the surface, and at the same time essentially isolate the bulk atmosphere from the rest of the universe.
Which is silly, because the HEAT fluxes are all that matters when it comes to thermodynamic effects like temperature changes. I suggest you stop listening to Ball4. He is a thoroughly confused individual.
No, Norman. Didn’t you read what I wrote above? Didn’t you get my dime analogy? The plate will EXCHANGE energy with its surroundings. Only individual (specific) photons can be said to have been “added”. ‘Energy’ as a bulk quantity is NOT added to a warmer place from a colder place. That is elementary.
http://www.drroyspencer.com/2017/05/uah-global-temperature-update-for-april-2017-0-27-deg-c/#comment-247505
MICRO vs. MACRO. Quantum vs. thermo. How many times does this have to be repeated, I wonder?
No. A thermal equilibrium is defined by a net energy exchange of 0. Watt (J/s) is a macroscopic unit. The surface neither absorbs nor emits a MACROSCOPIC flux of energy in thermal equilibrium. Only MATHEMATICALLY so. In reality, it only absorbs and emits individual PHOTONS (quantum entities). The probabilistic average (the sum) of ALL such absorp tion and emission events at any point in time is the instantaneous net exchange. Which in thermal equilibrium (equal temps) is zero.
MACRO vs. MICRO. Quantum vs. thermo.
Just drop the ADDING OF ENERGY worm, Norman. In this case, g*e*r*a*n is right. You do appear to have a worm in your head on this issue. And you do appear utterly unable to get rid of it.
You need to be able to hold what seems like two contradictory thoughts in your head at the same time. Because they aren’t really. They simply address different aspects of the same ‘Reality’. Think statistical mechanics. Bulk properties. Thermodynamic limit.
No, the surrounding TEMPERATURE makes a huge impact on the final temperature of the heated object. By REDUCING its net energy loss at any given temperature. The IR is simply a radiative expression of temperature. No temperature, no IR. Higher temperature, more IR. Lower temperature, less IR.
The problem with your two-flux explanation is that it will so easily confuse its adherents regarding cause and effect. These are NOT two separate fluxes. They ALWAYS net out in a spontaneous, instantaneous exchange of energy. You cannot split them apart. They’re ONE integrated process!
https://okulaer.files.wordpress.com/2017/05/net-sw-net-lw.png
You are constantly invoking an inherently QUANTUM MECHANICAL phenomenon (individual absorp tion and emission events of photons) to explain a distinctly THERMODYNAMIC effect (temperature change). You can’t do that. Well, you can, but then you NEED to include the entire exchange, not just particular parts of it in isolation. MICRO vs. MACRO.
Say what!? So the DWLWIR somehow CAUSES the surface temp to equilibrate at 4.85 degrees!? As if it were an independent incoming heat flux …
You need to get this worm out of your head immediately, Norman!
No, no, no, no!!! The DWLWIR is what it appears to be because the atmosphere has the temperature it has. And it has the temperature it has because the surface put a certain amount of energy into it (through heating it) up until the point where dynamic equilibrium was finally reached.
But how did the surface get to heat the atmosphere to begin with? Only by ITSELF being heated FIRST. And by what, you ask? By … the Sun!
The atmosphere (and certainly no discrete atmospheric “downward flux”) isn’t MAINTAINING the surface temp at all in the absence of the Sun.
The surface COOLS at night, Norman. Its temperature DROPS. Which SHOULD tell you something. It tells you that the atmosphere DOES NOT ADD any energy to it. The surface only LOSES energy in its thermal exchange with the atmosphere. No gain. No energy added.
How hard is this!?
** Kristian says:
May 30, 2017 at 4:20 PM
Norman says, May 29, 2017 at 4:41 PM:
Neither the Sun nor the atmosphere alone can raise the Earths surface to the observed average temperature.
True.
Neither will heat the Earth.
This, though, is a strange statement. …**
Not that strange if first statement is actually, true.
The sun with a planet with 1 atmosphere can raise the Earth surface to the observed average temperature.
Or the sun can raise the surface temperature to 15 C. The sun can even raise the surface temperature of Mars to 15 C
But if Sunlight is blocked [night time] it can’t raise the temperature to 15 C, but if the sun is near zenith it can raise the surface to 70 C and surface air temperature as much as 50 C.
As said before, the idea that without greenhouse gases the Earth would be -18 C [is wrong, but also it also causes confusion and apparently even for professional [ie, paid] scientists.
So, question is what would a -18 C Earth look like [I don’t care if has greenhouse gases or it can be with or without greenhouse gases. The point is what would Earth look like, or “have to” look like.
Or if this Earth is at sun distance and same sun and roughly same Earth AND you think the tropics is frozen- you are wrong [try again].
Oh, I thought of a clue to give.
In previous blog entry, there was discussion of how quickly the Moon cools and mention of a rapid “500 F “swing” in temperature’ associated with lunar ellipse.
And at some point I noted that a “swing” isn’t a drop or plummet. But few seem to take note.
So clue is if you block the sun when at zenith from Earth surface [or from lunar surface], the temperature will drop fairly quickly- perhaps even surprisingly quickly. [Though if you are asleep in your bedroom- you will not notice it- btw].
And when the sun is unblocked the air temperature will return to normal [if blocked for hours starting at noon, and unblocked at 2 pm- it will be cooler than a normal 2 pm- but if blocked for say 1/2 hour or less, it will rapidly return to normal].
— Removing the GHG in the atmosphere at current conditions will result in the surface cooling.
This is most likely also true. …–
I would say it’s possibly true.
But how much.
AND if how much is X, then what are effects of X.
The radiant energy of the sun affects the orbits of space rocks [such as a group called NEOs].
That is without doubt, true.
How much?
A small amount.
Can it cause a space rock to hit earth?
Yes. But it doesn’t cause a space rock to hit Earth, it alters the trajectory a bit over time [it’s possible it could cause a space rock to not hit Earth}.
One can predict the trajectory of space rocks for centuries- and not even include this effect- unless one needed a very precise location in time- such as it looked like space rock could pass near Earth [for example] and there are other variables which can have much larger effect such as passing close to gravity well [say, Mars, or passing close to Earth, itself].
–But it would only happen because you then effectively disconnect the two systems (sfc and atm) thermodynamically. You would then basically make space itself the immediate thermal surroundings of the surface, and at the same time essentially isolate the bulk atmosphere from the rest of the universe.–
If had a large window in space station, I don’t think it has much of effect.
Or with space stations a cost/problem is keeping them cool and I would not have a large window in one, in order to help cool the space station. I would have one, so space tourists could look outside.
Norman, you have to be very careful with statements like
“In this case, apparently somebody somewhere has stated that if it were not for the presence of greenhouse gases, the atmosphere would be at uniform temperature at all heights. That is bollocks. The lapse rate (https://en.wikipedia.org/wiki/Lapse_rate), by which it gets colder as you go higher, does not depend on the presence of greenhouse gases.”
The earth has THREE factors that all disturb thermal equilibrium
1) the sun only shines on 1/2 of the earth at a time
2) the earth rotates.
3) the atmosphere can lose energy to space via greenhouse gases.
If you could get rid of ALL THREE disturbances, then the temperature WOULD be constant with height. The lapse rate is a direct consequence of NON-equilibrium conditions –> energy entering at the bottom and leaving from the top.
In a ‘perfectly insulated” column, the temperature WOULD be uniform all the way up with no lapse rate (according to pretty much all the sources mentioned recently (Maxwell & Feynman to name two).
I agree with Folkerts. The atmosphere would end up isothermal in a final equilibrated state if it had no radiative properties of any kind. What’s more, its main (isothermal) bulk would end up much warmer on average than the surface below. It would still not be able to affect it thermally once this equilibrated state had been reached.
What people tend not to get (in fact, it seems to be a perennial source of confusion!) is that the observed, natural tropospheric temperature profile, what is often called the “environmental lapse rate (ELR)”, is NOT the same thing as the “adiabatic lapse rate (ALR)”. People look at the mathematical formula describing the (dry) adiabatic lapse rate (DALR), g/c_p, and conclude that radiation has no hand in it. And they’re quite right. But it’s also quite irrelevant to what we’re talking about here. Because the DALR isn’t the ELR. It is a fundamentally different concept.
The ELR is simply the observed tropospheric temperature gradient. It varies from place to place, from level to level, and from time to time, governed as it is by the constantly fluctuating balance between heating and cooling of the tropospheric column plus the degree of turbulent mixing (convection). Radiative transfer indeed has a central role in this continuous and often quite complex process.
The DALR, however, is a much more restricted (as in ‘specific’) phenomenon. It is simply the rate by which a particular volume of air ascending (descending) through the tropospheric column cools (warms) as it does so, without any phase changes occurring inside the volume. It is always the same (or almost exactly the same) wherever you are within our global troposphere: About -9.71 K/km. But it says nothing about what put that particular volume of air into motion in the first place …!
“The atmosphere would end up isothermal in a final equilibrated state if it had no radiative properties of any kind. “
… and if sunlight were uniform over the surface (and a few more caveats). True thermodynamic equilibrium means no energy moving within the system (and also, of course, no energy entering or leaving the system).
“Whats more, its main (isothermal) bulk would end up much warmer on average than the surface below. “
Well, this would NOT be equilibrium! The only way to have thermodynamic equilibrium is for all of the surface to be a uniform temperature, and for the atmosphere to then have the same uniform temperature. If the surface were not uniform temperature, then energy would be flowing into the atmosphere in the warm areas, and leaving in the cool areas. Which by definition is NOT thermodynamic equilibrium!
In various steady-state but NON-equilibrium states (ie *steady* flows of energy though the atmosphere), then your solution is certainly plausible.
Tim, Kristian the isothermal atm. from the surface under the conditions you propose would be an interim T(z) = constant as it is shown lower entropy than the Poisson solution for T(z). The entropy at T=constant will continue to increase as universe entropy does in all processes until max. entropy is achieved at Poisson T(z).
Folkerts, I am not talking about a proper “thermodynamic equilibrium”.
If the atmosphere happened to be completely transparent to IR, then this is likely what would happen:
The surface could never become hot enough to drive convective transfer of energy to the atmosphere beyond a certain point, if this atmosphere were of a so-called ‘non-participating’ kind. This point is where the positive temp gradient developing during the night between the surface itself plus the air layer right on top of it and the main bulk of the atmosphere above this rather narrow intermediate layer cannot be broken and turned into a steep enough negative gradient during the day, simply because the surface doesn’t have the time nor the opportunity to become hot enough – due to radiative heat loss.
In a hypothetical scenario with a radiatively inert atmosphere, you would thus end up with a planet – after a (steady) state of dynamic equilibrium is finally achieved – where the solid surface itself on average is much colder than the bulk atmosphere above it, all heat exchange between the surface and the atmosphere basically occurring solely within a narrow layer right at the bottom, the diurnally fluctuating top of which essentially constituting a low-level ‘tropopause’, above it an isothermal, pretty hot, pretty thick ‘blanket’ of static air containing it.
The surface and the main bulk of the atmosphere would, for all intents and purposes, be thermodynamicallu disconnected at this point, the latter more or less isolated from the rest of the universe, the former now in direct thermal contact only with space (and that narrow layer of air directly on top of it).
Ball4, If I read your comment correctly, then I disagree.
Isothermal is indeed the final, correct solution for a column of gas in thermodynamic equilibrium even in a gravitational field.
The Possion solution with a linear temperature gradient applies to an atmosphere where gases are free to convect AND where ‘parcels’ of gas do not exchange thermal energy with adjacent parcels (ie ‘adiabatic’ parcels. In this case, where the parcels do not exchange thermal energy as they convect up and down, then the atmosphere develops a lapse rate. If convection stops, this lapse rate would remain.
Since air is an excellent insulator and since the air continuously mixes in the real atmosphere, the Poisson solution is an excellent APPROXIMATION for the real (non-equilibrium) atmosphere. However, if a truly isolated column of air had a lapse rate like this, then the (very slow) process of conduction would eventually allow the warm areas to cool and the cool areas to warm.
http://farside.ph.utexas.edu/teaching/sm1/lectures/node56.html
(Here’s one intuitive argument. Suppose there were a lapse rate with warmer air at the bottom. If that warmer air were allowed to cool a bit (with the thin air at the top expanding a little bit), the gas would contract and the center of mass of the whole column would decrease. Intuitively, the equilibrium condition for a system is when the mass has ‘settled’ as much as it can. )
Kristian, I can’t speak with certainty about the atmosphere you are proposing. I do, however, think you are underestimating the impact of convection driven by day/night differences and pole/equator differences. I suspect theses would mix the atmosphere more than you are anticipating. But is really doesn’t much matter, since this hypothetical atmosphere is SO different than any real atmosphere on any planet or moon.
Tim, “However, if a truly isolated column of air had a lapse rate like this, then the (very slow) process of conduction would eventually allow the warm areas to cool and the cool areas to warm.”
If the column you propose has no lapse rate in the gravity field, it is at a state of lower entropy than one with the Poisson lapse, so nature will act to drive your isolated universe to max. entropy T(z) which is the Poisson lapse. At that time all thermodynamic variables stop changing, hence thermodynamic equilibrium is achieved, your posited universe is at so-called heat death T(z).
There is no way around this given the 2LOT even in the face of conduction. If you argue against 2LOT as you do, there is no hope for a valid argument.
“If the column you propose has no lapse rate in the gravity field, it is at a state of lower entropy than one with the Poisson lapse …
Can you write out a proof, calculating the entropies in each case? Do you have a link to an ‘authority’ that agrees with you?
I gave one simple, intuitive argument for my position. I gave a link to a university site that agrees with me. Boltzmann himself concluded the column would be isothermal. It is also quite easy to create a perpetual motion machine if a lapse rate were the ‘natural’ state for an insulated column.
Tim, search your link for equilibrium. Two hits, neither have anything to with your posited column thermodynamic equilibrium being isothermal thus can not be in agreement as per your 12:55pm comment.
Yes, please explain how to create a perpetual motion machine out of the Poisson T(z) profile. Actually if your isolated system has reached the point of heat death max. entropy at that profile, a heat engine can no longer be created.
Ball4 says: “Tim, search your link …
Ball4, here is what that link says:
Fact 2: air is constantly in motion –> not in equilibrium
Fact 3: air is a poor conductor –> if air were a good conductor, the profile would approach isothermal.
It is only the convective motion that sets up the lapse rate, and only the inability to easily get back to equilibrium that maintains the lapse rate.
“Yes, please explain how to create a perpetual motion machine …
1) Start with a thermal reservoir at ground level.
2) Connect the bottom of two columns of gas to the thermal reservoir, so that the bottom of both columns are @ the same temperature.
3) Fill the columns with two different gases with two different specific heats.
4) Connect a heat engine between the tops of the columns.
The adiabatic lapse rate depends on the specific heats, so if the equilibrium condition were the adiabatic lapse rate, the tops of the two columns would naturally maintain a permanent temperature difference. If there is a permanent temperature difference, you could perpetually run a heat engine.
Tim…”In particular, most infrared radiation, which carries heat energy, passes straight through the lower atmosphere and heats the ground. In other words, the lower atmosphere is heated from below, not from above”.
Don’t know where you got that pseudo-science but IR does NOT carry heat energy. IR is electromagnetic energy and it carries no heat energy whatsoever. Anyone who thinks EM is thermal energy is deluding himself.
Furthermore, it is the GHE and AGW theories claim solar energy goes straight through the atmosphere. Both depend on that being true. It stands to reason that all of the gases in the atmosphere absorb at least a fraction of the broad spectrum of solar energy, which extends to the ultraviolet. GHGs in the atmosphere should absorb IR from solar energy since IR makes up 52% of solar energy.
I think this theory needs to be revisited. It has been created by scientists with vested interests in certain theories and I am guessing they have not looked very closely at the overall reality.
There is a good article by Claes Johnson that lays out the deals made by various scientists with the Devil of Science to have their theories accepted. One of the scientists mentioned, Schrodinger, at least had the integrity to disconnect himself from the modern quantum theory proposed initially by Bohr.
Schrodinger claimed he wanted nothing to do with Bohr’s imaginary creations, nor did Einstein. Modern scientists who have accepted Bohr’s version are dealing in the imaginary world rejected by Schrodinger, the father of quantum mechanics, and Einstein.
We speak in this blog of the equations of Boltzmann, as if they are written in stone. The truth is that Boltzmann was a seriously troubled man who committed suicide due to the depression he incurred from not being able to prove his theories on heat.
http://www.csc.kth.se/~cgjoh/mysticism.pdf
The message is clear from luminaries like Feynman and David Bohm that we must go on challenging all science and not accept it verbatim.
Tim 12:55pm: “for a column of gas”
Tim 6:38pm: “It is also quite easy to create a perpetual motion machine if a lapse rate were the ‘natural’ state for an insulated column.”
Tim 9:50pm: “Connect the bottom of two columns of gas…”
Tim, you changed the subject, you get only one isolated column of gas at max. entropy Poisson profile to create your purported perpetual motion machine. Can’t be done, but I’m interested to learn as you comment you can do it.
Gordon 10:08pm, “Furthermore, it is the GHE and AGW theories claim solar energy goes straight through the atmosphere.”
This is incorrect Gordon, look at any Earth energy balance cartoon, some solar SW energy is absorb-ed in the atm., some SW absorb-ed at the L&O surface.
“We speak in this blog of the equations of Boltzmann, as if they are written in stone. “
… and yet you speak of your own personal understanding of “heat” as if *it* is written in stone! (And I don’t think typical people do speak of specific equations this way.)
“Dont know where you got that pseudo-science but IR does NOT carry heat energy.
… and yet every single introductory physics text covering “heat” talks about conduction, convection AND RADIATION as the three forms of heat, Q.
IR is electromagnetic energy and it carries no heat energy whatsoever.
… and yet this EM radiation transfers energy from hot objects to cool objects due to their temperature difference — pretty much the definition of “heat”, Q.
“Anyone who thinks EM is thermal energy is deluding himself.”
EM radiation is heat, Q, not ‘thermal energy’, U. So here I agree with you, but not for the reasons you put forward.
We could go on, but this is not the place for hashing out all of these issues.
Ball4, you are being too restrictive. If one column of gas with a lapse rate is the max entropy solution, then two columns of gas with lapse rates is the max entropy solution for the combined system. If the two columns (of different gases with different lapse rates) are brought into thermal contact (say at the bottom of the columns), then eventually they will achieve thermal equilibrium. But if the tops of the two systems (supposedly in thermal equilibrium) are also brought into thermal contact, heat will spontaneously flow from one to the other — contradicting the assumption of thermal equilibrium, and contradicting the assumption that a lapse rate was thermal equilibrium to start with.
Or for Pete’s sake, simply apply the zeroth law of thermodynamics — if two thermodynamic systems are each in thermal equilibrium with a third, then they are in thermal equilibrium with each other. Two systems (the top of the column and the bottom of the column) are NOT both in thermal equilibrium with a third (a thermometer), so they are NOT in thermal equilibrium with each other. They move toward thermal equilibrium (and higher entropy) by moving toward a uniform temperature.
Tim, “If one column of gas with a lapse rate is the max entropy solution, then two columns of gas with lapse rates is the max entropy solution for the combined system.”
To get a one column system to max. entropy it has to be a complete universe, isolated by itself. So one column is all you get which is what you started with & at the Poisson T(z) profile.
If you do take your two columns and isolate them into one universe, then max. entropy can still be achieved and your heat engine will stop at that point. No perpetual motion either.
“Or for Pete’s sake, simply apply the zeroth law of thermodynamics..”
That works in an isolated column with no gravity field. Entropy will stop increasing with T(z)=constant for that case.
Doesn’t work with the isolated column in a gravity field as thermodynamic internal (thermal) energy will not be achieved until all thermodynamic variables cease to change. If entropy is still increasing towards Poisson T(z) max. there is no real thermodynamic internal (thermal) energy equilibrium.
Tim states: “If you could get rid of ALL THREE disturbances, then the temperature WOULD be constant with height. The lapse rate is a direct consequence of NON-equilibrium conditions > energy entering at the bottom and leaving from the top.”
I agree, Tim.
Well stated!
–The earth has THREE factors that all disturb thermal equilibrium
1) the sun only shines on 1/2 of the earth at a time
2) the earth rotates.
3) the atmosphere can lose energy to space via greenhouse gases. —
Atmosphere can lose energy to space via clouds.
Question do you think atmosphere loses more energy to space from greenhouse gases or from clouds
I don’t mean by cloud reflecting light- though it seems that also should “disturb thermal equilibrium”.
One also would have other things, like the jet stream and
Hadley cell. Or I would think quite a long list- depending how relevant or significant you counted them.
Also can’t say I agree that greenhouse gases lose energy to space, radiantly- or kind of why I asked which does more cloud or greenhouse gases. Though Ozone and since it’s being counted as greenhouse gas, should radiate some radiation into space.
gbaikie…”Question do you think atmosphere loses more energy to space from greenhouse gases or from clouds…”
I think that’s a good question. Clouds are often modeled as small lakes of water.
Another question I have posed is why would nitrogen and oxygen not radiate to space? All gases radiate EM. We have been inundated with radiation frequencies in the infrared but most radiation detected from space comes from hydrogen.
Hydrogen radiates over a broad spectrum and here is a good explanation of why:
https://en.wikipedia.org/wiki/Hydrogen_spectral_series
The same should apply to N2 and O2, and they make up 99+% of the atmosphere.
“Another question I have posed is why would nitrogen and oxygen not radiate to space? All gases radiate EM. We have been inundated with radiation frequencies in the infrared but most radiation detected from space comes from hydrogen.”
Most will agree that N2 and O2 do absorb and radiate heat by a very small amount. But they would then say greenhouse gases radiate “a lot more”.
Or a lot more than a small amount, to which I would all gases don’t radiant much energy.
Though I would say [suppose] plasma can radiate a lot- plasma is not gas, any more than water is a gas. Plasma does weird stuff. Which gets to thing about hydrogen- it could be hydrogen in universe is referring hydrogen in it’s plasma state rather than in it’s gas state.
And with very high in our atmosphere one has oxygen and Nitrogen which is in it’s plasma state.
But that’s not to say that I think anything in our very high atmosphere is warming and cooling anything down here.
Tim…”The earth has THREE factors that all disturb thermal equilibrium
1) the sun only shines on 1/2 of the earth at a time
2) the earth rotates.
3) the atmosphere can lose energy to space via greenhouse gases.
If you could get rid of ALL THREE disturbances, then the temperature WOULD be constant with height”.
1) and 2) are equivalent, are they not? What you are saying in effect is that part of thermal equilibrium is established by solar radiation. I cannot agree with your suggestion that GHGs are the only radiators to space or that without such incoming/outgoing radiation temperature would become constant at all altitudes.
You are saying only water vapour can radiate to space. Is there any water vapour at that altitude? Why would nitrogen and oxygen not radiate to space. All gases radiate EM.
What about gravity? It is gravity that creates a gradient in air pressure from the surface to higher altitudes. Are you denying the ideal gas equation, PV = nRT? Seems to me that’s what governs temperature with altitude.
I am aware that lapse rate theory claims the temperature gradient is due to convection but have you ever considered the definition might be wrong, or omitting other pertinent facts? There is a lot of pseudo-science written these days in wikis.
Supposing you had a static atmosphere with no convection or rising heat but a strong gravitational field. The pressure gradient would still exist therefore there should be a natural temperature gradient as well, and it should be in proportion.
I am fully aware that the atmosphere is volatile and that rising parcels of air affect the atmospheric temperatures. However, why would those rising parcels of air cool if it were already not cooler at altitude?
It seems advocates of lapse rate as determining temperature with altitude are forgetting basic physics and chemistry laws. Lapse rate is obviously superimposed on the temperature gradient established by gravity.
Kristian mentioned the environmental lapse rate which supposedly refers to air with little or no disturbance from convection. That definition too is rife with radiation theory. Modern climatologists simply cannot help themselves, their physics and chemistry theory is missing.
1) and 2) are equivalent, are they not?
It seems like a fair point.
“What you are saying in effect is that part of thermal equilibrium is established by solar radiation. ”
I think it’s the opposite- “disturb thermal equilibrium”
Though by disturbing one could see is as establishing some order- assuming, you believe in acts of rebellion as means of establishing order. [I tend to think it’s women who say, “no”.]
“I cannot agree with your suggestion that GHGs are the only radiators to space or that without such incoming/outgoing radiation temperature would become constant at all altitudes.”
Yeah, I tend to agree, I can’t agree.
But he did mention the day and night thing. I think acknowledging day and night is important step for someone who might otherwise be focused solely on the averaged variables.
“You are saying only water vapour can radiate to space. Is there any water vapour at that altitude? Why would nitrogen and oxygen not radiate to space. All gases radiate EM.”
If he thought was only water vapour, I think that would a good sign- just need to put water vapor together with clouds- or water droplets and ice particles suspended in the atmosphere. Or in terms of clouds roughly estimated to be:
“One estimate of the volume of water in the atmosphere at any one time is about 3,100 cubic miles or 12,900 cubic kilometers”
https://water.usgs.gov/edu/watercycleatmosphere.html
It goes one to say that isn’t actually very much if you think about in comparison to other massive things.
But 12,900 cubic km is 12,900 billion tonnes or 12.9 trillion tonnes. It’s about half the mass of Mars atmosphere [probably doesn’t sound too impressive]. Or compare amount water that flowing down the Mississippi per year. Ice leaving Greenland per year. Or say the total tonnage of all cars and trucks in the world- floating up, up in the sky!
But small lakes of water, or many, many small lakes of water, is good general way to look at it.
Anyways, what else? Oh not finished- this specific bit:
“Is there any water vapour at that altitude?”
Well practically “all” water vapor is in tropics, and you got to put the water vapor with the clouds, and in tropics one has lots of huge towering clouds. And the clouds are these mad monster machines which suck up water vapor, condensing into water droplet and ice particles and dumping unreasonable amounts of rain.
cloud alitude:
Tropics, high clouds being 6 to 18 km
Mid-latitudes, high clouds being 5 to 13 km
https://www.windows2universe.org/?page=/earth/Atmosphere/clouds/heights_latitude.html
And I would say one tends to get higher clouds in Mid-latitudes when closer to summer rather than closer to winter.
So 18 km is 59055 feet- airliners don’t fly that high.
“The highest certified altitude of an airliner was Concorde’s 60,000 feet. Today some of the corporate jets can fly at 51,000 feet. Q: What is the highest cruising altitude allowed? A: Most airliners are limited to 45,000 feet or less”
And 13 km is 42650 feet, so can, generally fly over them in Mid-latitudes.
So pretty high, and on average half atmosphere is, here:
“For example, in Earth’s atmosphere the pressure at a height of 5.5 kilometers is only 50% of the surface pressure. This means that one half of the mass in our atmosphere is above 5.5 kilometers in altitude (and one half is below that altitude). At a height of approximately 16 kilometers in our atmosphere, the pressure is about 10% of the surface pressure. Therefore, only 10% of the mass in our atmosphere can be found more than 16 kilometers above the surface.”
Or 10 km high is about 6.5 C times 10 cooler- 65 K cooler than sea level air temperature. So tropics at 10 Km it’s about -30 C, though in a updraft in cloud with water vapor condensing, the air, I would guess, should be quite a bit warmer- it’s the warmed air which drives the updraft.
Gordon 9:41pm: “Are you denying the ideal gas equation, PV = nRT? Seems to me that’s what governs temperature with altitude.”
Radiation balance meaning energy in and energy out governs the temperature at each thin atm. layer Gordon, not IGL P=density*R*T.
Witness ~9-10 km standard atm. above tropopause where density goes down, pressure goes down with increasing z height and T(z) remains constant.
At the surface, just look at Vancouver weather reports, P = density*R*T does not hold either, for ~constant density, P and T sometimes move in different directions hour to hour.
Gordon ….
1) I should have said those are three *examples* of things that disturb equilibrium. There are certainly others (like radiation from clouds). Also, a half lit non-rotating world would be quite different from a rotating world, so they are not quite the same thing. There have to be NO disturbances to get to true thermodynamic equilibrium.
2 “You are saying only water vapour can radiate to space. Is there any water vapour at that altitude? Why would nitrogen and oxygen not radiate to space. All gases radiate EM.
Lots of things radiate – especially gaseous H2O, CO2, & clouds. Not sure which altitude you are referring to. As long as there is H2O gas, it will radiate to space from *some* altitude range. N2 & O2 are usually ignored since they radiate SO POORLY. This is an approximation, but a very useful approximation, since they contribute only a tiny fraction of the outgoing thermal IR
3. “However, why would those rising parcels of air cool if it were already not cooler at altitude?”
Because they are expanding! It is this cooling during expansion that causes the higher levels to be cooler to begin with!
” Tim Folkerts says:
May 30, 2017 at 12:43 PM
Gordon .
1) I should have said those are three *examples* of things that disturb equilibrium. There are certainly others (like radiation from clouds). Also, a half lit non-rotating world would be quite different from a rotating world, so they are not quite the same thing. There have to be NO disturbances to get to true thermodynamic equilibrium. ”
Yeah, that’s true. But in this context, I would also include the spherical nature of a planet heated by the sun.
Or with spherical planet, one would need internal heat source rather than a sun to get such a true thermodynamic equilibrium.
But when I am saying this, I wonder about Venus providing an exception to this rule [spherical shape of planet and sun heated], except that Venus’ atmosphere rotates. Which btw, points to proof [if needed] that Venus atmosphere is heated by the sun [or at least, significantly heated by the sun].
[Oh, but doesn’t provide proof of Venus rocky surface being directly heated by the sun {or that the rocky surface is cooling-radiating/convecting/conducting the heat of a sun directly heating it’s rocky surface}].
–3. However, why would those rising parcels of air cool if it were already not cooler at altitude?
Because they are expanding! It is this cooling during expansion that causes the higher levels to be cooler to begin with!–
This is problematic.
Thermals or uplift of air masses do cool as they rise [and air masses warm as they fall] but with the term of “air parcels” one is referring to movement of kinetic energy of the air molecules. Or the average molecule’s velocity rises, not the molecules, though the kinetic movement of energy could lead to upward movement of air masses.
Generally one needs something to make tonnes of air go up- this could be horizontal wind hitting barrier- a mountain or say, a mass of colder air.
Or a mass of air can become more buoyant.
So to be more buoyant one needs a body of air to warmer and need a body of air colder- need a lighter and a heavier.
Or a wetter or drier body of air- same temperature of air but with more water vapor it will make the wetter air more buoyant [a cubic meter volume is less dense] as compare to same temperature but drier air.
It will be very heavy monsoon rainfall, because the southern Indian Ocean is cool.
http://files.tinypic.pl/i/00904/f5p6knyaxupi.png
https://earth.nullschool.net/#2017/05/30/0600Z/wind/isobaric/1000hPa/orthographic=-283.32,5.06,786
Large increase in the SOI index.
https://www.longpaddock.qld.gov.au/seasonalclimateoutlook/southernoscillationindex/30daysoivalues/
And what is the temperature in the stratosphere over the South Pole?
Will there be a big ozone hole?
http://ds.data.jma.go.jp/tcc/tcc/products/clisys/STRAT/gif/pole10_sh.gif
http://ds.data.jma.go.jp/tcc/tcc/products/clisys/STRAT/gif/pole30_sh.gif
The black line shows daily temperatures, and the gray line indicates the normal (i.e., the 1981 – 2010 average).
Now the sea ice will be outpaced by the side of the Atlantic, as the polar vortex is strongest there and cut the warmer air.
http://www.cpc.ncep.noaa.gov/products/stratosphere/strat_a_f/gif_files/gfs_z100_sh_f00.png
What’s going on in Australia? A little freezing to the east.
Tim Folkerts,
You wrote –
“Do you *honestly* think that the surface (where people live!) has not gotten warmer and cooler multiple times in the last million years (as glaciers advanced an retreated)? That sort of makes any discussion of the *core* getting cooler moot.”
No “gotcha” for you today, Tim. If you want to know what I think, just ask!
May I respond by pointing out that the Antarctic has the lowest temperatures on Earth, the arid tropical deserts the highest, and the residents of Pompeii discovered what happens in the event of a very rapid local heat increase.
What’s the relevance to the GHE, then?
Isn’t the entire surface of the globe supposed to be warming, according to foolish Warmists? The surface has cooled – molten to its present temperature. Cooling of the surface – on average, which is a measure apparently beloved of foolish Warmists.
No GHE. No global heating due to CO2.
Cheers.
I’ve been watching this issue for decades now. On and off paying attention and lurking at lukewarmer sites like Climate Etc., Climate Audit, The Blackboard, and here, although unfortunately some of these sites are no longer active. In any case, for me, and for many other people at those sites, “the pause” has meant the major discrepancy between the predictions of the climate models and what observed temperatures have actually been doing.
And by observed temperatures I normally mean what the satellites are recording and not the surface temperature data set, which to my mind has so many problems that it just astonishes me that some people think that is the better data set.
Now on the other hand there are lot of people who when they say “the pause,” they mean that there has been no temperature increase. Of course by picking the right start year and the right end year, there have been many times when one could argue that there was no change, but really I kind of feel like this is mostly people who aren’t paying sufficient attention.
So in other words I agree with Dr. Spencer that the Santer et al paper is bit of a strawman argument this avoids the real issue.
On a different subject there is something I’ve been wondering about lately.
Is it possible to make an estimate about what percent of the current temperature swing could reasonably be ascribed to natural factors? I mean this would be a statistical argument based on temperature swings seen in past inter-glacials over the last few million years. It would be an attempt to estimate what percent of the swing seen now is likely to be unnatural. It would be a statistical argument based on empirical data.
“Now, exactly how does one scientifically test a claim of leveling off of warming?”
David Appell claims you need peer review. When the IPCC sorted through their peer reviewed papers, using 2500 reviewers, they claimed in 2013, based on their 2012 assessment, that no significant average warming had been detected over the 15 year period from 1998 – 2012.
It appears Appell believes in peer review only when the outcome suits him.
Of course, UAH knew that well in advance and they extended the so called hiatus to 18 years. Santer is challenging the IPCC some 5 years after the review just as the Obama-lead NOAA did using pseudo-science.
Santer is obviously willing to use smoke and mirrors to make his point and that’s why his work, along with that of the likes of Mann, Schmidt, Trenberth, et al, does not interest me.
Kristian
I think I am seeing the point you are making and it is a very good one that should be addressed about the Outgoing Longwave IR and the actual surface temperature.
https://www.esrl.noaa.gov/psd/map/images/olr/olr.90day.gif.
The GHE (as described by David Appel): “GHE = (a planets actual global average surface temperature) minus (the planets brightness temperature).”
Using the data from your blog. Sahara Surface temperature you estimated at 301.5 K. The brightness temperature is 270 (estimate) W/m^2 for the Congo which gives a value of 263 K.
So the GHE of the region Congo would be 38.5 K
But over the Congo you have an estimated temperature of 298 K with an outgoing IR of around 210 W/m^2. The brightness temperature would b 249 K over the Congo so its GHE should be 298-249 = 49 K
So the GHE in Congo is about 10 K more than the Sahara (region that you use in your blog).
(for anyone interested here is the link I am using)
https://okulaer.wordpress.com/2014/11/16/the-greenhouse-effect-that-wasnt-part-2/comment-page-1/#comment-803
The thing Kristian points out that even with a much more pronounced GHE the Congo is a few degrees cooler. It would indicate the other processes have a much stronger effect on the actual surface temperature than just radiation and it certainly does not appear positive. More water vapor does seem to keep things cooler with evaporation. It does not appear that the latent heat when the water vapor condenses makes up for the loss from evaporation.
It seems a very complex beast and those who profess absolute certainty in either camp are probably the most wrong.
Norman,
From your link –
“More H2O in the atmospheric column will make the surface cooler. There are no empirical observations from the real Earth system supporting the notion of a net radiative surface warming effect of having H2O in the atmosphere above. The net effect is most certainly cooling.”
How amazing! Preventing sunlight from reaching a thermometer doesn’t make it hotter! Pardon the mild sarcasm – it was hard to resist. Bad form, I know.
As to certainty, I don’t board an aircraft if I am not certain it will not deliver me safely to my destination. I’m equally certain the GHE does not exist.
Cheers.
Mike Flynn
You use a simplistic one dimensional analysis of the situation and I am not impressed with any of your input. Kristian has done some extensive research on the topic. You read one book by Fenymann, do no further research, never look at links or try to engage in deep discussion of the material presented or the various possible conclusions one can draw from the material.
With CO2, it does not stop the vast majority of solar energy from reaching your thermometer. Others have shown you this many times. You ignore reality for your political agenda. You are here to recruit a few lazy and unscientific types to cult you belong to. You endlessly repeat the same points over and over thinking that they have more impact the more you hear your own words. This is a political tactic as Ball4 has pointed out. You do not care to learn anything. Throw out the name Fenymann (a brilliant physicist who has large respect in the science world) to give some type of pseudo credibility to the empty points you make.
I guess you have a mission as the evangelist of the dying cult. It seems empirical evidence, rational thought, textbook science will not lead you off your path of “righteous truth” because, after all, the Earth’s surface cooled rapidly from a molten state billions of years ago so you are certain your blind belief is True and nothing will change the small and limited mind you possess (mainly because you are too lazy to work to learn the material and it is far easier to repeat a million times the same things never questioning what you post, EVER!)
Norm, you struggle so hard to convince yourself you have a meaningful education. The “brilliant physicist” you mentioned spelled his name “Feynman”, not “Fenymann”.
And, you misspelled it twice!
Hilarious.
g*e*r*a*n
So misspelling a name is your evidence that someone lacks a degree in Chemistry and spent 4 years at a College? You have a most strange and irrational way of reaching conclusions. Why are you still responding to my posts? I do not like to communicate with you. You are a troll with nothing of value to contribute. If you wanted to correct a spelling error, fine. But to use as a means of some type of slam on my education means could you kindly quit posting comments about me?
You stated I was obsessed with you (I think you refer me to a “groupie”?), maybe looking in a mirror you would see you are talking about yourself.
Let it go, I don’t care about your opinions or thoughts.
Norm, I have the evidence of your lack of education. I’ve been laughing at you for over a year. (I even had to explain to you what a ”double negative” was!)
Yet, for some reason you are constantly trying to attack others’ knowledge of science. it’s like you believe you can bring them down to your level. You only continue to lower yourself.
if you don’t want any criticism, quit trying to fake it. Quit trying to fake that you understand thermodynamics when you say things like “energy does NOT leave the system, but energy leaves the system”. Quit trying to fake that you know who Richard Feynman was when you can’t even spell his name. Quit trying to fake you understand quantum physics when you believe ice can “slow the cooling” of warmer objects.
Do I need to go on?
Hilarious.
g*e*r*a*n
Please do not go on! You are troll and your posting offers nothing of value (except to other trolls who can learn from your unwanted taunts). I do like to visit this sight and post and interact with people. I do not want to or like to interact with you. Only doing it now to hope you can read and stop posting to me or about me. That would be too much to ask from you, I suppose.
If you don’t want my “constructive criticism”, then don’t mention me or respond to my comments. It’s that easy.
But, you can’t do it!
Norman,
May I point out that you provided the link. Blaming me for quoting information which you’ve provided, doesn’t seem terribly logical, does it?
Your link seems to support my conclusion (that additional GHG will make the surface cooler), and you then accuse me of never looking at links!
I’m not sure why you chose to provide a link which seems to contradict your GHE assertions. Even GHE supporters reluctantly ageee that the most important GHG is H2O.
Whether you are impressed with any of my input is irrelevant. Neither Nature, nor I, give a fig for your opinion. Say what you like, but you can’t even usefully describe the supposed GHE, let alone provide any empirical observations to support a surface warming effect. Your own link says so!
Maybe you could provide some facts to support your assertions? A useful description or definition of the non-existent GHE might be a good start. Subjective personal attacks on me won’t make your GHE any more real, will they?
No GHE. Not even a disprovable hypothesis relating to increased CO2 levels between the Sun and a thermometer on the surface causing the thermometer to become hotter. Nothing.
You may not wish to accept the fact that the Earth’s surface has cooled from a molten state to its present temperature, but it’s also not my fault that foolish Warmists such as Hansen, Schmidt, Mann, Trenberth etc., have overlooked the fairly obvious fact that the Earth is a large blob of slowly cooling, mainly molten, matter.
Launching ad hominem attacks at me is your choice. I decline to take offence, or feel any sort of annoyance, but if it makes you feel better, keep it up. Still no GHE, unfortunately.
Cheers.
Mike Flynn
Water is a complex player in radiant energy balance. Carbon Dioxide is not. It absorbs insignificant amount of solar IR and it absorbs about 18% of the IR emitted from the Earth’s surface. Your contention says nothing about GHG in general just specific with Carbon Dioxide.
What evidence do you provide to prove your point that Carbon Dioxide will not allow a thermometer to reach a warmer temperature under solar energy than an atmosphere without any Carbon Dioxide?
That is a question asked that you avoid and if I understand your motives, you will continue to ignore.
Norm asks, accusingly: “What evidence do you provide to prove your point that Carbon Dioxide will not allow a thermometer to reach a warmer temperature under solar energy than an atmosphere without any Carbon Dioxide?”
Norm, you can’t get away from your pseudoscience. You can’t break off from your addiction to CO2 is a “heat source”.
Maybe the answer to your question is that “energy does not leave the system, but energy leaves the system”.
Hilarious.
g*e*r*a*n
After realizing “heat” is a loaded word which creates too much conflict in its use I have chosen to use the language of Ball4. Carbon Dioxide that has some temperature will emit energy, it is an energy source. It will continue to emit energy until it reaches a temperature around absolute zero. I would not refer to Carbon Dioxide as a “heat” source as this will create loads of mindless debate over the meaning of the term “heat”.
Norm, you are lost in your pseudoscience. CO2 is NOT a “heat source”. A “heat source” brings NEW heat energy into a system. But your erroneous thinking, both the Arctic sea ice and all rain forests are going to “heat the planet”!
Hilarious.
g*e*r*a*n
Do you even read what is posted before launching a troll post?
Warm carbon dioxide gas is an energy source. Why did you not read what I wrote before trolling this blog?
Norm, you still don’t get it. How did the CO2 get “warm”.
(Sheeeeesh, it’s like talking to a fifth grader!)
g*e*r*a*n
I can respond to this post even though you had to throw in the taunt about a 5th grader. Why does it matter where the Carbon Dioxide got its energy from. The fact is it has this energy and will emit it until it cools to absolute zero.
Nothing you state or attempted to prove has demonstrated that warm CO2 is not an energy source.
Since you designed Coal Fired Power plants this one will work for you. You have a 1000 F water flowing in a steam pipe. With no insulation you will lose a vast amount of energy via radiation emission and lose efficiency. You then put insulation around the pipe and it loses very little energy.
You could also put a sleeve around it and it will still lose far less energy than with nothing around it. The pipe will heat up the sleeve. The sleeve will then start emitting radiant energy in all directions. Some of this energy will be directed at the hot pipe and the Net energy loss will then be less than a condition without the sleeve. The sleeve is heated by the hot pipe but it still acts to slow the energy loss.
norman…”Water is a complex player in radiant energy balance. Carbon Dioxide is not. It absorbs insignificant amount of solar IR and it absorbs about 18% of the IR emitted from the Earths surface”.
Prove that a gas comprising 4/100ths of 1% of the atmosphere can absorb 18% of the IR emitted from the surface. Your statement makes absolutely no scientific sense.
Your information sounds like a came from a climate modeler. They are not fussy about the source of their theories.
norman…”After realizing heat is a loaded word which creates too much conflict…”
Heat is not a loaded word, unless you are confused about basic thermodynamics. It has been defined over and over, going back to Clausius in the 1850s, as the energy associated with moving atoms.
If you disagree, why is that atoms/molecules of a gas move faster when their temperature is raised? Why do atoms in a solid metal lattice vibrate harder when the temperature is raised?
Temperature is an ambiguous word since it was invented by humans based on the boiling and freezing points of water. Temperature is a scale designed by humans to measure relative degrees of heat. The quantity being measured was defined a long time ago as heat.
Heat was first explored when people were boring the barrels of cannons. They noticed a strange substance that could not be defined but that it had the property of raising the warmth of water.
Further exploration revealed that heat is related to atoms. Specifically, when the boring bit cuts through the iron, or whatever, of the cannon barrel, it literally rips atomic bonds apart. There is something in those bonds that produces heat.
Further exploration still revealed the heat was coming from the electrons that made up atomic bonds. Quantum theory revealed that as electrons absorb energy and rise to a higher energy state that the atom gains more kinetic energy. That KE is the heat.
What else could it be?
Gordon Robertson
You are a waste of time. I have already provided links to all your questions, it gets old to link you to something to look at and then in the next few threads you act like I never took time to validate my claims.
One more time (not that it will mean anything).
Here look at this graph!!
http://fchart.com/ees/gas%20emittance.pdf
The partial pressure of Carbon Dioxide in air is 0.0004 from this site:
http://www.aqion.de/site/99
Multiply 0.0004 times 1000 meters (in this column the air temperature has only dropped 6.5 C). This will give you a path-length partial pressure number of 0.4. Use the graph and find 0.4 on the right side and follow the line toward the left to get an atmospheric emissivity for CO2 and it is close to 0.18. Put that emissivity into the Stefan-Boltzmann Law with the temperature of the average temperature of the atmosphere up to 1000 meters and it will show you how much Carbon Dioxide will emit.
Gordon Robertson
“heat” is a very loaded word on this blog. Just because you use it one way does not mean that is how everyone else is using it. That is why I am sticking to energy for my posts.
Heat has been defined as Net energy transfer between hot and colder objects.
I will leave heat out of the posts the best I can.
(Trying to explain a “thermodynamic heat source” to Norm.)
Norm: Why does it matter where the Carbon Dioxide got its energy from.
g: A “heat source” produces it’s own energy. A simple example is a match. Before striking the match, it is not producing energy. After striking, it converts chemical energy into heat energy. It is (temporarily) a “heat source”.
Norm: Nothing you state or attempted to prove has demonstrated that warm CO2 is not an energy source.
g: CO2 does NOT bring new heat energy into the system. QED
Here’s some local news from Vancouver, Canada, that might interest ren.
“According to Environment Canada’s weather station in Vancouver, it was the hottest May 28th on record in the city by a very slim margin with temperatures reaching 25.2 degrees on Sunday.
“The previous record was 25 degrees set back in 1934 so just snuck one record in there,” said Environment Canada Meteorologist Alyssa Charbonneau”.
http://www.msn.com/en-ca/news/other/vancouver-breaks-heat-record/ar-BBBDRFy?li=AAggNb9&ocid=mailsignout
The thing to note is not the alleged new record, it is the year of the previous record, 1934. That year is still known as the hottest year ever in the US, and apparently in parts of Canada as well.
How does an alarmist go about explaining such temperature extremes in the 1930s if we are setting alleged records today due to a build up of anthropogenic CO2?
Gordon
You do realize that 98% of the earth’s surface is not the United States, right?
Snape,
You do realise that 100% of Canada is not in the United States, right?
Cheers.
Mike…”You do realise that 100% of Canada is not in the United States, right?”
Glad you did not say America. We are both in America but the US claims it is America.
I’m as much an American as Donald Trump and I’m not even a US citizen.
https://answers.yahoo.com/question/index?qid=20120228073615AAsNXtZ
snape…”You do realize that 98% of the earths surface is not the United States”
Yeah…but most of the surface stations are located in the US.
My comment was not about global temperatures it was about a local record that had not been surpassed since 1934. I thought it too much of a coincidence since 1934 was the hottest year in US temperature history.
Gordon…
“How does an alarmist go about explaining such temperature extremes in the 1930s if we are setting alleged records today due to a build up of anthropogenic CO2?”
Sorry, Gordon, that’s actually a really good question. My comment about “98 percent” really missed the mark.
Anyway, I think the answer is “less than 1 C.” That’s the temperature difference between now and the 1930’s. If less than 1C. of extra heat is floating around in the atmosphere, why would we expect local temperature records to have changed very much?
Gordon Robertson
I’m sorry, but it will cool down again.
https://earth.nullschool.net/#2017/06/01/0900Z/wind/isobaric/700hPa/overlay=temp/orthographic=-106.03,44.31,1192
It will be even cooler in the east of Canada.
https://earth.nullschool.net/#2017/05/31/0900Z/wind/isobaric/850hPa/overlay=temp/orthographic=-65.49,49.85,1192
It is possible that snow will fall at night.
https://earth.nullschool.net/#2017/06/02/1200Z/wind/isobaric/850hPa/overlay=temp/orthographic=-68.66,48.79,1192
Look at the temperature of the Atlantic.
https://weather.gc.ca/saisons/animation_e.html?id=month&bc=sea
ren…”Gordon Robertson Im sorry, but it will cool down again.
No need to apologize, I prefer it cooler. There has been a high pressure area parked over us for several days and it appears to be moving on.
Gordon, it’s the temperature for one location, not a national (or even state) average. Having the previous warmest temp in 1934 in that location does not translate to Canada or the US.
You will find that the hottest record temps in various cities. around the US and Canada are in different years.
Now, to claim, in 2017, that the warmest year in the US was 1934, you need some dataset that you think is valid to corroborate that claim.
So which dataset are you referring to?
If your answer is “they’re all adjusted,” then there is no dataset to back up your claim. You’re claiming it based on old arguments from a few years back.
In the surface temp record 2012 is the warmest year. In the satellite data set (which starts only in late 1978) 2015 is the warmest year in the US.
So which data set shows 1934 as the hottest year to date?
Extremes for the year were well within the previous
records of -66′ (February 1933) and 134′ (July 1913).
The lowest reported was -52′ at Stillwater, N. Y., on
February 9, with -51′ noted at Vanderbilt, Mich., on
the same date. All but 7 States had minima of zero or
below, and in 27 States the minima were -20′ or lower.
The highest masimum reported was 125′ at Greenland
Ranch, Cdif., on several days in July; Quartzsite, Ariz.,
had 124′ on July 11. With the exception of Maine, New
Hampshire, Vermont, and Rhode Island, all States had
maxima of 100′ or higher; in 12 States they exceeded 115′.
The summer of 1934 was by far the hottest of climatological
history in a large midwestern area; at many
points the escess was nearly double that of the previous
record. At Columbia, Mo., and Oklahoma City, Okla.,
the average July masimum was loo’, and at Topeka,
Iians., and Fort Smit’h, Ark., 102′. From June to August,
inclusive, Des Moines, Iowa, had 22 days with masimum
temperature of 100′ or hi her; Columbia, Mo., 34;
Topeka, Kans., 47; Oklahoma 6 ity, Okla., 47; and Fort
Smith, Ark., 53. The accumulated departures for the
year at several outstanding stations were: Amarillo,
Terr., 1,860′; Sheridan, Wyo., 1,983′; North Platte,
Nebr., 2,099′; Miles City, Mont., 2,068′; Huron, S.
Dak., 2,042′; and Pocatello, Idaho, 2,168′. Despite the
hot weather of the summer, 13 States had minima of 32′
or lower in July, and 20 States had such minima in
August . Table 1 shows that for the United States as a whole
every month was warmer than normal, with the largest
departures in January, May, and November.
https://docs.lib.noaa.gov/rescue/mwr/062/mwr-062-12-0455b.pdf
It must have been a very high-pressure summer.
http://pics.tinypic.pl/i/00905/b9az8mg9ctz2.png
Comparison of solar activity before and after 1935.
http://files.tinypic.pl/i/00905/t7wx9ec74msb.png
barry…the 1934 temperature comes courtesy NASA GISS. They tried to revise it but Steve McIntyre at climateaudit caught them and forced them to re-instate 1934.
Until a few years ago, GISS actually rated 1934 as the hottest year in the US. GISS gets their data from NOAA.
https://climateaudit.org/2007/08/08/a-new-leaderboard-at-the-us-open/
Of course, since then, NOAA and their scientific misconduct has used climate models to rewrite the records.
I did not really care about the relationship between our record in Vancouver as related to the 1934 record. It just seemed too coincidental to ignore.
Greg G says:
May 30, 2017 at 5:57 am
ren: I see your point about the volcano up in the Aleutian Islands.
During approximately the same time period of high Kp Index from coronal hole winds, the British Airways power supply surge occurred and the Bogoslof volcano blew. I checked it out and the two locations are on opposite sides of the North Pole at about the same latitude, so the high Kp could have triggered both events.
http://i1281.photobucket.com/albums/a504/nrgxprt/high%20coronal%20wind_zpsqo8t4rxh.jpg
https://tallbloke.wordpress.com/2017/05/29/british-airways-blames-power-surge-for-it-meltdown-travel-chaos/
Was thinking about the water pressure discussion. The cross-sectional area is irrelevant to the depth/pressure ratio (which for me is counter-intuitive).
So if inputs into a broad lake increased by 5%, the level of the lake would rise for a long time before the outflow equilibrated with inflow.
That’s the point I was making re a certain annual DOE figure of proportion anthro CO2 to total.
The annual figure is a snapshot that can’t possibly represent the increase over time. (Unless sinks respond instantly to equilibrate to the increased input, which they clearly don’t).
You cannot get around it. Once the level has risen 10%, the pressure at the outlet has increased 10%, the outflow has increased 10%, equilibrium has been reestablished, and the rise ceases.
You can imagine anything in your head. That is why mathematics is indispensable to science, and the ultimate discernment of truth.
Outflow is proportional to pressure:
O ~ P
Pressure is proportional to height:
P = density*g*height
At equilibrium, inflow is equal to outflow
I = O
If inflow increases 10%, at equilibrium, O increases by 10%. Since O ~ P, P increases by 10%, and since P ~ height, height increases by 10%.
Bart
Barry is not trying “to get around it”.
He acknowledged you are correct when he wrote, “The cross-sectional area is irrelevant to the depth/pressure ratio (which for me is counter-intuitive).
I think what he is saying is that “the cross-sectional area” is not irrelevant to the time it takes for a new equilibrium to be reached.
Bart
Think of a bucket, 1 foot wide and 1 foot tall. Now poke a hole in the bottom and start filling it with water from a hose. Adjust the rate of inflow until an equilibrium is reached with the bucket half full.
Now do the same with a broad bucket: 5 f