
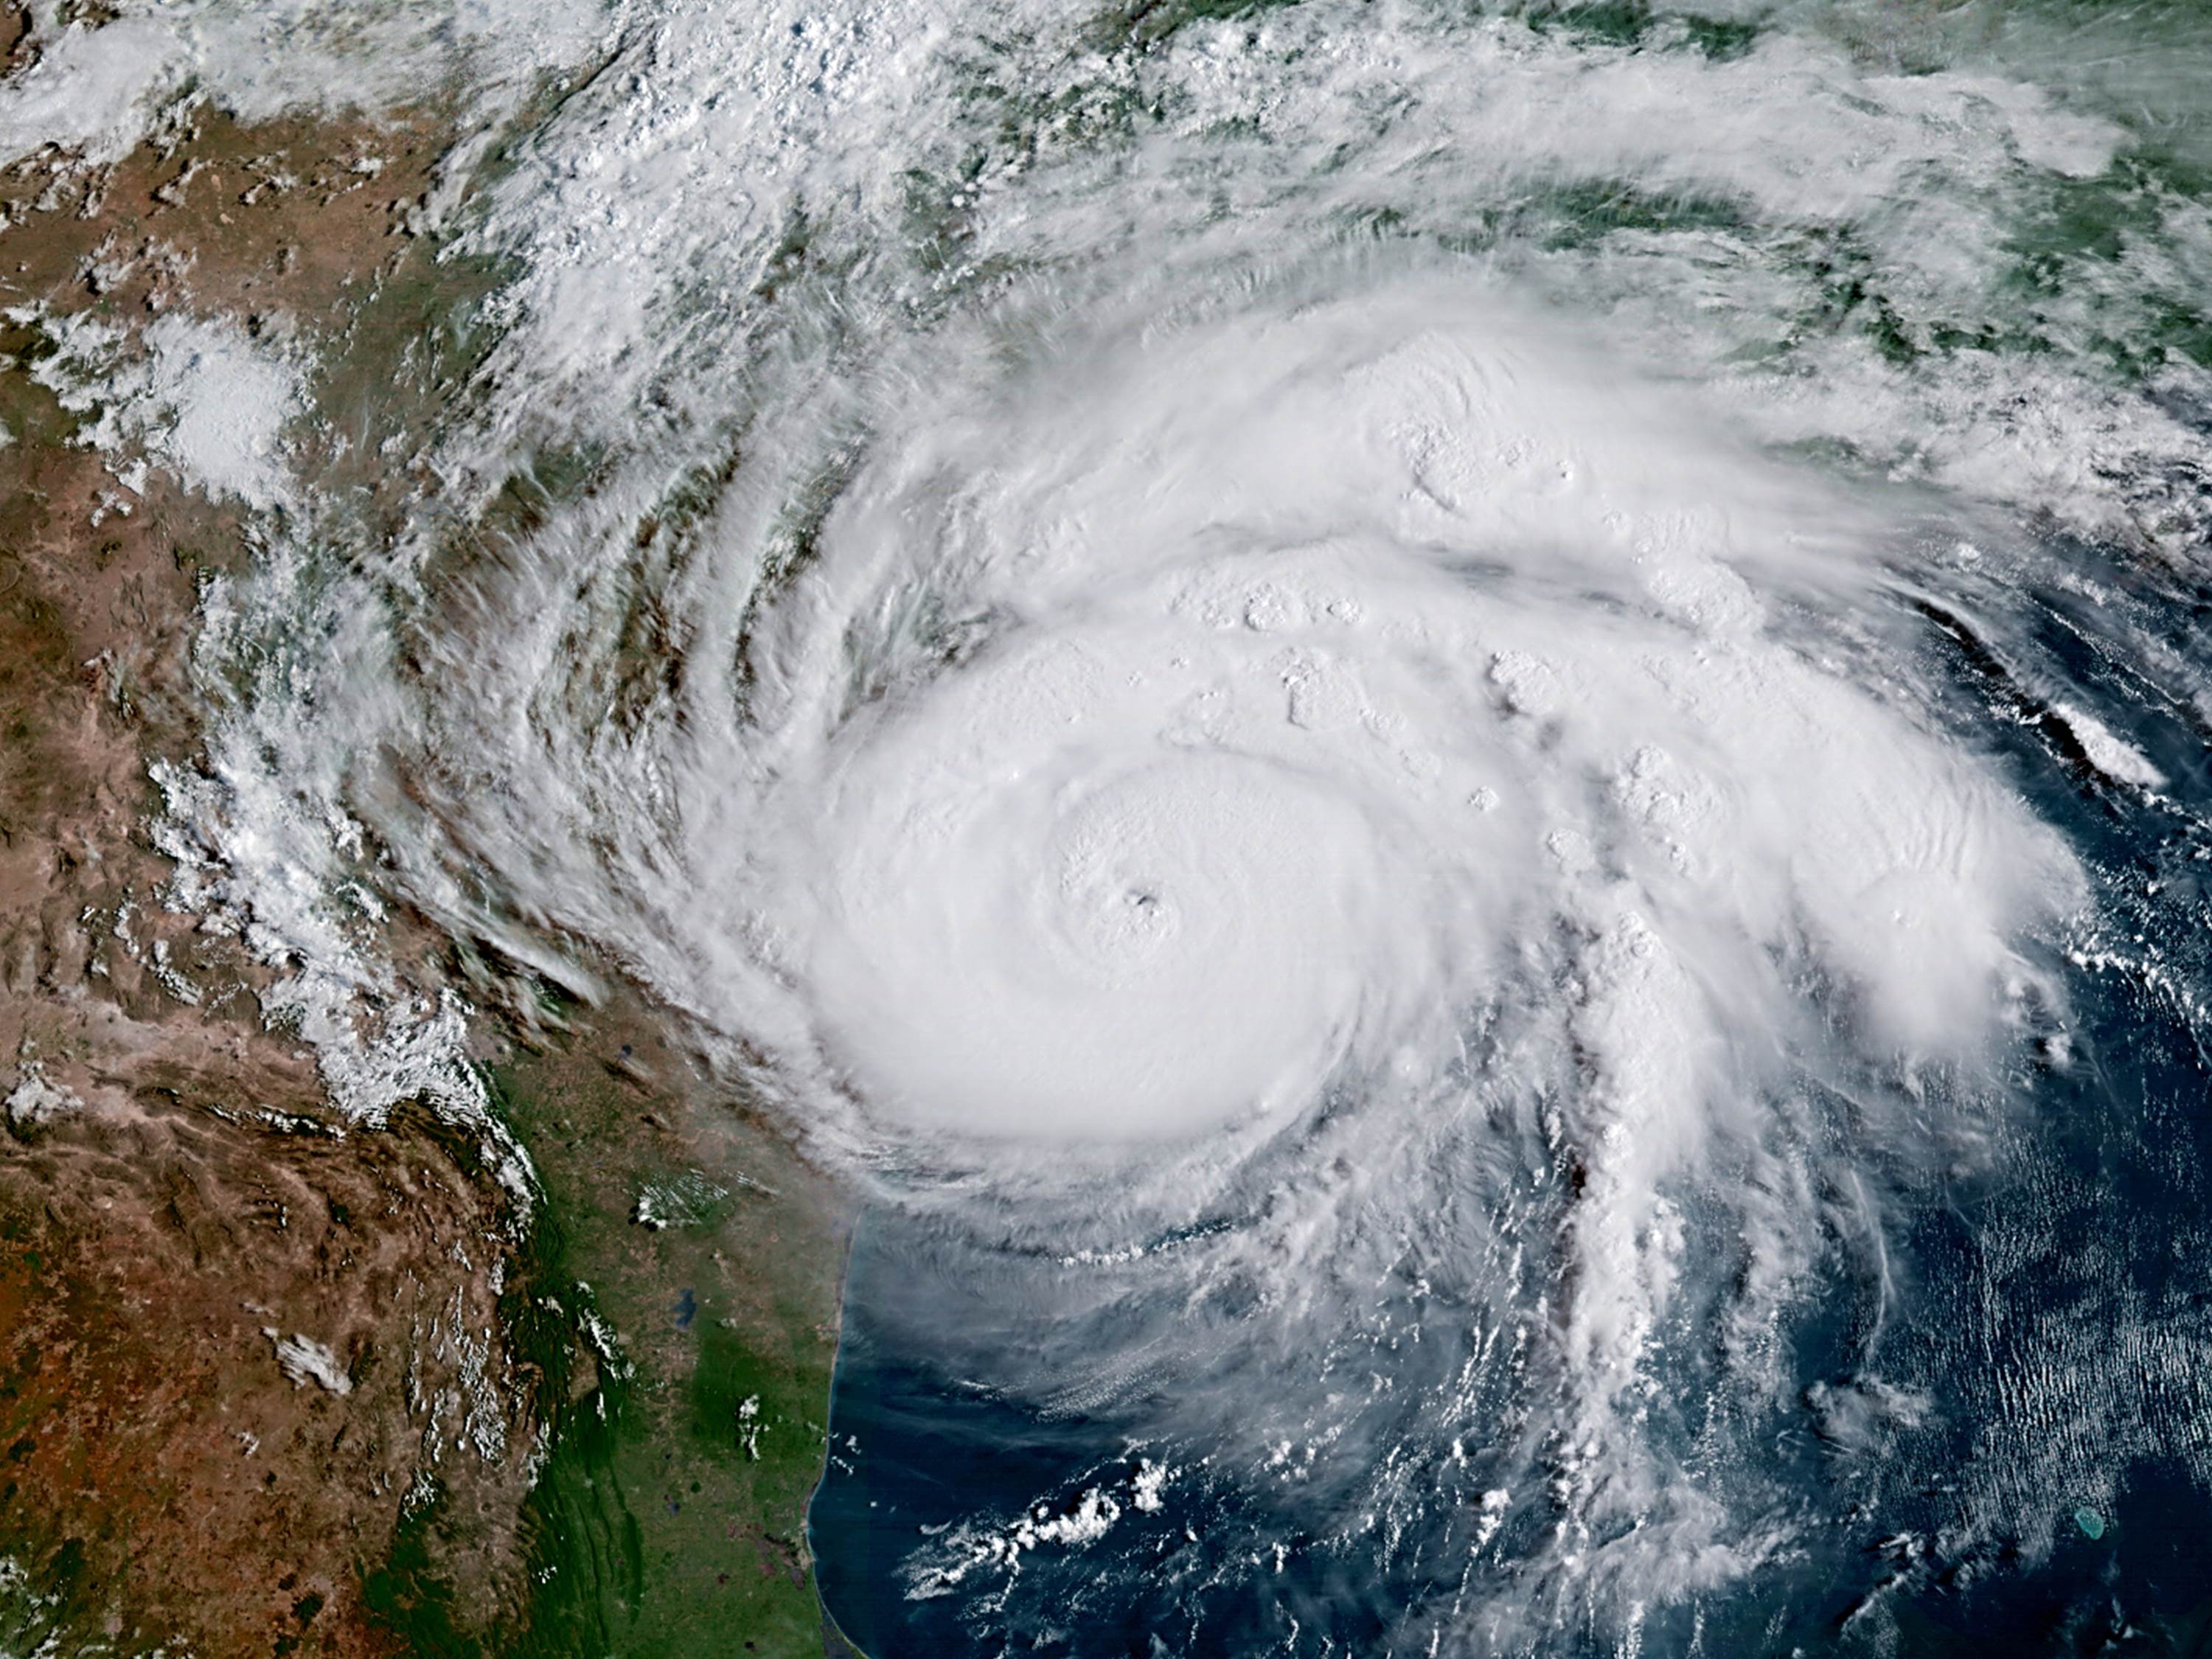
Hurricane Harvey off the east coast of Texas at 9:30 a.m. CDT August 25, 2017, as seen by the new GOES-16 satellite (CIRA/CSU processing).
Mother Nature routinely deals with huge amounts of energy. In the case of hurricanes, some of the solar energy stored in the upper ocean is rapidly removed by strong winds in the form of evaporated water vapor, which then feeds the hurricane as the vapor condenses into rain and the “latent heat of condensation” is released.
That heating causes the warm core of the hurricane, creating the “eye” and producing the strong winds circling the eye. The rain itself falls back to the surface, and in the coming week eastern Texas will no doubt be dealing with one of the worst flooding disasters on record with 1 to 3 feet of rain.
The amount of energy released in such a storm is staggering. It can be computed that the average hurricane releases the energy equivalent of 10 Hiroshima-class bombs every second.
That’s approximately 1 million atomic bombs per day. Given Harvey’s size and intensity, I suspect the real number is even larger.
As the above image shows, nature can be beautiful and dangerous at the same time.
The jet stream in the tropopause.
https://earth.nullschool.net/#current/wind/isobaric/250hPa/orthographic=-91.35,27.07,2274
That hurricane isn’t real.
We should all meet in Corpus Christi to show the world we don’t trust NOAA data.
Your logic is real, real bad. I hope that is a joke.
https://en.m.wikipedia.org/wiki/False_equivalence
Mickey was making a joke. Whoosh!
DA…”Mickey was making a joke. Whoosh!”
NOAA scientific misconduct is no joke.
As usual, Appell defending alarmists, no matter how absurd and bizarre their claims.
You don’t see many other disciplines defending their accuracy by saying, well you trust climate models so therefore we are right.
Laura, for your own benefit, you should try to lose your obsession with me.
mickey…”That hurricane isnt real. We should all meet in Corpus Christi to show the world we dont trust NOAA data”.
The data that cannot be trusted is not in real time as is the hurricane. Live in your denial and pseudo-science, I won’t lose sleep over it.
NOAA is being slammed for taking real data, discarding 75% of the data and synthesizing the discarded 75% in a climate model. That is scientific misconduct.
Obviously you can’t tell the difference. NOAA cannot apply that smoke and mirrors pseudo-science to a hurricane, otherwise they would. There’s no way to fudge the power of a hurricane or blame a hurricane on humans. The alarmists sure try, however.
How are the forest fires going there in BC?
Or are they fake news put out by NOAA?
dr no…”How are the forest fires going there in BC?
Or are they fake news put out by NOAA?”
Your inference is that forest fires are caused by climate change. We had just as serious a forest fire issue in 1958 and it seems to me that was a year of cooling.
But Gordon, NOAA data agrees with all the other major temperature records, did the misconduct have no effect?
Exactly Svante! NOAA’s record is for land+ocean the ‘second coolest’ behind the Japanese JMA.
svante…”But Gordon, NOAA data agrees with all the other major temperature records, did the misconduct have no effect?”
Wrong, Svante. NOAA and all the other agencies agreed originally there was no warming between 1998 and 2012, as reported by the IPCC and corroborated by UAH.
The new NOAA temperature history shows a warming trend in that range whereas they had hitherto reported no trend. They fudged the existing data statistically, especially the SST, to manufacture a warming trend.
NOAA claim of recent years as successive record warming years was conjured by manipulating confidence levels. Why confidence levels, as asked by DA? Because NOAA now manufactures temperatures using statistical interpolation and homogenization and that requires a confidence level.
Had NOAA used a 90 or 95% confidence level, as would a reputable scientific organization, that would have been fine. However, NOAA used a 48% confidence level and if you can explain that away scientifically you are as crooked as NOAA.
In steps NASA GISS who use NOAA fudged data. They fudge it even further using confidence levels in the 30 percentile range.
Robertson on August 25, 2017 at 9:59 PM
NOAA is being slammed for taking real data, discarding 75% of the data and synthesizing the discarded 75% in a climate model. That is scientific misconduct.
One day, liars like you hopefully will be prosecuted for having propagated such nonsense behind their fake names.
‘Bindidon’ of course is no real name as well. But the difference between us, Robertson, is that I never and never would discredit the work of other persons like you do so cowardly all the time.
bindidon…”One day, liars like you hopefully will be prosecuted for having propagated such nonsense behind their fake names”.
I was going to advance you from an idiot to an imbecile but after this statement you’ll have to remain at the bottom end of the IQ scale. I posted a link to the NOAA site where they admitted to slashing the surface station database globally from 6000 stations to under 1500. I was being generous by only claiming a slash of 75%.
The fact that you won’t discredit NOAA after they admit openly to scientific chicanery proves you are an idiot.
What was the effect on published temperature anomalies by reducing number of stations from 6000 to 1500?
Could NOAA afford to be keeping 6000 stations open? Budgets get cut, and the vast majority of these stations aren’t in the U.S. What to do when other nations stop or move their temperature stations?
Gordon Robertson says:
“NOAA is being slammed for taking real data, discarding 75% of the data and synthesizing the discarded 75% in a climate model. That is scientific misconduct.”
How do you feel about UAH’s adjustments?
Joe Bastardi believes that a couple of storms have been named this year that would not have been named 10 years ago.
Trust the observations … real beats the hell out of NOAA’s pseudo science synthetic data.
“Thorough, not thoroughly fabricated: The truth about global temperature data: How thermometer and satellite data is adjusted and why it *must* be done,” Scott K Johnson, Ars Technica 1/21/16.
http://arstechnica.com/science/2016/01/thorough-not-thoroughly-fabricated-the-truth-about-global-temperature-data/
@mickey
Nobody knew how to use a thermometer in 1940, so we should remove the blip via secret e-mails and demonize CO2 to radically transform the world economy through an unelected governing body.
Just as absurdly funny as your if->then logic joke on going to Corpus Christi accept governments are actually following through on this insanity.
“Except”
How would you compare temperatures taken by a 1910-1970 mercury thermometer at 2 pm to an temperature sensor over 1971-present at 12 pm? Same location.
Predicted location of low on August 30th.
https://earth.nullschool.net/#2017/08/30/1200Z/wind/isobaric/850hPa/overlay=mean_sea_level_pressure/orthographic=-96.71,26.65,2274
What do you think the hurricane strength will be at landfall? Is the streak broken?
“releases the energy” – how? It does not get radiated into space.
“released” energy refers to condensation, when water vapor condenses into cloud, rain, ice. It’s the primary source of energy for a hurricane. But then, yes, the extra energy eventually is radiated to space, but it’s not much differenct from what would be radiated to space without the storm. Maybe even less, due to the high cloud tops.
With all that predicted rainfall, the amount of latent heat released by condensation must be enormous. That energy does not disappear. What happens to it? Does it power hurricane winds? Or anything else?
But, pseudoscience teaches the energy is “trapped”. How can energy be both radiated to space, yet trapped?
It’s so confusing.
☺
The net energy change is zero.
Condensation of the water vapor can take place only if something cools it. In present instance it’s the contact with cold air at higher altitudes thats provides the coolant fluid and by the way necessarily the cold air in question gets heated up itself and so takes up the released latent heat. It’s quite similar to what happens with the heat release at the cold sink in a power plant, except that it is then rather a river (for instance) that absorbs the heat .
In the hurricane as in convection cells in general the heat released is then radiated to space if high enough and/or is further transported to even higher altitudes by radiation and further convection and then eventually radiated to space. The heating by the latent heat release precisely favors such processes.
What feeds or powers the hurricane winds instead is the total amount of heat it absorbs at the ocean surface which is the hot source of the thermal engine the hurricane actually constitutes. Only a part of that heat is converted into mechanical energy and the remainder as described above “lost” to deep space. Exactly as only part of the heat absorbed by a power plant can be converted to electricity.
I thought that hurricanes are one mechanism that nature uses to try to remove excess heat and that upper level winds carry that excess heat poleward to try to balance temperatures.
mike mcnichol…”I thought that hurricanes are one mechanism that nature uses to try to remove excess heat and that upper level winds carry that excess heat poleward to try to balance temperatures”.
That’s what Lindzen claims but what would he know? He’s only an MIT professor who is highly acclaimed in the field of atmospheric physics.
Lindzen has had a succession of wrong ideas. Worthy ideas, but wrong.
And he’s just one scientist, not god.
“Scientists estimate that a tropical cyclone releases heat energy at the rate of 50 to 200 exajoules (1018 J) per day, equivalent to about 1 PW (1015 watt). This rate of energy release is equivalent to 70 times the world energy consumption of humans and 200 times the worldwide electrical generating capacity, or to exploding a 10-megaton nuclear bomb every 20 minutes.”
“A tropical cyclone may be viewed as a heat engine that converts input heat energy from the surface into mechanical energy that can be used to do mechanical work against surface friction. At equilibrium, the rate of net energy production in the system must equal the rate of energy loss due to frictional dissipation at the surface.”
https://en.wikipedia.org/wiki/Tropical_cyclone
I know where I would rather be when comparing Hurricanes to Nuclear bombs.
Give me the Hurricane every time.
Harvey just went CAT III.
AGW’s energy imbalance of 0.7 W/m2 is equivalent to 500,000 Hiroshima bombs a day.
*EVERY* day.
sure DAVE
Do the calculation, Salvatore.
Let us know what you get.
Mr Appell is correct. I was surprised to see Dr Spencer use this lame metric. I think he meant it as a joke.
The .7 W/m2 is what those who believe in AGW say. Bogus.
It’s what the science says:
“Improving estimates of Earths energy imbalance”
Johnson, G.C., J.M. Lyman, and N.G. Loeb
Nature Clim. Change, 6, 639640, doi: 10.1038/nclimate3043 (2016)
http://www.nature.com/nclimate/journal/v6/n7/full/nclimate3043.html
Salvatore is correct David. The claimed imbalance of 0.7 W/m2 is just a construct of Alarmists used to argue that CO2 is warming the atmosphere.
Such numbers are ludicrous because there are far greater imbalances that we do not know to that precision and will react to presumed warming by CO2. Those are called “feedbacks” David.
For instance, we cannot model cloud cover sufficiently accurately to see an effect of 0.7 W/m2. Similarly, we cannot model ocean effects to that precision. And then there are the effects of our elliptical orbit about the Sun that put about 80 W/m2 more solar energy into the Earth in January than July.
This planet is never in complete equilibrium, as Alarmists presume.
Gordon J. Fulks, PhD on August 26, 2017 at 2:06 PM
For instance, we cannot model cloud cover sufficiently accurately to see an effect of 0.7 W/m2. Similarly, we cannot model ocean effects to that precision.
To you too, Mr PhD, I ask: what about bringing us a scientifically convincing falsification of e.g.
Improved estimates of ocean heat content from 1960 to 2015
Lijing Cheng, Kevin E. Trenberth, John Fasullo, Tim Boyer, John Abraham, Jiang Zhu
Science Advances Vol 3, No. 3
01 March 2017
http://advances.sciencemag.org/content/3/3/e1601545/tab-pdf
instead of replying with so simplicistic ‘arguments’ ?
bindidon…”Lijing Cheng, Kevin E. Trenberth, John Fasullo, Tim Boyer, John Abraham, Jiang Zhu”
Trenberth??? Heard that name before.
Oh, yeah, he was caught in the Climategate email scandal claiming global warming has stopped and that it’s a travesty no one can explain why. Trenberth later offered the pseudo-science that the missing warming is being stored in the oceans.
His buddy, Phil Jones of CRU, bragged that he and Kevin would see to it that certain skeptical papers (including one from Dr. John Christy of UAH) would not make it to the IPCC review.
Jones is a Coordinating Lead Author on IPCC reviews and Kevin Trenberth is a CLA with whom Jones is partnered. They have the clout to banish legitimate scientific papers from IPCC reviews. It was not an idle boast.
So you want us to accept that a paper co-authored by Trenberth is legit?
Gordon J. Fulks, PhD says:
“The claimed imbalance of 0.7 W/m2 is just a construct of Alarmists used to argue that CO2 is warming the atmosphere.”
Wrong — it’s a measured number.
“For instance, we cannot model cloud cover sufficiently accurately to see an effect of 0.7 W/m2.”
Again wrong — the energy imbalance is measured, not calculated via a climate model.
Read the paper for a change!!
Improving estimates of Earths energy imbalance
Johnson, G.C., J.M. Lyman, and N.G. Loeb
Nature Clim. Change, 6, 639640, doi: 10.1038/nclimate3043 (2016)
http://www.nature.com/nclimate/journal/v6/n7/full/nclimate3043.html
Bindion: How about reading and understanding papers before you criticize me?
The time periods of the two papers (Johnson et al and Cheng et al) are different. So of course they come up with different energy imbalances for their respective time periods.
Scientists really do know what they’re doing.
Davie, maybe you are the only one with an “imbalance”?
Hi David,
Can you please link the “peer reviewed study” for which you base this claim upon. Thank you in advance.
Randy: Multiply the global energy imbalance by the Earth’s surface area, then times the length of the day, divided by the energy of the Hiroshima bomb (63 TJ). Trivial.
Let us know what you get.
Davie, this is a good time for you to link to your favorite pseudoscience paper. You know, the one that claims the Sun can heat the Earth to 800,000K.
That one is a classic!
I see now you can’t do either of these trivial calculations.
You simply don’t have what it takes.
“Trivial” is the right word for you, Davie.
At least we agree on something….
It is classic, we resolved it here remember:
http://www.drroyspencer.com/2017/07/uah-global-temperature-update-for-june-2017-0-21-deg-c/#comment-253922
Thanks Svante. Nice.
Svante still confuses temperature with heat capacity.
Clearly Svante did not.
The alleged energy imbalance cannot even be measured. That 0.7 is just a phony figure the computer models spit out.
“Improving estimates of Earths energy imbalance,”
Johnson, G.C., J.M. Lyman, and N.G. Loeb
Nature Clim. Change, 6, 639640, doi: 10.1038/nclimate3043 (2016)
http://www.nature.com/nclimate/journal/v6/n7/full/nclimate3043.html
This diagram quantifies the energy imbalance and the incertitude on it too. Result 0.6+- 17W/m2. Or, said otherwise, somewhere between -16.4 and 17.6 W/m2.
https://curryja.files.wordpress.com/2012/11/stephens2.gif
Note that the authors tried to reduce uncertainties. If you just add the uncertainties on the separated components it would reach +-40W/m2. Quite a lot compared to the 0.7W/m2 resulting imbalance isn’t it?
Paul,
0.6 +/-17 at the surface looks weird, I don’t suppose they measured that. What is the scientific source?
The TOA imbalance is 0.6 +/-0.4, so the earth as a whole must warm. That’s consistent with Davids source.
Paul Aubrin on August 25, 2017 at 11:34 PM
This diagram quantifies the energy imbalance and the incertitude on it too. Result 0.6+- 17W/m2. Or, said otherwise, somewhere between -16.4 and 17.6 W/m2.
https://curryja.files.wordpress.com/2012/11/stephens2.gif
Thanks for this highly valuable info, Mr Aubrin.
No more than a simplicistic chart dated 2012? Without any reference to the enclosed guest post at Curry’s ‘Climate etc’ web site?
Are you serious?
What about you bringing us a scientifically convincing falsification of e.g.
Improved estimates of ocean heat content from 1960 to 2015
Lijing Cheng, Kevin E. Trenberth, John Fasullo, Tim Boyer, John Abraham, Jiang Zhu1
Science Advances Vol 3, No. 3
01 March 2017
http://advances.sciencemag.org/content/3/3/e1601545/tab-pdf
That would be helpful.
— Paul Aubrin says:
August 25, 2017 at 11:34 PM
This diagram quantifies the energy imbalance and the incertitude on it too. Result 0.6+- 17W/m2. Or, said otherwise, somewhere between -16.4 and 17.6 W/m2.
https://curryja.files.wordpress.com/2012/11/stephens2.gif
Note that the authors tried to reduce uncertainties. If you just add the uncertainties on the separated components it would reach +-40W/m2. Quite a lot compared to the 0.7W/m2 resulting imbalance isnt it?–
The idea that the receives equal an uniform amount of sunlight is, of course, wrong.
But you added the 40W/m2 to amount sunlight absorbed by the tropical oceans, it would be closer.
Or at TOA in tropics receives about 50% of the sunlight and it’s 40% of entire surface area.
And clear sky at zenith has about 1050 watts of direct sunlight and if the indirect sunlight is included the total
is 1120 watts. Leaving 1360 – 1120 = 240 watts of sunlight not reaching the surface.
And the ocean absorbs the energy of both direct and indirect sunlight and this shortwave radiation is not absorbed in the “skin” surface of the ocean but rather most is absorbed in top meter or two of the surface waters.
As result of having more sunlight and the tropical oceans absorbing much more sunlight than the rest of the world, the tropical ocean is Earth’s heat engine.
Paul, that link says, on the top of the page, the TOA energy imbalance is 0.6 0.4 W/m2. You quoted the surface imbalance, which is different.
The newer number from Johnson et al is 0.71 0.10 W/m2 from 2005 to 2015.
At least read the paper’s abstract.
The +/- symbols didn’t come out in my comment.
TOA energy imbalance: 0.6 +/- 0.4 W/m2
Argo and CERES agree:
“This striking agreement between two
completely independent measures of EEI
variability bolsters confidence in both”.
https://tinyurl.com/yahwthv7
Horse manure. The CERES energy imbalance measurement is 3.4 W/m2, as stated in this latest CERES Data Quality Summary:
https://ceres.larc.nasa.gov/documents/DQ_summaries/CERES_EBAF_Ed2.8_DQS.pdf
ARGO and CERES do not agree.
Here is a direct quote from the CERES Data Quality Summary paper:
“With the most recent CERES Edition3 Instrument calibration improvements, the SYN1deg_Edition3 net imbalance is ~3.4 W m-2, much larger than the expected observed ocean heating rate ~0.58 W m-2 (Loeb et al. 2012a). This imbalance is problematic in applications that use Earth Radiation Budget (ERB) data for climate model evaluation, estimations of the Earth’s annual global mean
energy budget, and studies that infer meridional heat transports.”
CORRECTION: There is a newer CERES Data Quality Summary: Edition 4.0. (March 7, 2017)
From the above document:
“With the most recent CERES Edition4 Instrument calibration improvements, the SYN1deg_Edition4 net imbalance is ~4.3 W m-2
, much larger than the expected observed ocean heating rate ~0.71 W
m-2 (Johnson et al. 2016). This imbalance is problematic in applications that use Earth Radiation Budget (ERB) data for climate model evaluation, estimations of the Earth’s annual global mean energy budget, and studies that infer meridional heat transports.”
Furthermore, over 10% of the ocean is not covered by ARGO, so how can they measure the imbalance that accurately????
SkW: Thanks for that. What’s the uncertainty on CERES’ number?
Thanks,
It seems the CERES absolute error is about 4.2 Wm−2, but variations are within +/- 0.1 Wm−2, so measurements have to be anchored.
Once aligned there is good agreement with Argo.
See conclusions here: https://tinyurl.com/y9px5yx7.
Can 10% alter the trends much?
Excuse my naivete, but was is “evaporated” water vapor? I was under the impression water can evaporate as a liquid or sublimate from a solid to become a gas, then it’s water vapor.
It seems that this energy is enough for at least a week.
The Gulf of Mexico will be exposed to solar radiation and evaporation will be intense.
http://www.weatherplaza.com/en-US/sat/?region=southeast.ir
From a total atmospheric energy perspective, if one Cat III hurricane releases in excess of the energy from 100 million 15kt nukes a day for a week, is there some method to calculate how much CO2 would have to be removed to “counter” that effect…?? IF that calculation is doable, my gut feel is that the result will not make the AGW mob happy.
Jimbo says:
“From a total atmospheric energy perspective, if one Cat III hurricane releases in excess of the energy from 100 million 15kt nukes a day for a week”
It’s 1 million Hiroshima bombs a day, as Roy wrote, not “100 million.”
Manmade global warming now puts this much extra energy into Earth every 2 days.
Davie, the atmosphere sheds all excess heat energy, even your fake AGW.
It’s getting harder and harder to promote the hoax, huh?
But, we love your humor.
The Earth “sheds” its heat by warming up, thereby radiating more. But this takes thousands of years to happen. Until then there is an energy imbalance:
Improving estimates of Earths energy imbalance
Johnson, G.C., J.M. Lyman, and N.G. Loeb
Nature Clim. Change, 6, 639640, doi: 10.1038/nclimate3043 (2016)
Wrong!
It does not take “thousands of years to happen”. It happens constantly.
“The Long Thaw: How Humans Are Changing the Next 100,000 Years of Earth’s Climate,” David Archer (University of Chicago), 2008.
http://press.princeton.edu/titles/10727.html
David Appell is the Gulf of Mexico these tropics or not?
David, you mean the carbon spike, not the energy imbalance?
The latter is being fixed quickly now.
DA…”The Earth sheds its heat by warming up…”
You need to stop reading controversial Google articles.
The Earth is a mass and any mass will radiate energy that reduces it’s heat content if there is a temperature differential between the mass and its surroundings.
The heat in a mass is dependent on the energy levels at which the electrons in the atoms constituting the mass reside. As an electron at the Earth’s surface temperature drops to a lower energy level it emits a photon of IR. As the electron emits IR it drops it’s energy level and the atom cools.
That process happens instantaneously. No heat is shed, which suggests heat is radiated into space.
Gordon Robertson says:
“The heat in a mass is dependent on the energy levels at which the electrons in the atoms constituting the mass reside. As an electron at the Earths surface temperature drops to a lower energy level it emits a photon of IR. As the electron emits IR it drops its energy level and the atom cools. That process happens instantaneously.”
Almost all the extra heat being trapped is stored in the ocean. Circulation takes it into the deep ocean; that circulation takes about 1500 years to complete. Only at the surface does it have a chance to get into the atmosphere.
The extra heat being added today will last for many thousands of years.
Svante says:
“David, you mean the carbon spike, not the energy imbalance?”
There will be more carbon in the atmosphere 100,000 years from now because of the CO2 we’re emitting today. So the planet will be warmer, too. But yes, the energy imbalance won’t last that long.
There is no man made global warming David , and that point is going to be proven to you very soon.
AGW theory is wrong .
You should go to JUDY CURRY’S site to see all the wrong predictions AGW theory has come up with thus far.
Salvatore, who do you you are convincing by writing this? Precisely no one, that’s who. It may make you feel better emotionally for a few moments, but it is completely absent of logic, science and rationality.
“…completely absent of logic, science and rationality.”
800,000K, Davie.
dQ = mc dT. Solve for dT. Plug in the values.
If you can’t do that much you’re pitiful.
Davey, the maximum temperature achievable by condensing sunlight is the surface temperature of the Sun, 5,800K. It doesn’t matter how much larger you make the condensing system. The photons do not have the ability to upgrade to those from a hotter object. The photoelectric effect tells us this as well. An infinite number of low grade photons will not eject an electron if below threshold.
Likewise, the proposed in vacuo radiative potential from a cloud at 275K observed at the surface cannot be focussed or condensed to heat beyond 275K. It doesn’t matter how large a condensing system is made to focus the radiative potential upon a point. An tiny object at 280K placed at the focus, would lose heat and cool to the sky despite our heads telling us that the net flow of photons by number is ‘sky to object’. Downwelling radiative potential is unavailable for work or power where availability of work or power is a matter defined by entropy and spontaneous process acting to reduce potentials.
Energy budget models display a complete disregard for reality in rendering the Sun cold and introducing a constant downwelling radiance from the cooler sky at twice the solar power at the surface. I repeat, this downwelling radiance is unavailable for work or power and comparison with sunlight which spontaneously downgrades into a 300K environment is stupid.
Interesting that you introduced.
dQ= m.c. dT
We could add that for a body of gas in a gravity field,
dQ=(m.Cp.dT)+(m.g.dh)
Which gives,
dT/dh, the vertical thermal gradient is,
dT/dh=-g/Cp which is a maximum entropy profile for a dry air condition for a gravitationally bound gaseous envelope with no net heating (dQ=0). Higher points have greater potential energy and lower points have greater kinetic energy whose measure is temperature. LTE acts to achieve this at all adjacent points.
With the addition of the mentioned latent heat transfer by moist convection this describes correctly (as in supported by data, Davey) the tropospheric thermal gradient on Earth. WITHOUT INCLUDING LONG WAVE HEAT TRANSFER. The latter then must be rendered an environmental product, placing grave doubts upon the 0.7W/m2 downwelling, unavailable for work or power mythical imbalance you ‘believe’ to exist.
Thank you, Geoff!
Unfortunately Davie doesn’t understand physics.
Geoff Wood says: August 26, 2017 at 2:00 AM
The photons do not have the ability to upgrade to those from a hotter object. The photoelectric effect tells us this as well. An infinite number of low grade photons will not eject an electron if below threshold.
Likewise, the proposed in vacuo radiative potential from a cloud at 275K observed at the surface cannot be focussed or condensed to heat beyond 275K. It doesnt matter how large a condensing system is made to focus the radiative potential upon a point. An tiny object at 280K placed at the focus, would lose heat and cool to the sky despite our heads telling us that the net flow of photons by number is sky to object. Downwelling radiative potential is unavailable for work or power where availability of work or power is a matter defined by entropy and spontaneous process acting to reduce potentials.
———————
Geoff would you care o tell me how a laser cutter works – a standard beam of 0.8u photons seem to be able to cut would plastic and with enough energy input metal at 1000sof deg C
that should have been 8um not 0,8um
The smallest amount of energy (i.e. one quantum) that an object can absorb from IR light with a wavelength of 8m
Energy quantum = hν
h is known as “Planck’s constant”, and has a value of 6.63 x 10^-34 Joule seconds (Js)
so we need to know the frequency ν
νλ= c
ν = c/λ
ν = (3.00 x 10⁸ m/s)/(8*10-6 m) s-1
plugging into Planck’s equation:
E = (6.63 x 10^-34 Js)*( (3.00 x 10^8 m/s)/(8*10^-6 m) s-1)
E (1 quanta) =2.49×10^-20 J at 8μm IR
1 small calorie raises the temp of water at 19.5C by 1C
4.182 joules=1cal
I quanta of IR at 8μm will RAISE 1 gm of water by (1 / 4.18)x2.49×10^-20 C
=5.95×10^-21 C!!
NB. The absolute temperature of the water does not come into this analysis. The energy is added to whatever other energy is present and the temperature INCREASES
Another example is in room temperature thermographic cameras.
These use an array of microbolometers at room temperature and will measure with ease temperatures to -50C
there are no negative photons which reduce temperature so a microbolometer pixel at +30C in you view would receive no energy from the scene photographed if it were all below 30C
but I can measure temperature differences between objects at temps of -30C and -30.5C. How is this possible?
the answer is of course that the microbolometer at 30C receives less energy from -30.5C than another at -30C. The 2 microbolometer pixels therefore are at different temperatures. (e.g at 30C ambient the pixel with focussed -30C will be at say 30.01C and the pixel with focussed -30.5C will be at say 30.005C.
I do not understand how you could explain this if you are suggesting that an object emits photons which if they fall on an object which is hotter than the source are simply turned away
Hi Sergie. Nature generally doesn’t produce coherent, non divergent beams.
However, heat transfer at a particular spectral band is about relative intensity. The coherent non divergent beam of a laser can be viewed two ways. One, the intensity replicates at that wavelength the emission from a much hotter body, or two the coherent low frequency vibrating electric field directly motivates proton motion.
Which do you prefer of these identical descriptions of unnatural processes? A fridge doesn’t represent spontaneous process in being a ‘pumped’ process, like a laser doesn’t represent heat transfer from thermal sources.
Industry tells us quite specifically that no energy is available from downwelling flux,
Micro bolometer measurements become irrelevant if no power is available. You can’t even charge a phone for ……. sake from sky downwelling.
Think whatever you like. Industry would sell to this it was possible!
David when the climate becomes unique which it isn’t only then will you have a case for AGW.
Until than it is speculation at best but I would say more like wishful thinking.
sergeiMK said:
“Another example is in room temperature thermographic cameras.
These use an array of microbolometers at room temperature and will measure with ease temperatures to -50C
there are no negative photons which reduce temperature so a microbolometer pixel at +30C in you view would receive no energy from the scene photographed if it were all below 30C
but I can measure temperature differences between objects at temps of -30C and -30.5C. How is this possible?”
It is very simple. It is statistical. Between to surfaces facing each other, a lot of photons travel in both directions. For the transfer to occur, there must be an exact match between the energy that the emitter can loose and the one the receiver can gain. The net flux of energy is the balance between the two fluxes. And the balance is always such that the colder surface, a wall or a microbolometer, receives more energy from photons the warmer surface than it emits to it.
Paul Aubrin on August 26, 2017 at 10:20 AM
Well to be honest, Paul Aubrin: your answer is quite a bit disappointing.
Simply because it lacks the scientific level of the comment you answered.
Isn’t it a bit too easy to answer to formulas with a simple, general comment nearly every student could have written?
Bindidon August 26, 2017 at 1:00 PM said:
“Well to be honest, Paul Aubrin: your answer is quite a bit disappointing.
Simply because it lacks the scientific level of the comment you answered.”
Sorry to disappoint you. But if the explanation is simple, it can be stated simply. Why should I add quantum states and sigma T^4 considerations? There are no negative photons, but two fluxes of photons going in opposite directions.
According to the laws of radiative physics, the resulting flow of radiative energy between two black surfaces (resulting from the two opposite fluxes of photons) always flows from the warmer (wall or thermal camera) to the cooler (wall or thermal camera), the flux being proportional to the difference of the fourth powers of temperatures. How mother nature manages internally to do this is another story, not so important for the result and a bit long to tell.
Well said Paul.
DA…”dQ = mc dT. Solve for dT. Plug in the values. If you cant do that much youre pitiful”.
Where did you get that dumbass formula? Do you ever think or just Google for trash?
Are you by any chance trying to state Fourier’s law of thermal conduction? If so, you have seriously mangled the equation.
You have stated that dq/dT = mc, which makes absolutely no sense. dq/dT states that a change of heat divided by a change of heat equals something. In the Clausius entropy equation, dS = dq/T and the entropy is the integral over a process, however, it’s T not dT. The T is taken as the temperature (often held constant in a bath) at which an infinitesimal change in heat occurs.
dT should be dt, that is time, not Temperature. If you are using T it should be delta T as in T – T0, a temperature change over a dimension.
Where you get mc is totally beyond me. That is either mass x the speed of light or mass x heat capacity(C). Either way, neither fits Fourier which is:
qx = -k dT/dx for heat flow in one dimension. dT/dx is a temperature gradient along the x axis.
geoff wood…”The photons do not have the ability to upgrade to those from a hotter object”.
The problem with your analysis, which may be perfectly accurate for all I know, is that we are talking about heat transfer, not IR emission, which is highly irrelevant. Once the IR leaves an emitting body it is irrelevant to the 2nd law of thermodynamics.
The 2nd law states clearly that heat cannot be transferred from a cooler body to a warmer body under normal means. That means without compensation and there is no such compensation in the atmosphere.
What you need to explain is what happens at the atom level that prevents heat being transferred from a cooler body to a warmer body. It seems perfectly apparent to me that the electrons in the warmer body are at too high an energy level to absorb IR from a cooler body.
Bohr hinted at that. He claimed IR requires a specific frequency and energy level to be absorbed by electrons in a specific atom.
I think it’s vitally important that people stop trying to apply Boltzmann and Planck to our atmosphere with regard to heat transfer unless they specify exactly what is going on at the atomic level. I have yet to read a scientific article that attempts to do that.
Gordon, why are you taking this up with me?
My post said in capital letters ‘Without including long wave heat transfer’.
You go on to say,
“It seems perfectly apparent to me that the electrons in the warmer body are at too high an energy level to absorb IR from a cooler body.”
Don’t be flippant with me.
Electrons are nothing to do with heat. You need a non radiative transition which is probabilistic to produce proton motion from electron shell transition. This often requires third party intervention to conserve momentum,
Light is about electrons and light is cold.
Go figure why an light efficient LED differs from a Tungsten bulb.
You have also said in reply tone
“I think its vitally important that people stop trying to apply Boltzmann and Planck to our atmosphere with regard to heat transfer unless they specify exactly what is going on at the atomic level. I have yet to read a scientific article that attempts to do that.”
I have not so do not accuse.
Paul Aubrin says: August 26, 2017 at 1:18 PM
According to the laws of radiative physics, the resulting flow of radiative energy between two black surfaces (resulting from the two opposite fluxes of photons) always flows from the warmer (wall or thermal camera) to the cooler (wall or thermal camera), the flux being proportional to the difference of the fourth powers of temperatures. How mother nature manages internally to do this is another story, not so important for the result and a bit long to tell.
——————-
Are you saying there is radiative flux from the bolometer to the cold/hot object and radiative flux from the object to the bolometer?
if so I agree
If you are saying the hotter object radiates to the cooler object but “mother nature” ensures that the flux from the cooler object does not reach the hotter object. then I would be interested to know how the cooler object flux knows how hot the hotter object is and decides not to radiate towards it !!!!
—- this is not of course how the thermal imager works
the bolometer is in thermal equilibrium within the camera i.e. radiation in = radiation out
the image focussed on the array adds to the flux (there is no negative as we both agree). An object 30C cooler than the thermal equilibrium temperature adds a small amount to the input flux an object at 30.5C cooler adds slightly less to the input flux than the -30C object. The bolometer pixels will therefore be at slightly different temperatures which knowing the ambient camera temperature lens transmission etc can be used to calculate the object apparent temperature. the real temperature of the object will depend on its emissivity.
geoff wood…”Dont be flippant with me.
Electrons are nothing to do with heat. You need a non radiative transition which is probabilistic to produce proton motion from electron shell transition. This often requires third party intervention to conserve momentum,
Light is about electrons and light is cold”.
***********
You have taken me far too seriously, I was not criticizing you or being flippant. I am trying to get at the root of why the 2nd law restrict heat transfer under normal conditions to one direction, hot to cold, yet with two way IR flux movement nothing appears to be absorbed in the direction of cold to hot.
IR theory does not explain that and alarmists have perverted the restrictions of the 2nd law to suit IR flow. The idea of net energy flow is scientific garbage. If you take it to the atomic level you cannot have partial absorp-tion/emission that would be required in a two way flow of IR.
I will be flippant now. Your claim that electrons ‘are’ nothing to do with heat is absurd. Heat is transferred by valence electrons within a conductive solid. Heat level (temperature) in a solid, up or down, is controlled by electrons as they transition between energy shells around an atom.
Light is NOT about electrons. Light is the product of an electron transition that generates light (EM). Obviously, since EM has an electric field and a magnetic field, there were electric charges involved initially. However, as EM traveling through space, EM has nothing to do with electrons since the electrons that created the EM are no longer present.
This is what alarmists fail to understand. Once EM has been emitted, it has nothing to do with heat, which is a property of mass (atoms). EM contains no heat and the 2nd law is all about heat. The 2nd law has nothing to do with EM and you cannot apply EM theory to the 2nd law, qualifying it on the basis of ‘net energy flow’, whatever that means.
Electronic transitions are nothing to do with heat.
An atom with excited electrons has no more kinetic energy than one with all electrons in ground states.
Thermal motion at Earth’s surface and atmospheric temperatures is nothing to do with electronic transitions or excited electronic states.
Heat a piece of iron progressively and eventually thermal collisions become sufficient to knock outer electrons from ground states to excited states. As the electrons drop back to ground states visible light is emitted and the surface starts to become incandescent.
Heat is transferred by conduction through solids is by collisions involving repulsion of outer electrons. It does not require excited electronic states to do this. Generally at temperatures we are familiar with the energy involved is insufficient to excite electrons from ground states.
You are correct in stating that thermal energy is about motion of mass and again very little mass in a molecule is in electrons. To all intents the mass of a molecule is the mass of the nuclei.
Take the transparency of water in the visible part of the spectrum for instance,
“It (water) doesn’t absorb in the wavelength range of visible light, roughly 400-700 nm, because there is no physical mechanism which produces transitions in that region – it is too energetic for the vibrations of the water molecule and below the energies needed to cause electronic transitions.” Hyperphysics.
So visible light which has higher photon energy than infrared cannot excite the electrons out of ground states in a water molecule. Energy transfer by radiation is quantum frozen to electronic transition through the entire IR and visible part of the spectrum for water molecules. It requires UV and beyond to excite electrons from ground states.
Visible light is not born of proton motion at these temperatures. Proton motion within the nuclei is the motion associated with heat and thermal energy and the radiation associated with this kinetic distribution is infrared. Visible light is nothing directly to do with this as electronic transitions do not increase kinetic energy beyond making the Bohr radius very slightly larger.
sergei…”I would be interested to know how the cooler object flux knows how hot the hotter object is and decides not to radiate towards it !!!!”
It’s not a matter of a logical decision. It’s rather simple if you go to the atomic level. An atom can only absorb energy that has a specific frequency and intensity. In a hotter object, the electrons that absorb the energy are at too high an energy level for the energy from a cooler source to affect them.
For energy from a cooler source to raise the temperature of a hotter object the absorbed energy would have to raise the electrons to an even higher energy level. How is that possible when the absorbed energy must be quantum in nature and have the exact energy of the difference in energy levels the electrons must rise to in order to warm the body more.
The only way that can happen is if the energy absorbed is from a hotter and more energetic source. If the cooler source energy does not have the energy required to raise the electrons in a hotter object to a higher energy level it’s a moot point.
I have no idea what happens to energy radiated from a cooler source when it encounters a hotter body. According to the 2nd law it MUST be ignored. It likely passes right through or bounces around in a solid till it is reflected.
In our atmosphere its even more restricted. If you had two stars close to each other they would be independent radiators and their relative energies may be absorbed by each other provided the star temperatures were close. That’s not the case in our atmosphere.
The surface radiates IR which is partly (a tiny fraction) absorbed by CO2. That CO2 is very likely at a cooler temperature than the surface yet alarmists claim the CO2 can contravene the 2nd law by transferring energy from a cooler source to a warmer body that created it’s energy.
That is, CO2 in the atmosphere is a dependent radiator. It lacks the energy in its emissions to make up the losses at the surface due to radiation let alone warm the surface to a higher temperature than it is heated by solar energy.
Such an inference, which represents positive feedback and perpetual motion, is clearly absurd.
dT = dQ/mc
dQ = 1.22e17 J/s for a billion years = 3.9e33 J
m = Earth’s mass = 5.98e24 kg
c = specific heat. Since the Earth’s volume is 84% mantle (rock), we can approximate using the specific heat for rock, which is about 850 J/kgK (Table 2.6, http://link.springer.com/chapter/10.1007%2F978-3-642-34023-9_2
)
So
dT ~ 800,000 K
QED
Gordon Robertson says:
“I have no idea what happens to energy radiated from a cooler source when it encounters a hotter body. According to the 2nd law it MUST be ignored. It likely passes right through or bounces around in a solid till it is reflected.”
Wrong as usual.
It depends on if the system is adiabatic — thermally isolated.
The Earth is certainly not adiabatic.
Gordon Robertson says:
“Where did you get that dumbass formula? Do you ever think or just Google for trash?”
It’s the definition of specific heat, dumbass.
Didn’t you take high school physics? It appears not.
Gordon Robertson wrote:
“Once EM has been emitted, it has nothing to do with heat, which is a property of mass (atoms).”
Q: How does the Sun heat the Earth, its radiation having traveled through a vacuum?
Gordon Robertson says:
“I have no idea what happens to energy radiated from a cooler source when it encounters a hotter body.”
If the hotter body is a blackbody, it is absorbed (by definition of a BB).
Geoff Wood says:
“Proton motion within the nuclei is the motion associated with heat and thermal energy and the radiation associated with this kinetic distribution is infrared.”
No.
No no no no no.
Heat and thermal energy excite molecules — 3+ body molecules whose quantum state transitions are in the infrared.
It is these 3+ body molecules — water vapor, CO2, N2O, CH4, O3, etc etc that are greenhouse gases, because THEY are the ones that can absorb IR in transitions between their vibrational states and rotational states.
You are thinking of gases Davey. Nearly all gases have near zero emissivity. Solids and liquids however are not limited by your neural 3molecule bandwidth.
And Davey, at the point of collision all diatomics are quadrupole.
It’s called “circular reasoning”, Davie. And, it’s pseudoscience.
You start with the “given” that Earth can obtain the heat capacity. And, that “given” becomes your proof!
Trying to foist such nonsense here makes you either dishonest or incompetent.
Both?
It’s a Fermi question. A heuristic back of the envelope calculation. But you aren’t smart enough to realize or understand that.
g*e*r*a*n says:
“You start with the given that Earth can obtain the heat capacity. ”
Objects *have* a heat capacity — they don’t “obtain” one.
You’re being a sore loser.
Geoff Wood says: August 26, 2017 at 5:13 PM
Hi Sergie. Nature generally doesnt produce coherent, non divergent beams.
However, heat transfer at a particular spectral band is about relative intensity. The coherent non divergent beam of a laser can be viewed two ways. One, the intensity replicates at that wavelength the emission from a much hotter body, or two the coherent low frequency vibrating electric field directly motivates proton motion.
———–
are you serious?
The radiation from a CO2 laser is at 8um no matter what its power.
Each photon carries 2.4910^-20 J at 8μm IR
If you assumed black body radiation peaking at 8um the BB temperature would be around 300K – not even hot enough to boil water!!!
each photons equivalent wave length is an unchanging 8μm.
It cannot emit shorter wavelengths as if it were “hotter”
A high power co2 laser emits vast numbers of photons with wavelengths centred on 8um (I guess there would be spectrum broadening) each photon carries 2.5e-20 joules. it is the sum of this “vast number” of photons that enables the laser to cut metal.
I.e. “vast number”*very small number of joules= much heat.
If you do not know which of your “ways 1 or 2” is correct why do you disbelieve the science of “my way”.
ALSO
What on earth does “coherent low frequency vibrating electric field directly motivates proton motion” have to do with lasers (apart from the word coherent)
and you have not explained room temperature thermal imaging using your theories – please do
Draw the BB spectrum from a hot object over the top of a BB spectrum from a cooler object. The energy is the band pass at the intensity. If all the energy is band limited at 8um then the intensity is huge at that wavelength and replicates at 8um the BB radiance of a band pass section from the continuum of a much hotter object.
A countless number of phase incoherent photons can’t do this. Lasers are intense at a wavelength and thermal radiation is severely limited.
Secondly, the vast number of photons carrying energy in your laser model can be split by an interferometer and added out of phase to create ‘nothing’ at a target. How can your vast numbers carrying energy sum to nothing?
Geoff Wood August 26, 2017 at 2:00 AM
Sounds very interesting.
Could you please publish here a link to a paper showing that in detail, from beginning till end?
Thanks in advance.
Neither does Bin.
Bien entendu, bebe g*e*r*a*n doit absolument laisser ses petits cacas nerveux tout partout, surtout quand ils n’ont aucun sens…
bindidon…”Could you please publish here a link to a paper showing that in detail, from beginning till end?”
Typical response from an alarmist who can’t understand what is claimed. Do you do any science of your own or rush to Google for answers as is the practice of DA?
Robertson, you are so horribly boring.
Read books, it’s never too late for learning (I’m 68).
A Heat Transfer Textbook, 4th edition
John H. Lienhard IV, University of Houston
John H. Lienhard V, Massachusetts Institute of Technology
Bindidon, I would be willing to discuss any details you may wish to address.If you are looking for peer reviewed trash there are many thousands of options.
Best regards.
The “details” of the very funny “theory of the gravitation induced” lapse rate have already been amply discussed for instance here or here not to mention the alarmists.
Gordon Robertson says:
“Do you do any science of your own or rush to Google for answers as is the practice of DA?”
I cite scientific papers and good sources. You make you physics up out of thin air.
Quand Bin est battu, il commence se promener en franais.
He walks in French???
DA…”Manmade global warming now puts this much extra energy into Earth every 2 days”.
To repeat your whine, prove it. Show us the details in a peer reviewed paper.
Gordon, the calculation is baby physics. Even you should be able to do it, if you tried.
This will be an expensive one. My fear is that Houston and the coast have not had an event in so long that the impact will amplify. Sort of like a forest fire where if u go a long time between events then you accumulate fuel and the inevitable fire grows non linearly and is much worse that the sum of all the more frequent fires that normally occur. In this case: are emergency teams prepared, has critical infastructure degraded over the last decade, have populations moved into risky places, and etc?
I love some of these New York Times “Retro Reports”. Here’s one looking back at the huge Yellowstone fires in 1988 that got out of control in part because they relied on faulty computer models.
https://www.nytimes.com/video/us/100000002411859/summer-of-fire.html?mcubz=1
That’s how models get corrected and improved over time.
There hasn’t been a major hurricane (Category 3 or more) make landfall in the US in over 4500 milliseconds!
Indeed. And there has been no global warming for 16 straight months.
And sea level rise definitely ended one year ago.
2017 will be warm, but this is because of the strong neutral ENSO conditions.
It is so clear that even in the eyes hurts.
http://www.cpc.noaa.gov/products/analysis_monitoring/enso_update/heat-last-year.gif
But during the winter in the northern hemisphere may change.
https://www.tropicaltidbits.com/analysis/ocean/nino12.png
http://www.ospo.noaa.gov/data/sst/anomaly/2017/anomp.8.24.2017.gif
Mickey Prumt says:
“2017 will be warm, but this is because of the strong neutral ENSO conditions.”
What is a “strong neutral” ENSO?
The first half of 2017 was part of the seasonal weak La Nina. That tends to cool atmospheric temperatures. Yet still monthly surface anomalies are approaching or setting records.
This may not be the last hurricane this season. Conditions are favorable.
http://www.ssd.noaa.gov/goes/east/tatl/rb-animated.gif
Houston Radar.
https://www.accuweather.com/en/us/houston-tx/77002/weather-radar/351197
The temperature shows the jet pressure in the north-east.
http://pics.tinypic.pl/i/00928/4nffee34nghq.png
Harvey is the first category 4 hurricane to make landfall in Texas since Hurricane Carla in 1961.
What is interesting is that according to FOX News:
“Harvey went from not even a tropical storm to a major Category 4 hurricane in 56 hours, an incredibly fast intensification for a storm.”
According to woodtv.com:
A station at Aransas Pass run by the Texas Coastal Observing
Network recently reported a sustained wind of 102 mph (165 km/h)
with a gust to 120 mph (193 km/h). Note I dont know how high off the
ground observations are taken there.
That would make Harvey a category 2 hurricane.
A station at Aransas Wildlife Refuge run by the Texas Coastal
Observing Network recently reported a sustained wind of 71 mph
(115 km/h) with a gust to 102 mph (165 km/h).
That would make Harvey a category 1 hurricane.
http://woodtv.com/blog/2017/08/24/hurricane-harvey/
Category table:
Category Sustained Winds Types of Damage Due to Hurricane
Winds
1 74-95 mph 64-82 kt 119-153 km/h Very dangerous winds will
produce some damage: Well-constructed frame homes could have damage to
roof, shingles, vinyl siding and gutters. Large branches of trees will
snap and shallowly rooted trees may be toppled. Extensive damage to power
lines and poles likely will result in power outages that could last a few
to several days.
2 96-110 mph 83-95 kt 154-177 km/h Extremely dangerous winds
will cause extensive damage: Well-constructed frame homes could sustain
major roof and siding damage. Many shallowly rooted trees will be snapped
or uprooted and block numerous roads. Near-total power loss is expected
with outages that could last from several days to weeks.
This, Paul Aubrin, is more convincing…
Paul Aubrin said: “Note I dont know how high off the ground observations are taken there.”
Wind speeds at the Aransas Pass station, ANPT2, are measured at 14.2 meters above the surface. The platform of the station, which is on the outer shore of the barrier island/peninsula between Rockport and Corpus Christi, is “10.261 m above mean sea level” and the anemometer is “3.96 m above site elevation”(platform), http://www.ndbc.noaa.gov/station_page.php?station=ANPT2 . The photo of the station shows the platform above the Gulf surface and the instruments above the platform.
Aransas Pass station had the highest recorded wind speeds of any of the coastal weather buoys/stations as Harvey approached and made landfall. When you check the actual measured data for ANPT2, you will find that the highest actual measured 1-minute sustained wind speed was 49.4m/sec, which is 110.4mph, which is just below Cat3 level.
The current NOAA definition for storm category is at 10m above the surface for a 1-minute average sustained wind speed, not for wind gusts. Near the surface, the wind speeds are higher as you go away from the surface, so that measured value should have been reduced by a m/sec or two, but in fact NOAA “derived”/”estimated” that the 10m wind speed was actually higher at 10m than it was measured at 14m. This is a backwards “adjustment”. It appears that they applied the correction to the 3.96m above the station elevation(platform) to get a “derived” value for 10m above the platform, instead of 10m above the surface. Also, the “10m above surface” was only introduced in Nov. 2015. Prior to that the definition of wind speed was at the “surface”, so no upward adjustments were made to the actual measured data of the 3-4m height of most of the coastal buoys.
You can find all the actual measured data and the “derived”/”estimated” values for Aransas Pass by going to the bottom of the above webpage and clicking on the “Real Time Data” link, then clicking on the “Real time standard meteorological data” and the “Real time derived measurements data” links at the bottom of that page.
You can find the data for other buoys/stations by clicking on the other buoys/stations near Corpus Christi/Rockport, http://www.ndbc.noaa.gov/ . None of the other stations were close to the Aransas Pass wind speeds and most were not even hurricane force levels.
So according to the real world actual measured data, Harvey was a hyped Cat4 hurricane that never actually made it to “major” hurricane level, as officially defined by NOAA. It was only a Cat3/Cat4 storm up in the atmosphere where the planes measured and “calculated” a surface level wind speed. Arguably The U.S. still hasn’t had a major landfalling hurricane in over 12 years and counting.
That said, it doesn’t change the fact that Harvey is a severe storm and has and continues to cause devastation and tremendous damage, mostly from the tremendous amounts of rain it is dumping on the Texas coastal areas as it has stalled out over those areas.
“Sea surface temperatures in the Gulf on Thursday were up to 2 degrees above normal, the National Oceanic and Atmospheric Administration reported.
“The average temperature for most of the Gulf was 86 degrees, said Kevin Trenberth, a climate scientist with the National Center for Atmospheric Research in Boulder, Colorado.
“‘That makes it almost the hottest spot on the planet’ for sea surface temperatures, Trenberth said. ‘Its an area thats ripe for vigorous development to occur.'”
San Antonio Express News, 8/25/17
http://www.expressnews.com/news/local/article/Harvey-s-intensity-and-rainfall-potential-tied-11957010.php
Bravo for mayor of Houston who has not ordered the evacuation. It would be more victims outside the city.
Hurricane can produce tornados in Texas.
“Even though rain may taper off during the middle of the week, some communities may remain under water for days. Rising rivers may lead to new flooding next week in areas spared this weekend.”
The jet stream at an altitude of 3500 m on 31 August.
https://earth.nullschool.net/#2017/08/31/0600Z/wind/isobaric/700hPa/orthographic=-98.83,29.09,1572
According to forecasts, the storm will come back south Texas.
As an aside, it makes no sense to compare Hiroshima bombs to a hurricane. The damage from an A-bomb or H-bomb comes largely in the first instant from EM radiation, which appears as intense light. That is followed by an intense heat wave then a pressure wave. No hurricane has such instantaneous energy expenditure, or even much of EM radiation.
One million such bombs going off in a small area like that of a hurricane would cause utter devastation that no hurricane could equal.
At Hiroshima and Nagasaki, there were people within 5 miles of the bombs who survived unscathed because they managed to be behind shelter from the initial EM spike. Many went on to live full, healthy lives.
I wonder how the numbers compare for forest fires?
“The latest wildfire to scorch the Canadian province of British Columbia (BC) has forced the evacuation of around 1,100 people. More than one million hectares (10,000 square km) have burned in the province this wildfire season, making it the worst in BC’s recorded history.
There are over 150 wildfires currently burning across the western province.
A state of emergency declared in the province on 7 July was recently extended to 1 September.
BC has spent over C$375m ($295m; 230m) so far this season to fight the fires.
According to Nasa, the smoke plumes caused by the BC fires and captured by the space agency’s satellites “were thick enough and high enough in the atmosphere to break records”.
Of course, this has nothing to do with climate change.
dr no…”Of course, this has nothing to do with climate change”.
Prove that it is caused by climate change. It may be a record but not by much. As I said, 1958 had the same extent of forest fires in BC and I had not even heard of NASA then.
They had not even started climate modeling back then since a moderate powered computer would take up a city block. They also had more sense in science.
I like this lame form of logic:
” It may be a record but not by much. ”
Since when do new records in anything exceed the previous record by “much”.
A new record time for the marathon or even the 100 meters always exceeds the previous record by a small amount, The same with climate change, new records are being continually set by small amounts. It is stupidity to deny that change is occurring because the new records are “not much”.
“They had not even started climate modeling back then since a moderate powered computer would take up a city block.”
What has this to do with the existence of record forest fires in BC?
Try and focus a bit more.
dr no…”What has this to do with the existence of record forest fires in BC?
Try and focus a bit more.”
Speaking of lack of focus and lack of comprehension, you might try to get what I am telling you. 1958 was not considered a climate change hazard as you alarmists insist about climates today, yet the forest fires were just as extreme.
No one was jumping up and down, waving their arms and claiming, “Oh, Oh…the fires must be caused by climate change”.
Who cares about record forest fires in BC. BC ain’t the world you idiot.
US Wildfire area is higher than average year-to-date, by 30%, compared to the last 10 years:
https://www.nifc.gov/fireInfo/nfn.htm
As for
“They also had more sense in science.”,
I understand that all scientists did in 1958 was to let off nuclear bombs. Really sensible that was.
dr no…”I understand that all scientists did in 1958 was to let off nuclear bombs. Really sensible that was”.
Bombs were more interesting than the lame pseudo-science around a trivial amount of CO2 in the atmosphere.
Bombs were more interesting??? To whom? People being irradiated? People worried about a global nuclear war?
DA…”Bombs were more interesting??? To whom? People being irradiated? People worried about a global nuclear war?”
I would have to agree with you on that. Still, to a nuclear physicist studying the potential of the tremendous power available in the atom, it must have had them salivating to see the effect in a test.
I grew up in that era too and although I had faith (possibly misguided) that humans were not so stupid as to blow each other to wherever it got pretty tense when Kennedy threatened the planet by confronting the Soviets when they tried to install missiles in Cuba.
The US had already installed missiles along the USSR border and I thought at the time it was only fair that they should have been able to install them in Cuba. I was angry with Kennedy for his stance considering his policy which allowed the US to threat the USSR along their borders.
Then again, Kennedy seemed far more interested in Marilyn Monroe than saving the planet from nuclear war. Rather than learn from that encounter it seems we are doomed to repeat the same mistakes by alienating the Russians today. We have welcomed Germany into the fold, but the Russians, who were our Allies in WWII against the Germans are being alienated.
Given the choice between Angela Merkel and Putin, I’m sorry, I have to go with Putin.
Russia was the US’s Cold War enemy for decades after WW2. That tends to make their self-interested alliance then moot.
Prove that it is caused by climate change. It may be a record but not by much. As I said, 1958 had the same extent of forest fires in BC and I had not even heard of NASA then.
Wiki:
“On July 29, 1958, Eisenhower signed the National Aeronautics and Space Act, establishing NASA. When it began operations on October 1, 1958, NASA absorbed the 43-year-old NACA intact; its 8,000 employees, an annual budget of US$100 million, three major research laboratories (Langley Aeronautical Laboratory, Ames Aeronautical Laboratory, and Lewis Flight Propulsion Laboratory) and two small test facilities”
Or NACA became NASA.
“From 1946, the National Advisory Committee for Aeronautics (NACA) had been experimenting with rocket planes such as the supersonic Bell X-1. In the early 1950s, there was challenge to launch an artificial satellite for the International Geophysical Year (195758). An effort for this was the American Project Vanguard. After the Soviet launch of the world’s first artificial satellite (Sputnik 1) on October 4, 1957, ”
Soviet knew US going to launch satellite and they decided to beat them with Sputnik 1.
Gordon Robertson says:
“Prove that it is caused by climate change. It may be a record but not by much. As I said, 1958 had the same extent of forest fires in BC…”
But what is the trend?
In the US, from 1970-1960, the trend is +60,000 acres/yr, about 1.3%/yr. Real federal suppression costs (Forest Service + DOI) are up $43 M/yr (current dollars).
But there are lots of variables involved, and isolating the impact of climate change is not trivial. This is one for the experts and peer reviewed studies, which I haven’t looked into.
annual data:
http://www.nifc.gov/fireInfo/fireInfo_stats_totalFires.html
suppression costs:
http://www.nifc.gov/fireInfo/fireInfo_documents/SuppCosts.pdf
David Appell said: “But what is the trend? In the US, from 1970-1960, the trend is +60,000 acres/yr …”
Typical pathetic climate alarmist cherry picking there.
Acres burned are down 90% since 1930. ~50 million acres in
~1930 versus ~5 million in 2016. So according to the USDA Forest Service data, the trend is down, bigtime!
And gee, 90% of all the human CO2 ever produced has been added to the atmosphere since 1930, and yet the number of acres burned by forest/wild fires is down 90%. Tell us again how your alleged catastrophic human-caused climate change is causing worse forest/wild fires. You are soooo funny.
Data supporting my previous comment on forest/wildfires: https://realclimatescience.com/wp-content/uploads/2016/10/Cnv8w3_W8AABcfp-1-1.jpg .
dr no…
If you’re bean counting here’s some stats as of end of July. As of July 20th, most travel routes through BC were blocked by fires yet by the end of July all roads were open again.
http://www.cbc.ca/news/canada/british-columbia/area-of-b-c-burned-by-wildfires-at-a-56-year-high-1.4226227
It claims in the article that this year pales in comparison to 1958. Don’t know how they are comparing.
“This year, however, pales in comparison to a record fire year in 1958, when 8,600 square kilometres of the province, an area larger than the Greater Toronto Area, burned”.
This fire season is claimed to be the size of Metro Vancouver (2877 square kilometres) plus Mission [227.6 km^2) and Abbotsford [375.6 km^2). Metro Toronto is rated as 7124 km^2.
Of course, this is like comparing apples and oranges. Vancouver is built out to Mission and Abbotsford, the latter being 50 miles from Vancouver. Vancouver condenses in a V, terminated by the ocean, whereas Toronto is spread out with its base on Lake Ontario.
I have been to Toronto and I don’t rate it overall as being that much different to travel through than Vancouver. I don’t think Toronto is twice the size of Vancouver so the 7124 km^2 is misleading for TO.
dr no…I might add that the area where these fires have been mainly centered is notoriously dry any summer. Some of the area is rated as a desert climate complete with sage brush and cactii.
If it changes to a rain forest I’ll let you know.
Some of those areas require extensive irrigation from the Thompson River to sustain crops. There is a dry belt from Kamloops down the Thompson Valley to where the Thompson meets the Fraser River at Lytton, rated one of the hottest part of Canada. The climate is pure desert closer to Lytton and nearer Kamloops it’s still very dry.
While camping nearby, just up the Thompson, we had ro relocate to a cooler area. It was over 40C in the shade and nary a whisper of a breeze to cool anyone.
Going north from the midway point down the Thompson you reach the Caribou Region. It is notoriously dry as well but not to the degree of a desert climate or the Kamloops area climate. Much dryer than the Vancouver area.
As far as NASAs observations on the smoke from the fires, Vancouver was covered in it for several days.
Good to hear a first hand account of such extreme weather.
It seems to me that there is a chance in Texas for greater afforestation.
Precipitation was above normal across much of the nations mid-section and below normal in portions of the Deep South, Southeast, Ohio Valley and much of the West. The heaviest rainfall was in southern Minnesota, western Iowa, eastern Nebraska, western Missouri, eastern Kansas and northwest Arkansas. Temperatures were above normal for much of the eastern third of the nation, the Deep South and Far West. The Northern Plains, Southwest and much of the West had below-normal temperatures. Drought and dryness persisted in the northern Plains and expanded westward significantly in Montana.
http://droughtmonitor.unl.edu/data/png/20170822/20170822_usdm_home.png
Gordon Robertson says:
“As an aside, it makes no sense to compare Hiroshima bombs to a hurricane. The damage from an A-bomb or H-bomb comes largely in the first instant from EM radiation, which appears as intense light.”
Lots of people have said this, including me:
http://davidappell.blogspot.com/2013/12/lets-stop-comparing-global-warming-to.html
The comparison is to energy only, not destruction. If you have a better comparison for energy, let’s hear it.
http://davidappell.blogspot.com/2013/12/kitten-sneezes-are-worse-than-hiros.html
DA…”The comparison is to energy only, not destruction. If you have a better comparison for energy, lets hear it”.
Both of your article refer to heat trapping in the atmosphere. There is no such trapping device in the atmosphere so comparing trapped heat to bombs or electric light bulbs is a moot point.
Heat can be trapped in a greenhouse because the glass prevents molecules of air, energize by heating via solar energy absorbed in the soil, from rising. There is no such mechanism in the atmosphere to replicate the effect of the glass. Hot air molecules continues to rise in the atmosphere till they run out of heat, there is no physical mechanism to stop them.
The only trapping that can go on in the atmosphere wrt CO2 is a tiny fraction of the total IR flux emitted by the surface. Even if all the CO2 molecules are energized simultaneously, and warm, the warming contributed to the atmosphere is a small fraction of 1% due to Dalton’s law of partial pressures and the associated temperature rise/fall associated with pressure.
In other words, the effect of warming due to CO2 in the atmosphere is negligible compared to the 99%+ of N2/O2. Even water vapour with an average concentration of about 0.3% throughout the entire atmosphere should have a negligible effect on warming over the entire atmosphere.
Totally wrong, Gordon.
But since you clearly cannot learn anything new, I’ll just leave it at that — you’re wrong. You always are.
DA…”Totally wrong, Gordon”.
I notice you cannot offer a scientific rebuttal to show why you think I’m wrong.
You don’t seem to think that partial pressures or the ideal gas equation has an application in our atmosphere. Do you think either applies only in sealed containers in a lab?
Do you not think atoms/molecules collide in the atmosphere? That’s what atmospheric pressure is about. Of course, gravity creates a pressure gradient but the compaction of molecules within the strata of the gradient produce pressure and the collisions produce heat. The denser the compaction the higher the heat.
The amount of heat is directly proportional to the mass of each constituent gas. Or so Dalton claimed. How can CO2 with a partial pressure of 4/100ths of 1% add anything more than a trifle of heat?
Exactly Gordon
Gordon Robertson says:
“In other words, the effect of warming due to CO2 in the atmosphere is negligible compared to the 99%+ of N2/O2.”
How do N2 and O2 warm?
DA…”How do N2 and O2 warm?”
Direct contact with the surface via conduction. Then convection takes the heated N2/O2 high into the atmosphere. At least, Lindzen seems to agree.
It would not surprise me in the least if N2/O2 also gets warmed directly by solar energy through certain frequencies in the EM spectrum.
Gordon Robertson said: “it makes no sense to compare Hiroshima bombs to a hurricane.”
I suspect that Dr. Spencer did that as a poke at the SkS Kidz silly comparison of OHC to Hiroshima bombs.
“One woman died from flooding in Houston on Saturday night, according to the Associated Press. The woman’s car was stuck in high water when she got out of the vehicle and was later found dead about 30 yards away.
This is the second confirmed death due to Harvey.”
We have now gone well over 100,000 seconds since the last major hurricane (Cat 3 at landfall) has hit the United States!
{ha}
“While Harvey will weaken like any hurricane that moves over land, this unfortunately is only the beginning of the flooding threat for SE Texas. Hurricanes can drop copious rainfall for days after landfall, and in this case, Harvey is not expected to move much at all over the next several days. Current forecasts suggest that Harvey could be barely 100 miles from its current location by next Thursday.”
https://www.tropicaltidbits.com/blog/wp-content/uploads/2017/08/093338WPCQPF_sm.gif
Because of the floods will be more deaths.
Current air movement and convection.
http://www.ssd.noaa.gov/goes/east/eaus/h5-loop-wv.html
Hurricane Harvey is approaching and a Coppers hawk seeks refuge in my car and does not want to leave.
His wing is fine y’all. I checked him over. Nothing broken. I think he just doesn’t under the difference in the sudden change in air pressure and coupled with a cat that tried to attack him, he feels safe doing taxi fares with me till the Hurricane passes.
https://youtu.be/-6MjdV_8E6Q
Forecast for August 1. Warning for Louisiana.
https://earth.nullschool.net/#2017/09/01/1200Z/wind/isobaric/700hPa/overlay=cape/orthographic=-91.96,30.71,1979
https://www.accuweather.com/en/us/new-orleans-la/70112/weather-radar/348585
Gordon Robertson on August 26, 2017 at 6:41 PM
I was going to advance you from an idiot to an imbecile but after this statement youll have to remain at the bottom end of the IQ scale. I posted a link to the NOAA site where they admitted to slashing the surface station database globally from 6000 stations to under 1500. I was being generous by only claiming a slash of 75%.
These trolls like Robertson are inimaginable.
They simply write everywhere that NOAA confirmed them to have shashed 4500 of 6000 GHCN stations (what certainly is true).
BUT please: do not expect such trolls to think even for half a femtosecond about the reasons NOAA might have had to do that. These trolls’ goal is not to inform: it is solely to discredit persons and their work as much as possible.
But I should better leave Robertsons brainless polemic level and move to facts instead, by showing what happens to a GHCN temperature time series when you remove a considerable amount of GHCN stations out of the usually contributing ensemble.
I made a little experiment. First
– to remove, out of the 7280 GHCN V3 stations, all those which did no longer contribute in this 2017 year, and then
– to average the data of all stations located in the same 2.5 degree grid cell of our lovely planet (I like this grid size because it is that used by Roy Spencer for his UAH gridded data).
The first removal step gave a remainder of 2700 stations. The second step gave a residual of 1206 stations (the result of averaging was as expected quite similar to that obtained by discarding per cell all stations but that one having the mean trend).
That’s a slash rate of 83 %…
The results are as follows (linear estimates for 1880-2017 in C per decade, SE about +- 0.01 for all)
– full set of 7280 stations: 0.22
– all 2700 stations contributing in 2017: 0.18
– all these stations averaged into 1206 grid cells: 0.22
http://fs5.directupload.net/images/170827/ijkypfrv.jpg
Ooops?! Whats that yellow plot in the middle?
Hmmmh. Thats the NOAA (land only) time series with the famous 4500 slashed stations… and nevertheless a linear estimate of 0.11 C / decade for this 1880-2017 period.
Here you can see the tremendous distance separating a trivial averaging a la Bindidon from the huge homogenisation work performed by NOAA (that of GISS is even heavier, what is best visible when zooming into the 1979-2017 satellite era).
*
Well, to be honest: trolls like this Robertson should feel free to call me an idiot, an imbecile or whatever else! I have no problem with that: I know where it comes from.
Yes — Gordon never stops to think about how many stations are necessary to get a measurement to the desired precision; he just naively thinks more are better. But stations cost money, to install, read and maintain.
DA…”But stations cost money, to install, read and maintain”.
So let’s stop doing science since it costs too much. Much easier to synthesize temps in a climate model. The bonus is that the temperature get warmer when generated by a model.
bindidon…”BUT please: do not expect such trolls to think even for half a femtosecond about the reasons NOAA might have had to do that [chop 4500 stations from a global set of 6000]…”
For the same reason NOAA used a 48% confidence level to declare 2014 the hottest year ever. They are alarmists of the highest order.
Being from Germany, I don’t imagine you understand politics in the US, where the Obama government was able to hide their climate agenda from Congress (legislature, parliament, Bundestag). Do they do that in Germany? Can Angela Merkel keep an agenda private from the Bundestag?
To enable that agenda, the Obama regime was obviously able to counsel NOAA, a US government agency, to return results that backed their alarmist agenda. They could do that through the Environmental Protection Agency which was staffed by Obama with abject climate alarmists.
There is no other apparent reason why NOAA would go to so much trouble to rewrite the historical temperature record. Makes absolutely no sense to use a climate model to synthesize 75% of their data when they already had the actual data.
I don’t get why it’s beyond you that politicians can be that devious.
When John Christy of UAH was testifying before a Senate committee, Hillary Clinton was glaring at him with arms folded. She was obviously displeased that he was offering skepticism about HER agenda, even though he had the data to back him. When she spoke to him, it was with disdain.
John Christy is an intelligent, caring human being and a damned good scientist. He did not deserve such disrespect, especially from a woman who stood by her husband, Bill Clinton, after he’d had several affairs and culminated with oral sex in the Oval office of the White House with an employee. She stuck by him and blamed the women.
That’s why I am super-happy she lost. We don’t need the politically-correct telling us what is right and what to think. The US electorate obviously agreed.
Gordon Robertson on August 28, 2017 at 10:07 PM
Robertson, here you fall down into the cesspool. That is manifestly the coarse, greasy niveau at which you feel best.
No further comments needed.
bindidon…”I made a little experiment”.
Oh, oh…now I get it. ‘YOU’ did an experiment and it happened to back the practices of NOAA, whom you blindly support. Why did you not say so. Now everything is perfectly clear.
Tell me something, why don’t we just throw out all the data and go to climate models to synthesize temperatures?
Oh, oh…I forgot, we don’t need to. We already have satellites flying that do a much better job with 95% coverage of the planet as opposed to 30% for surface stations.
We don’t even need NOAA, all we need is their satellite data which they refuse to acknowledge let alone consider.
Why do you suppose NOAA ignores their own sat data? They gave it away willingly to UAH, who went on to win medals for excellence from NASA and the American Meteorological Society for their work making data sets from the NOAA sat data. Do you suppose it’s because NOAA doesn’t like what their sat data is telling them?
Then alarmist like you come along, take their data and apply it to some Mickey Mouse amateur algorithm and misrepresent it.
What’s wrong with the UAH graph on this site? Too realistic for you?
Robertson on August 28, 2017 at 10:18 PM
1. Tell me something, why dont we just throw out all the data and go to climate models to synthesize temperatures?
Here again, Robertson, you confirm your absolute lack of competence: you are not able even to simply discover that I use public data, and no models.
2. We dont even need NOAA, all we need is their satellite data which they refuse to acknowledge let alone consider.
Why do you suppose NOAA ignores their own sat data?
https://www.star.nesdis.noaa.gov/smcd/emb/mscat/
3. Whats wrong with the UAH graph on this site? Too realistic for you?
Look
– at UAH’s data
http://tinyurl.com/jrx6wcn
(the data from which ‘the UAH graph on this site’ is originating from; it represents the third column (the Globe) in the file
and
– at a graph produced out of exactly the same UAH data, of which you however know no more than a little aspect:
http://fs5.directupload.net/images/170829/8upd2697.jpg
Do you recognise something in it, Robertson?
Think, instead of spitting your venomous, brainless nonsense.
Persons who are not able to contribute mostly discredit; persons who are not able to construct mostly destroy.
I can’t imagine a way to describe you better.
GORDON – they do not like the state of the art technology (satellite data, six hourly model data) because it does not lend as much support to their asinine AGW theory, which is being proven wrong as each month passes by and global temperatures stay within a range.
But Salavatore… I like satellite data! Why, do you think, did I evaluate for example Roy Spencer’s files
http://www.nsstc.uah.edu/data/msu/v6.0/tlt/tltmonamg.1978_6.0
till
http://www.nsstc.uah.edu/data/msu/v6.0/tlt/tltmonamg.2017_6.0
I am highly interested in comparing satellite with surface data:
http://fs5.directupload.net/images/170826/dpvuqebo.jpg
Do you see how the yellow line (GISS land) and the green line (UAH6.0 land) fit together in the graph above?
Of course, GISS land is a bit warmer than UAH land during the satellite era (0.20 C / decade instead of 0.17) but the similarity of their running means over 36 months is amazing.
Sometimes, Salvatore, I think you are the one who believes everything, and I am the skeptic who wants to check everything…
ok , I thought you did not like satellite data.
bindidon…”Do you see how the yellow line (GISS land) and the green line (UAH6.0 land) fit together in the graph above?”
No, I don’t. That’s because the UAH graph depicted is fictitious. Looks like something you put together on woodfortrees.
Robertson on August 28, 2017 at 9:41 PM
Robertson, you become with each of your stoopid ‘comments’ more and more ridiculous, you remember me people going slowly but irremediably into the darkness of senility.
The graph I produced originates from the following sources:
1. GHCN V3 land-only stations
http://tinyurl.com/y9uyykgz
(huge data and metadata files stored in a compressed directory)
2. NOAA land-only
http://tinyurl.com/ya32kunn
3. UAH6.0 Globe land-only
http://tinyurl.com/jrx6wcn
(data column 2)
All links via TinyURL because the originials contain a series of letters blocked by the site’s spam controller.
Thats because the UAH graph depicted is fictitious.
The problem with people like you is that though you know nearly nothing, you write everywhere as if you were a renowned specialist.
You wouldn’t be able to let even the simplest spreadsheet claculator produce a linear estimate of a time series, nor a fortiori to let it plot that series for you on a graph, together with an appropriate running mean of your choice.
But I know that you will never and never shut up, and that you will continue to destillate and spread your ugly lies.
Who should stop you after all? Even you can’t: your niveau of paranoia is beyond any control.
A little correction, errare humanum est
Instead of
2. NOAA land-only
http://tinyurl.com/ya32kunn
the graph used
2. GISS land-only
https://data.giss.nasa.gov/gistemp/tabledata_v3/GLB.Ts.txt
salvatore…”GORDON they do not like the state of the art technology…”
Roy and John Christy have been enduring such bias since the alarmists became aware NOAA temperature data was much lower than the surface data or models.
Alarmists, including Kevin Trenberth, have tried every trick in the book to discredit the sat data. Even NOAA ignores their own sats. Of course the sat data has survived through UAH even though RSS has bent over backwards to agree with the alarmists. The statement by the RSS rep that the surface record is more reliable was pure idiotic.
Why would anyone in their right mind not want to go with the state of the art technology that has complete unbiased no estimating global coverage and uses a tight grid system.
Answer it does not show the global temperatures to be as high as other sources which are of course not accurate.
Salvatore Del Prete says:
May 4, 2017 at 5:42 AM
I was wrong on the solar activity it was way higher then I thought it was going to be back then. 2011 mid 2016
http://www.drroyspencer.com/2017/05/uah-global-temperature-update-for-april-2017-0-27-deg-c/#comment-245576
exactly David, and now in year 2017 solar is doing what I thought it was going to be like between 2011-2016 and this is why David year 2017 will likely be the transitional year.
My climate forecast was never wrong ,only my solar forecast.
Your forecast was wrong, period, no matter how much you try to weasel of it. Your forecasts — all of the — have been wrong, always. But you’re too stubborn to learn.
Be fair – Salvatore is only wrong because he made an incorrect assumption.
Similarly, all my efforts at picking winners of horse races have turned out wrong because somewhere along the line I made an incorrect assumption.
Otherwise, my prediction system is perfect.
As is AGW forecast which is way off .
Meanwhile, over 80N ice is much more than in the previous four years.
http://files.tinypic.pl/i/00928/usj5cy0leuxg.png
http://files.tinypic.pl/i/00928/qniq7qabxs8l.png
Still cold Humboldt Current.
https://www.tropicaltidbits.com/analysis/ocean/nino12.png
https://upload.wikimedia.org/wikipedia/commons/a/af/Humboldt_current.jpg
“The El Nio climate phenomenon operates in the Pacific. It alters the current direction in upwelling regions, in this case between the west coast of South America and Indonesia. The large upwelling region off the coast of Chile and Peru is part of a powerful ocean current called the Humboldt Current. This brings cold water from the Antarctic northward along the west coast of South America. Here, like off southwest Africa, nutrient-rich, cold water rises to the surface. The engine for this upwelling is provided by the prevailing trade winds that push the warm surface water from South America westward towards Australia and Indonesia. South American waters are among the worlds richest in fish. Around 15 to 19 per cent of the worlds catch comes from here, especially small species like sardines and anchovies. The larger horse mackerel, as well as wide-ranging species such as sharks and tuna, are also found here. But in the years of the El Nio, the westward-blowing trade winds decline and may even reverse direction. This also changes the current direction of the water. Warm, nutrient-poor surface water now flows from the western Pacific towards Peru. These conditions inhibit the production of plankton off the coast of Peru. Food for the planktivorous fish thus becomes scarce, and the stocks collapse. The larger predatory fish and birds, including penguins, are affected, but also mammals such as seals, which rely on the fish as their main food source. In El Nio years they often produce fewer offspring.”
http://worldoceanreview.com/en/wor-2/ecosystems-and-species/fish-habitats/3/
Salvatore Del Prete on August 27, 2017 at 6:27 PM
Salvatore, we certainly agree upon the following facts:
– the Sun is the one and only energy supplier of our planet;
– the oceans are by far the main storage ‘device’ for the energy coming fron the Sun.
How do you bring the following two facts together:
– the ocean heat content is permanently increasing;
– Sun’s activity is decreasing since many years.
Look at the chart below (dont’ focus on scaling – it is arbitrary; focus on the divergence – it is not):
http://fs5.directupload.net/images/170829/l6lbxu36.jpg
Thanks in advance to Mr Appell for avoiding to enjoy us with his clever thoughts. The same holds of course for the Robertson troll.
Steve Bowen, meteorologist at reinsurance firm Aon Benfield, said: What were seeing is the most devastating flood event in Houstons recorded history. Were seeing levels of rainfall that are unprecedented.
Before you get your knickers in a twist let me say there is no evidence, as yet, that this is related to global warming.
The last sentence above is mine.
Two lows over Texas and Florida.
http://tropic.ssec.wisc.edu/real-time/mtpw2/product.php?color_type=tpw_nrl_colors&prod=epac×pan=24hrs&anim=html5
The neutron chart shows the recent increase in solar activity.
http://images.tinypic.pl/i/00928/sj5neuhe1rwb.gif
Let this chart not fool anyone. Approaching the solar minimum.
Coming back to Roy Spencer’s head post: viewed from Germany, it doesn’t look so very good in Houston!
http://www.wetteronline.de/wetterticker?postId=post_201708283242055
I hope there will be better help for all these people as during and after this tremendous Katrina disaster.
These thunderstorms bring rain to Louisiana.
http://images.tinypic.pl/i/00928/u910w29408ic.png
http://pl.blitzortung.org/live_lightning_maps.php?map=31
2 day of “no hurricane drought” over land.
It’s now 2 days without no hurricane over land.
Thank you Dr.No.
I have to say we have a good balance of skeptics and non skeptics on this site and the conversation is civil.
It is good.
… and the conversation is civil.
It could be, Salvatore. But behind seemingly civil comments, Robertson is a hard, unteachable liar, ready for any manipulation.
Maybe he doesn’t want to learn your incessant bs.
Robertson doesn’t want to learn anything, SkepticGoneWild, not only my BS. But persons provocating with so harsh lies must live with corresponding answers.
Bindidon said: “But persons provocating with so harsh lies must live with corresponding answers.”
Which is why you must live with the truth that SkepticsGoneWild & Robertson tell you. Sadly, you deny that truth because, in your own words, you are a “hard, unteachable liar, ready for any manipulation”.
I have been watching them expose your ignorance of science and your denial of such fundamental science as the 2nd Law of Thermodynamics.
RealOldOne2 on August 31, 2017 at 7:41 AM
I have been watching them expose your ignorance of science and your denial of such fundamental science as the 2nd Law of Thermodynamics.
Well I indeed don’t like people invoking 1lot or 2lot everytime to distract from a discussion’s main stream, and especially not those even doubting about what Roy Spencer explained us concerning that, but… what about you showing me my denial concerning 2lot?
RealOldOne2 on August 31, 2017 at 7:41 AM
No answer after a week: as usual.
RealOldOne2, you are a troll just like is Robertson. Please avoid in future lying about me.
A very little hint for interested persons
NOAA’s STAR TMT data
ftp://ftp.star.nesdis.noaa.gov/pub/smcd/emb/mscat/data/MSU_AMSU_v3.0/Monthly_Atmospheric_Layer_Mean_Temperature/Global_Mean_Anomaly_Time_Series/NESDIS-STAR_TCDR_TMT_Merged_MSU2_AMSUA5_Monthly_S197811-E201707_V3.0_Regional_Means_Anomaly.txt
shows actually the same linear estimate for 1979-2016 as does that of UHA6.0 TLT, 0.128 i.e. 0.13 C / decade:
https://www.star.nesdis.noaa.gov/smcd/emb/mscat/images/MSU_AMSU_Global_Trend.png
An Excel made comparison chart of the two datasets for the Globe:
http://fs5.directupload.net/images/170830/6h67mweh.jpg
Note en passant that while Roy Spencer still publishes his data as ‘TLT’, UAH’s Grand Climate Manitoo John Christy didn’t even mention the lower troposphere in his most recent Senate testimony.
*
The Robertson troll certainly will tell us that I
– duplicated the UAH data
– lathed, milled and planed it in a M-O-D-E-L and
– renamed the output ‘STAR TMT’
because he perfectly knows: that data cannot exist, point final.
And let me conclude by telling you the very best: START TMT’s trend estimate for the troll’s favorite period (1998-2015) is, you won’t believe it:
-0.004 +- 0.023 C per decade
That’s really the most beautiful pause / hiatus / plateau I have ever seen!
And that’s coming from… NOAA’s satellite data, yeah.
Now I’m sure all warmistas will name me a skeptic forever, he he.
That pic will fit a bit better to its heading text:
http://fs5.directupload.net/images/170830/duagnazg.jpg
Has there ever been a study to see what happens to the temperatures on earth and in the troposphere when more hurricanes and tropical cyclones (Typhoons etc) are formed?
If so, how much heat is released through a hurricane such as Harvey and now that Irma is next? What impact does that have on the temperatures in the troposphere? Can it be shown that it goes up as a consequence? Does tropical cyclone activity increase the speed at which the planet is cooling?
Just wondering if every 8-10 years there are more cyclones to help restore the energy balance on the planet?
Thanks for your feedback