We meteorologists have been watching what looks to be a major snowstorm shaping up for the eastern U.S. in the last couple days of 2017.
While it is still too early to tell just where the worst weather will be, it does look like frigid air coming down from Canada will be met by moist Gulf and Atlantic air, and a storm will develop in the central or southeast U.S. and track northeastward somewhere near the East Coast.
People all along the East Coast and New England should be watching forecasts for this system in the coming days, especially those who might be traveling to New York City for Times Square festivities. It is still not obvious whether the low pressure will track just inland or offshore, which has huge consequences for what kind of weather the I-95 corridor will experience.
Historically, the most accurate weather forecast model is the ECMWF. Here is the latest ECMWF snow depth forecast for ball-drop time on New Years Eve, courtesy of Weatherbell.com. It shows two feet of snow depth at midnight New Years Eve in New York City. Most of that snow is forecast to fall in the 24 hours prior to ball-drop time:

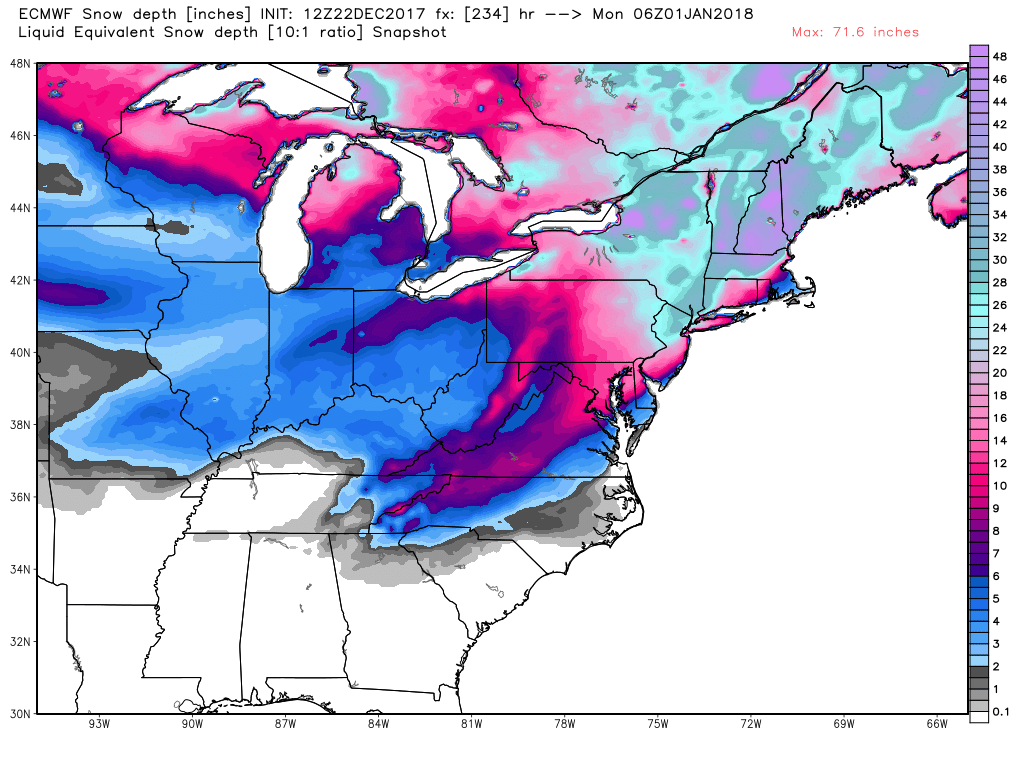
ECMWF 10-day snow depth forecast for midnight New Years Eve, December 31, 2017. This forecast WILL change as New Years Eve approaches.
Again, this forecast is 10 days away. But each forecast cycle in recent days has been predicting some sort of major winter event for the East in the last couple days of 2017.
10 days out…can you predict? I’m doubtful.
What do you mean?! They know exactly what’s going to happen weatherwise a hundred years from now.
Be very doubtful. After all dealing with a “former” NASA scientist here. Global warming hype & junk science.
I see the trolls are out
But we waste billions on predictions 100 years out…..get a grip mate.
I used to live in New England, before I moved to Oregon. Snow and cold there is welcome over Christmas. January there is absolutely beautiful, like an entirely different planet.
I’ve never experienced fall or winter there, but I’d like to.
I miss it too.
Dr.Roy
Are all climatologists meteorologists and vice-versa?
Thanks.
Geno…”Are all climatologists meteorologists and vice-versa?
Thanks”.
Climatologist is a generic term for anyone associated with the study of climate. Could include geologists, geographers, computer programmers (modelers), mathematicians and so on.
UAH is fortunate to have Roy with a degree in meteorology and John Christy with a degree in climate science. From what I have read, such specific degrees to the field are few and far between with those calling themselves climatologists.
TY
Agreed. Climate is a very big umbrella with multiple disciplines below. The computer modelers seem to have a large disproportionate amount of the power based on junk science they can publish in top journals. If solar physics, meteorology, and paleoclimate were emphasized, then the ghg problem would probably be framed differently and the field would receive less funding. Now the fields that align most with the funding organizations are overrepresented. Hence why I stepped away from paleoclimate and said let time tell.
Aaron – what’s an example of this “junk science,” in your expert opinion?
Dave fair challenge. I dont typically save the many junk papers I read. Most are configured on the premise- if modeled warming comes true, then our second model shows (put catastrophic event here) as a result. I will save a few onward for such discussions. Below are a few I grabbed from my existing links. I dont really deal with climate research anymore… im just not into politics or computer models, so the field has lost my attention. The straw that broke my back was changing the SSN to minimize the solar max from 1950 to 2000 by increasing solar counts before ~1950. Same thing the field did to ocean temperatures as a boat engine heat correction. When NOAA and NASA accepted these and began to use the unpublished changes (SSN) I threw my hands up and quit. They dont even match the solar isotopes records (Be and C) as well as the original.
1. CO2 Slowing thanks to green energy:
https://www.nature.com/news/three-years-to-safeguard-our-climate-1.22201
But nothing has changed in empirical data. https://www.esrl.noaa.gov/gmd/ccgg/trends/index.html
This paper should be retracted.
Paper Seal Level update. http://onlinelibrary.wiley.com/doi/10.1002/2017GL073308/abstract
Pause buster. We dont like so we modify. http://science.sciencemag.org/content/early/2015/06/03/science.aaa5632
SSN. UPDATE. used by IPCC, NOAA , and NASA, but unjustified: http://science.sciencemag.org/content/early/2015/06/03/science.aaa5632
Aaron, posting a bunch of links does nothing. You have to explain why they are wrong.
DA…”Aaron, posting a bunch of links does nothing. You have to explain why they are wrong”.
1)That’s all you do, post inane links.
2)I have given you reason after reason and all you do in response is call me a liar.
Aaron…thanks for a measured POV from someone who has been there.
Like you, I had similar reasons for questioning AGW. In the beginning, I had no particular leaning either way but when the IPCC published in the 2007 Summary for Policy makers that it is 90% likely humans are causing global warming, I wanted to know how they could apply a confidence level to scientific opinion.
I began with a Google search to understand their reasoning. I quickly came across an article by Richard Lindzen in which he explained that the 90% opinion came from 50 politically-appointed lead authors, not from the main report where many reviewers wanted to wait and see what developed.
Further research revealed the practice of the IPCC to release the review before the main report then ‘adjust’ the main report to reflect the view of the 50 lead authors. I don’t care what branch of science you come from, that is outright political conniving.
From there it went downhill. The so-called science behind AGW has been revealed to me as very poorly represented physics and chemistry.
I visited north Idaho one winter. We hiked the trails among the western pines. Beautiful to visit. Storyland.
Merry Christmas to all.
We lived in Troy ID (just east of the Moscow/Pullman area) for 15 years.
Ah…the Moscow/Pullman road. I barely remember it.
lewis…”I visited north Idaho one winter. We hiked the trails among the western pines. Beautiful to visit. Storyland.
Merry Christmas to all”.
It is nice. I used to tour back-mountain country with specially designed cross country skis. With our mountains on the southwest coast of Canada, you have to be constantly vigilant for avalanches.
Wouldn’t you know that people on snowmobiles challenge avalanche slopes by trying to see how far up them they can get before powering-out. More often than not they trigger avalanches by messing with the base and/or setting them off with the noise of their engines.
You’re lucky these days if you can find a peaceful trek in the mountains with such yahoos around.
You’re also one of the yahoos, Gordon, ruining the experience for other people who desire solitude and quiet.
I have always lived where snow in December and January is a fact of life.
Two or 3 feet is nice because we have to get plowed out.
A few inches at a time is not nice — I move that with a large push broom and shovel.
About 1959 or 1960 (+ or -) the western slopes of the Appalachian Mountains in Pennsylvania got about 2 feet New Year’s Eve. My memory of the even is vague.
Still have relatives and friends all over the East. We’ll watch this develop.
Low it is already being built inland. Cold air falls far to the south from the west. Solar activity very low.
http://images.tinypic.pl/i/00952/574s60l42hmp.png
https://earth.nullschool.net/#2017/12/23/1500Z/wind/isobaric/850hPa/overlay=mean_sea_level_pressure/orthographic=-104.35,47.97,1037
Current ozone circulation in the stratospheric polar vortex.
http://www.cpc.ncep.noaa.gov/products/stratosphere/strat_a_f/gif_files/gfs_o3mr_30_nh_f00.png
Current situation.
http://pics.tinypic.pl/i/00952/bza3k0y7o4vx.png
There will be more snow from west.
http://pics.tinypic.pl/i/00952/70gc2he1ayby.png
The Ghost of winter’s past.
White Buffalo is coming.
Ice rain in the northeast.
http://images.tinypic.pl/i/00952/ni53xeisvt5y.png
I grew up in Coeur d’Alene, Idaho but spent my career in the Midwest. After retirement it was ten years at 7800 feet in the Colorado rockies where we could get three to four feet at a time. I am now at 3000 feet in the mountains of North Carolina where we had a foot come down two weeks ago. It is all good.
Very low solar activity, The number of counts in Oulu exceeds 6,700 counts (5-min averages).
http://cosmicrays.oulu.fi/
Here’s the current forecast for Southern Vermont:
Yesterday: 5 inches of fricking wet snow.
Today: 1/2 inch of fricking freezing rain.
Tomorrow: Just fricking cloudy.
Xmas Day: 8 more inches of fricking snow.
Next day: Fricking cold,followed by even more fricking cold…
Search for and read:
Diary of a snow shoveler
[eyes porchful of shovels and chisels]
This sounds woefully familiar.
Cheers from Montana…
*chuckle*
Lmoa
What’s 10days when these geniuses can predict global warming thousands of years in advance? I too doubt they could when they can’t tell the weather next week!!!
Another one who doesn’t understand the difference between weather and climate. Probably the #1 misunderstanding of deniers.
And choosing your moments to blame weather on climate change is the #1 misappropriation of facts for “believers”.
All weather now has climate change in it. But that doesn’t mean it’s always detectable without statistical analysis. But scientists are getting better at attributing weather events. For example
“How Global Warming Fueled Five Extreme Weather Events,”
Brad Plumer, NY Times DEC. 14, 2017
https://www.nytimes.com/2017/12/14/climate/climate-extreme-weather-attribution.html
People say there is a RACE problem. People say this RACE problem will be solved when the third world pours into EVERY and ONLY into White countries.
People say the only solution to the RACE problem is if ALL and ONLY White countries “assimilate,” i.e., intermarry, with all those non-Whites.
But if I tell that obvious truth about the ongoing program of genocide against White people, Anti-Whites agree that I am a naziwhowantstokillsixmillionjews.
Anti-racist is a codeword for anti-White.
Excellent !
Please take your meds.
When I read such a brainless nonsense, I am ashamed to be a white man.
We are getting ready to start shoveling roofs, but have to ge at least 2-3 feet of snow or I wont get many calls.
This could be an epic year for my website http://roofsnowremovalct.com
I had a great year Im 2014 snow event.
Good that you are there to help. A lot of folks don’t know they need such a service.
I’ve seen a few roofs, and buildings, collapse from snow load.
Years ago, in N. Idaho where most buildings are designed to support a lot of snow, a builder put up several hay sheds that did not. When a shed went down one night, neighbors with the same sort of structure called and asked for help to clean theirs off.
It might not have gone down, but we cleaned it.
I recall measuring about 50 lbs/sq.ft. on our house. I removed about half of that and then watched the forecast. No rain, so left it alone.
Actually sent a couple guys out to Boise for a week last year and they interviewed me on the news on bend Oregon. Crazy snow event there last year.
You may have had a great time, I sure dont remember it that way and neither do a lot of other people here in Boston. Youd drive down the street and there would be 5 icicles on house after house. The newer houses with aluminum gutters attached by brakets had the gutters come down from the weight of the ice. Commercial buildings with flat roofs were collapsing from the weight of the snow and ice.
I had my gutter guy come and clean the ice out of my gutters with his steam machine because the ice had built up creating an ice dam resulting in a small water leak into the kitchen ceiling. It happened again a few weeks later but couldnt get hold of him because his voice mail was completey swamped. Eventually I found a guy who came down from Vermont to do the job. He had quite the rig complete with multiple harnesses so he didnt slide to his death off my roof, needed since Ive got one of those big old Victorians. Cash only!
It got so bad crews from as far away as Minnesota were driving in to clean roofs. They were charging outrageous rates and cleaning up but what are you going to do when your kitchen ceiling is collapsing? They thought that it was all rather funny since they use tin roofs instead of shingles out there, no ice dams possible.
Should be five foot icicles
Im based out of Connecticut and that same year that Boston Got his I had literally 50 calls a day for several weeks then I had something me guys from minisota hook up with me and they started offered steam services becuase I would shovel the roofs but as soon as it snowed again the roofs would leak becuase of the ice in the Gutters would Dam the melting snow on the roof
On the other hand, trampling on the roof can cause a leak.
Ice/icicles is a sign of poor insulation.
Opportunity to save money maybe!
Insulation just reduces heat loss. Therefore it can’t lead to a warmer house.
/sarc
New Years Eve 1963
Huntsville recorded 17.1 inches (43 cm) of snow, setting a new record for daily, weekly, and monthly snowfall.
https://en.m.wikipedia.org/wiki/New_Year%27s_Eve_1963_snowstorm
I think that will be exactly like the blizzard of 1948 in NYC and exactly 70 years later. They had to close NYC with only emergency traffic in or out.
Oh man…I’m in FL right now heading home on New Years Day, glad I left the shovels in the car at the end of the driveway….smdh
No way will NYC get a snowfall anywhere near that size.
It will be too cold so the moisture will be falling elsewhere.
Now a wave of frost reaches the Great Lakes.
http://tropic.ssec.wisc.edu/real-time/mtpw2/product.php?color_type=tpw_nrl_colors&prod=namer×pan=24hrs&anim=html5
Nothing will stop this wave.
Lakes of Erie and Ontario under the snow.
https://scontent-frx5-1.xx.fbcdn.net/v/t31.0-8/25542726_752527434953205_1932812714758534981_o.png?oh=bf51e0882e0ad1177acec38fddee5725&oe=5ACAF69E
Gee…snow in winter in the northeast… what can it be blamed on ?..hmmm.. hey how about cold weather and moisture…OH MY GOD , THE WORLD IS ENDING…. get a grip..it happens all the time …and since the beginning lf time to boot.
Oh BTW.. Global Warming.. ??? Really ???… you humans are so freaking omnipotent….wait till Jesus comes and find out.
hope gerogia gets more than 1inch!
The guy is a global warming kook, which gives him absolutely no credibility with weather or climate.
wayne…”The guy is a global warming kook, which gives him absolutely no credibility with weather or climate”.
If you’re referring to Roy, piss off. He has very accurate satellite data which he does not manipulate to show exaggerated warming like the surface stations.
No one “manipulates” data — they adjust it to correct for biases present in the raw data. The UAH group does this too.
davie, obviously you’ve never heard to the “hockey stick”.
What adjustments are in the hockey stick analysis?
you probably meant “manipulations”.
I didn’t think you had anything to offer. And I was right.
It is going to be an interesting week of wx here in Ct.
I hope we get a blizzard.
“While it is still too early to tell just where the worst weather will be, it does look like frigid air coming down from Canada…”
It’s nothing personal, Roy, we Americans (Canada) north of the border have nothing against you Americans south of the border. ☺
It’s the darned Arctic. Every year when the Sun disappears for a few months, cold air drops from the upper atmosphere, and I’ll be damned if it doesn’t push it’s way all the way south to Texas and Florida on occasion.
Please don’t believe those rumours about it melting in the Arctic. Sheer propaganda. It’s -14C in Tuktoyaktuk right now, on the Arctic Ocean by the mouth of the Mackenzie River, but, hey, winter’s just starting. In Siberia, on Christmas day, it’s expected to be -24C.
Most of us Canadian-Americans are crowded around the border with the United States-Americans, trying to keep as warm as possible. ☺
Right. This is normal weather for the N.E. in case all you mallinials snowflakes did not pay attention in your science class. Or if you were thought Common Core then I beg your pardon.
Asian countries for Asians.
Black countries for Blacks.
but White countries for everybody?
That’s genocide.
Anti-racist is a codeword for Anti-White.
My cousin was born on Christmas in 1947. Her mother cut out a news article and it is in the baby book.
North American blizzard of 1947
“The Great Blizzard of 1947 was a record-breaking snowfall that began on Christmas without prediction and brought the northeastern United States to a standstill.” [ Wikipedia ]
Weather is not climate.
Where in his statement was it claimed it was?
You’re right, it wasn’t. (Explicitly.)
Barbecue , beach, flip flops (jandels) that’s our Christmas
Regards
Harry
And Santa in a Speedo?
Hudson Bay is completely covered with ice.
http://images.tinypic.pl/i/00952/mstswpcnlnxp.png
Merry Christmas!
The Arctic wave pushes moisture over the Atlantic.
http://tropic.ssec.wisc.edu/real-time/mtpw2/product.php?color_type=tpw_nrl_colors&prod=natl×pan=24hrs&anim=html5
Now you can understand how in winter troposphere is sinking at high latitudes.
http://ds.data.jma.go.jp/tcc/tcc/products/clisys/STRAT/gif/zt_nh.gif
White Christmas will be in Chicago.
https://scontent-frx5-1.xx.fbcdn.net/v/t31.0-8/25627135_752809828258299_650098947947480061_o.jpg?oh=308a9631506b4f090fe45f73781ea58b&oe=5AC37A48
You don’t know your stuff. Dr Roy isn’t a climate alarmist type. You can count on what he says (and he didn’t say “It’s GOING TO BE A NIGHTMARE!” He said “ten days out this is what it looks like”. Big difference.
Of course. I’m just saying that with low solar activity, the jet stream in the north is very lazy.
In 5 days, circulation will probably not change much.
http://www.cpc.ncep.noaa.gov/products/stratosphere/strat_a_f/gif_files/gfs_o3mr_200_nh_f120.png
F. Leghorn….”feel ma wing, boy, ah, said, feel ma wing like ah told ya”.
“Darn boy (to Henry the chicken hawk), he’s built too close to the ground. Went right over….ah said…went right over his head”.
Henry to F. Leghorn: “Ah shut up, ya big schnook”.
La Nina is conducive to abundant rains in the Amazon.
http://tropic.ssec.wisc.edu/real-time/mtpw2/product.php?color_type=tpw_nrl_colors&prod=samer1×pan=24hrs&anim=html5
“Much of North Dakota and Minnesota on northward into the Canadian Prairies will struggle to reach the singled digits for highs through Wednesday. Cities like International Falls, Minnesota and Fargo, North Dakota will likely stay below zero degrees Fahrenheit until late week.
The last time Minneapolis had a temperature in the single digits on Christmas Day was in 1985, when the high was 8.”
http://images.tinypic.pl/i/00952/0s7md1otjzd0.png
Happy Christmas Roy and to everyone who contributes to an interesting discussion.God give us the serenity to accept the thing’s we can not change.the courage to change the thing’s we can. And the wisdom to know the difference
Merry Christmas to all.
Happy New Year.
Happy Holidays, Lewis et al.
The polar vortex in the lower stratosphere guarantees that the Arctic air will remain for a longer time in the US.
https://earth.nullschool.net/#current/wind/isobaric/70hPa/orthographic=-93.88,78.47,342
Can anybody inform me as to the effect of evaporative cooling on the earth ? Could higher temperatures cause increased rainfall in drier regions and then the evaporation of this water cool the earth ?
Stevek…”Could higher temperatures cause increased rainfall in drier regions and then the evaporation of this water cool the earth ?”
There have been no AVERAGE higher temperatures the past 18 years. We had a flat trend from 1998 – 2015 and we’re waiting to see where the 2016 El Nino warming settles out.
Don’t know about evapourative cooling per se.
Thanks. I’m just talking hypothetical, I don’t trust the measurements coming from government.
stevek…”Thanks. Im just talking hypothetical, I dont trust the measurements coming from government”.
Nor do I. I have never before seen such political correctness from governments in pushing the pseudo-science behind the catastrophic global warming theory.
Is all the ice melting and seas rising also due to political correctness? Glaciers disappearing? Flowers blooming earlier? Or are people not to believe their own eyes?
Gordon Robertson says:
“There have been no AVERAGE higher temperatures the past 18 years.”
Another lie from Gordon.
18.0-yr trend of UAH LT v6.0 global = +0.13 C/decade
DA…”18.0-yr trend of UAH LT v6.0 global = +0.13 C/decade”
The alarmist obfuscation carries on, using heinous misrepresentations of statistical analysis.
How do you fit an 18 year flat trend into your 0.13C/decade claim? And how do you prove which part is attributed to the fictitious CO2 warming?
Gordon, go learn some statistics, then you won’t make so many false statements.
Gordon Robertson says:
“How do you fit an 18 year flat trend into your 0.13C/decade claim?”
decadal trend = 10*annual trend
“And how do you prove which part is attributed to the fictitious CO2 warming?”
Never said my calculation did that — I’m just proving you wrong (again) when you wrote “There have been no AVERAGE higher temperatures the past 18 years.”
DA…”Gordon, go learn some statistics, then you wont make so many false statements”.
You’ll have to advise the IPCC do do the same. They claimed a warming hiatus from 1998 – 2012 until NOAA and the climate alarmists in the Obama admin began to rewrite the record.
Again, how can you have a 15 year flat trend within an 18 year trend of 0.13C/decade. Someone needs to study statistics and it’s not me.
DA…”decadal trend = 10*annual trend”
And if annual trend is 0 then 10*0 = 0. How do you turn that into 0.13C/decade?
We all know the 0.13C/decade trend applies to 1979 – 2017. You can take the average end points for a slope and get an approximate trend similar to yours. What good is that if there is an 18 year flat trend from 1998 – 2015?
Get my drift?
Also, If you include the early 2016 EN anomaly, there will be a trend from 1998 – 2016. We know that would not be kosher scientifically, however. We need to wait and see where the 2016 spike ends up.
December 30 may be a strong wind in the east of the US.
https://earth.nullschool.net/#2017/12/30/0000Z/wind/isobaric/850hPa/overlay=mean_sea_level_pressure/orthographic=-92.47,37.37,1191
Current temperature in North America.
http://files.tinypic.pl/i/00952/4xmr4t9t1u24.png
Is the temperature in Minneapolis tomorrow will decline?
http://files.tinypic.pl/i/00953/ytrmcphgrbiw.png
It is worth to note.
http://pics.tinypic.pl/i/00953/f9t9t3hpcswg.png
It is not — it has nothing to do with the topic of this post.
davie, did you flash your badge?
(You have such fantasies of being a cop. Maybe massive transfusions of both brains and testosterone?)
Hilarious.
ren…”It is worth to note”.
Ignore Appell, he’s an alarmist troll.
Indeed he is a troll. I saw that he was angry at you for disturbing the solitude and quiet in the mountains because you cross country ski. He must have missed his anger management and anti-psychotic meds.
realoldone…”I saw that he was angry at you for disturbing the solitude and quiet in the mountains because you cross country ski”.
It’s a comprehension issue with DA, he tends to skim and rush to conclusions. Actually, I was complaining about the noise and machine intrusion as well, never mind the chance of being run over by machines where they don’t belong, or trapped by an avalanche set off by the yahoos DA accused me of being.
The current temperature in Canada competes with the temperature in Siberia.
The forecast of ozone circulation shows that the polar vortex is cut off to the north of Alaska.
http://www.cpc.ncep.noaa.gov/products/stratosphere/strat_a_f/gif_files/gfs_o3mr_30_nh_f120.png
Sorry.
http://files.tinypic.pl/i/00953/6ud91iuug1vj.png
Shown here is an example 50-km Sea Surface Temperature (SST) Anomaly product map. Click the image for more information and a larger view of the latest near-real-time 50-km SST Anomaly data.
To calculate a sea surface temperature (SST) anomaly, we first needed to know the long-term mean SSTs globally. We took almost 10 years of NOAA polar-orbiting satellite SST measurements and calculated the mean SSTs in each month for every ocean pixel around the world. These monthly means are called the SST “climatology” and are available on our website. We use the SST climatology to calculate the twice-weekly 50-km SST Anomaly product, which identifies where the SST is different from the normal conditions for that day of the year.
http://www.ospo.noaa.gov/data/sst/anomaly/2017/anomnight.12.25.2017.gif
http://pics.tinypic.pl/i/00953/o2e43xtqqqu6.png
ren…”To calculate a sea surface temperature (SST) anomaly, we first needed to know the long-term mean SSTs globally. We took almost 10 years of NOAA polar-orbiting satellite SST measurements and calculated the mean SSTs in each month for every ocean pixel around the world”.
NOAA cheaters. They use their satellites, which provide UAH with their data, for SST estimations, then ignore their own sat data while fudging the surface record to show warming.
How does NOAA get SSTs in the Arctic during winter when 90% of the Arctic Ocean is covered in ice?
And why does anyone need to ‘calculate’ an SST? One reason: NOAA needs to fudge the temperatures to show warming.
NOAA adjusts to remove biases.
So does UAH. So you’re calling Roy a “cheater.”
DA…”NOAA adjusts to remove biases.
So does UAH. So youre calling Roy a cheater.”
You’re the one trying to compare the integrity of UAH to the flagrant cheating of NOAA. UAH makes necessary adjustments for matters like orbital drift and they state an error margin. Even when orbital errors were revealed by RSS circa 2005, the error was still within the margin stated by UAH. Alarmist have taken an insignificant error and amplified it out of proportion.
NOAA cuts out 75% of the real data it receives and synthesizes it in a climate model using less than 25% of the real data. Since they use a climate model they must supply a confidence level to corroborate their claims. NOAA goes to great lengths to hide it’s confidence levels, having once claimed a CL of 48% when it claimed 2014 as the warmest year ever.
UAH had 2014 in 4th place but it was still way below the real warmest years of 1998, 2010, and 2016.
NOAA lied. WHY???
Chicago, Illinois temperature.
http://www.intellicast.com/Local/Weather.aspx?unit=C&location=USIL0225
Chicago, Illinois temperature.
Partly Cloudy
-17C
Feels Like: -26
Wind Chill: -26 Ceiling: NA
Heat Index: -17 Visibility: 16.09k
Dew Point: -22 Wind: 18kph
Humidity: 64% Direction: 290WNW
Pressure: 1034.54mbar Gusts: NA
As of his last “Saturday Summary” Joe Bastardi was saying that blizzard like conditions could extend west through Indiana.
Here in north central Indiana we had our first White Christmas in quite a few years. And with the highs forecast to remain well below freezing with lows running down well below 0 F forecast it looks like we’ll still have snow on the ground when this next one comes through.
Meanwhile I keep seeing articles being published that claim the Arctic is melting away even though temps are running well below 0. As I write this current conditions at Summit Station, Greenland show:
Conditions
-50 C -58 F
5.0 knots
157 degrees SSE
http://www.summitcamp.org/status/webcam/
RAH
I’m not sure about land ice, but I think what’s happening WRT Arctic sea ice is not being reported correctly.
Recent winters there have been much warmer than in the past, meaning less water turns to ice. Summer temperatures, OTOH, have been mostly unchanged, which makes me think the rate of melting has been mostly unchanged as well.
Less and less ice, but not “melting away”.
snape…”Recent winters there have been much warmer than in the past…”
You mean -45C as opposed to -50C???
Either way, that’s cold enough to freeze Arctic salt water to depths of 3 metres, as was the case last January.
How exactly does an Arctic winter get warmer when there is no significant solar energy for 5 months of the year? If you look at the UAH maps showing the warming, there are +5C locales that move around each month. How does CO2 manage that kind of warming?
Gordon asks, “How exactly does an Arctic winter get warmer when there is no significant solar energy for 5 months of the year?”
That’s a good question. Something else to ponder: in summer, when the sun never sets, arctic temperatures have been steady as a rock.
On the left side of the page, you can click on yearly temperature graphs going back to 1958, but similar to each of the last 20 years or so, 2017 saw dramatic winter warming accompanied by remarkably stable summer temps:
http://ocean.dmi.dk/arctic/meant80n.uk.php
Here you can see today’s temperature anomalies at 2 meters over the Arctic Ocean. A large section is 10 to 20 degrees Celsius warmer than the baseline. It’s been that way since September:
http://pamola.um.maine.edu/wx_frames/gfs/arc-lea/t2anom/2017-12-27-12z/00.png
Exactly Snape! And let me add that anybody not understanding the graph you show here in fact does not want to understand it.
Arctic melting has not so much to do with solar irradiance levels, but rather primarily with increasing poleward heat advection. All Lindzen’s disciples should know that by heart.
It is good to know that this is not happening in the Antarctic. One side is enough.
Bindidon
Looking at temperature anomalies, my guess is summer melting has on average been fairly constant, but because of warmer winters, there has been less ice to start with at the beginning of each melting season.
You make a good point about the Antarctic.
Snape says:
“On the left side of the page, you can click on yearly temperature graphs going back to 1958, but similar to each of the last 20 years or so, 2017 saw dramatic winter warming accompanied by remarkably stable summer temps:
http://ocean.dmi.dk/arctic/meant80n.uk.php”
Visually inspecting graphs is not the way to determine trends. You have to use statistics.
David
I haven’t been able to find the statistics. There’s this, a bit vague though:
“One of the key features of amplified Arctic warming concerns Arctic winter warming (AWW), which exceeds summer warming by at least a factor of 4. ”
https://www.nature.com/articles/srep01556
Maybe Bindidon could help?
Snape on December 28, 2017 at 11:11 PM
Maybe Bindidon could help?
Sorry Snape for the later answer, I had no time free today for that.
When you look at monthly surface temperatures for specific regions or latitude bands in ASCII text form, the best is to use NOAA (don’t mind about the irrelevant meaning of any troll concerning NOAA’s data, that’s all ignorant and paranoid blah blah).
Here you find all you need (tinyURL links due to the delta charlie syndrome on this site):
http://tinyurl.com/ybr2ete6
And therein for example monthly data for 60N-90N:
http://tinyurl.com/y6um3j2l
*
Here is a chart with a plot of the anomalies wrt UAH’s climatology together with Excel’s 60 month running mean:
http://4GP.ME/bbtc/1514590562460.jpg
Linear least squares estimates in C / decade with 2 sigma CI computed by Excel:
– 1880-2010: 0.11 +- 0.01
– 1979-2017: 0.43 +- 0.03
(In comparison, TLT: UAH has 0.25 C /decade, RSS3.3 and RSS4.0 both 0.35 C.)
*
When you sort these Arctic anomalies by descending order, you see that the top 50
– does not contain even one month outside of nov-dec-jan-feb-mar-apr;
– contains 27 anomalies of years starting with 2000.
And, interesting as well:
– the top 10 contains 4 (!) anomalies of the 1930’s.
Thank you, Bin. The 30’s anomalies you noticed is quite interesting!
Indeed Snape. But please keep in mind that globally, these years do not appear in the top 50 of any institution.
The Dust Bowl brought many record daily high temperatures which, when averaged over the year, became simply insignificant.
The narrative of many Americans views still today 1934 as the world’s highest year evah. But that’s a mirage due to charts published in the 1970’s – even in the CONUS.
Bin
Don’t worry, I’ve had more than one argument with nitwits about the dust bowl years.
binny…”Arctic melting has not so much to do with solar irradiance levels, but rather primarily with increasing poleward heat advection. All Lindzens disciples should know that by heart”.
Which makes it clear that any melting Arctic ice has nothing to do with CO2 warming.
Of course, the melting has not so much to do with a lack of solar irradiance. It happens in the summer months when solar radiation is plentiful for that part of the planet. All I am saying is that the 5 months or so of a lack of significant solar energy turns the Arctic into a frozen tundra, oblivious to any increase in CO2.
Gordon, with no sun for 5 months, why doesn’t the Arctic temperature approach absolute zero?
DA…”Gordon, with no sun for 5 months, why doesnt the Arctic temperature approach absolute zero?”
Obviously because the Arctic Ocean is connected to the warmer Pacific and Atlantic Oceans. Also, because the Arctic atmosphere is connected to the rest of the warmer atmosphere.
Even though solar energy is not warming the Arctic part of the year, it is still warming the rest of the planet. Heat gets transferred from the warmer parts.
The cold air that freezes the Arctic descends from higher in the atmosphere once the surface loses it solar energy.
Gordon, do you have a citation for this:
“The cold air that freezes the Arctic descends from higher in the atmosphere once the surface loses it solar energy.”
I thought the arctic surface was loosing energy to space (at a reduced rate nowadays).
https://tinyurl.com/ybmnmo4t
“However, something quite different happens regularly in the Arctic during the non-summer months: the temperature increases with height!”
https://tinyurl.com/ybmr7emx
“The air near the surface tends to be colder and more dense than air higher up”
…
Svante
Yes you show that Gordon Robertson was trying to get away with making up his own physics again. I guess he has to do this because he does not think radiant cooling plays any role in surface cooling.
As long as the fringe skeptics have this compulsion to reject established science in favor of their own make believe versions, they tend to discredit the legitimate skeptics of AGW extreme views (catastrophic type) Sometimes referred to as CAGW. I am somewhat of a skeptic but I would not want to be lumped in the group of g*e*r*a*n, Gordon Robertson, J Halp-less…any of those that need to make up their own brand of pseudoscience and pretend that they are using well established science. These types reject experimental evidence, actual empirical data and any valid textbook explanation of physics. Nothing can help them, they so much believe their false physics you can’t change their view even when showing them direct evidence they are wrong.
rah…”Meanwhile I keep seeing articles being published that claim the Arctic is melting away….”
What they conveniently fail to inform is that the warming applies only to 1 month of Arctic summer and in locales that move around month to month. That strongly suggests weather issues related to ocean and wind currents.
For at least 5 months of the year, the Arctic has no significant solar energy. There is no way ice will melt under those conditions.
RAH
Gordon proclaims: “What they conveniently fail to inform is that the warming applies only to 1 month of Arctic summer…….”
Gordon has failed to inform you he’s an idiot.
snape…”Gordon proclaims: What they conveniently fail to inform is that the warming applies only to 1 month of Arctic summer.
Gordon has failed to inform you hes an idiot”.
If you are going to call me an idiot you need a basis for it, otherwise you appear like an idiot. The warming that melts Arctic ice applies mainly to the 1 month of Arctic summer. After that, ice begins reforming.
Reforming, but monthly Arctic sea ice extent and volume have negative trends for all 12 months of the year — I gave you these results earlier.
Gordon
Most of your comments are BS, the above no exception. Just trying to warn RAH.
Gordon
Melt season is the period between max and minimum extent, usually mid March to mid September:
http://ocean.dmi.dk/arctic/plots/icecover/osisaf_nh_iceextent_daily_5years_en.png
snape…”Melt season is the period between max and minimum extent, usually mid March to mid September…”
Maybe you could advise the explorers I have read who were freezing their butts off well into April. Typical March temps between the Canadian mainland and the NP were -30C. That’s why they go out on the ice in February and March if they’re smart. They know it will likely remain frozen all the way to the Pole.
If it interests you, look up the times of year when the Arctic is above 0C. That’s the melting point for salt-free water but even salt-water freezes around -2C. Freezing it to a depth of 3 metres takes a lot of cold weather and melting 3 metres of ice takes a lot of warming.
I can tell I’m getting to you with my truthful version of science when you start telling others I am talking bs. Frustration leads to that as the truth begins to sink in.
Photographs and satellite measurements are not the truth?
An account of one season, many years ago, is the only evidence to be trusted?
More reason to call you an idiot.
Oh yeah, the same DMI chart shows the average arctic mean above 0 Celsius for around 70 days (~day 160 – 230). Longer, of course, for temperatures above salt water freezing point.
http://ocean.dmi.dk/arctic/plots/meanTarchive/meanT_2017.png
Gordon Robertson says:
“For at least 5 months of the year, the Arctic has no significant solar energy. There is no way ice will melt under those conditions.”
False.
More downwelling IR and warmer oceans melt Arctic ice too. Do I need to again quote you the monthly trends in Arctic sea ice extent and sea ice volume?
DA…”Gordon Robertson says:
For at least 5 months of the year, the Arctic has no significant solar energy. There is no way ice will melt under those conditions.
False”.
So much for Appell’s understanding of science. A grade 8 student could point out the flaw in your rebuttal.
More downdwelling IR melting ice when the ambient temperature is -40C???
You are seriously desperate, David, better switch sides, it’s a lot easier dealing with real science.
I have read several books on explorers trying to reach the NP under those conditions. They were not thanking increased IR from a theoretical global warming, they were freezing their butts off, trying to fight off hypothermia and frostbite.
Yes, more downwelling IR from the increasing amount of GHGs in the atmosphere. More IR = more heat.
And a warmer ocean melting sea ice from below.
DA…”Yes, more downwelling IR from the increasing amount of GHGs in the atmosphere. More IR = more heat.
And a warmer ocean melting sea ice from below”.
You still have not explained how heat transfer from a colder atmosphere to a warmer surface works. If you can, maybe you could challenge the 2nd law.
How does an ocean get warmer when the ambient temperature above is cold enough to form 3 metres of ice in salt water?
The frost moves to the Great Lakes.
http://files.tinypic.pl/i/00953/8wtxsnsn5kw4.png
Siberian frost in Canada.
https://scontent-frx5-1.xx.fbcdn.net/v/t31.0-8/26114537_753689431503672_5617264139551981158_o.png?oh=c4ef03c1b27c31ee3caf745ac38e502f&oe=5ABF03E5
This AGW/GHE stuff sure is tricky–long term cold and snow records being broken. Very tricky.
It’s almost as if the AGW/GHE wasn’t even there. ..
http://abcnews.go.com/US/bitter-cold-snow-expected-snapping-christmas-day-records/story?id=51992925
Co2 makes -10 C nights “feel” 1/2 a degree warmer from all the downwelling IR. It’s like a warm cozy blanket, (sarc)
Your understanding of the greenhouse effect is weak.
The IPCC/AGW/”back-radiation/GHE is easy to understand. It’s just WRONG.
But, it is hard to keep up with all of the new “adjustments” to the theory, because the original is not working.
g*r…”But, it is hard to keep up with all of the new adjustments to the theory, because the original is not working”.
It’s called ‘moving the goalposts’. When one outrageous theory does not work, create another one.
Still haven’t understood the necessity of adjustments yet, huh Gordon? Read and learn:
“Thorough, not thoroughly fabricated: The truth about global temperature data: How thermometer and satellite data is adjusted and why it *must* be done,” Scott K Johnson, Ars Technica 1/21/16.
http://arstechnica.com/science/2016/01/thorough-not-thoroughly-fabricated-the-truth-about-global-temperature-data/
DA…”why it *must* be done…”
Scott Johnson is an alarmist toady. He points out the fraud committed by NOAA and says nothing about it.
Why would anyone want to go back to 1998 and erase the flat trend, especially when the original NOAA data supported the flat trend???
Be honest. It was done to promote a failing AGW theory for the Obama administration.
And STILL you refuse to learn why adjustments are necessary.
Why don’t you read the article?
I suspect this obstinacy is a lifelong trait of yours, Gordon. It shows in your poor understanding of almost every scientific topic that has come up on this blog.
Wow! The worldwide reknowned climate superspecialist g*e*r*a*n confounding climate and weather?
Eh ben dis donc! C’est du tout nouveau, ma parole. Ich bin sprachlos.
We have to remember homeless people when it is so cold.
https://www.msn.com/en-gb/news/newsbirmingham/why-im-homeless-at-christmas-rough-sleepers-reveal-heartbreak-stories/ar-BBHbKTH?li=BBoPWjQ&ocid=wispr
Look at the pressure.
https://earth.nullschool.net/#current/wind/isobaric/500hPa/overlay=mean_sea_level_pressure/orthographic=-104.44,81.17,298
Thank you donald penman for your comment. These people do not need -50 C to get dying!
What scares me is the intolerance of many better-off young people who are hunting for them everywhere, especially in… Russia.
Pressure forecast on December 31, 2017.
https://earth.nullschool.net/#2017/12/31/0900Z/wind/isobaric/850hPa/overlay=mean_sea_level_pressure/orthographic=-103.06,48.09,786/loc=-90.244,48.774
I might be mistaken but I think the intense cold might be spreading from Siberia to Europe and Scandinavia.
http://www.intellicast.com/Global/Temperature/Current.aspx
You need to see how the polar vortex in the stratosphere works. It is important to understand that the polar vortex pattern is extremely durable (with constant solar activity).
https://earth.nullschool.net/#current/wind/isobaric/10hPa/orthographic=-112.09,59.21,298
It seems to me that in Europe there will be a lot of snow first, because the eastern Arctic is not covered with ice.
http://images.tinypic.pl/i/00953/8ycnzy3jscs3.png
The topic of this post is the US east coast. Be decent and try to respect that.
davie, when did Dr. Roy appoint you enforcer for his blog?
Since the only thing appelll can bring to the current topic of debate is the coffee.
He lives in a greenhouse. Boiling water for Coffee will cause increased condensation on his windows.
It clouds his perception of reality.
Apple does the best he can.
Since his own blog has no followers (one can only wonder why) he must come here to get attention.
Lewis: I blog very little anymore. But thanks for checking up on my blog.
lewis…”Apple does the best he can.
Since his own blog has no followers (one can only wonder why) he must come here to get attention”.
I think he comes here to learn science but his denial factor is holding him back.
Will the temperature in the northern US fall below -40 C?
https://scontent-frx5-1.xx.fbcdn.net/v/t31.0-8/25791176_753944651478150_3738548752505627960_o.png?oh=34af44e7c2a3295a09c85b01ca63ddf3&oe=5AFE7520
Well, Mr Appell, it is already hard enough to have to read your teachy and alarmist stuff all the time.
But your feldwebel-like command tone you should really spare us!
Thanks in advance.
binny…”But your feldwebel-like command tone you should really spare us!”
Good to see we agree on some things. I quite liked the German national soccer team that beat Holland in the 1974 World Cup. Loved Gertie Mueller, Bertie Vogts, der Kaiser, Paul Breitner, etc. Of course, I thought Johann Cruyff of the Netherlands was a genius.
https://en.wikipedia.org/wiki/1974_FIFA_World_Cup_Final
It’s ridiculous the way modernists have tried to fit the positions in those days to the modern garbage style, as depicted at the link. Bertie Vogts a Right Back???? Nonsense, he was a right-half. Johann Cruyff a centre-forward??? Rubbish. He was a mid-fielder, likely a centre-half, always played out of mid-field his entire career.
Johnny Rep was the Dutch centre-forward. Mind you, the Dutch played a revolutionary style in those days that was often called a whorl defense.
Does galactic radiation and the Earth’s magnetic field influence the distribution of ozone in the mesosphere? I think so. Below is the distribution of ozone at the top of the stratosphere.
https://scontent-frx5-1.xx.fbcdn.net/v/t1.0-9/26167007_753928051479810_2265659723271309546_n.png?oh=d40c4d41e3cb2021a428d621e9c01a41&oe=5ACAEF2A
The NAIRAS model predicts atmospheric radiation exposure from galactic cosmic rays (GCR) and solar energetic particle (SEP) events. GCR particles are propagated from local interstellar space to Earth using an extension of the Badhwar and O’Neill model, where the solar modulation has been parameterized using high-latitude real-time neutron monitor measurements at Oulu, Thule, Lomnicky, and Moscow. During radiation storms, the SEP spectrum is derived using ion flux measurements taken from the NOAA/GOES and NASA/ACE satellites. The cosmic ray particles – GCR and SEP – are transported through the magnetosphere using the CISM-Dartmouth particle trajectory geomagnetic cutoff rigidity code, driven by real-time solar wind parameters and interplanetary magnetic field data measured by the NASA/ACE satellite. Cosmic ray transport through the neutral atmosphere is based on analytical solutions of coupled Boltzmann transport equations obtained from NASA Langley Research Center’s HZETRN transport code. Global distributions of atmospheric density are derived from the NCEP Global Forecasting System (GFS) meteorological data.
http://sol.spacenvironment.net/nairas/Dose_Rates.html
Is cosmic radiation affects the polar vortex pattern? I think so. This is currently experienced by North America.
http://files.tinypic.pl/i/00953/cq5zhfz9e8n5.png
Snow is coming to Huntsville.
Current temperature in Indianapolis.
http://files.tinypic.pl/i/00953/0kpznto4rall.png
The New Year may be cold in New York.
https://scontent-frx5-1.xx.fbcdn.net/v/t31.0-8/26060013_754057584800190_5602786287255125210_o.png?oh=1c1d23c1a96c8890a6fdb5239e0edea7&oe=5AB455ED
In the north-east it is deeper low. It can be the cause of strong wind in the east of North America.
https://earth.nullschool.net/#2017/12/27/2100Z/wind/isobaric/850hPa/overlay=mean_sea_level_pressure/orthographic=-116.07,56.16,684/loc=-52.770,54.252
Sorry.
https://earth.nullschool.net/#2018/01/01/1200Z/wind/isobaric/850hPa/orthographic=-94.00,46.92,684
Hey Doc, are you going to do an update on this item at 5 days out?
Here is a detailed update from CrankyWXGuy, who does a good job.
http://www.stormhamster.com/e122717.htm
My expert opinion:
Nahhhhhhh.
Snowfall totals beyond day 5 are generally very unreliable.
Here in St. Louis, we had a white Christmas! It was the first white Christmas since 2010, and historically there’s a 20% chance. It’s been a good year!
Merry Christmas and Happy New Year, Dr. Spencer!
Dr. Spencer in the New Year there will be snow and frost in Huntsville.
ren…”Dr. Spencer in the New Year there will be snow and frost in Huntsville”.
As a Canadian I must take part of the blame for that. We are sending the cold air down to them thar hills in Alabamy. It’s a reprisal for the Yanks calling themselves America while excluding us Canucks. ☺
Temperature in Canada.
http://files.tinypic.pl/i/00953/g2tdq430bf3y.png
Houston forecast is below freezing early next week.
What about Chisec, Guatemala?
DA…”What about Chisec, Guatemala?”
DA is in denial. He knows AGW is failing big-time and he tries to divert attention away from the obvious.
Exactly how often is the temperature below freezing in Houston?
Will Erie snow again?
http://files.tinypic.pl/i/00953/cxkanfdikt4t.png
https://wattsupwiththat.com/2017/12/28/the-end-of-the-end-of-winter/comment-page-1/#comment-2703533
The cold from Canada and snowstorms reach the Great Prairies.
http://files.tinypic.pl/i/00953/w6gj4ryxc227.jpg
https://www.accuweather.com/en/us/sioux-falls-sd/57103/weather-radar/330686
Temperature in New York (F).
http://files.tinypic.pl/i/00953/qevpb4rt7b21.png
Temperature forecast on January 1, 2018.
https://earth.nullschool.net/#2018/01/01/0600Z/wind/isobaric/1000hPa/overlay=temp/orthographic=-103.44,43.73,903
overall sea surface temperatures down to +.152c
The cooling is coming.
Salvatore
Bring it on! I’m a snow lover, and nothing but rain in my neck of the woods.
Salvatore, La Nińa is doing its job. The wind is along the equator towards the Philippines.
http://www.ospo.noaa.gov/data/sst/anomaly/2017/anomp.12.28.2017.gif
Pacific delivers snow to the northern US.
http://pics.tinypic.pl/i/00953/ryuaixu2cos5.png
Unfortunately true…
A colder planet is much more dangerous than a warmer one …
If only we could prevent it by adding co2 ….
Yes Salvatore! But here in northern Germany, we experience since years rainy, windy, mild winters as opposed to what we had since long time ago: cold, icy, snowy.
Polar vortex is locked very high, at the very top of the stratosphere (1 mbar).
http://pics.tinypic.pl/i/00953/0fucngfryfyz.png
Yet more incontrovertible proof of catastrophic anthropogenic climate manipulation manifesting as sharply increasing linearly progressing global temperature increase.
Maybe someone could tackle this question raised recently by Svante. He is convinced that the IR spectra revealed from space of the surface IR emissions is proof of CO2 absorp-tion in the atmosphere but I’m not so sure.
Unfortunately, alarmist climate scientists have modeled the surface on a blackbody level and treated the surface 260 W/m^2 (or whatever it is) emissions as typical of a blackbody radiating at the surface average temperature. But is it typical?
A blackbody is theoretically supposed to absorb and emit all frequencies of EM. The sun approaches that ideal because it has a very high temperature capable of emitting very broadband EM frequencies. The Sun has also a very simple composition, made up basically of hydrogen and helium. Both of those elements at very high temperatures seem capable of radiating across the entire EM IR band.
How about the Earth’s surface? It is made up 70% of water. The rest is a vast conglomeration of materials ranging from grass, trees, and other vegetation, to sand, soil, ice, granite, and many other materials.
Exactly how does that myriad of elements and materials radiate in an IR band designated by a theorized blackbody at around 288K on average?
Could it be that in their zeal to establish their surface blackbody emission curve they have overlooked a few major matters? If they are looking for an IR response from the surface that fits their theory, I am sure they can find evidence by looking myopically and with bias.
What if the surface is radiating at a myriad of frequencies outside the blackbody curve ‘derived’ for the surface? I don’t think anyone has really tried to measure one.
Infrared spectrometers appear to be very finicky devices in that none of them cover the entire IR spectrum. Has anyone tried to measure the entire emission spectrum of the surface?
Tackled here:
http://www.drroyspencer.com/2017/12/major-east-coast-snowstorm-for-new-years-eve/#comment-278112
The snowstorm is approaching Erie and Buffalo.
http://files.tinypic.pl/i/00953/2frtl749mxu5.png
Again, heavy snow in Erie.
http://www.yourerie.com/skycam-cameras/erie-international-airport-tom-ridge-field-skycam
Watson Lake, Canada
Current Conditions – F | C As of 11:55 AM on Friday 29 Dec 2017 (Local Time)
Local Reporting Station
Fair Fair
-42C
Feels Like: -42
Wind Chill: -42 Ceiling: NA
Heat Index: -42 Visibility: 16.09k
Dew Point: -47 Wind: 0kph
Humidity: 77% Direction: 270W
Pressure: 1046.06mbar Gusts: NA
Please pay attention to the pressure.
Sorry for posting this twice. Somehow it got posted in a reply to Bil Danielson and I had intended it as a new post.
Maybe someone could tackle this question raised recently by Svante. He is convinced that the IR spectra revealed from space of the surface IR emissions is proof of CO2 absorp-tion in the atmosphere but Im not so sure.
Unfortunately, alarmist climate scientists have modeled the surface on a blackbody level and treated the surface 260 W/m^2 (or whatever it is) emissions as typical of a blackbody radiating at the surface average temperature. But is it typical?
A blackbody is theoretically supposed to absorb and emit all frequencies of EM. The sun approaches that ideal because it has a very high temperature capable of emitting very broadband EM frequencies. The Sun has also a very simple composition, made up basically of hydrogen and helium. Both of those elements at very high temperatures seem capable of radiating across the entire EM IR band.
How about the Earths surface? It is made up 70% of water. The rest is a vast conglomeration of materials ranging from grass, trees, and other vegetation, to sand, soil, ice, granite, and many other materials.
Exactly how does that myriad of elements and materials radiate in an IR band designated by a theorized blackbody at around 288K on average?
Could it be that in their zeal to establish their surface blackbody emission curve they have overlooked a few major matters? If they are looking for an IR response from the surface that fits their theory, I am sure they can find evidence by looking myopically and with bias.
What if the surface is radiating at a myriad of frequencies outside the blackbody curve derived for the surface? I dont think anyone has really tried to measure one.
Infrared spectrometers appear to be very finicky devices in that none of them cover the entire IR spectrum. Has anyone tried to measure the entire emission spectrum of the surface?
Some information for trolls who feel the need to repeatedly bore us with their endless ‘I am not so sure’, ‘How about’, ‘seems’, ‘Could it be’, ‘What if’ etc etc etc, what indeniably shows us their lack of precisely that knowledge allowing them to write ‘It is!’ or ‘It is not!’ instead.
1. Ocean surface
http://tinyurl.com/yd2o73h5
2. Land surface
http://cimss.ssec.wisc.edu/iremis/baseline_viewer/
http://tinyurl.com/yaa4d7ha
The principal characteristics of trolls operating on science sites are
– to solely base comments on unverified assumptions;
– never to learn from any contradiction to their assumptions.
binny…”The principal characteristics of trolls operating on science sites are
to solely base comments on unverified assumptions;
never to learn from any contradiction to their assumptions”.
You are facing demotion from idiot to all around ***hole.
I am not interested in hearing outright garbage from an alarmist idiot.
In other words, you have made no attempt whatsoever to answer my questions from a scientific POV. All you have done is appeal to authority.
Say it in your own words from your own understanding.
As usual: insults.
Oh and let me add that, exactly as this commenter named SkepticGoneAllButWild, you aren’t even courageous enough to insult without hiding. You insult behind star characters, like a coward.
I am convinced that persons insulting others like you do perfectly show what they themselves are.
You can insult me as often as you want: you can’t change anything that way (excepted maybe an increase of those persons who do not not appreciate you insulting everybody thinking different).
You pretend I wouldn’t respect Roy Spencer and John Christy. This one more of your disgusting lies.
You are this person, in fact.
Came across this interview with Richard Lindzen on the propaganda of the 97% of scientists agree issue.
http://www.climatedepot.com/2016/02/15/mit-climate-scientist-dr-richard-lindzen-mocks-97-consensus-it-is-propaganda/
Lindzen is one of the only sane and measured voices out there on global warming.
Dr. Lindzen ‘agrees that carbon dioxide is a greenhouse gas, calling people who dispute that point “nutty”‘.
svante..”Dr. Lindzen agrees that carbon dioxide is a greenhouse gas, calling people who dispute that point nutty.”
What he is claiming is obvious. Anyone disputing that CO2 can absorb IR is nutty. I don’t know anyone who does that.
I dispute the use of the term greenhouse gas. As Joe Postma put it, we build greenhouses to do what the atmosphere cannot do. It’s ridiculous calling CO2 a greenhouse gas when it has no effect on warming.
Lindzen admitted the current GHE theory is inadequate and that CO2 cannot act as a blanket to trap heat.
svante…typo alert…
Obviously “Anyone disputing that CO2 can absorb IR is nutty”.
Meant to say, “Anyone disputing that CO2 cannot absorb IR is nutty”.