The 100th Meridian Agricultural Scare: Another Example of Media Hype Exceeding Reality

April 18th, 2018 by Roy W. Spencer, Ph. D.

A new paper published in the AMS Earth Interactions entitled, Whither the 100th Meridian? The Once and Future Physical and Human Geography of America’s Arid-Humid Divide, Part II: The Meridian Moves East, discusses the climate model-expected drying of the western U.S. and how this will affect the agricultural central- and east- U.S. as the climatological boundary roughly represented by the 100th Meridian moves eastward.

This paper has become a good example of media hype overwhelming actual substance. For example, take this headline from Doyle Rice at USAToday on April 13,

“A major climate boundary in the central U.S. has shifted 140 miles due to global warming”

So, what’s wrong with the headline? Nowhere in the original scientific study can I find any observational evidence of such a shift.

The fact is, the study is a modeling study — not observational. They tell us what might happen in the coming decades, given certain (and numerous) assumptions.

Since I’ve been consulting for U.S. grain interests for the last seven or eight years, I have some interest in this subject. Generally speaking, climate change isn’t on the Midwest farmers’ radar because, so far, there has been no sign of it in agricultural yields. Yields (production per acre) of all grains, even globally, have been on an upward trend for decades. This is fueled mainly by improved seeds, farming practices, and possibly by the direct benefits of more atmospheric CO2 on plants. If there has been any negative effect of modestly increasing temperatures, it has been buried by other, positive, effects.

And so, the study begs the question: how has growing season precipitation changed in this 100th meridian zone? Using NOAA’s own official statewide average precipitation statistics, this is how the rainfall observations for the primary agricultural states in the zone (North and South Dakota, Nebraska, Kansas, and Oklahoma) have fared every year between 1900 and 2017:

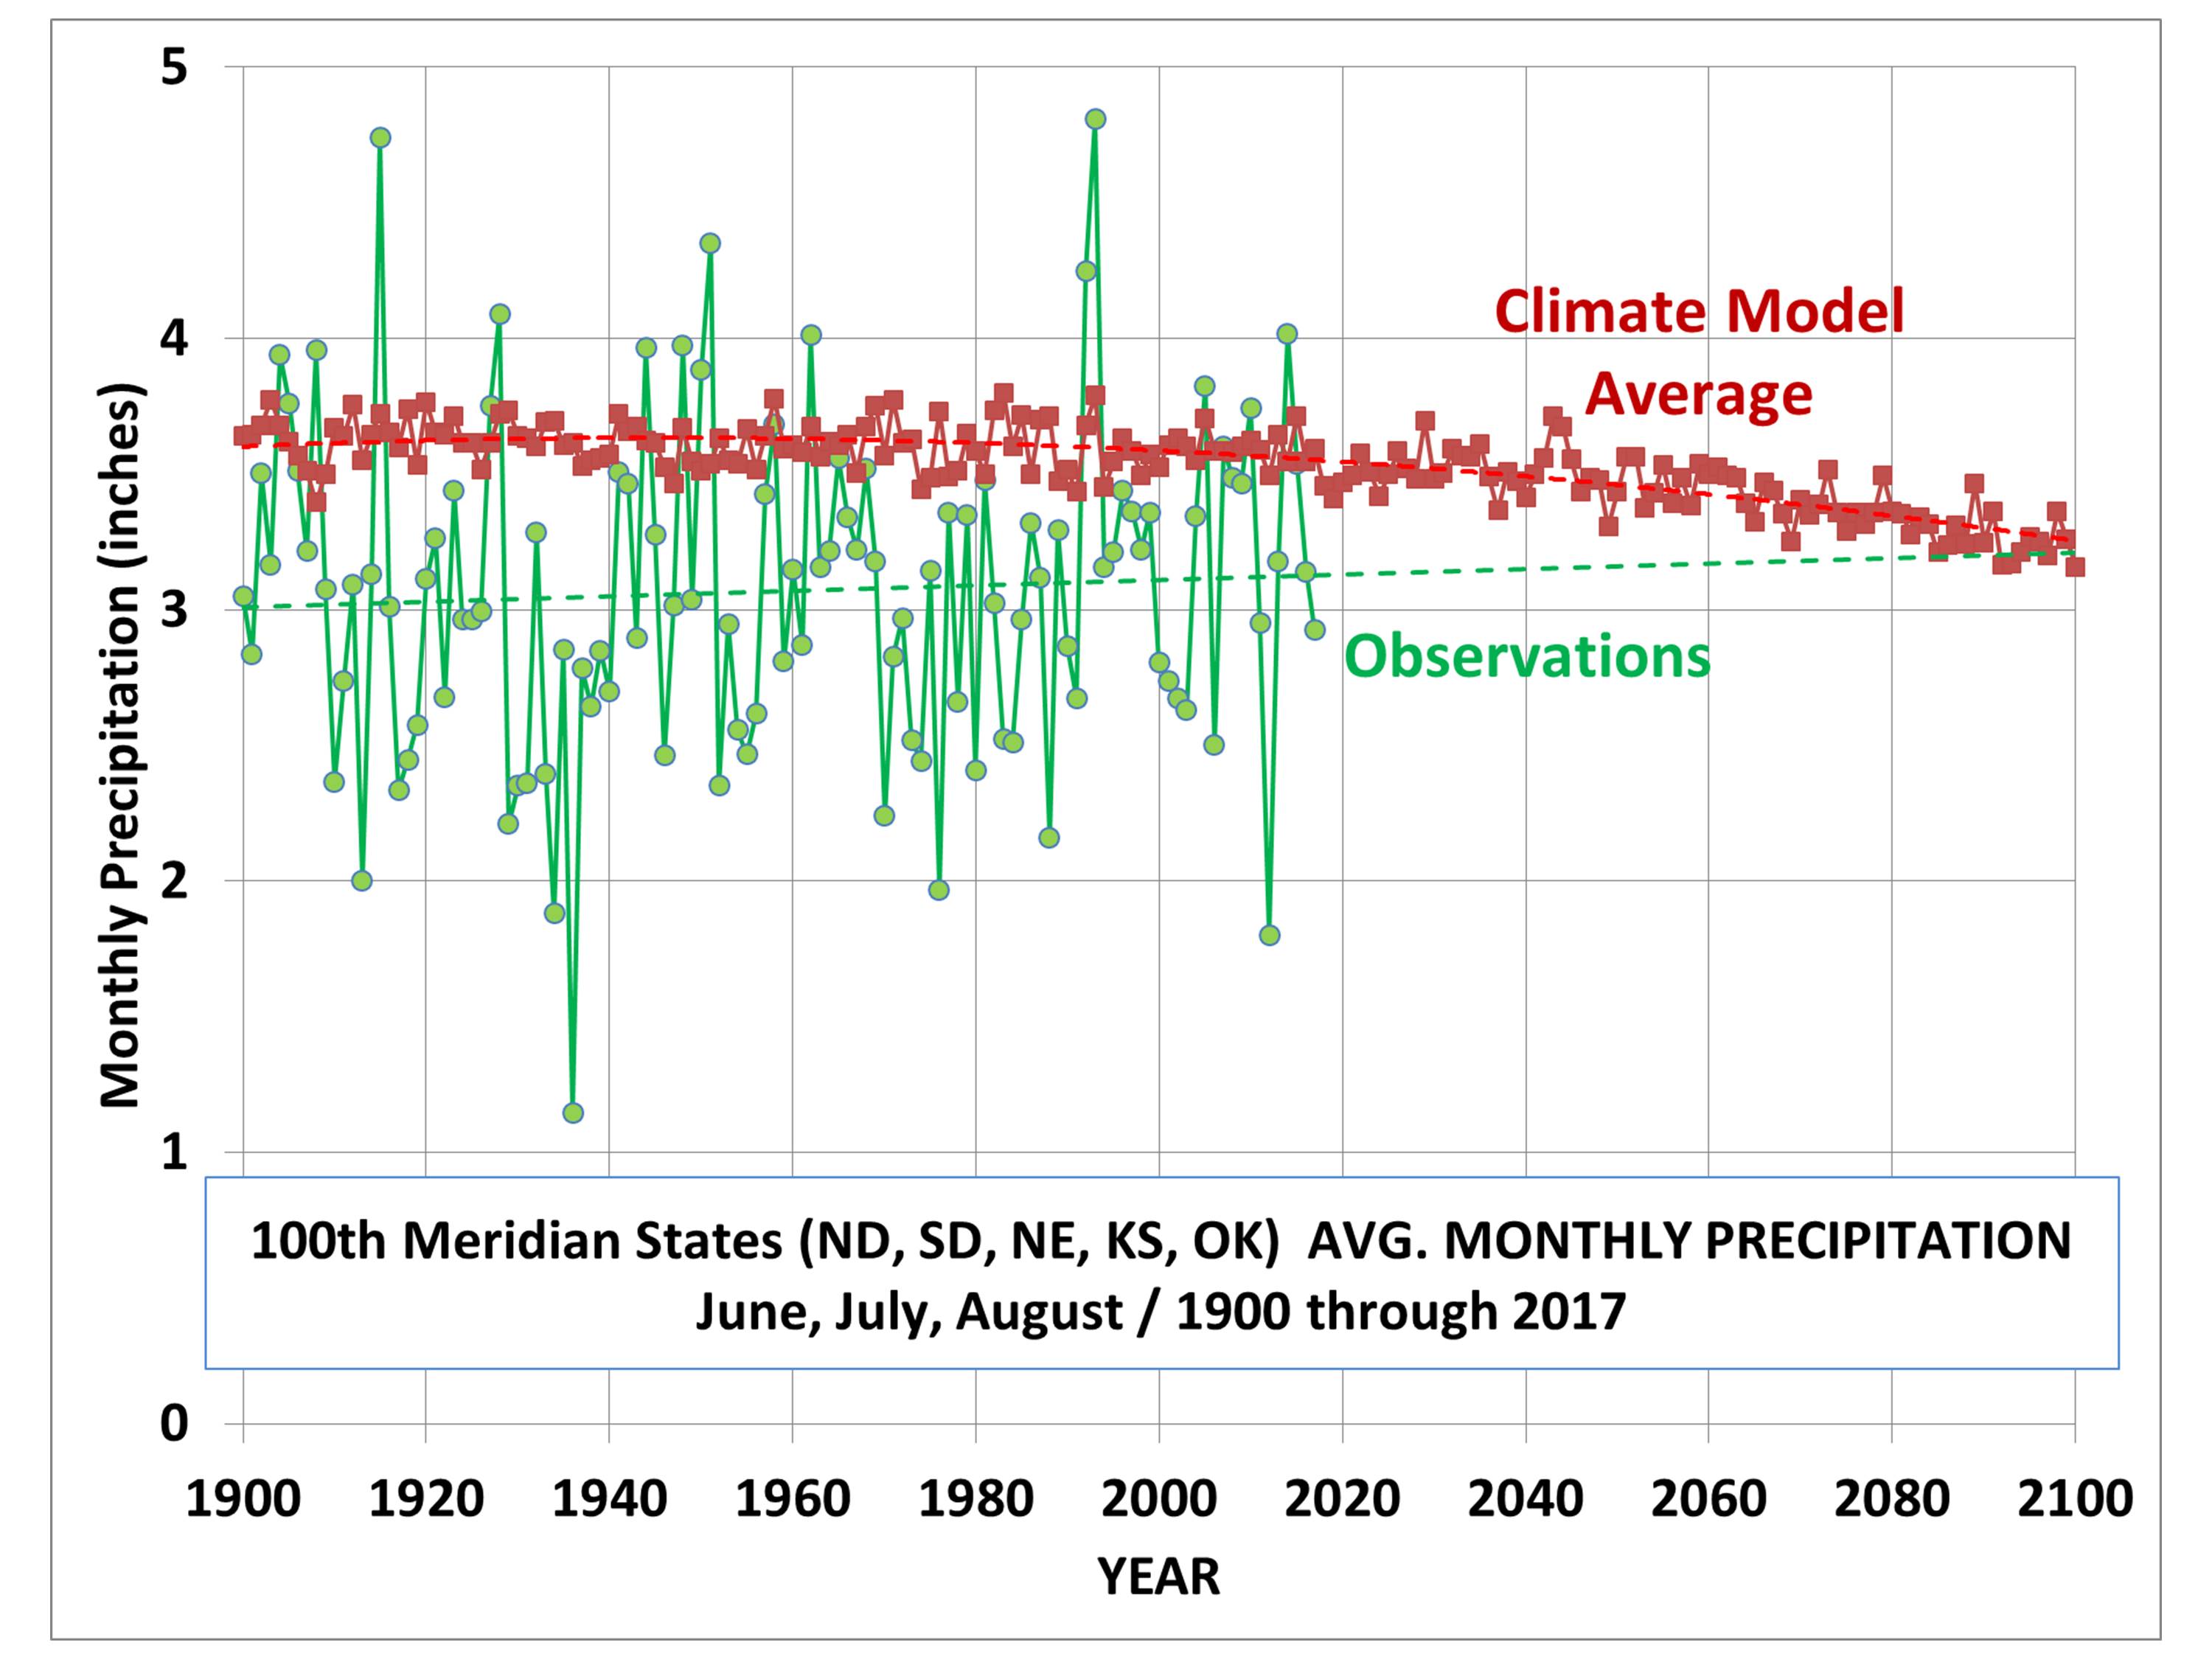
Jun, July, August average monthly precipitation as observed over 5 U.S. states encompassing the 100th Meridian, and as predicted by a CMIP5 (RCP8.5 forcing scenario) multi-model mean from 35N to 50N, and 95W to 105 W (observational data from https://www.ncdc.noaa.gov/cag/statewide/time-series; model data from https://climexp.knmi.nl/[email protected])

What we see is that there has been, so far, no evidence of decreasing precipitation amounts exactly where the authors claim it will occur (and according to press reports, has already occurred).

To the authors’ credit, in their final “Discussion and Conclusions” section of the research paper they admit:

“First, we have shown that state-of-the-art models simulate the aridity gradient across North America poorly.”

“Second, while current Earth system models predict widespread declines in soil moisture and increases in continental aridity, they also simulate increases in net primary productivity. This is because, within the models, the beneficial effects on photosynthesis and water-use efficiency of increased CO2 overwhelm the effects of increased temperature and vapor pressure deficit.” (emphasis added)

The positive effects of more CO2 on global agricultural yields have been tallied, as I have previously discussed here.

Yet, the popular press emphasizes the alarmist nature of the article, even going so far as to make as the central claim something that, as far as I can tell, isn’t even in the paper (!)


460 Responses to “The 100th Meridian Agricultural Scare: Another Example of Media Hype Exceeding Reality”

Toggle Trackbacks

  1. I agree with you Dr. Spencer.

    • Des says:

      Of course you do dear.

    • David Appell says:

      Roy, the observations are in Part I of this paper, published a few months ago:

      https://journals.ametsoc.org/doi/pdf/10.1175/EI-D-17-0011.1

      • Jim Swedlund says:

        David, Read the paper that you have left the link to more closely. It is based on the “observation” of a single starting point of a arid to humid transition band at the 100th Meridian in the continental US in the late 1800s that it states still applies today. Then it refers to the results from some COMPUTER MODELS that say this transition band could move to the East if Climate change persists, based on the COMPUTER MODELS.

        “Observational data” would involve real world measurements of actual physical traits of the transition band at at least two different points in time, but preferably several different points in time far enough apart to truly, scientifically, say there is a trend. At that point however it would still be just a hypothesis that would need to stand up to being disproven six ways to Sunday for it to make it past the hypothesis stage.

        Computer models are NOT OBSERVATIONAL DATA!

        Interestingly the same paper also states that a second observation by an individual named Webb puts the transition band at about the 98th Meridian at about the same time period as the 100th Meridian claim was staked. So even if observationally the transition band seems to have moved to the East a meridian or two at some point in the future the first established data point of the 100th Meridian is debatable.

  2. ren says:

    Moving the Arctic jetstream to the south will increase the amount of precipitation, e.g. in Texas and California, which is already clearly visible.

  3. Bart says:

    It’s so ridiculous. When I was a kid, my parents would try to make me eat my vegetables by admonishing me that children were starving in India. Today, India is so awash in foodstuffs they are dumping overproduction.

  4. ren says:

    Against the meridian jetstream from the northwest, strong storm fronts arise that draw moisture from the Gulf of Mexico.

  5. ren says:

    North Dakota may have a problem, as it is likely that the growing season will shorten in the coming years.

    • goldminor says:

      ren, I would think that the entire NH has a problem with the upcoming winters. This will not be isolated to one area in the NH.Poke around in the major Canadian grain belt. They are already behind in their planting schedule. It has only just begun, imo.

  6. ren says:

    La Nina is not typical. You can see a large warm anomaly in the northern equatorial eastern Pacific. It will probably have an impact on the increase of precipitation in the US.
    http://www.ospo.noaa.gov/data/sst/anomaly/2018/anomw.4.16.2018.gif

  7. g*e*r*a*n says:

    One of the benefits of increased CO2 is that plants then generally need less water.

    “Needing less water” is an important attribute in arid climates.

    • Svante says:

      Gordon says CO2 is only 0.04% of the atmosphere, so it’s can’t possibly have much influence on plant life.

      • Mike Flynn says:

        S,

        Why are you saying that plants won’t benefit from more food?

        I suppose you want to condemn billions to death from slow starvation by removing CO2 from the atmosphere. Or maybe you are just completely confused, stupid and ignorant.

        Next you’ll be trying to say that plants don’t need water, as well!

        What a dummy!

        Cheers.

        • Svante says:

          Please read up on the Ideal Gas Equation and Daltons law of partial pressures.

          • Mike Flynn says:

            S,

            Already done. What’s your point?

            Are you pretending to be thick, or are you really as dumb as you appear?

            If I sound a bit harsh, you are comprehending my meaning perfectly. Why don’t you try talking about overcoats, or brightly coloured graphs? Maybe people won’t realise you can’t even dig up a scientific GHE description, let alone a testable GHE hypothesis!

            Carry on – without any science, that’s about all you can do.

            Cheers.

          • Svante says:

            Something teenie weenie can not make much difference.

          • Mike Flynn says:

            S,

            Dont exhibit your stupidity and ignorance!

            You cannot state the minimum input variation to a chaotic system which will define the onset of chaos. That’s because there isnt one!

            Carry on with your denial of reality to your hearts content. Nature doesnt care.

            Cheers.

          • Svante says:

            You disagree with Gordon!

            Why have you never brought that up with him?

          • Mike Flynn says:

            S,

            Why should I?

            Just because you wish me to?

            Cheers.

          • Svante says:

            You seem to argue with everyone else, so I assumed your were in complete agreement with Gordon and g*e*r*a*n.

      • David Appell says:

        Svante says:
        Gordon says CO2 is only 0.04% of the atmosphere, so its cant possibly have much influence on plant life.

        Ha! Good one.

  8. Curious George says:

    “The popular press emphasizes the alarmist nature of the article, even going so far as to make as the central claim something that, as far as I can tell, isnt even in the paper.” That opens an interesting window into the collective mind of the press. They are so sure that the government censors any news supporting the catastrophic views, that they try to read “between the lines”. Apparently it is a reporting style they themselves practice.

    I remember an old Russian joke about the Carter-Brezhnev meeting, during which they competed in a 100 m run, and Carter won. The next day the official newspaper Pravda reports: In yesterday’s 100 m race, Comrade Secretary General won a nice second place, whereas the American President finished next to last.

    Our mass media are attempting are attempting to force that mentality upon us. They consider it a progressive mentality. I consider it a mentality of liars.

  9. Scott says:

    This reminded me of what the late Michael Crichton called the “Gell-Mann Amnesia” effect:

    “Briefly stated, the Gell-Mann Amnesia effect is as follows. You open the newspaper to an article on some subject you know well. In Murray’s case, physics. In mine, show business. You read the article and see the journalist has absolutely no understanding of either the facts or the issues. Often, the article is so wrong it actually presents the story backward—reversing cause and effect. I call these the “wet streets cause rain” stories. Paper’s full of them.
    In any case, you read with exasperation or amusement the multiple errors in a story, and then turn the page to national or international affairs, and read as if the rest of the newspaper was somehow more accurate about Palestine than the baloney you just read. You turn the page, and forget what you know.”

  10. Steve Case says:

    Here’s what turns up at NOAA’s Climate at a Glance if you plot the trends since 1895 for those six states where the so-called climate boundary is:

    http://oi64.tinypic.com/a0kys8.jpg

  11. spalding craft says:

    Commenters here are missing the point. The author of the story misrepresents the scientific article he refers to by claiming that what the climate model says will happen has already happened.

    This has nothing to do with climate wars back and forth, it’s a deliberate misrepresentation of the article the reporter refers to.

    Also note that the chart showing projected precipitation reflects the RCP 8.5 scenario – in itself a dishonest assertion since 8.5 is wildly improbable.

    Sheesh

    • John F. Hultquist says:

      Roy wrote:
      “” take this headline from Doyle Rice at USAToday on April 13,
      A major climate boundary in the central U.S. has shifted 140 miles due to global warming “”

      The point is — Roy got it right.
      Doyle Rice made it up.
      Such writers are like atoms.

    • Roy Spencer says:

      the authors say they used RCP8.5 because there had been no signs through international agreements that CO2 emissions will be coming down (I’m paraphrasing).

      • gbaikie says:

        The authors got something correct, no international agreements have (or will) lower CO2 emissions.

        China running out of coal, will lower CO2 emissions. And had US used as much Coal as China and continued to do so, the US which has a lot more Coal than China would also run out of coal.

        China also is planning to use even more coal, which use up their coal faster, and this choice, could be blamed on international agreements. And generally due burning wood, international agreements can be seen as causing more C02 emissions.
        Also the seal for wind and solar has also slightly increased CO2 emissions. As has the added corruption and regulations.

        • David Appell says:

          China running out of coal, will lower CO2 emissions. And had US used as much Coal as China and continued to do so, the US which has a lot more Coal than China would also run out of coal.

          The US has already emitted more than twice as much CO2 as has China. The US has been the carbon hog, not China, and will continue so for some time.

          Last year US coal exports were up 61%:
          https://www.eia.gov/todayinenergy/detail.php?id=35852

          • Mike Flynn says:

            DA,

            Why do you think increasing the amount of CO2 between the Sun and a thermometer makes the thermometer hotter?

            Magic, perhaps?

            Cheers.

          • goldminor says:

            @ DA …you are incorrect about that from what I have read. China is rapidly overtaking the US as the #1 all time emitter of CO2. Not that it matters, imo. I read some info on that a few years ago, will see if I can find something to link to verify the contention.

          • goldminor says:

            Here is a graph depicting cumulative from 1850 to 2011. It shows that the US is #1 with 27% total global, while China is at 11% total global. This ratio has already changed by a good bit since 2011 as China continued to grow its economy in the years after 2011. I think that I had read that China will overtake the US in cumulative by around 2025. …http://www.wri.org/sites/default/files/uploads/historical_emissions.png

          • gbaikie says:

            –Last year US coal exports were up 61%:
            https://www.eia.gov/todayinenergy/detail.php?id=35852

            Last year (2017) appears a bit lower that 100 million short tons, and 40 million went to Europe.
            In 2012 total was a bit more than 120 million short tons and
            most going to Europe.
            In comparison, Australia in 2010 exported a bit less than 300 short tons:
            https://en.m.wikipedia.org/wiki/Coal_in_Australia

            In 2013 China consumed 4.24 billion metric tons:
            https://www.brookings.edu/2018/01/22/chinas-coal-consumption-has-peaked/

            300 short ton equals 273 metric tons
            And 4.24 billion equals 4240 million
            And China imports about 150 million or less coal per year,
            And fairly unlikely that any country could import 500 million ton coal as this would require a very massive infrastructure (ports, rail,etc).
            Japan is largest coal importer and in a year has imported as much as 215 million short tons:
            https://www.theglobaleconomy.com/Japan/coal_imports/

          • DMacKenzie says:

            Mike Flynn,
            “Why do you think increasing the amount of CO2 between the Sun and a thermometer makes the thermometer hotter?

            Because in the SB equation below, simplified for you, Tc got warmer due to the IR radiation of CO2 and the source of heat,q,the sun stayed constant, so Th has to increase. Th is the temperature of whatever surface the thermometer is laying on, you know, in the sunshine.

            q = ε σ (Th4 – Tc4)

            In a little more complicated form of the equation, I could show you that ε changes with CO2 level as well. But having attempted to show you the error of your ways, I’m not really expecting you will change your “no GHE” stance, any more than I can sway a person’s belief in Leprechauns.

          • David Appell says:

            goldminor says:
            @ DA you are incorrect about that from what I have read. China is rapidly overtaking the US as the #1 all time emitter of CO2

            Yes, China currently emits more CO2 per unit time than does the US, but the cumulative emissions are dominated by the US, which has, since 1850, emitted twice what China has.

            https://davidappell.blogspot.com/2017/11/country-by-country-co2-emissions.html

            China won’t catch up for a few decades, at least.

          • David Appell says:

            Plus, Americans emit about twice as much CO2 per capita as do the Chinese.

          • Mike Flynn says:

            DM,

            Unfortunately, you are talking nonsense.

            The atmosphere is demonstrably cooler than the surface. It cannot make the surface hotter, can it?

            You are just as likely to use the same nonsense to claim that reducing the amount of CO2 between the Sun and a thermometer makes the thermometer colder!

            Or does your pseudoscience only work one way – everything gets hotter!

            I presume you cannot even properly describe the GHE, much less provide a testable GHE hypothesis.

            You might care to ponder why the speed of light (covering all frequencies, from the infinitely small to the infinitely large) is specified as ocurring in a vacuum. I realise you probably cannot see the significance, but I live in hope.

            Off you go, then. Keep believing that the non-existent GHE stopped the Earth’s surface from cooling from its initial molten condition to its present state. Foolish and ignorant people such as yourself prefer fantasy to fact. Only you would know why.

            Cheers.

          • Svante says:

            Mike Flynn says:

            “The atmosphere is demonstrably cooler than the surface. It cannot make the surface hotter, can it?”

            Gordon found a way here:
            https://tinyurl.com/y8qlssso

  12. Nate says:

    They discuss a shift they saw since 1980 in part 1 of the paper. Not very definitive though.

    • spalding craft says:

      “Not very definitive” is an understatement. They attempt to create a baseline from which the remainder of the 21st century is projected, and weakly assert that the base period witnessed some change from the 19th century due to climate change. But I didn’t see any evidence that the line had shifted to the east, and the authors are almost apologetic about the strength of the evidence suggesting change so far.

      But what they do is to take the climate line from the 100th meridian and shift it to the east, from the present to the end of the 21st century, using the RCP 8.5 forcing scenario.

      This is weak science using preposterous assumptions, and is aggravated by “fake news” perpetrated by USA Today.

    • Nate says:

      Not very impressive, but at least real data.

      The press release also notes that precipitation may not have changed much in northern states but temp has increased leading to drier soil.

  13. Paul Linsay says:

    Did you ever notice that the models never get the fluctuations right? I wouldnt expect them to match in detail but the amplitude should match, but never does. Its a clear sign that the models dont match the correct dynamics.

    • Des says:

      Models don’t predict fluctuations. They predict TRENDS.

      • Mike Flynn says:

        Des,

        Good luck with predicting trends, I hope it helps you.

        The IPCC claims that future climate states are unpredictable.

        What are the models supposed to do? Predict pointless trends? There doesn’t seem to be much point, if future climate states are unpredictable!

        Do you think you might have better luck with financial trends? You might become fabulously wealthy. Or maybe not. Good luck anyway.

        Cheers.

        • goldminor says:

          Ok, so they predict pointless trends, but at least they are predicting something. Right?

          • Lewis says:

            I predict DA says something derogatory about someone.
            The same for Mike F.
            Ren will post a link to a interesting graphic
            Salvatore will make a prediction
            Des will question why

            These will all come to pass within 5 days.

            Send donations to ….

          • Mike Flynn says:

            g,

            Any fool can make predictions, and many do.

            Your point is?

            Cheers.

          • Mike Flynn says:

            Lewis,

            And the reason anybody should pay any attention any like assumptions is . . .?

            Unless their assumptions are better than mine (or a twelve year old child), they arent worth anything at all, are they?

            Just like climatological predictions, I suppose, except they are expensive, while still being completely useless.

            Cheers

          • goldminor says:

            @ Mike …just having a bit of fun there. I wasn’t dissing your comment.

          • Mike Flynn says:

            g,

            Apologies. I am guilty of lapsing into the same stupid and ignorant behaviours as the witless GHE proponents. Mea culpa!

            Keep having fun – I ain’t never had too much fun! I hope you can say the same.

            Cheers.

          • Des says:

            The exception is when you lapse OUT of such behaviour.

      • PhilJ says:

        Lol the current models are built on a faulty paradaigm so their predicted trends will more oftem then not fail…

    • Roy Spencer says:

      actually, the individual models do create their own year-to-year variability, but since it is rather random, when you average multiple models together, that “noise” averages out. So you can’t compare the interannual variability between models and observations, just the longer-term changes.

    • David Appell says:

      Paul Linsay says:
      “Did you ever notice that the models never get the fluctuations right?”

      Why is that a requirement?

      Climate models are solving a boundary value problem, not an initial value problem. (The full set of initial values isn’t known anyway.)

      • Mike Flynn says:

        DA,

        Climate models are completely pointless. Even the IPCC states that future climate states are unpredictable.

        Don’t you believe the IPCC?

        Climate is just the average of weather, isn’t it?

        Cheers.

        • John F. Hultquist says:

          Climate is just the average of weather, isnt it?

          No.
          Stick one foot into a bucket of ice water, the other foot into a bucket of hot water.
          Your average foot will feel just fine.

          • Des says:

            Mike Flynn habitually feels his “average foot” every time he comments on this site. Despite this, he can’t go close to making it reach a metre tall bucket of water standing on the floor.

          • Mike Flynn says:

            John,

            What is your definition of climate then?

            Cheers.

          • gbaikie says:

            Mike, we are in an ice box global climate.

            Ice box climate has permanent polar ice caps and
            a cold ocean.

            We have polar ice caps, and the average temperature of the oceans, stay within a temperature range of about 1 to 5 C.

            Currently our oceans have average temperature of about 3.5 C.

            And what determines global average surface air temperature, is an average land temperature of about 10 C and average ocean surface temperature of about 17 C.

            And the surface land temperature can vary signifcantly due to weather.

          • Snape says:

            John

            If you’re looking to retire someplace sunny, best to look up “average sunny days” rather than today’s weather. Case in point: bright sunshine in Quillayute today.

  14. RAH says:

    Their claim is in fact the opposite of that demonstrated in the observational data according to Paul Homewood:
    https://notalotofpeopleknowthat.wordpress.com/2018/04/18/midwest-to-become-arid-as-it-gets-wetter/

    “All the way up that 100th Meridian, the climate has grown wetter since the early 20thC. totally the opposite of what is claimed should be happening under a warmer climate.”

    • Snape says:

      In general, AGW is expected to produce a wetter world as a result of increased water vapor. That’s certainly been the case so far in the US.

      “We found a strong relationship between global warming and an increase in rainfall, particularly in areas outside of the tropics,” said lead author UNSW’s Dr Markus Donat from the ARC Centre of Excellence for Climate System Science.”

      https://phys.org/news/2016-03-global-world-driest-areas.amp

      • Snape says:

        The science is nowhere near settled, though:

        “As our climate warms, we might be in for a wetter world. EarthSky spoke with climate scientist Frank Wentz, director of Remote Sensing Systems in Santa Rosa, CA. Predicting how our warming climate will change rainfall patterns around the world is extremely complicated, said Wentz. He uses satellites to measure changes in water in Earths atmosphere over decades not just the rain and clouds you can see but the invisible vapor that comprised 99% of the water in our atmosphere. Wentz spoke with EarthSkys Jorge Salazar about the complex puzzle of how climate change affects rainfall.”

        http://earthsky.org/earth/frank-wentz-will-global-warming-bring-more-rainfall

        • Snape says:

          “I think most scientists are confident that we will see more rain in the future but exactly how much more and where it will occur are still unknowns.”

          – Frank Wentz

          • Mike Flynn says:

            S,

            Frank Wentz said that predicting the climate is extremely complicated. Even more so when the future is involved, I would guess!

            The IPCC says it’s impossible, but maybe Frank Wentz knows more than the IPCC. That would not be hard.

            In the meantime, we can all have a good laugh at the efforts of true believers like yourself. No hypothesis, no theory, no science – just unswerving belief in the nonsensical utterances of people like Gavin Schmidt and Michael Mann!

            A juggler and a tree-whisperer!

            All part of the rich tapestry of life! Keep the humour coming!

            Cheers.

          • Snape says:

            Hypothesis: Flynn is part numbat (genetics experiment gone bad)

            https://a-z-animals.com/animals/numbat/

          • Des says:

            What is wrong with a numbat?
            Surely Mike Flynn is more like the Blob Fish:
            https://tinyurl.com/MikeFlynnBlobFish

          • Snape says:

            Des, you’re right, nothing wrong with a numbat, probably a lot smarter than Mike.

            The blob fish……OMG, hideous! How come Oz has such bizarre creatures? (My wife refuses to visit on account of her bug and spider phobia.)

          • Des says:

            I don’t know about that. China does well in that department with this lookalike of a very ugly American human being:
            http://www.thatsmags.com/image/view/201611/bird.jpg

            They got it right down to the brain size.

          • Snape says:

            Lol!

          • Mike Flynn says:

            Des,

            You say you don’t know.

            I agree.

            Cheers.

      • RAH says:

        So Snape you agree that the study in question is a worthless POS since it projects dryer conditions moving east when actually it’s been wetter?

        • Snape says:

          RAH

          It wasn’t my intent to slam the study. I just wanted to clarify (for those not familiar) that AGW is generally expected to produce more rain, not less, despite what models predict
          for a particular location.

          That said, I wouldn’t put money on the line moving east anytime soon: “First, we have shown that state-of-the-art models simulate the aridity gradient across North America poorly.”

          • Snape says:

            Although as Nate mentioned upthread, it’s not all about precipitation. Higher temps cause soil to dry out faster, so more rainfall is needed just to keep pace.

          • RAH says:

            There is a lot more to aridity than temperature and precipitation. The character of the soil is a big factor. Sandier soils hold less water, drain much quicker, and change temperatures faster. Heavier soils with higher clay content hold more water and cool or warm much slower.

  15. Svante says:

    Hi Everyone,

    I have invented a heater that is not hot. It works like this:
    https://tinyurl.com/y7fsy9ep

    Who wants to invest?

    Patent pending.

    • Mike Flynn says:

      S,

      Why bother? Just surround something with CO2.

      Climatological fools believe that even 400 ppm will raise the object’s temperature by 33 K!

      Alternatively, removing CO2 from the air will cause a drop of 33 K.

      Of course, people who believe that are stupid, ignorant, gullible, foolish Warmists, aren’t they?

      What a fumbling, bumbling, idiotic pack of fools!

      Cheers.

      • Svante says:

        Mike, CO2 dissipates, this radiator is attached to the wall.

        It is painted in a nice blue color.

        • Mike Flynn says:

          S,

          Foolish Warmists insists that CO2 is well mixed – no dissipation there. Don’t you believe your own nonsense?

          Gavin Schmidt claims CO2 is the control knob which heats the planet. Surely you don’t believe he’s wrong? Foolish Warmists, being stupid and ignorant, believe that putting more CO2 between the Sun and a thermometer makes the thermometer hotter!

          How ridiculous is that?

          Ah well, to paraphrase P T Barnum, it is difficult to underestimate the collective intelligence of fumbling bumblers calling themselves climatologists, eh?

          Cheers.

          • Mike Flynn says:

            DA,

            Svante claims it dissipates.

            Who is more ignorant – you or Svante?

            Cheers.

          • Svante says:

            Mike, I did not express myself clearly enough for you.
            CO2 may dissipate from your house, not from earth.

          • Mike Flynn says:

            Svante,

            Why is that? If the house is insulated, what strange magic allows the CO2 to magically dissipate? Does the oxygen, nitrogen and all the rest (including exhaled CO2) stay inside, while the other CO2 vanishes to join that which is outside?

            That cannot be so, because the lunatic GHE supporters claim the CO2 in the air is well mixed!

            Are you saying that CO2 concentrations actually vary from place to place?

            If you say the CO2 does not dissipate from the Earth, why does it differ from your ridiculous and strangely non-existent brightly coloured fantasy in its heating capacity?

            About time for some more climatological redefinitions, don’t you think?

            A gas which dissipates and doesnt dissipate at the same time.

            On the other hand, your stupidity and ignorance remains fixed, until evidence arises to the contrary.

            Press on. Still no GHE, is there? If there was, you could no doubt describe it.

            Cheers.

          • Snape says:

            Mike

            Svante probably assumed your cave has some sort of ventilation system, where stale inside air can be replaced with fresh air from the outdoors.

            Prevents asphyxiation.

          • Nate says:

            “Why is that? If the house is insulated, what strange magic allows the CO2 to magically dissipate?”

            I hope it does dissipate in you house, Mike, otherwise you and your dogs need to stop exhaling so much.

          • Svante says:

            Mike, look up diffusion.

            CO2 may slip out when you open your air tight door.

            You have no quarrel with the heater diagram do you?
            Are you on board then?

          • Mike Flynn says:

            Come on, chaps.

            You seem to be claiming that CO2 only exhibits it’s magical heating effects outside, in direct sunlight, except when it doesn’t.

            Given that the CO2 In a room, at 20 C or so, is bathed in the IR frequencies that GHE fanatics claim result in heating, it is surprising you now claim that CO2 doesn’t provide any warming whatever!

            Look it up, if you are stupid and ignorant enough not to know facts when you see them.

            Back to reality. You claim that CO2 in an enclosed space dissipates. I say it doesn’t.

            You claim it might “slip out”. I’m saying it doesn’t. My gas tight door remains as firmly closed as your minds.

            You suggest it “diffuses”. Through a gas tight enclosure? What a pack of ignorant, stupid fools!

            Care to try to come up with more weasel words and prevarication?

            You can’t describe the GHE in any scientific way, can you?

            That’s because it doesn’t exist. Keep dreaming, lads.

            Cheers.

          • Svante says:

            I’m glad you have no objection to my real cool heater.

          • Mike Flynn says:

            S,

            Dont blame me for your stupidity and complete disconnect from reality.

            Thats your choice. Live with it.

            Cheers.

          • Nate says:

            MF: “You claim that CO2 in an enclosed space dissipates. I say it doesnt.”

            Well, Mike, If it didnt, then you would be now asphyxiated in your own home, as your exhaled CO2 would have built up to intolerable levels.

            So you are demonstrating your vast ignorance and arrogance.

          • Svante says:

            Nate, that would explain his posts.

          • Nate says:

            That he’s being slowly asphyxiated? Indeed that would explain his increasing hostility and detachment from reality.

          • Mike Flynn says:

            Nate,

            OK. For the pedant in you, a gas tight enclosed space.

            It doesnt matter how you try to weasel out, there is still no GHE, is there?

            Not even a testable GHE hypothesis!

            Cheers.

          • Nate says:

            Mike,

            Your original claim

            “Why is that? If the house is insulated, what strange magic allows the CO2 to magically dissipate?”

            demonstrated your scientific cluelessness. Now you add qualifiers about ‘gas tight’ to cover up your ineptitude.

            Just adds to the irony of your constant declaration of others stupidity and ignorance.

      • Mack says:

        Mike, the same effect should occur if I stood and emptied a cylinder of CO2 over my feet. The “heat-trapping” gas will warm up my tootsies no end…..riiight.

        • David Appell says:

          Mack, no, not without end. You’re only talking about a small amount of CO2, relative to that in a column in the atmosphere. So what do you estimate is its effect?

          • Mike Flynn says:

            DA,

            What do you estimate its effect to be? If you don’t know, why do you believe in a GHE?

            Gullibility? Stupidity? Ignorance?

            Cheers.

        • RAH says:

          The CO2 coming out of a cylinder under pressure, just like every other welding gas I have had experience with, be it O2, Ar, C2H2 or several others is COLDER than the ambient temp when released. Frost would form on the metering valves on the MIG welders on warm humid days when doing long continuous welds using CO2 as the shielding gas.

          • David Appell says:

            CO2’s ab.sorp.tion properties do not depend strongly on the gas’s temperature, but on its molecular configuration, which is only a very weak function of temperature.

    • PhilJ says:

      S replace all those internal arrows with a big U if youre having trouble with it

    • g*e*r*a*n says:

      sleazy svante comes out of the shadows to mis-represent reality.

      That’s all he can do.

      It’s fun to watch.

      • Svante says:

        As you can see in the diagram, the blue heater can heat the green plate even though it not hot.

        That is because it is a “heat source” within double quotes.

        My chief scientist explains here:
        http://www.drroyspencer.com/2018/04/uah-global-temperature-updated-for-march-2018-0-24-deg-c/#comment-295805

      • Mike Flynn says:

        g,

        The mightily deluded Svante might even believe in brightly coloured pictures of the Trenberth/NASA variety showing that radiation colder than ice can raise the temperature of water (or anything else)!

        About as stupid as SB calculations that can miraculously show the Earth’s surface temperature being something between molten and 255 K – depending on what you want it to be – ignoring reality.

        These peanuts cannot accept that the Earth is a slowly cooling ball of molten stuff, subject to the vagaries of apparently chaotic processes affecting the lithosphere, aquasphere, and atmosphere!

        That pseudoscientific KoolAid has amazing psychoactive properties, substituting fantasy for reality in the heads of its addicts!

        Oh well.

        Cheers.

        • Svante says:

          Are you implying that there is something wrong with the plate diagram?

          • Mike Flynn says:

            S,

            What do you mean “wrong?

            I assume there is no point at all to your question. There is no GHE, if that is what you are trying to support. Arguing about imaginary diagrams won’t change the fact that there is no testable GHE hypothesis.

            Return to your fantasy world, if it makes you content.

            I’ll stay in the world of real science.

            Richard Feynman (a real physicist and Nobel Laureate) said –

            “It doesn’t matter how beautiful your theory is, it doesn’t matter how smart you are. If it doesn’t agree with experiment, it’s wrong.”

            I agree. You can agree or not, as you wish.

            Cheers.

          • Svante says:

            Mike Flynn says:

            ‘What do you mean “wrong?’

            I mean are the numbers correct?

          • Mike Flynn says:

            S,

            Which numbers? What is the relevance? I assume you are aiming for a gotcha, by pretending that fantasy is fact.

            You havent found a testable GHE hypothesis, and no amount of imaginary diversions will obscure this fact.

            Attempt to deny, divert and confuse as much as you like.

            Still no GHE. Still no CO2 heating.

            Cheers.

          • Svante says:

            Mike Flynn says: “Which numbers?”

            The numbers in the diagram we are discussing (at the top of the thread).

    • Bart says:

      The blue plate – green plate controversy is a microcosm of the entire AGW debate.

      People who champion the Rabett interpretation have constructed a simple system that works under specific, simplified assumptions. They are scientifically on solid ground, but they fail to consider anything beyond their purblind paradigm.

      People who champion ridiculousness such as this are potentially right, but for the wrong reasons.

      The reality is that the generic system is much more complicated. The specific case uses plates with high heat conductivity, so that the assumption that both near and far sides are at the same temperature is approximately true.

      However, when one introduces low heat conductivity into the mix, it is possible to invert the ultimate outcome – where there was heating, there is now cooling. If, instead of thin metal plates, one uses ceramic pottery, the result is totally different.

      • Snape says:

        Bart

        Assume the blue plate is made of 1″ thick ceramic and let it come to steady temperature. Now press a similar (but colder) green plate next to it. The warmer plate will get warmer still.

        Works for conduction AND radiation, which is what Eli was trying to show.

        • Bart says:

          It completely depends upon the conductivity. Consider the reductio where the first plate between the source and the second plate has zero conductivity. The second plate never even knows the source is there.

          • Snape says:

            Ok. You got me there.

            Rephrasing: assuming the blue plate has non-zero conductivity and the green plate is made of the same material………..

          • Bart says:

            It is a smooth progression, and there is a critical level of conductivity below which you get cooling of the second plate, and above which you get heating.

          • Bart says:

            I am at risk of confusing the issue. Adding the green plate always raises the temperature of the blue plate, however, there is a point of diminishing returns such that beyond that point, the potential rise rapidly becomes insignificant.

            Depending upon the conductivity, the average temperature can be lower even with the green plate than it would be with high conductivity and no green plate. That is the point I was making above, but realized upon second reading was a bit cryptic.

      • Nate says:

        “The blue plate green plate controversy is a microcosm of the entire AGW debate.

        People who champion the Rabett interpretation have constructed a simple system that works under specific, simplified assumptions. They are scientifically on solid ground, but they fail to consider anything beyond their purblind paradigm.”

        Is it? This demo is intended only to rebut the misguided notions of highly confused deniers-the dragon-slayers, who think that the second-law invalidates just about everything, including back-radiation, the GHE, etc. It serves that purpose well.

        Just as none of us believe strawmen like CO2 is heat source or that ice can cook a turkey, we also do not believe that this demo is in any way a full description of the GHE.

        • Bart says:

          “…we also do not believe that this demo is in any way a full description of the GHE.”

          But, such jejune heuristics is really all the AGW proponents have got. There’s no convincing empirical evidence to establish that the hypothesis of anthropogenically induced warming is valid in the aggregate. It requires a leap of faith.

        • Nate says:

          “all the AGW proponents have got”.

          Well, aside from the thousands of papers published, data sets, etc that you casually dismiss.

          • Bart says:

            These are not proof of anything. They are all of the form of “if this, then that“. But, the fundamental premise has not been established, so the papers are just so much speculation.

            Quantity of speculation is not a valid metric to assess the truth or falsity of an hypothesis.

          • Nate says:

            Most of the papers are measurements and analyses of measurements. Others are numerical models incorporating real geophysics.

            Characterizing them as “just so much speculation.” reveals your bias and ignorance of whats in the papers.

          • Bart says:

            Mmm… no.

          • David Appell says:

            As ever, Bart doesn’t know any details, and his pithy comments show that clearly.

  16. ren says:

    If we look at the temperature of the South Pacific, we can see that the Humboldt Current will remain cold. On the other hand, dangerous hurricanes threaten the Equatorial North Pacific.
    http://www.ospo.noaa.gov/data/sst/anomaly/2018/anomnight.4.16.2018.gif

  17. ren says:

    See why the southern US this summer will be a lot of rain.
    http://www.ssd.noaa.gov/goes/west/tpac/h5-loop-ir4.html

    • Des says:

      How does a satellite image from a particular day in April allow you to predict rainfall for 3 months from now?

      • Mike Flynn says:

        Des,

        Can you predict the future any better? No?

        I thought not.

        Cheers.

        • Des says:

          Yes. I predict that you will continue to troll me with comments such as “who cares” and “idiot”. Am I close?

        • Mike Flynn says:

          D,

          No – I dont believe so.

          You are still stupid and ignorant. You, like other stupid and ignorant people, confuse assumptions with predictions. Even worse, you think that making the same assumptions that a small child can is evidence of your intellect.

          It is, but maybe not in the way you think!

          Can you predict any better than a 12 year old? No?

          You seem to take pride in being stupid. Good for you!

          Cheers.

        • Nate says:

          Spot on Des.

  18. Ric says:

    No problem using them from my phone:

  19. ren says:

    On April 21, a jet stream in the south will bring humid air from the tropical Pacific to the south US.
    http://pics.tinypic.pl/i/00963/at5qa094wkv0.gif

  20. Bri says:

    There is more land that is not usable as farmland because of cold whether than there is land currently being farmed. Look at a map just Saskatchewan, Canada has enough farmland to replace Kansas and Nebraska. If they had a slightly longer growing season the world would be flooded with food.

    • David Appell says:

      If they had a slightly longer growing season the world would be flooded with food.

      Would it? How does changes in sunlight patterns in more northern latitudes affect growth?

      And it’s already known that higher CO2 reduces plant nutritional quality:

      Total protein and nitrogen concentrations in plants generally decline under elevated CO2 atmospheres. Recently, several meta-analyses have indicated that CO2 inhibition of nitrate assimilation is the explanation most consistent with observations. Here, we present the first direct field test of this explanation.. In leaf tissue, the ratio of nitrate to total nitrogen concentration and the stable isotope ratios of organic nitrogen and free nitrate showed that nitrate assimilation was slower under elevated than ambient CO2. These findings imply that food quality will suffer under the CO2 levels anticipated during this century unless more sophisticated approaches to nitrogen fertilization are employed.
      — Nitrate assimilation is inhibited by elevated CO2 in field-grown wheat, Arnold J. Bloom et al, Nature Climate Change, April 6 2014.
      http://www.nature.com/nclimate/journal/vaop/ncurrent/full/nclimate2183.html

      Higher CO2 tends to inhibit the ability of plants to make protein And this explains why food quality seems to have been declining and will continue to decline as CO2 rises because of this inhibition of nitrate conversion into protein. Its going to be fairly universal that well be struggling with trying to sustain food quality and its not just protein its also micronutrients such as zinc and iron that suffer as well as protein.
      – University of California at Davis Professor Arnold J. Bloom, on Yale Climate Connections 10/7/14
      http://www.yaleclimateconnections.org/2014/10/crop-nutrition/2014

      • coturnix says:

        well, just add more fertilizer

      • Mike Flynn says:

        DA,

        Even if in some cases, concentrations of certain components of increased production decline, 80% of some increase is better than 100% of no Increase at all. Don’t you agree?

        It is well known that plants die if deprived of CO2 or H2O – which are, of course, minimum products of burning stuff. Coal, oil, and gas, for example.

        Stop exhaling CO2 and H2O, if you are so passionate. See how you feel after 10 minutes or so.

        Stop being silly, David. Abandon pointless pseudoscience. Learn the scientific method – you might be surprised what you learn!

        Cheers.

        • Nate says:

          I know, before the industrial revolution, plants were starving and dying.

          • Mike Flynn says:

            N,

            How do you know that? Or are you just acting pointless, stupid and ignorant for some bizarre reason?

            The world wonders!

            Cheers.

        • Nate says:

          For the clueless of the world, such as MF, I should have said /sarc.

          Obviously plants did just fine for eons before the industrial revolution.

          Which highlights the stupidity of your implication that without burning FF, plants would be starving.

        • Mike Flynn says:

          Nate,

          People did fine before the use of fire, I suppose.

          They do finer now, due to stuff being burnt – cooking, metals, ceramics, glass, machining, cloth – all these things require the burning of stuff. Plants do better with more food and water, if they are barely subsisting. Burning stuff produces CO2 and water – millions of tons of the stuff!

          Back to the Stone Age with you! Uh oh, they burnt stuff – they even hardened wooden spears using fire.

          Back to before the Stone Age with you! Not appealing? I am not surprised.

          Cheers.

      • Bart says:

        “And its already known that higher CO2 reduces plant nutritional quality:”

        This is the same sort of inverted “science” (conclusion first, then fit the data to the conclusion) that led us to eschew fats and load up on carbs, resulting in the paradox of an obesity epidemic. Anyone who falls for crap like this is soft in the head.

    • Mike Flynn says:

      DA,

      On the other hand, why wouldn’t it?

      Just because you are stupid and ignorant, does not mean others are, does it?

      Cheers.

    • goldminor says:

      Yes that is true. On the other hand all farmers up in those provinces are currently way behind in planting their crops, because of this first of the many cold and long winters coming down the pike, imo.

        • goldminor says:

          Don’t worry, des. I am a good bit more than just another Prete face. I actually make predictions/forecasts that work.

          • Des says:

            You’re not just a PRETE face? Then it looks like we agree that the predictions of ensuing cold by Salvatore del PRETE are ludicrous.

          • Mike Flynn says:

            D,

            And your point is . . .?

            Cheers.

          • goldminor says:

            Not quite, I agree with the cool trend part. It is just that Prete is unable to make anything but general statements. There is never any specificity to any of his claims. I on the other hand have made successful, and specific forecasts/predictions.

            My #1 multi-faceted prediction was made in early 2014 which predicted a strong probability that the winter of 2016/17 would bring very heavy rains to Northern California and the Pacific Northwest. That included the details that the sunspot count would be down low close to minimum levels, and that the ENSO regions would be in negative/La Nina territory. So I hit a trifecta as all of that came to pass.

            As an aside, the next flood year for the PNW/California should be in the winter of 2026/27, with a lesser probability of it occurring in 2025/26. That also means that the Sun will be approaching and close to its next minimum, and that the ENSO regions will be negative/La Nina. Interesting, no?

          • Snape says:

            goldminor

            I pulled numbers out of a hat and predicted the UAH/TLT anomalies for December and January would be 0.41 and 0.27

            Interested in buying the hat?

          • Snape says:

            BTW, Salvatore is calling for a fairly long term cooling trend. Sort of like Joe Bastardi’s prediction that by 2030 global temps will be similar to the 1970’s.

            What’s your guess?

          • goldminor says:

            @ Snape …yes hard to believe except that I have the comments to prove that. The start of this was that being a Californian, and an avid fisherman from a young age I had learned about the speculative cyclical flood history of the PNW and Northern California. Then when I fell into the AGW debate in mid 2008 it didn’t take too long before I came across my first look at a graph depicting past solar cycles.

            With the way that my mind works I immediately noticed that there appeared to be good correlation between the 3 bits of flood history which I knew, and the solar cycles. The floods back then were running a 9 year pattern, 1964/65 very big, 1055/56 big, and 1946/47 moderate. That is what hooked me on this conversation, and I have stuck with it ever since. It will be 10 full years this August with about 1,000 hours per year of reading/thinking on the varied subject matter. I was gifted with a very good mind for this, and so I was off to the races. In early 2014 I had a great moment of clarity which allowed me to connect the dots. The above stated prediction was part of that.

            But to your question, I expect a cyclical cool trend to assert itself from here going forward. If I was to hazard a guess as to the depth, then I would say that temps will drop about 0.5C below the 0.0C trend line as shown on Dr Spencer’s monthly UAH graph. It could potentially go deeper than that. There is also the question of will it go for a second round of 30+ years afterwards, a Maunder type GM. That would mean much colder. I also have several working predictions which I will post here later. They range several years out. That way you can find out, if I was blowing smoke, or if in fact that I am spot on with my perspective of how the climate system works.

            I will also find out the same. I have already made successful forecasts, and predictions as stated above plus there are others. I would not be saying this, and likely would have dropped out of this conversation years ago except for the fact of having success with my method. I have the comments to prove my upper comment. Will post when I come back later to post the current predictions. Here is one quick one. I expect to see global ssta go majority cool by the end of this spring. This is a forecast which I made about one year ago. ten weeks and I will see, if that thought was correct. I have missed a few along the way.

          • Snape says:

            Goldminor

            “@ Snape yes hard to believe except that I have the comments to prove that.”

            I think you misunderstood me. I totally believe you made those predictions and got them right….no need to prove it to me. (My predictions for December and January were actually posted on this blog, too.)

            What I meant to imply is that random luck is often mistaken as skill or pattern. If you keep making predictions, though, and they continue to be correct…….that will indeed be interesting!

            Time will tell.

          • goldminor says:

            @ Snape …yes, I did misunderstand your intent. Thanks for taking the time to set that straight.

          • Snape says:

            Looking back I see my first comment was pretty rude. Sorry about that.

          • Des says:

            goldminor
            Excluding month during La Nina and in the 5 month lag period after La Nina, how long are you claiming it will be before UAH falls below zero?
            Below -0.2?
            Reaches -0.5?

          • goldminor says:

            @ Des …That isn’t such an easy forecast to make. There is a moderate probability that that there will be a spike in temps peaking around the end of the summer. After every major heavy rain/flood winter on the PNW such as I described above, a global temp spike follows around 20 months later. How do I attribute the cause of that though.

            Is that due to the Sun spiking back up after coming off of its minimum, which can be seen in all previous presumed cyclical flood cycles on the PNW? Or is that due to a cleared sky effect similar to what happens several years after a large volcanic eruption, when the material ejected into the atmosphere rains out and that is followed by a spike in temps as Greg Goodman posited some years ago over at WUWT?

            There is no doubt that there will not be a temp spike induced by sunspots climbing back to a first peak as the solar minimum in this case should not occur until the end of this year or early 2019, imo. So if there is a temp spike by July/August, then that could point to a cleared sky effect vs solar spike induced. Interesting, something to observe. A quick example of what I am saying here is that some 20 months after the big PNW flood of 1955/56 in the summer of 1957 my dad took my brother and myself steelhead fishing up on the Trinity River in Northern California. It was hot as a firecracker with triple digit temps, but look at what solar was doing at that same time. That was leading up to the biggest solar spike of the 1900s which finally peaked in 1958.

            By the way for some odd reason the records of those high temps from the year 1957 have been lost. The same goes for the fire history of the massive Clear Lake burn of 1957. As we drove north that early morning from San Francisco my mom woke me up to say look at the fire to the east of Highway 101 as we passed through Sonoma County. The fire raged into the night sky with towering flames shooting up many hundreds of feet. That fire went on for tens of miles in the coastal range mountains to the east of the highway as we drove north. There are no public records of that fire. I looked everywhere, strange.

            So back to the forecast. If there is a global temp spike over the next 5 months, then that will delay the downturn in temps. Then I would expect that it will take until the end of next winter for temps to reach close to the 0.0 C trend line. A further drop of 0.5 C would likely be seen until the mid 2020s, imo. If there is no global temp spike as suggested above, then the drop in temps to 0.0 C will proceed at a quicker pace. The drop to 0.5 C still would take 4 to 5 years as a best guess.

          • Snape says:

            Goldminor

            Many years ago I went on backpacking trip into the Trinity Alps. More recently into the Marble mountains. Wonderful!

        • goldminor says:

          @ Snape ..the Marble Mts are gorgeous. I haven’t hiked in since the end of the 1970s, but have been in several dozen times back then. The Trinity Alps are just north of me, and the Marbles are north of the Trinity Alps. Great fishing, back then you could stay in there for 2 or 3 weeks and never see anyone else.

          • Snape says:

            Still a lot of solitude in the Marble Mts., at least as of 10 years ago. We saw almost as many bears as people.

  21. gbaikie says:

    I don’t think much about the issue of lowering CO2 emissions for couple reasons. One reason is that nuclear power is the easiest way of doing it, another is it a non problem.

    But I was wondering how much reduction of CO2 is due to the satellite industry. And then wondered, that in terms CO2 emissions, what effect would having more of the internet in space be.
    Now what be very significant is having electrical power created in Earth orbit and this hard to get to this point.
    It requires government to vaguely sane, and would require decades of time.
    But server farms consume electrical energy (greens whine about it). So could have served farms, data clouds, and all connections to used by users in space.
    That would be something which could happen a lot quicker then having Space Power Satellites (SPS).
    Now this sort thing is already occurring- and not for purpose of lowering CO2 emission- rather it is the provide faster connection speed and more global connections (and cheaper).
    But in comparison a fast and global internet (have not got there yet) what CO2 reduction compared to solely “ground based” vs solely space based?
    Or how much are we going save in terms of CO2 reduction?

    • Des says:

      “I was wondering how much reduction of CO2 is due to the satellite industry”

      Huh?? What reduction are you talking about?? CO2 concentrations continue to rise. And rise at an increasing rate.

      And what the %#$* does the internet have to do with CO2??

      • Mike Flynn says:

        Des,

        And who cares? Just because you can’t provide any useful input, just indicates how stupid you are, doesn’t it!

        Huh??!?

        Cheers.

      • gbaikie says:

        “IT-related services now account for 2% of all global carbon emissions, according to a new Greenpeace report. Thats roughly the same as the aviation sector, meaning all those Netflix movies the world is streaming and the Instagram photos theyre posting are the energy equivalent of a fleet of 747s rumbling for takeoff. ”
        http://time.com/46777/your-data-is-dirty-the-carbon-price-of-cloud-computing/

        Any good greenie should have known this.
        Aren’t you worried about the polar bears, Des?

        • Des says:

          I asked “WHAT REDUCTION?”

          And I am NOT a greenie.

          • gbaikie says:

            “Des says:
            April 19, 2018 at 10:05 PM
            I asked WHAT REDUCTION?

            And I am NOT a greenie. ”

            You also asked:
            “And what the %#$* does the internet have to do with CO2??”

            and basically said, that in future, all cloud and server farms could be in Earth orbit rather than Earth surface.

            Also in terms CO2 reduction which have already occurred due having satellite market as compared to not having satellite market. Or lacking satellites one would be required to emit more CO2 or having satellites has reduced CO2 emission.

          • Des says:

            You’re not very good at English are you.

          • Mike Flynn says:

            D,

            And who cares?

            Cheers.

          • Des says:

            I’m glad you agree.

          • Mike Flynn says:

            D,

            Agree with what? That you are delusional? Or just stupid and ignorant, possibly.

            Let me know, if you wish.

            Cheers.

          • Des says:

            You don’t think “who cares” would be a rather odd reply if you disagreed with me?

          • Mike Flynn says:

            D,

            What are you babbling about?

            You can’t say what it is you claim I’m agreeing with, can you?

            You make a grandly stupid meaningless statement, hoping to appear clever. Just like self proclaimed climatologists proclaiming the existence of a GHE!

            You can’t back up your mad assertion, any more than stupid and ignorant bumblers like Schmidt and Mann can back up theirs.

            Carry on. Maybe you could try for another gotcha? It would be easier than facing the reality that the GHE doesn’t exist. Just pseudoscientific nonsense.

            Cheers.

  22. ren says:

    It seems that the pattern of winter circulation over Canada is quite stable in periods of low solar activity. The polar vortex then has the tendency to divide into two centers:
    one over northern Canada, the other over Siberia.
    http://files.tinypic.pl/i/00963/fad7neilcsrt.png

  23. ren says:

    The most recent North America snow and ice map in stereographic projection
    https://www.star.nesdis.noaa.gov/smcd/emb/snow/GIF/comb_recent.png

  24. ren says:

    Very humid low develops in the southwest of the US.
    http://www.ssd.noaa.gov/goes/west/weus/h5-loop-wv.html

    • Des says:

      Lows carry rain. When it rains the relative humidity is 100%.
      So how does a low become VERY humid?

      • Mike Flynn says:

        Des,

        Common misconception, but not necessarily true. The air left after losing the water which has condensed into liquid droplets from its gaseous phase is obviously drier than before.

        Maybe you are confused by the fact that water is wet.

        Just because “everybody knows” doesn’t make it true, you know.

        Carry on.

        Cheers.

        • Des says:

          “The air left after losing the water which has condensed into liquid droplets from its gaseous phase is obviously drier than before.”

          If it’s still raining, the relative humidity is still 100% regardless of how much it has rained.

          Perhaps you’d care to explain what part of his graph indicates that the relative humidity of air in this particular low is higher than for any other cloud-carrying atmospheric feature. In answering that, remember that temperature varies across the system, that relative humidity is affected by temperature, and that this graph indicates only total water vapour content and not relative humidity or temperature.

          • Mike Flynn says:

            D,

            You are still wrong. Water is wet, air is obviously not. Why should I address a graph? You made an incorrect statement, for what reason I know not.

            You’re wrong, I’m right, suck it up, and move along. Who really cares?

            Cheers.

          • Des says:

            Bluster from you in lieu of science … got it.

          • Mike Flynn says:

            D,

            I have provided the science. You can provide nothing – not even pseudoscience to back up your nonsense. Others may decide for themselves if I am wrong.

            Cheers.

          • Des says:

            Believe me … they have.

          • Mike Flynn says:

            D,

            Why should I believe someone who is stupid and ignorant?

            You believe that CO2 makes thermometers hotter!

            You can’t actually say how this might happen, you can’t provide a testable GHE hypothesis, all you can plaintively cry is “Believe me!”

            Keep trying – the ranks of true believers are diminishing. Funding is drying up and people are waking up to the fact that the weather (and hence climate), has changed since the atmosphere formed.

            Good luck with convincing anyone that the climate can be prevented from changing. You could always demand that people believed your nonsense – it might work!

            Cheers.

  25. David Appell says:

    Roy wrote:
    “Generally speaking, climate change isnt on the Midwest farmers radar because, so far, there has been no sign of it in agricultural yields. Yields (production per acre) of all grains, even globally, have been on an upward trend for decades.”

    Roy, as I’ve pointed out before, there is evidence that AGW is affecting yields, it’s just, as you write, it’s not yet the dominant signal. But, of course, it’s increasing every year. Maybe technology This is fueled mainly by improved seeds, farming practices, and possibly by the direct benefits of more atmospheric CO2 on plants. If there has been any negative effect of modestly increasing temperatures, it has been buried by other, positive, effects.

    • David Appell says:

      Roy wrote:
      Generally speaking, climate change isnt on the Midwest farmers radar because, so far, there has been no sign of it in agricultural yields. Yields (production per acre) of all grains, even globally, have been on an upward trend for decades.

      Roy, as Ive pointed out before, there is lots of evidence that AGW is effecting yields, its just, as you write, its not yet the dominant signal. But, of course, its increasing every year, and by the time it’s dominant it could be too late. (It could be too late already.) Maybe technology will stay ahead of climate losses, but that’s a big bet to take. But then maybe the farmers don’t care anyway, since these red state free market Republicans take socialized agriculture for granted and know taxpayers will always bail them out and subsidize their incomes. Developing world farmers will just have to fend for themselves.


      For wheat, maize and barley, there is a clearly negative response of global yields to increased temperatures. Based on these sensitivities and observed climate trends, we estimate that warming since 1981 has resulted in annual combined losses of these three crops representing roughly 40 Mt or $5 billion per year, as of 2002.
      — Global scale climatecrop yield relationships and the impacts of recent warming,” David B Lobell and Christopher B Field 2007 Environ. Res. Lett. 2 014002 doi:10.1088/1748-9326/2/1/014002

      With a 1 C global temperature increase, global wheat yield is projected to decline between 4.1% and 6.4%. Projected relative temperature impacts from different methods were similar for major wheat-producing countries China, India, USA and France, but less so for Russia. Point-based and grid-based simulations, and to some extent the statistical regressions, were consistent in projecting that warmer regions are likely to suffer more yield loss with increasing temperature than cooler regions.
      – B. Liu et al, Similar estimates of temperature impacts on global wheat yields by three independent methods, Nature Climate Change (2016) doi:10.1038/nclimate3115.

      “Agriculture is one of the economic sectors most exposed to climate change impacts, but few studies have statistically connected long-term changes in temperature and rainfall with yields. Doing so in Europe is particularly important because yields of wheat and barley have plateaued since the early 1990s and climate change has been suggested as a cause of this stagnation. Here, we show that the impact of climate trends can be detected in the pattern of long-term yield trends in Europe. Although impacts have been large in some areas, the aggregate effect across the continent has been modest. Climate trends can explain 10% of the slowdown in wheat and barley yields, with changes in agriculture and environmental policies possibly responsible for the remainder.”
      — “The fingerprint of climate trends on European crop yields,” Frances C. Moorea and David B. Lobell, PNAS vol. 112 no. 9, 26702675 (2015)

      Total protein and nitrogen concentrations in plants generally decline under elevated CO2 atmospheres. Recently, several meta-analyses have indicated that CO2 inhibition of nitrate assimilation is the explanation most consistent with observations. Here, we present the first direct field test of this explanation.. In leaf tissue, the ratio of nitrate to total nitrogen concentration and the stable isotope ratios of organic nitrogen and free nitrate showed that nitrate assimilation was slower under elevated than ambient CO2. These findings imply that food quality will suffer under the CO2 levels anticipated during this century unless more sophisticated approaches to nitrogen fertilization are employed.
      — Nitrate assimilation is inhibited by elevated CO2 in field-grown wheat, Arnold J. Bloom et al, Nature Climate Change, April 6 2014.

      Higher CO2 tends to inhibit the ability of plants to make protein And this explains why food quality seems to have been declining and will continue to decline as CO2 rises because of this inhibition of nitrate conversion into protein. Its going to be fairly universal that well be struggling with trying to sustain food quality and its not just protein its also micronutrients such as zinc and iron that suffer as well as protein.
      – University of California at Davis Professor Arnold J. Bloom, on Yale Climate Connections 10/7/14

      “Long-term decline in grassland productivity driven by increasing dryness,” E. N. J. Brookshire & T. Weaver, Nature Communications 6, Article number: 7148, May 4, 2015.

      “We also find that the overall effect of warming on yields is negative, even after accounting for the benefits of reduced exposure to freezing temperatures.”
      — “Effect of warming temperatures on US wheat yields,” Jesse Tack et al, PNAS 4/20/15
      http://www.pnas.org/content/early/2015/05/06/1415181112

      Abstract: “Dietary deficiencies of zinc and iron are a substantial global public health problem. An estimated two billion people suffer these deficiencies, causing a loss of 63 million life-years annually. Most of these people depend on C3 grains and legumes as their primary dietary source of zinc and iron. Here we report that C3 grains and legumes have lower concentrations of zinc and iron when grown under field conditions at the elevated atmospheric CO2 concentration predicted for the middle of this century. C3 crops other than legumes also have lower concentrations of protein, whereas C4 crops seem to be less affected. Differences between cultivars of a single crop suggest that breeding for decreased sensitivity to atmospheric CO2 concentration could partly address these new challenges to global health.”
      — “Increasing CO2 threatens human nutrition,” Samuel S. Myers et al, Nature 510, 139142 (05 June 2014).

      “Crop Pests Spreading North with Global Warming: Fungi and insects migrate toward the poles at up to 7 kilometers per year,”
      — Eliot Barford and Nature magazine, September 2, 2013

      “Suitable Days for Plant Growth Disappear under Projected Climate Change: Potential Human and Biotic Vulnerability,”
      — Camilo Mora et al, PLOS Biology, June 10, 2015

      General Mills CEO Ken Powell told the Associated Press:
      “We think that human-caused greenhouse gas causes climate change and climate volatility, and thats going to stress the agricultural supply chain, which is very important to us.”
      8/30/15
      http://www.chicagotribune.com/business/ct-general-mills-greenhouse-gas-cuts-20150830-story.html

      David Titley: “Plants do better, but so do weeds. There are ag thresholds, what about water cycle, there are huge issues of ag in a changing climate.”
      http://rabett.blogspot.com/2015/12/senate-hearing-live-blog.html

      “Anthropogenic increase in carbon dioxide compromises plant defense against invasive insects,”
      Jorge A. Zavala et al, PNAS, 51295133,
      doi: 10.1073/pnas.0800568105

      “Negative impacts of global warming on agriculture, health & environment far outweigh any supposed positives.” Smith et al. PNAS (2009).

      “Rice yields decline with higher night temperature from global warming,” Shaobing Peng et al, PNAS v101 n27 9971-9975.

      “Unfortunately, the simple idea that global warming could provide at least some benefits to humanity by increasing plant production is complicated by a number of factors. It is true that fertilizing plants with CO2 and giving them warmer temperatures increases growth under some conditions, but there are trade-offs. While global warming can increase plant growth in areas that are near the lower limits of temperature (e.g., large swaths of Canada and Russia), it can make it too hot for plant growth in areas that are near their upper limits (e.g., the tropics). In addition, plant productivity is determined by many things (e.g., sunlight, temperature, nutrients, and precipitation), several of which are influenced by climate change and interact with one another.”
      – “Does a Warmer World Mean a Greener World? Not Likely!,” Jonathan Chase, PLOS Biology, June 10, 2015.

      “Food for Thought: Lower-Than Expected Crop Yield Stimulation with Rising CO2 Concentrations,” Stephen P. Long et al, Science, June 30, 2006

      “Climate trends were large enough in some countries to offset a significant portion of the increases in average yields that arose from technology, carbon dioxide fertilization, and other factors.”
      – “Climate trends and global crop production since 1980,” D.B. Lobell et al, Science (July 29, 2011)

      For wheat, maize and barley, there is a clearly negative response of global yields to increased temperatures. Based on these sensitivities and observed climate trends, we estimate that warming since 1981 has resulted in annual combined losses of these three crops representing roughly 40 Mt or $5 billion per year, as of 2002.
      — Global scale climatecrop yield relationships and the impacts of recent warming,” David B Lobell and Christopher B Field 2007 Environ. Res. Lett. 2 014002 doi:10.1088/1748-9326/2/1/014002

      “We also find that the overall effect of warming on yields is negative, even after accounting for the benefits of reduced exposure to freezing temperatures.”
      — “Effect of warming temperatures on US wheat yields,” Jesse Tack et al, PNAS 4/20/15

      “Negative impacts of global warming on agriculture, health & environment far outweigh any supposed positives.” Smith et al. PNAS (2009).

      High Carbon Dioxide Plus Drought Equal Bad News for Crops, Emily Unglesbee , DTN The Progressive Farmer, 9/9/2016.

      Rising temperatures hinder Indian wheat production, press release, University of Southampton, 7/23/14.

      “The results consistently indicate that rising temperatures will lead to reductions in crop yields. An increase of 1C would be more severe for global maize yield (7.4% decrease) than for rice (3.2% decrease), and decreases in maize yield in the United States would be twice those seen in India (10.3 and 5.2%, respectively). Although this work points to worrying consequences of a warming world, it remains very difficult to predict the cumulative impact of multiple factors related to climate change, such as elevated atmospheric carbon dioxide concentrations and precipitation.
      – Crop yields expected to fall as temperatures rise, Emily Morris, Science
      08 Sep 2017: Vol. 357, Issue 6355, pp. 1012-1013
      DOI: 10.1126/science.357.6355.1012-f

      “Temperature is a primary factor affecting the rate of plant development. Warmer temperatures expected with climate change and the potential for more extreme temperature events will impact plant productivity…. The major impact of warmer temperatures was during the reproductive stage of development and in all cases grain yield in maize was significantly reduced by as much as 80-90% from a normal temperature regime. Temperature effects are increased by water deficits and excess soil water demonstrating that understanding the interaction of temperature and water will be needed to develop more effective adaptation strategies to offset the impacts of greater temperature extreme events associated with a changing climate.”
      — Jerry L. Hatfield and John H. Prueger, “Temperature extremes: Effect on plant growth and development,” Weather and Climate Extremes 10 (2015) 410.

      Corn Yields Under Higher Temperatures,
      Figure 18.3, p 421
      U.S. Global Change Research Program, 2014 National Climate Assessment
      https://nca2014.globalchange.gov/report

      • An Inquirer says:

        The articles you cite emphasize how increased temperatures are going to harm production. Maybe they are right; we have fewer heat waves now that we had in decades past. Maybe that is one key reason why production is now. I know it doesn’t fit the models, but it does fit reality.

      • g*e*r*a*n says:

        Jelly, that’s quite a pile of “papers” you keep on hand. You must have a messy bird.

        Wasn’t one of your bird cage liners that made you believe the Sun could heat Earth to 800,000 K?

        • David Appell says:

          Pierrehumberts claim: “In a single second, Earth absorbs 1.22e17 joules of energy from the Sun. Distributed uniformly over the mass of the planet, the absorbed energy would raise Earth’s temperature to nearly 800 000 K aftar a billion years, if Earth had no way of getting rid of it.”
          – Physics Today, January 2011, pg 33
          https://geosci.uchicago.edu/~rtp1/papers/PhysTodayRT2011.pdf

          Proof:

          dT = dQ/mc

          Given: (dQ/dt)_net = 1.22e17 J/s in => dQ = 3.85e33 J over 1 Gyrs.

          m = mass of Earth = 6.0e24 kg
          c = specific heat of Earth = about 850 J/kgK (Table 2.6, http://link.springer.com/chapter/10.1007%2F978-3-642-34023-9_2) for both mantle and outer core (together they comprise over 99% of the Earths volume).

          => dT = 760,000 K

          Q.E.D.

          • gbaikie says:

            Earth is a large very hot ball of rock which has very thin cool surface.
            It is very hot due the energy from it formation billions of years ago (the impact energy of space rocks rapidly forming Earth). And other main component of very large hot ball is due to nuclear energy (Earth has large amount radioactive material). And there some heat generated due to tidal energy.

            Earth maintains it’s heat because only tiny portion is radiated into space. Or its very thin cool surface, cooled from the temperature of molten rock and developed a heat gradient of about 25 C per km depth of rock.

            Sunlight lacks the energy to warm lava. In a vacuum at Earth distance it can only heat a blackbody surface to 120 C.
            Beneath Earth atmosphere direct sunlight is less intense and can only heat a blackbody to 80 C.
            And sunlight can only do this where it is the most intense, which when the Sun is near Zenith.

          • David Appell says:

            I don’t get your point, but in any case it isn’t the real Earth discussed in this problem. It’s one imagined for a heuristic exercise.

          • gbaikie says:

            A star less than 760,000 K, can not warm a planet to 760,000 K.
            The hottest stars are about 50,000 K and our sun is about
            5000 K.
            Mercury distance does not have intense enough sunlight to warm
            Lava. Mercury shortest distance from the Sun is about 46 million km. If you were say 10 million km from the Sun, perhaps the sunlight would be hot enough to warm lava.

          • gbaikie says:

            Electricity, impactors, nuclear energy, and tidal energy can warm lava.
            And magnified sunlight can warm lava, as magnifying sunlight is making sunlight more intense.

          • gbaikie says:

            Also, an ideal thermally conductive blackberry is indicating the intensity of sunlight at certain distance from the sun, in terms of ideal thermally conductive sphere.
            So for a sphere it’s about 5 C, and for two dimensional (flat)
            surface it is about 120 C.

            If you insulate earth or a sphere so it effectively acts as if flat, the highest temperature would be about 120 C.
            If you insulate a sphere and put pin hole of magnified sunlight into the insulated sphere then you can get the sphere to have about the same temperature as the Sun.

          • gbaikie says:

            Blackberry was suppose to be blackbody

          • gbaikie says:

            Anyways, Earth is roughly 5 C.
            Earth oceans are 3.5 C.
            Earth average ocean surface temperature is about 17 C.

            The reason earth average land surface and temperature is
            10 C is the ocean surface warms the land surface air temperature.
            The reason the ocean average surface is 17 C, is that the ocean doesn’t act as a blackbody SURFACE.
            Or if you make the ocean surface act more like a blackbody surface, the ocean will have much lower average temperature.

          • Mike Flynn says:

            DA,

            Oooooh. Heuristic! Good sciency word, which you redefined in the usual stupid Warmist fashion.

            From Merriam-Webster –

            “. . . involving or serving as an aid to learning, discovery, or problem-solving by experimental and especially trial-and-error methods.”

            Not fantasy, not completely ignoring physics in favour of nothing much at all.

            Maybe you meant to say imaginary and completely pointless.

            Cheers.

          • David Appell says:

            gbaikie says:
            A star less than 760,000 K, can not warm a planet to 760,000 K.

            THIS EXERCISE IS NOT ABOUT A REAL PLANET.

            It’s about an imagined Earth that cannot shed heat.

            It’s a thought experiment, a heuristic problem posed to make a certain point about a planet’s energy balance.

            Jeez.

          • Mike Flynn says:

            DA,

            Look up the definition of heuristic. The real definition, not the foolish Warmist definition!

            Geez, how stupid and ignorant are you?

            Cheers.

          • gbaikie says:

            — David Appell says:
            April 21, 2018 at 6:57 PM
            gbaikie says:
            A star less than 760,000 K, can not warm a planet to 760,000 K.

            THIS EXERCISE IS NOT ABOUT A REAL PLANET.

            Its about an imagined Earth that cannot shed heat.

            Its a thought experiment, a heuristic problem posed to make a certain point about a planets energy balance.

            Jeez. —

            But it is a wrong thought experiment.
            Or its very wrong math error.
            As is the idea that Earth could be -18 C (or even colder) if it it lacked the 400 ppm of Co2 in atmosphere.

            Now Earth is mostly very hot and has not lost heat over billions of year due to miles of cooler rock. The thin rocky surface which is cold (about 5 C) does cool quickly. The enormous heat of nuclear bombs at surface is long gone.

            But if surface was very well insulated (had very little heat loss or immeasurable heat loss) the surface would not get very warm.
            With Earth, a warm ocean say 30 C would probably covered with clouds and lack much wind. The reflective clouds are not going to absorb much energy, but since got magical insulation, the clouds would be warmed and then stop being warmed by the sunlight.

            The magical insulation could be helium or hydrogen gas, say 10 atm of it. Not sure which is more transparent, but pick which ever is or combination which is.
            Now with so much h2 and/or helium, it going to be severely lacking in water vapor and also other gases (N2,O2,argon,and C02) in upper atmosphere. And seem to me, it would provide good insulation.
            In addition add a reflective hemisphere which keeps on the night side of Earth. Being above the h2/helium atmosphere it would in addition to IR reflected, it reflect a considerable amount of Shortwave Sunlight and could reflect more sunlight as compared to amount of IR emitted from it.
            Or effectively not emit any energy and should or probably have net gain compared to planet which did not lose heat (which is impossible).
            Or this would be like making a sphere more like a flat surface which is insulated.
            And it is not going to be near the temperature of the Sun (5000 K) nor 800,000 K. Though possible that it is somewhere around 120 C.

          • David Appell says:

            gbalkie: In this problem the atmosphere is irrelevant — too small, of too little consequence for the heat added.

            So how much would the Earth itself warm? That requires knowing how much heat is added (dQ), the Earth’s mass (m) and its specific heat (c).

            Of course, the 760,000 K number isn’t realistic either, because the rock and molten interior would have long since vaporized.

            This is just a simple little exercise to show that the amount of heat the Earth receives from the Sun is immense, and if it did not have a way to shed that heat the consequences are immense. Pierrehumbert is obviously using this little example to show that anything that interrupts the Earth’s ability to shed heat can have warming consequences.

            Is that really so difficult to get?

          • g*e*r*a*n says:

            Jelly clings to his 800,000K, like he clings to his “missing 150 W/m^2”.

            When you have nothing else, you cling to whatever you have.

            It’s fun to watch.

          • Mike Flynn says:

            DA,

            Do you really think that anyone needs Pierrehumbert to tell them that the Sun is hot?

            Or that if my aunt had testicles, she would really be my uncle?

            On the other hand, if cool bodies could increase the temperature of hotter ones, a ship coukd extract the enormous heat energy from the water through which it travelled, to run its engines, and leave a trail of ice in its wake!

            Simple, really – I assume that Pierrehumbert has covered this at the same time as calculating that the Earth’s atmosphere is about as effective at keeping the Earth cool as putting about one seventh of an inch of polystyrene between the surface and the Sun.

            Not a terribly effective sunshade, but better than nothing, I suppose.

            Still no GHE, is there?

            Cheers.

          • gbaikie says:

            — gbaikie: In this problem the atmosphere is irrelevant too small, of too little consequence for the heat added.—

            I also tend think the atmosphere is somewhat irrelevant, or the ocean is far more relevant.
            Though if add 10 times more atmosphere it becomes more relevant. But anyhow.

            — So how much would the Earth itself warm? That requires knowing how much heat is added (dQ), the Earths mass (m) and its specific heat (c).—

            It should also apply to the Moon. So that requires knowing how much heat is added. So with our moon, not much heat is added meter below the surface of the regolith. 1 meter below could be about -40 C at night and -40 C at day or we can assume the range varies by less than 1 C. This change also similar to Earth (1 meter below the surface of ground the temperature remains fairly constant over a period of 24 hrs and also even true in terms a month period of time). Anyhow the lunar surface is very good insulation.
            So over many 24 hour Earth days, the regolith could be over 120 C and square meter surface doesn’t warm the cubic meter surface by much.
            The moon regolith is also roughly 850 Joules per kg per K.
            A cubic meter of lunar regolith is about 2000 kg, and about
            1000 kg is warmed by average of 50 K.
            Or 1000 times 850 times 50 K equals amount joules heat added over say 50 hours or 50 times 3600 is 180,000 seconds of time of 1360 watts per second.
            So over 50 hours a square meter surface could absorb
            180,000 times 1360 joules of heat. And if only absorbed
            1000 watts per second, it’s 180,000,000 joules
            And 1000 x 850 x 50 = 42,500,000 joules.

            Suppose, you replace lunar regolith with a cubic meter of very transparent glass. So say more than 90% of sunlight goes thru the glass and heats the regolith below it, and heated regolith warms the glass block above it.
            And one cubic block of glass is about 2000 kg.And

            So burying cube meter of glass so top is level with top of natural lunar regolith around. And after 50 hours of sunlight which near Zenith, how warm is the top of glass cube.
            Or we can assume the regolith surround glass is 120 C, how warm is the transparent glass?

            Or I would assume the top of glass cube is about 120 C and entire cube is 120 C, and regolith under the glass cube is also about 120 C.
            Or it has absorbed more joules of heat from the Sunlight.

            Now, what does this have to do with crazy idea of Earth being 800,000 K if Earth didn’t lose heat?

            If covered entire moon with 1 thick very transparent glass, the Moon would absorb more heat, and it would radiate more heat, and it’s average temperature would be higher.
            Which is rather obvious, as the more it absorbs the more it will emit. And btw, with meter of glass, the Moon would reflect more sunlight (not a lot more, but more).

            But before I continue, so far, do you agree, or disagree?

          • gbaikie says:

            Well time is up.
            Let us return to:
            gbaikie: In this problem the atmosphere is irrelevant too small, of too little consequence for the heat added.

            As said, I agree that earth atmosphere is irrelevant, but pseudo science world, Venus atmosphere is not considered as
            insignificant.
            In cargo cult, the atmosphere of Venus explains why Venus is hot. But Venus is not considered perfect, else it would closer to 800,000 K.
            A failing of Venus is it reflects too much sunlight.

            Now I think reason Venus is hot is due to the clouds that are reflecting all the sunlight, but for believers they probably think without the clouds reflecting sunlight, Venus would absorb more sunlight and be hotter than it is.
            Or the massive atmosphere of Venus prevents the energy from the sun from leaving or it is trapping heat of the sun.

            So the 800,000 K belief, should predict a larger atmosphere than Venus Atmosphere and lacking any reflective clouds would absorb more sunlight and trap more heat.
            And trap even more heat, one needs better greenhouse gases- so by using super greenhouse gases and having mixture which is best for trapping heat.

          • David Appell says:

            gbalkie: As usual, I can’t even begin to follow what you’re going on about. The exercise has nothing to do with the atmosphere or ocean or the Moon or hydrogen or helium or regolith or Venus or anything else — just a rock.

            You don’t understand – perhaps on purpose? – this one little introductory sentence for a good and interesting article on planetary radiation balance.

          • David Appell says:

            So the 800,000 K belief, should predict a larger atmosphere than Venus Atmosphere and lacking any reflective clouds would absorb more sunlight and trap more heat.

            A planet at 800,000 K doesn’t have an atmosphere. It doesn’t have clouds. It wouldn’t even be a planet – it’d have vaporized long before. This problem isn’t about a real planet. No such planet could exist.

            Whoosh.

          • gbaikie says:

            But enough fantasy.
            At certain distance, the sun has a certain temperature.
            And we quantify that temperature by using a measuring stick called a blackbody surface or blackbody.

            And it Earth distance from the sun, a blackbody surface reaching the temperature of about 120 C. Or the solar flux is about 1360 watts per square meter.

            A star could be bigger and colder than our sun and could also give 1360 watts per square meter and not be as intense as the Sun and have lower temperature at Earth distance.

            A material can have higher temperature than a blackbody at Earth distance from the Sun. Or blackbody absorbs the most emits the most (a non blackbody could emit less than a blackbody).

            So generally nothing on Earth is heated by non magnified sunlight higher 120 C or earth is following the rule.
            And Venus appears to not be following the rule.
            But it is following the rule.

          • gbaikie says:

            “The temperature in the clouds of Jupiter is about minus 145 degrees Celsius (minus 234 degrees Fahrenheit). The temperature near the planet’s center is much, much hotter. The core temperature may be about 24,000 degrees Celsius (43,000 degrees Fahrenheit). ”
            https://www.nasa.gov/audience/forstudents/5-8/features/nasa-knows/what-is-jupiter-58.html

            A planet like Jupiter could be and might have been much hotter than this, and planet do have temperatures which are 800,000 K
            Or hotter.
            Though they would tend to cool over billions of years.

            Whoosh

          • David Appell says:

            At certain distance, the sun has a certain temperature.

            The sun’s temperature is independent of distance.

          • David Appell says:

            So generally nothing on Earth is heated by non magnified sunlight higher 120 C or earth is following the rule.

            This exercise wasn’t about the real Earth, but a imaginary rock that cannot lose heat.

    • RAH says:

      And yet even NASA declares that the earth has been greening the last 35 years!
      http://www.nature.com/articles/nclimate3004

      • Des says:

        So Beijing University is owned by NASA now is it? Interesting.

      • Mike Flynn says:

        Des,

        Why would you believe that Beijing University is owned by NASA? Is it because NASA announced on their website –

        “Carbon Dioxide Fertilization Greening Earth, Study Finds”

        “An international team of 32 authors from 24 institutions in eight countries led the effort, which involved using satellite data from NASAs Moderate Resolution Imaging Spectrometer and the National Oceanic and Atmospheric Administrations Advanced Very High Resolution Radiometer instruments to help determine the leaf area index, or amount of leaf cover, over the planets vegetated regions. The greening represents an increase in leaves on plants and trees equivalent in area to two times the continental United States.”

        I wasnt aware that Beijing University is owned by NASA. Can you provide some evidence, or are you just demonstrating your usual level of ignorance, stupidity and silliness?

        Cheers.

      • Des says:

        The lack of comprehension of someone who doesn’t understand the meaning of a question mark.

        • Mike Flynn says:

          Des,

          You’d have to be really stupid and ignorant to pose a gotcha as a serious question, wouldn’t you?

          Or were you just trolling?

          Cheers.

  26. An Inquirer says:

    I recently read an article produced by the South Dakota state government on climate change and agricultural production. They had the obligatory warnings that climate change will have unfavorable impact on agriculture, and then discussed what has happened to agriculture production in the last 40 years. Of course, production is up — and not just because of better seeds. But also important are changes in the climate: Heat waves are down and precipitation is up. That is not what the climate models predicted, but that is reality.

    • Nate says:

      Production is up for many reasons, irrigation, advances in hybrids, pesticides, fertilizer, mega farms. Hard to separate climate’s effect from all these.

      • Mike Flynn says:

        N,

        Climate is the historical average of weather.

        Or are you trying to say that increased CO2 is only responsible for identifiable adverse affects, as identifiable beneficial effects do not exist?

        Have you a testable hypothesis for such a bizarre claimed effect?

        Cheers.

        • Nate says:

          Mike, Thats a non-sequitor. Seems unrelated to the topic.

          • Mike Flynn says:

            N,

            Just wondering if production happens to be down, you might find a reason to blame CO2?

            Just like people who might think that increasing the amount of CO2 in the atmosphere makes thermometers hotter!

            Or that removing CO2 from a sample of air makes it colder.

            Some people might be mad enough to claim only the heating, but not the cooling. Complete nutters, eh? Might even be stupid and ignorant enough to believe that the Earth could somehow accumulate heat! Heating without cooling!

            I’d like to see that! Unfortunately, it’s completely impossible, existing only in the fevered imaginations of the terminally gullible.

            By the way, non sequitur is generally spelled with a “u”, but foolish Warmists tend to be sloppy and lacksadaisical with facts, so feel free to spell any way you like.

            You don’t need to thank me.

            Cheers.

      • Nate says:

        Mike, as often said by someone on this blog, quote me exactly, then tell me what part you disagree with. Not willing/able to do that, then you are arguing with yourself.

        • Mike Flynn says:

          Nate,

          I did. Learn to read.

          Cheers.

        • Nate says:

          Nope you certainly did not. Here I’ll do it for you.

          “Production is up for many reasons, irrigation, advances in hybrids, pesticides, fertilizer, mega farms. Hard to separate climates effect from all these.”

          Now which part do you disagree with and why?

  27. David Appell says:

    Roy wrote:
    “Nowhere in the original scientific study can I find any observational evidence of such a shift…. The fact is, the study is a modeling study not observational. They tell us what might happen in the coming decades, given certain (and numerous) assumptions.”

    Roy, I believe you got this wrong.

    Their observational methodology is discussed in section 2:

    https://journals.ametsoc.org/doi/pdf/10.1175/EI-D-17-0012.1

    “In this case atmospheric data from the National Centers for Environmental Prediction (NCEP) North American Regional Reanalysis (NARR) reanalysis (Mesinger et al. 2006) are used in combination with precipitation data developed by the PRISM Climate Group at Oregon State University [details of which can be found at http://www.prism.oregonstate.edu and in Daly et al. (2000)]. The data period covers 1979 to 2015, and the spatial resolution is 1/88 in latitude and longitude. The atmospheric data were used by NLDAS-2 to force three different land surface models, Mosaic, VIC, and Noah, but, for brevity, as in Part I, we only present results using the Noah model.”

    (Emphasis mine.)

    Yes, they are calculating the net effect using land surface models, but they are using real data (or reanalysis data) as inputs — not unlike, in principle, how UAH uses real microwave data as input to output temperatures.

    What you wrote is wrong: “The fact is, the study is a modeling study not observational. They tell us what might happen in the coming decades, given certain (and numerous) assumptions.”

    You owe Doyle Rice of USA Today an apology.

    • Mike Flynn says:

      DA,

      As you quoted –

      “The atmospheric data were used by NLDAS-2 to force three different land surface models, Mosaic, VIC, and Noah, but, for brevity, as in Part I, we only present results using the Noah model.”

      Forcing the models? To produce the desired result no doubt.

      Good luck with predicting the climate. The IPCC says it can’t be done, but of course theyt didn’t ask you.

      I wonder why?

      Cheers.

    • Curious George says:

      David, how many apologies do you owe Dr. Judith Curry?

  28. David Appell says:

    Roy wrote:
    “And so, the study begs the question: how has growing season precipitation changed in this 100th meridian zone? Using NOAAs own official statewide average precipitation statistics, this is how the rainfall observations for the primary agricultural states in the zone (North and South Dakota, Nebraska, Kansas, and Oklahoma) have fared every year between 1900 and 2017.”

    If the analysis was this simple, Roy, ask yourself why the paper didn’t present just your graph. (Otherwise you have a one-page rebuttal to the paper right here, read to be published. Print out your blog post and submit it.)

    As you know, the Seager et al paper analyses more than just precipitation (from Section 2):

    “To analyze precipitation, evapotranspiration, and atmospheric moisture transports….”

    This is a good example of a blog post that tries to deny a lengthy published work with a graph or two and fails completely once someone looks into the details. More appropriate for WUWT.

    • Mike Flynn says:

      DA,

      You’d probably believe that the climate hasn’t been changing since the atmosphere formed. Climate is the average of weather, you know.

      Thrash about, David. Keep making your pseudoscientific assertions.

      You can’t even produce a testable GHE hypothesis, can you?

      No science there. You obviously believe that increasing the amount of CO2 between the Sun and a thermometer makes the thermometer hotter! What a loony idea! That’s the sort of nonsense that bumbling fumblers like Schmidt, Mann and Trenberth believe.

      Keep thrashing – maybe it will generate some work for you. Who knows?

      Cheers.

  29. ren says:

    A cold front in the low will increase convection and increase the amount of water in the column.
    http://images.tinypic.pl/i/00963/7qljkezr32w7.png

    • ren says:

      In New Mexico form thunderstorms that will bring heavy snowstorms in the mountains of Colorado.

    • Des says:

      A US map made in Poland … interesting. And still no legend.

      • Mike Flynn says:

        D,

        And still – who cares? Just you, or somebody else?

        Cheers.

        • Des says:

          Clearly you do. You keep responding.

        • Mike Flynn says:

          D,

          I just asked a question – thats all. As usual, you have no answer.

          No surprises there!

          Cheers.

          • Des says:

            Because of course, “who cares?” is not a rhetorical question …

          • Mike Flynn says:

            If you say so, Des, if you say so!

            Cheers.

          • Des says:

            I say only what you imply.
            Anyway – good to see you continuing to care!

          • Mike Flynn says:

            D,

            You are completely stupid and ignorant if you believe that inference is a substitute for fact.

            Why not just read and comprehend what people write? If you dont believe it, and you have facts to support your disbelief, others might change their views.

            I certainly would. Stupid and ignorant believers in the impossible and non-existent GHE are great believers in implications, redefinitions and strident unsupported assertions!

            Can you produce a testable GHE hypothesis? No? And yet you still believe it exists?

            Back to your fantasy world, laddie. Dream on.

            Cheers.

          • Des says:

            The caring just doesn’t stop!!

  30. ren says:

    A geomagnetic storm is underway in the north and south. Storm caused by another coronal hole on the Sun.

    • Des says:

      Record of coronal holes between 1998 and 2006:
      https://tinyurl.com/coronalhl
      (You have to do the search yourself.)

      4420 coronal holes on the 2107 days on which a reading was taken.
      An average of 2.1 coronal holes per day.

      So … what is special about a coronal hole?

      • Mike Flynn says:

        Des,

        On the other hand, what is not?

        The world wonders, do you think?

        Cheers.

        • Nate says:

          Mike, commenting etiquette says that if you have no interest in a post, dont respond to it. It benefits all.

        • Mike Flynn says:

          N,

          And what would possibly give you the idea that I am likely to take any notice of you?

          If I choose to seek advice, why would I choose to seek it from a stupid, ignorant, and delusional person?

          Are you stark, raving, bonkers as well?

          I am ignoring your advice, if you are still in doubt of my intentions.

          Cheers.

          • Des says:

            You wrote a lot of words just to say you’re a dick.

          • David Appell says:

            What Des wrote. Time ten.

          • Mike Flynn says:

            D,

            You woudn’t exist if a dick wasn’t involved, would you?

            Unlike climatologists, dicks can be useful – although, as in your case, the result may be sub-optimal.

            Thanks for the compliment, although flattery will get you nowhere.

            Cheers.

          • goldminor says:

            @ Mike Flynn …I am starting to see your point regarding Des.He shows no respect for Dr Spencer by making his atheistic comment up towards the top of the page, and out of the blue. The he won’t respond as to why he is even bringing that into a science related conversation. Typical atheist behavior. They think that they are so superior to those who hold religious beliefs. I agree with your assessment although I would typically be to polite to get dragged into this style of conversation. Have at it, though.

          • Mike Flynn says:

            g,

            Thanks.

            I dont mind feeding trolls. Feed them enough, they swell up and burst. Just like some species of ticks.

            Thomas Jefferson wrote –

            “But it does me no injury for my neighbour to say there are twenty gods, or no god. It neither picks my pocket nor breaks my leg.

            I agree. Live and let live, I say. Nothing wrong with a quiet life as far as I can determine – so far, at least!

            Cheers.

          • Nate says:

            MF “I dont mind feeding trolls.”

            Troll: to antagonize (others) online by deliberately posting inflammatory, irrelevant, or offensive comments or other disruptive content.

            The last 3-4 posts of MF, lets see:

            Antagonize – check

            inflammatory – check

            irrelevant–double check

            offensive – obviously

            disruptive – as often as possible.

            Yep, Mike is the poster child of trolls.

          • Mike Flynn says:

            Nate,

            Thank you for your compliment.

            Don’t blame me because you choose to be offended, antagonised, etc. Facts are facts, regardless of whether you like them or not.

            There is no testable GHE hypothesis. Feel as offended as you like. Throw a tantrum. After all that, still no testable GHE hypothesis is there?

            Try some more pseudoscience – that might make a stupid and ignorant person feel better about themselves, don’t you think?

            Cheers.

          • Nate says:

            N:” if you have no interest in a post, dont respond to it. It benefits all”

            MF:”I am ignoring your advice”

            MF: “Live and let live, I say.”

            Ok, Mike, then follow your own advice.

      • Laughable when compared to the number of resident arse holes on the Earth.

  31. ren says:

    A strong geomagnetic storm will increase the jet stream dynamics.

  32. tonyon says:

    …interstellar travel constant acceleration (Earth Day)… PLANETARY EMERGENCY: global warming due to pouring pollutants greenhouse effect into the air…the generalized burn fossil fuels it must stop immediately. Cars Factories: is inadmissible design dirty new cars with internal combustion, have to make and buy Solar Energy clean electric cars. Stop F1, welcome EF. Eliminate the cattle and natural meat how food. Leave Carbon and Petroleum for nonflammable uses. There are huge quantities of Methane also in oceanic bottoms how solid methane-hydrates, waiting… Methane Big Greenhouse Effect… Over there is visible, Lakes on polar areas already are releasing from bottom to surface big methane bubbles… Permafrost is Melting…when all that methane passing to Atmosphere… We receive vague communiqus… What can we do for avoid the future catastrophe on Earth?. Have to cooling the Planet again urgently, and do not thinking more Wars. Humankind must surmount its technological adolescence and go beyond…to the stars.

  33. ren says:

    The cold air will remain above the Rocky Mountains, causing storms in the Midwest.
    https://earth.nullschool.net/#2018/04/21/1200Z/wind/isobaric/700hPa/overlay=temp/orthographic=-104.05,33.52,1369

  34. ren says:

    The southern US must be ready for heavy rainfall.
    http://www.ssd.noaa.gov/goes/west/weus/h5-loop-wv.html

  35. David Appell says:

    Roy, not sure if you realize it but this paper consists of TWO parts, and the observations are in Part I. You seem to be writing only about Part II.

    https://journals.ametsoc.org/doi/pdf/10.1175/EI-D-17-0011.1

    • bilybob says:

      David, I reread both parts and I cannot find any observational data showing that the change has occurred. Roy’s criticism is on the headline that says it has already happened. The observational data is related to verifying Powell’s assessment and later Webb’s assessment. Powell used the 100th meridian for the divide while Webb thought it was the 98 meridian, but would defer to Powell since it had been accepted.

      The two articles provide a higher detail and additional reasons for its existence over the simplistic view that the Rocky Mountains cause dry air to cover the plains.

      • David Appell says:

        Part I, Figure 8.

        • bilybob says:

          from part 1

          Over the past decades, aridity has increased, and there has been an
          eastward movement of given aridity values. This is contributed to most strongly by warming-induced increases in PET. The P-induced changes in AI, most notably in the west, could be related more to natural decadal variability than to human-induced climate change.

          Not sure how this translates to movement of 140 miles. Clearly the headline is deceptive.

          • David Appell says:

            Not sure how this translates to movement of 140 miles.

            That’s a statement about you, not the paper or article.

            Clearly the headline is deceptive.

            The ease with which you call people liars and deceptive just to deny the science is typical.

        • bilybob says:

          Let me try to bring it down to something simple then. What page shows observed, I repeat, observed, not modeled, not modeled using observed inputs, I mean actual real, I can see data that shows the real observations by Powell and Web have shifted 140 miles to the East.

          Whereas, Roy showed real data, and you have failed to produce any, I will go with his statements not yours. If you cannot produce it, I understand. But I stand by my statement, the headline is deceptive. If you prefer to pull the oh, you are a denier crap, go ahead, I for one prefer a more truth discussion.

  36. goldminor says:

    So here are two predictions which I made earlier this year. One has to do with the ongoing drought in Capetown South Africa, and the other has to do with the Onslow Aus tropical cyclone history. Here is Capetown first, —————————

    Here is a quick look at the Capetown drought record and my take on ‘Why’.
    Drought yr Sunspot Cycle Solar Max Solar Minimum

    1851/54-4yr. #9 .1850 ..1856

    1864/66-3yr. #10 ..1862/63 1867

    1894/97-4yr .#13 ..1892/93 1900/01

    1926/31-5yr .#16 ..1926/27 1932/33

    1963/67-5yr .#19 ..1958/59 1965/66

    1971/73-3yr .#20 ..1968/69 1975/76

    2015/?? …#24 ..2013/14 .???? 2019/20?

    My forecast, one more year of drought for certain, highly probable for 2 more years as this look like the mid 1960s as an analog, imo. This is one of my forecasts, or my way of seeing if I am seeing a good picture.

    • goldminor says:

      And Onslow Aus TC prediction, ….Here are my thoughts. The forecast is for a cyclone to strike Onslow this year, and in the next 2 years, 2019/20. One of the two years of 2019 or 2020 will have 2 cyclones in the season. Next year, 2019, should be the biggest cyclone within this group of TC activity. There is a strong probability for a cyclone in 2021, and 50% chance for 2022.

      Now let us wait and see what nature does. Here is the associated story and graph of historical TCs at Onslow. ..http://www.bom.gov.au/cyclone/history/wa/onslow.shtml

  37. ren says:

    A large temperature difference in the South and strong wind at an altitude of 5000 meters promises strong convection.
    https://earth.nullschool.net/#2018/04/22/1800Z/wind/isobaric/500hPa/orthographic=-93.95,37.55,1369

  38. bilybob says:

    Dr. Spencer,

    I cant believe you cant see the light! When the science says shifted closer towards the 98th meridian, it means moved to the 98th meridian. Seriously though, I am glad you are not that gullible but sad to see some actually bought into it.

    What is more interesting though, is Powell in the late 1800s suggested the 100 meridian as the dividing line and Webb in the 30s thought it was closer to the 98th meridian. This is coincides with the dust bowl years. Of course, science deniers will blame farm practices for the shift when reality is this is just more natural variation. Farm practices only exasperated the problem. I also find interesting that after the cooling period of the 60s/70s the dividing line moved back to 100 and is now showing evidence of shifting back after shifting back to a warming trend. Your thoughts?

    • David Appell says:

      bilybob says:
      Seriously though, I am glad you are not that gullible but sad to see some actually bought into it.

      What of Seager et al’s science and methodology do you find problematic?

      • bilybob says:

        Nothing David. I thought it was good work and useful. As with all science endeavors, there is always room for improvement. But overall great work. That’s why I am interested in Roys input to using it to confirm Powell vs. Webbs observations by using the methodology back in time. If possible, it may explain better the dust bowl era. Your thoughts?

        But your question gives me insight to your previous responses. I was never criticizing the science of Seager et al. They provide a methodology in determining where this dividing meridian will change over time under certain conditions. Their paper however, never says the meridian has actually moved 140 miles, only that the model shows the arid conditions are moving towards the 98th meridian. And then proceed how in the future it may look under certain conditions.

        Roy’s blog entry was a criticism of the USA headline. It is fear based and not true. The meridian has not currently moved 140 miles, it may move, but has not moved. It was all about the tense of the verb being used. The Columbia University press release, was in my opinion more appropriate.

        • David Appell says:

          Thats why I am interested in Roys input to using it to confirm Powell vs. Webbs observations by using the methodology back in time.

          You want to use the same methodology as was used 100 yrs ago? Why?

          How much of the 100th meridian did Powell survey, anyway?

          • bilybob says:

            I was thinking it may be of historic value to use Seager et. al. methodology to go back in time. But only if possible. Some of the variables may not be complete going back to Powell, but maybe to Webbs time. Surrogate data may be needed.

            Not sure how much Powell Surveyed, it was discussed in Seager et al’s paper.

          • David Appell says:

            Surrogate data?

        • David Appell says:

          Roys blog entry was a criticism of the USA headline. It is fear based and not true. The meridian has not currently moved 140 miles, it may move, but has not moved.

          In fact, Roy and you are wrong, and the headline is true. The line has moved east. Read the paper and the press release.

          “Data collected since about 1980 suggests that the statistical divide between humid and arid has now shifted closer to the 98th meridian, some 140 miles east.”

          http://blogs.ei.columbia.edu/2018/04/11/the-100th-meridian-where-the-great-plains-used-to-begin-now-moving-east/

          • bilybob says:

            2 feet, 500 feet, or 140 miles closer? Also, the divide is more than just arid conditions, it is how land use changes occur. They have not yet.

          • David Appell says:

            2 feet, 500 feet, or 140 miles closer?

            Closer to what? Did you read the press release/

            Also, the divide is more than just arid conditions, it is how land use changes occur. They have not yet.

            Where does the paper say land use changes haven’t occurred yet?

          • Mike Flynn says:

            DA,

            And you still cant provide a testable GHE hypothesis yet, can you? Just more attempts to deny, divert, and confuse.

            Keep at it.

            Even Gavin Schmidt is reduced to writing fiction, and pretending it is science – The Silurian Hypothesis!

            “Accepted for publication in the International Journal of Astrobiology.

            Another fine example of climate pseudoscience! I hope his employers are mightily impressed with his taxpayer funded research. Im not sure what astrobiology has to do with the GHE, but there must be a connection somewhere.

            Maybe he has realised he works for the National Aeronautics and Space Administration, do you think?

            Cheers.

          • bilybob says:

            David says “Closer to what”

            My point exactly. Powell had the divide at 100 meridian, Webb at 98 meridian.

            David asks about land uses.

            The paper refers to the varying land uses/vegetation/settlement pattern signifying the difference between the humid and arid regions. The exception being Nebraska that has good access to ground water. There is no mention of any changes to these land uses/vegetation/settlement pattern in the past few decades in this research. This research used land use/climate data to develop a model for determining how the arid regions would shift. It is embodied in Figure 8, but this is not the overall change in the “Physical and Human Geography of Americas Divide” This research is about the potential change in the “Divide” in the future.

            Over the past decades, aridity has increased, and there has been an eastward movement of given aridity values. This is contributed to most strongly by warming-induced increases in PET. The P-induced changes in AI, most notably in the west, could be related more to natural decadal variability than to human-induced climate change.

          • David Appell says:

            How much of that longitude did Powell survey, exactly?

            The press release says the shift since 1980 is 140 miles east. Yet you won’t even accept that it says that.

            Where does the paper say land use changes havent occurred yet?

            The P-induced changes in AI, most notably in the west, could be related more to natural decadal variability than to human-induced climate change.

            “Could be?” Based on what evidence and science?

          • bilybob says:

            The P-induced changes in AI, most notably in the west, could be related more to natural decadal variability than to human-induced climate change.

            David Says
            “Could be? Based on what evidence and science?”

            You should probably direct that question to Seager. It is a quote from their conclusions in Part 2. I forgot to reference it in my haste. Sorry.

            David quotes from press release.

            “Data collected since about 1980 suggests that the statistical divide between humid and arid has now shifted closer to the 98th meridian, some 140 miles east.”

            One should take care in interpreting this sentence. For one, this is not from the research paper. Two, the 98th meridian is 140 miles east, not the shift. Finally, and again, Powell says the divide is at 100th in late 1900’s and Web says it was at 98th meridian in 1930’s. So, who was right, and why can’t both have been correct and the change related to decadal natural climate variability?

          • Mike Flynn says:

            DA,

            What’s your point, David?

            If the GHE cannot be described properly, any pseudoscientific paper purporting to depend on the non-existent GHE is invalid, surely?

            One might as well argue about the minutiae of a paper based on phrenological science.

            Maybe you could tell us why there is no testable GHE hypothesis?

            Maybe it would be pointless, considering that the IPCC states that future climate states are unpredictable. Settled science. What will be, will be, it seems.

            Carry on with your fortune telling. Maybe you could get paid for it, if you can produce useful predictions. Good luck.

            Cheers.

          • bilybob says:

            Just another quick comment. The meridian at the equator is approximately 70 miles apart. I had assumed the news release just erred on the 140 mile number, it is much closer in this portion of the globe. It is not in the research paper, just some editor that probably asked the wrong question on the distance between 2 meridians.

          • Snape says:

            bilybob, I found this:

            “At 40 north or south, the distance between a degree of longitude is 53 miles (85 kilometers).”

          • Snape says:

            40 degrees north defines the border between Nebraska and Kansas.

          • bilybob says:

            The distance between 2 meridians at 30 degrees lat. is 120 miles
            As you move north that distance gets lower.

            https://stevemorse.org/nearest/distance.php

          • bilybob says:

            Thanks Snape, found a online calculator for the distances. See above.

          • Snape says:

            Bilybob

            I was looking up information on meridians not realizing you had already posted the calculator. Anyway, smart of you to notice the distance error.

          • Snape says:

            I never would have thought to question the distance between meridians.

          • David Appell says:

            One should take care in interpreting this sentence. For one, this is not from the research paper.

            So what? It comes from the press release, and from the paper’s findings.

            Two, the 98th meridian is 140 miles east, not the shift.

            The shift in agricultural conditions is 140 miles east.

            http://www.ldeo.columbia.edu/news-events/100th-meridian-where-great-plains-begin-may-be-shifting

            Finally, and again, Powell says the divide is at 100th in late 1900s and Web says it was at 98th meridian in 1930s. So, who was right, and why cant both have been correct and the change related to decadal natural climate variability?

            Who cares what either of them said? Do you think a farmer in Nebraska cares what they said, or would she care about what’s happening now? Who do you think have better data, today’s scientists or Powell & Web?

          • bilybob says:

            David, I believe the press release was written by Kevin Krajick.

            Kevin Krajick is the Earth Institutes senior editor for science news. A native of upstate New York, he started in journalism at his high-school newspaper in the late 1960s. He has since reported from all 50 U.S. states and 30-some countries, covering science, criminal justice, immigration and other areas.

            His piece was not peer reviewed (your gold standard). Yet you continue to refer back to this.

            Roy’s comments was on the USA piece. He is correct and you have not made your case. The paper by Seager et. al. shows a shift in aridity and not a movement of the divide itself. Such land use changes take time, farms will need to be consolidated and crops will change from high intensive water needs to more drought resistant types. Thus the press release by Krajick is correct when he uses the word “may”. Whereas the USA article states that it has already moved. It has not.

            Additionally the author concludes the following in part 1.

            Over the past decades, aridity has increased, and there has been an eastward movement of given aridity values. This is contributed to most strongly by warming-induced increases in PET. The P-induced changes in AI, most notably in the west, could be related more to natural decadal variability than to human-induced climate change.

            Please note the authors talk about aridity values and not a change in farming practices or even changes in natural vegetation.

            And in part II “Under such climate change we would expect the modeled aridhumid divide to move or the effective 100th meridian to advance eastward. Given that the aridity gradient is expressed in the agricultural economy, this could necessitate farms to adapt to new environmental conditions, by consolidation and changes in crops grown, for example, or risk becoming unprofitable.”

            Please note the verb tense the author chose. “this could necessitate…” If they had observable data of changes, I believe they would have provided it. But it is not stated anywhere. The Figure 8 you refer to is a modeled graph and has not manifested in actual land use changes. The divide had not moved. It may in the future but even the authors have doubts.

          • bilybob says:

            David Asks

            “Who cares what either of them said? Do you think a farmer in Nebraska cares what they said, or would she care about whats happening now? Who do you think have better data, todays scientists or Powell & Web?”

            Seager et. al. apparently cared.

          • David Appell says:

            Seager et al quoted some very brief and generic historical comments, nothing like methodologies. As a way to set the scene.

          • David Appell says:

            The Seager et al paper is certainly peer reviewed.

            And you can be sure the scientists carefully reviewed the press release for accuracy.

            Roy is (clearly) wrong, and it’s not even clear he knew there *was* a Part I to the paper. He certainly didn’t mention it or link to it.

          • bilybob says:

            David Says
            “And you can be sure the scientists carefully reviewed the press release for accuracy.”

            I really cant be sure, but let us assume they approved the title.

            “The 100th Meridian, Where the Great Plains Begin, May Be Shifting”

            “May shift is in sharp contrast to the USA Today article which states it has shifted.

            There is no reference to how far it has shifted in the paper. The authors just say it is moving east. The closest you can come to an actual figure is in Figure 9 that projects the curves related to land use. And those shift at most 2 degrees east but not until the end of the century and only in the southern region. Unless your are claiming the shift is complete.

            So my thought is the editor of press release just missed it. They made a mistake in the 140 miles equates 2 degrees of longitude at these latitudes. So if you say the authors QCed it, they did a poor job.

          • Gordon Robertson says:

            David Appell…”In fact, Roy and you are wrong, and the headline is true. The line has moved east. Read the paper and the press release”.

            Coming from a b*** kissing alarmist like you that opinion gives me a great deal of confidence.

          • Gordon Robertson says:

            bilybob…”Roys comments was on the USA piece. He is correct and you have not made your case”.

            DA’s MO is not to make any case, whatsoever, he’s an alarmist journalist who is on this blog as a troll to disrupt skeptical input.

            He interviews uber-alarmists like Kevin Trenberth and avoids moderate skeptics like Roy and John Christy of UAH.

          • Gordon Robertson says:

            bilybob…”The distance between 2 meridians at 30 degrees lat. is 120 miles
            As you move north that distance gets lower”.

            It’s kind of neat, actually. If you could get to the true North Pole, you could stand there for 24 hours as the Earth rotates and take in the view as the planet sweeps you through 360 degrees.

            Mind you, if you go in winter you’ll be standing on 10 feet of ice and the temps could be as low as -50C. Watch out for polar bears, they kill humans just for the heck of it. There are bleeding hearts out there who feel sorry for them.

          • David Appell says:

            bilybob says:
            They made a mistake in the 140 miles equates 2 degrees of longitude at these latitudes.

            The difference isn’t important for a national family newspaper.

          • David Appell says:

            bilybob says:
            There is no reference to how far it has shifted in the paper. The authors just say it is moving east. The closest you can come to an actual figure is in Figure 9 that projects the curves related to land use. And those shift at most 2 degrees east but not until the end of the century and only in the southern region.

            You are willfully blind. Again, FROM THE PRESS RELEASE:

            “Data collected since about 1980 suggests that the statistical divide between humid and arid has now shifted closer to the 98th meridian, some 140 miles east.”

            That is the shift since 1980. You are denying what is written in black and white.

            http://www.ldeo.columbia.edu/news-events/100th-meridian-where-great-plains-begin-may-be-shifting

          • bilybob says:

            David, they are referring to the 98th meridian being 140 miles east, not the shift. I am currently traveling from Atlanta to Huntsville, some 120 miles away. Each mile I travel I am getting closer, but I can assure you I have not yet arrived. As far as your comment related to the error related to the distance between meridians was acceptable just reinforces the notion that the press released was not verified and is a useless resource other than letting you know the research exists.

            But if you are so insistent on using the press release so be it. Live in your denial. I will use the peer reviewed document. The peer reviewed document has no mention of the divide actually moving, it is a projection only and it is for 2100. See Figure 9. But if you wish to believe it has already moved because you simply lack the ability to comprehend the sentence in the press release feel free to be empowered. Everyone else will know the truth. Part 1 was only a modeled reduction in aridity since 1980 and any movement of the divide.

            However, based on your comment that its the long term trend that matters, and Roy has pointed out the positive trend in precipitation for this area. I would think the point is moot. In fact, it may actually shift west given the increases in rain.

          • David Appell says:

            BB: The denial is yours.

            You are clearly grasping at straws to find any trivial excuse to reject this paper.

            Your arguments aren’t convincing.

          • David Appell says:

            BB wrote:
            “However, based on your comment that its the long term trend that matters, and Roy has pointed out the positive trend in precipitation for this area.”

            Precipitation isn’t the only way moisture is transported.

            The paper uses “PET.” Read.

            I think you (and Roy) know this, but for some reason pretend not to.

          • bilybob says:

            DA

            Where did I ever reject the paper? Can you show me? I have only rejected yours and USA Today’s interpretation.

            The paper clearly shows the movement of the divide toward the 98th meridian has not occurred, but will in 60 to 80 years. I suggest you try reading the paper. Focus on verb tense. The author are clearly talking of the future.

            Part 2 ABSTRACT: The 100th meridian bisects the Great Plains of the United States and effectively divides the continent into more arid western and less arid eastern halves and is well expressed in terms of vegetation, land hydrology, crops, and the farm economy. Here, it is considered how this aridhumid divide will change in intensity and location during the current century under rising greenhouse gases.

            There is no mention of the divide being moved 140 miles east or to the 98th meridian. Authors were very careful in being clear in the conclusions. I suggest you look a Part 2 Figure 9. It shows the changes in farm economy will be more impacted in southern part, but even that is at most 2 degrees east over 60 years. Part 1 was simply a calibration/development of their model.

            As far as Roy’s chart showing the precipitation trend, I mentioned it because of a general observation of your comments on this blog. If the TREND depicts Global Warming you support it, if it contradicts your belief, you attack. If Carbon Dioxide and Crop production don’t match perfectly, it must not have a relationship, but CO2 definitely causes global warming even though temperature CO2 don’t perfectly match. You reveal yourself as a hypocrite. You have lots of knowledge but no wisdom. And you are clearly blinded by your biases.

          • David Appell says:

            bilybob says:
            The paper clearly shows the movement of the divide toward the 98th meridian has not occurred, but will in 60 to 80 years.

            You are a bald faced liar who will not accept what is written in black and white:

            “Data collected since about 1980 suggests that the statistical divide between humid and arid has now shifted closer to the 98th meridian, some 140 miles east.”

            http://www.ldeo.columbia.edu/news-events/100th-meridian-where-great-plains-begin-may-be-shifting

  39. ren says:

    Dr Roy Spencer, is not the precipitation in the mountains equally important for the western Midwest? Do not mountain rivers feed the cultivated land?

  40. ren says:

    Low with thunderstorms it will move to the south-east to 24 April and will cause extremely strong rainfall in Florida.

  41. ren says:

    Heavy rain and thunderstorms in the southern US.
    http://files.tinypic.pl/i/00963/2zi1zqb0n45l.png

    • Gordon Robertson says:

      ren…”Current temperature in North America”

      Thanks for confirming that the United States is IN America, and not America itself. It’s easier to see that on a map, especially when you cannot even see the 50th state, Hawaii, because it’s not in America ta all. ☺ ☺

    • Gordon Robertson says:

      ren…”In Canada, the snow cover will increase. Snow will also fall in Montana”.

      On the ‘wet’ coast (aka west coast) of Canada, at Vancouver, it is currently 12C. The forecast is for up to 22C next week, which will be welcome, and the temps at Vancouver are 5 to 10C lower than 30 to 50 miles inland. It should reach 27 – 30C inland.

  42. ren says:

    The height of the tropopause over North America shows the “battle” between ozone and water vapor.
    http://images.tinypic.pl/i/00963/hsy6hladpgcm.png

  43. Joe Rancourt says:

    And is this caused by global warming also
    Weather.Com https://weather.com/storms/tornado/news/2018-04-19-no-tornadoes-oklahoma-record-2018

    Fewer tornadoes than average have occurred so far in 2018 and portions of the Plains that would typically expect at least a few tornadoes by now have not seen any of these dangerous storms. In fact, this may lead to a new tornado record for Oklahoma.

    Through April 18, a preliminary 255 tornadoes have been reported this year. This is below the 10-year average of 371 tornadoes from 2005 through 2015, according to NOAA

    • Nate says:

      Unlike in Lake Wobegon, its kinda hard for every year to be above the average.

      • Mike Flynn says:

        Nate,

        But if increasing the amount of CO2 in the atmosphere results in higher global average temperatures, wouldnt every year be above average in line with increasing CO2?

        Or does increasing the amount of CO2 between the Sun and the surface only make the surface hotter on average, but not every year?

        If the average surface temperature has risen over the last 50 years, does that mean that some years have been colder than the average, or has each year been The hottest year EVAH!?

        It seems a little odd that GHE supporters claim that there is danger from rising temperatures due to CO2, if sometimes increased CO2 results in temperatures that are colder than average. A testable GHE hypothesis would allow some scientific examination of these oddities, and eliminate doubt, but you havent found a testable GHE hypothesis have you?

        Just pseudoscientific statements like . . . its kinda hard for every year to be above the average. It’s also kinda hard to believe that increasing the amount of CO2 between the Sun and a thermometer makes the thermometer sometimes hotter, and sometimes colder – on average or not! Tricky stuff this pseudoscience – kinda hard to pin down.

        Maybe you can explain the apparent simultaneous heating and cooling properties of CO2 scientifically. How hard could it be? Kinda hard, I suppose.

        Cheers.

        • Nate says:

          Its the average of tornadoes in last 10y. About half of these 10 y are below average. Thats the way averages work.

          I think you know by now that yearly temps fluctuate up and down. Thats why climate is defined by a 30 y ave.

          The 30 y running ave has only gone up lately. In fact I’ll bet next y it will go up, and the year after that too.

        • Nate says:

          Mike,

          “if increasing the amount of CO2 in the atmosphere results in higher global average temperatures, wouldnt every year be above average in line with increasing CO2?

          It seems a little odd that GHE supporters claim that there is danger from rising temperatures due to CO2, if sometimes increased CO2 results in temperatures that are colder than average.”

          In my area some weeks have been colder than the previous. In fact the whole month of March was colder than February.

          Around here sunshine (insolation) is increasing every week this time of year, as we head towards summer. March has way more sunshine than February.

          Isnt it odd that increased sunshine has resulted in decreased temperatures?

          Or maybe, is it possible other things affect temperature besides sunshine?? Hmmm…

  44. ren says:

    Total precipitation in the US in March 2018.
    http://images.tinypic.pl/i/00963/0m37vr105yaj.png

    • bilybob says:

      So much for the divide moving eastward this year.

      • David Appell says:

        It’s the long-term trend that matters.

        • bilybob says:

          Agreed.

        • bilybob says:

          Roy what is the slope of that long term trend line?

          • Gordon Robertson says:

            bilybob…”Roy what is the slope of that long term trend line?”

            Do you mean the stated UAH decadal trend? If so, please understand there are protocols required in science while stating such trends. UAH is pretty well forced into making a number-crunched trend without explaining its derivation.

            Look here for explanations (page 2 onward):

            https://www.nsstc.uah.edu/climate/2011/November/Nov2011GTR.pdf

            “Clear net warming did not occur until the El Nino Pacific Ocean warming event of the century in late 1997. Since that upward jump, there has been little or no additional warming”.

            That means there was no net warming prior to 1997…based on the UAH baseline…it was re-warming…and following 1998, there was little or no additional warming. That means the trend was flat.

            Therefore, a stated trend of 0.12C/decade does not tell you that half the series was re-warming and another 18 years had no average warming.

            That’s why Mark Twain was prompted to claim… “There are three kinds of lies: lies, damned lies, and statistics”.

            Whenever you see anything stated as an average, as in a trend, be mighty skeptical until you have satisfied yourself as to exactly what it means.

          • Gordon Robertson says:

            bb…nothing in the number-crunched trend indicates that any of the warming was caused by anthropogenic gases. Alarmists here try to present the UAH trend as proof of anthropogenic warming. There are perfectly natural explanations for the warming.

          • bilybob says:

            Referring to the precipitation trend in Roy’s graph for the 100th meridian states. It shows a slightly positive trend for the summer months. David said it was important, I agreed.

          • ren says:

            Displaying Last 30-Day Observed Precipitation
            Valid on: April 23, 2018 12:00 UTC
            http://pics.tinypic.pl/i/00963/xxx97wxvwd0s.png

          • David Appell says:

            Gordon Robertson says:
            There are perfectly natural explanations for the warming.

            What are they? (Don’t just list the possibilities — provide evidence they’ve caused warming.)

          • David Appell says:

            Gordon Robertson says:
            UAH is pretty well forced into making a number-crunched trend without explaining its derivation.

            Least squares linear trend. Most people learn it in high school. Didn’t you?

          • Gordon Robertson says:

            DA…”Least squares linear trend. Most people learn it in high school. Didnt you?”

            Studied it in-depth during an advanced probability and statistics course while studying engineering. We were studying how to apply science and we were very careful not to simply plug numbers into an algorithm without regard to the meaning of the data and how it was acquired.

            UAH supplies both a number crunched trend and an explanation of what it means in the 33 year report. They explain that over the range of the UAH data in 2011 that no true warming occurred till the late 1997 El Nino. They explained there had been cooling due to volcanic aerosols.

            They further explained that following the 98 EN, there was little or no warming up to that point at 2011. The IPCC confirmed that in AR5 (2012) calling the period from 1998 – 2012 a warming hiatus.

            You cannot therefore use a trend of 0.12C/decade to describe that range accurately if there was 17 years of re-warming followed by a 15 year flat trend.

            The net warming over the range does satisfy the rough end points of the trend but there is no scientific explanation, with proff, for why the warming occurred. If warming was occurring due to anthropogenic gases, the 15 year flat trend should not have happened.

          • Gordon Robertson says:

            DA…”What are they? (Dont just list the possibilities provide evidence theyve caused warming.)”

            I am not going to play your on-going game of having people post evidence, I have recently posted evidence of the Little Ice Age several times in recent posts. The notion that it was a local phenomena of 1 to 2C cooling in Europe is absurd.

            The other proof is Tsonis et al (2005), The following is just an abstract but the full paper is available elsewhere.

            https://agupubs.onlinelibrary.wiley.com/doi/full/10.1029/2007GL030288

            They claim that ocean oscillations like the AMO. AO, PDO, ENSO, etc., operate in and out of phase to produce warming/cooling over the long term. It is likely the current warming is only a temporary phase.

          • David Appell says:

            Gordon Robertson says:
            “I am not going to play your on-going game of having people post evidence”

            That says it all, Gordon.

          • David Appell says:

            Gordon Robertson says:
            “The other proof is Tsonis et al (2005),”

            OMG.

            That paper covers 1900+ — nothing before that.

            Sorry. You clearly do not have proof the LIA or MWP were global.

  45. Gordon Robertson says:

    “salvatore del prete says:
    April 18, 2018 at 11:19 AM

    I agree with you Dr. Spencer.
    Reply

    Des says:
    April 19, 2018 at 4:36 AM

    Of course you do dear”.

    Des, in a fit after being rejected by one of his sheep, turns to sexually-based sarcasm with humans.

    • Mike Flynn says:

      G,

      Was the sheep named Baaaasil, perhaps?

      Cheers.

    • Des says:

      Given that I am not influential enough to have any followers, eff knows what you are talking about.

    • Des says:

      And if you believe there is anything sexual in that comment, you have serious issues.

      • Mike Flynn says:

        Desperate,

        What do you consider to be “serious issues”? How do you define “serious”?

        Do you suppose someone, somewhere, cares what you think?

        It’s all good for a laugh, isn’t it?

        Cheers.

        • Des says:

          “Do you suppose someone, somewhere, cares what you think?”

          You clearly do – you can’t help replying.

          • Gordon Robertson says:

            des…”You clearly do you cant help replying”.

            Des is sooooo sensitive, unlike the stereotypical Aussie male who just wants to get his shrimp on the barbie and have a Fosters Lager.

            I imagine you’d have to be fairly sensitive to be a shepherd. All those jumbugs to care for.

  46. ren says:

    Tropical low it can reach southern California.
    http://images.tinypic.pl/i/00963/y416ertiydn8.png

  47. ren says:

    Currently, heavy rainfall in Kansas, Oklahoma and Texas.
    http://pics.tinypic.pl/i/00963/g6k8g5r4pycb.png

  48. Rusty Allen says:

    David Appell so I have 2 comments as I have been reading your comments. What are your qualification? Are you a climate scientist as you seem to call Dr. Roy Spencer out on everything?? Also I would love to see information as to where that line was between humid/arid during the 1930’s dust bowl years? Links?

    • Gordon Robertson says:

      rusty ….”What are your qualification? Are you a climate scientist as you seem to call Dr. Roy Spencer out on everything??”

      Good humour, David Appell a climate scientists. David learns his science at realclimate and skepticalscience meetings, where he can be found sitting in the front row in his short pants, wearing a beanie.

    • David Appell says:

      Rusty, I have a PhD in physics — you? — but you should never judge someone on their degrees, only on what they can demonstrate and prove. Someone’s degrees don’t alleviate you of the need to think for yourself.

  49. Gordon Robertson says:

    gbaikie…”IT-related services now account for 2% of all global carbon emissions, according to a new Greenpeace report”.

    I missed this initially. I know you are quoting an article and not expressing a POV, but it’s really rich that Greenpeace is presented as a source of integrity. They have already admitted they will lie for The Cause.

    Greenpeace are eco-scumbags. They won’t be happy till we are all living in tents, riding bicycles, and freezing in the dark.

  50. Walt Allensworth says:

    It’s very clear from Greenland ice core data (Read The Two Mile Time Machine by Dr. Richard B. Alley) and other sources that precipitation increases with increasing temperature, so it’s just as clear that this AMS Earth paper is “all wet.” 😉

  51. The volcanic ash and pulverized brick supplements that were added to the burnt lime, to obtain a hydraulic binder.
    foundation slab

Leave a Reply