The eruption of Kilauea volcano on the Big Island of Hawaii has been unleashing a huge cloud of sulfur dioxide (SO2), which has been showing up in NASA’s Suomi satellite imagery every day. Yesterday, May 21, the cloud is shown here in false color, based upon measurements from the OMPS sensor on that satellite.

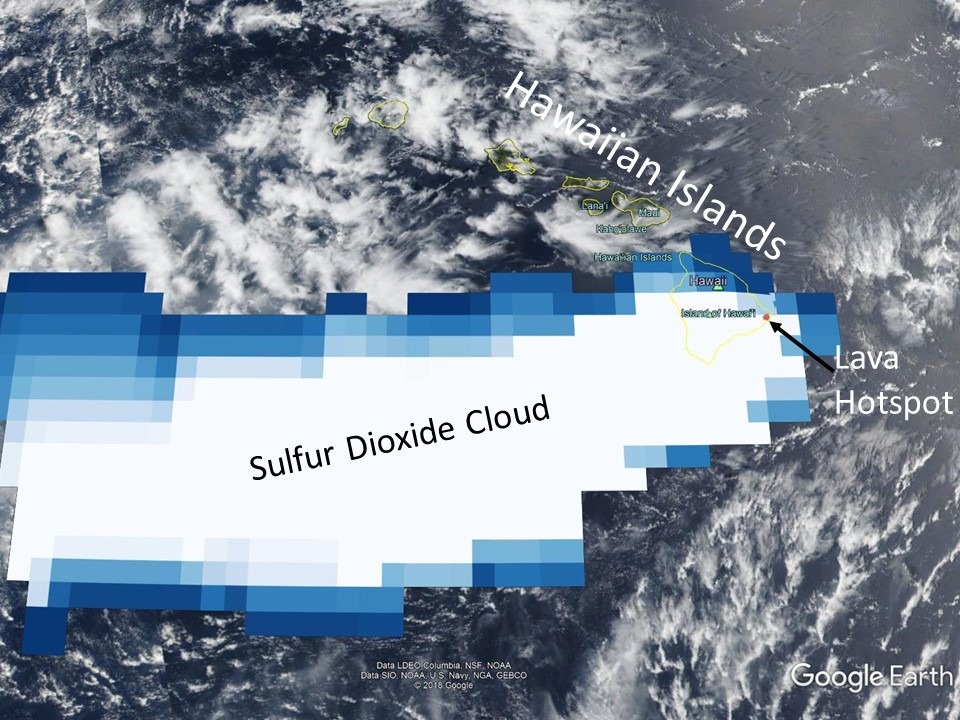
NASA Suomi satellite false-color imagery of the sulfur dioxide cloud flowing downwind from the eruption of Kilauea volcano on the Big Island.
Carried by the northeasterly trade winds, the SO2 cloud can be discerned in true-color imagery extending about 1,300 miles downstream. The eruption site is indicated by the red dot, where the satellite picks up a hot anomaly in its infrared channels.
Very interesting.
What about the CO2 cloud? LOL!
Way smaller than the human CO2 cloud.
SO2 is a cloud-seeding agent. An increase in cloud cover, albedo, reduces sunlight reaching Earth. But you don’t need anyone telling you that. You know it. On the other hand CO2 does not effect cloud cover at all. It may not even effect the Earth’s climate significantly. For sure, the CO2 increase we’ve seen these past couple of decades has not resulted in any significant temperature rise anywhere on planet Earth.
I was pointing out that humans emit far more CO2 than do volcanoes, by a factor of 100-200, not volcanic effects on climate.
“Volcanic vs Anthropogenic Carbon Dioxide,” T Gerlach, EOS v92 n24, June 14, 2011.
http://onlinelibrary.wiley.com/doi/10.1029/2011EO240001/full
http://onlinelibrary.wiley.com/doi/10.1029/2011EO240001/epdf
https://news.agu.org/press-release/human-activities-emit-way-more-carbon-dioxide-than-do-volcanoes/
Not interested in debating your second claim.
DA…”I was pointing out that humans emit far more CO2 than do volcanoes, by a factor of 100-200, not volcanic effects on climate”.
If you look at Roy’s UAH graph between 1979 and 1997, you can see the effect of two volcanic eruptions, which cooled the planet below the baseline.
No evidence of CO2 warming the planet.
The cooling is from SO2, not CO2. And, yes, it can be significant after a very large volcanic eruption. Very well known.
Your last statement is false. But no point telling you again, because you’re not interested in the science.
Warmer is better.
We need more CO2
CO2 clouds are figments of your imagination, besides naturally produced CO2 swamps manmade CO2 by more than an order of magnitude.
Big enough to change albedo and ultimately change global weather measurably?
Pinatubo SO2 was 40km up into atmosphere and spread globally. It created about 4 watts of net radiation loss per meter. This created about 0.5C of cooling. So my feeling is this much smaller (2000km*2000km?) would be undetectable. Flip side Hawaii is ~at the 20N lat and would be at ~ peak June radiation. So it is located in a sweetspot.
Self et al (USGS pubs).
The point is that the SO2 is not very high and will quickly be rained out. Even the local effect will be minimal. Roy should have mentioned that
Thanks. That was my gut feeling but the brain isnt in the gut.
Was wondering the same, Thanks Eli.
yes, I wasn’t even thinking about climate effects when I wrote the post… low altitude, a small amount of SO2 compared to a Pinatubo-class eruption, and will dissipate quickly.
Roy…”yes, I wasnt even thinking about climate effects when I wrote the post”
That was my immediate impression, you usually keep us informed as to what is going on without the politics.
Guess Eli is feeling somewhat nervous that the volcano might blow big time and spoil his warming propaganda.
Another major volcano will erupt at some point. There will be some cooling (~ 0.5 C) for a year or two. Then anthropogenic warming will resume. In the long run the eruption won’t matter to temperatures.
DA…”Then anthropogenic warming will resume”.
Can you show me on the UAH graph exactly when it began? I’ve heard about it but I can’t pin it down. All I can see is re-warming from volcanic aerosols, warming from El Ninos and cooling from La Ninas’
And, Oh, yeah, that flat trend from 1998 – 2015 following the re-warming.
Draw the trend. Since CO2 is increasing fairly linearly, so some of the trend should be caused by CO2.
Is it “more than half”, or even “more than the trend”, the jury is still out. I don’t object IPCC, only its SPM sausage.
And, when I say this, I know some people will comment how CO2 can’t warm the planet yada yada, nor that the increase can’t be anthropogenicly caused because (insert some invalid logic), or that the CO2 has not increased (insert some really bad logic).
I don’t bother to answer those lines; David could help Roy do a FAQ for this blog targeting those sky dragon lines. 😉
I type ; ) and get ;). How nice ; )
Can you please kill the guy who invented UTF smileys?
Ah, but not with period ;). Only without 😉 ?
Gordon Robertson says:
DAThen anthropogenic warming will resume.
Can you show me on the UAH graph exactly when it began? Ive heard about it but I cant pin it down. All I can see is re-warming from volcanic aerosols, warming from El Ninos and cooling from La Ninas
Like Salvatore, you are looking at the noise (short-term natural fluctuations) and not the long-term (climatic) trend (+0.13 C/decade for UAH LT v6.0).
wert…”Draw the trend. Since CO2 is increasing fairly linearly, so some of the trend should be caused by CO2″.
In other words, INFER that some of the warming MUST BE caused by CO2 since we have no other explanation for the warming?
I have a perfectly good explanation from geophysicist Syun Akasofu. The warming is re-warming from the Little Ice Age. Makes far more sense than a fraction of 0.04% of the atmosphere, as ACO2, causing that much warming. Contradicts the Ideal Gas Law.
Besides, there was a recent 18 year flat trend that increasing CO2 cannot explain.
Gordon Robertson says:
In other words, INFER that some of the warming MUST BE caused by CO2 since we have no other explanation for the warming?
Warming from CO2 is expected on paleoclimatological and theoretical grounds.
I have a perfectly good explanation from geophysicist Syun Akasofu.
He’s not a climate scientist, so, according to your standards, his views are worthless.
The warming is re-warming from the Little Ice Age.
Except now temperatures are warmer than at the start of the LIA. So this claim is clearly false.
Makes far more sense than a fraction of 0.04% of the atmosphere, as ACO2, causing that much warming. Contradicts the Ideal Gas Law.
It doesn’t contradict the IGL — the IGL is not a good model for the atmosphere, since it doesn’t include radiation.
You talk about 0.04%, but you never talk about how the cross sections for ab.sorp.tion of IR.
—
If you paint three targets on the side of a barn, what’s the probability a thrown ball hits one of them?
Besides, there was a recent 18 year flat trend that increasing CO2 cannot explain.
You know that’s a lie, and you know why. You choose to lie.
Gordon, again — If you paint three targets on the side of a barn, whats the probability a thrown ball hits one of them?
There are dozens of points that could be made about SO2. I do not see why Roy is obligated to mention the one that you want. You certainly are given the freedom to make your points on his blog.
inquirer…”There are dozens of points that could be made about SO2″.
One of them being it’s rotten egg odour. We have pulp mills here in Canada that belch the stuff and there’s nowhere to hide when the wind is blowing the wrong way.
Good point. Roy is not obligated to anticipate carping by warmists
H2S is the rotten egg odor. SO2 is acrid. Big difference in oxidation state.
mel…”H2S is the rotten egg odor. SO2 is acrid. Big difference in oxidation state”.
I don’t know what rotten eggs smell like, I have just heard the terms used. I equate hydrogen sulphide with a swamp-water kind of smell.
The pulp mills here use sulphur in the bleaching process and it is definitely that odour I find objectionable.
My understanding is that both H2S and SO2 can be emitted by volcanoes, although I don’t think H2S would be a permitted gas from pulp mills.
I have smelled H2S coming off swamp areas. While working on a Tar Sands site I put in an alert for a strange gas odour and the safety guys were all over it immediately with their sniffers. They concluded it was H2S wafting in from the nearby swampy area on a cool night.
It’s not the same as SO2.
When SO2 is used in the bleaching process, it is then reduced- that’s the whole point of using an oxidizer. So the reduction product is H2S, and that’s your rotten egg smell. Swamp odor is a rich mixture of H2S, mercaptans, and amines and is generally the result of anaerobic putrefaction.
If you want to get an idea of the odor of SO2, get some metabisulfite tablets at a local beer or winemaking supply shop and drop one into water.
Eli…”The point is that the SO2 is not very high and will quickly be rained out. Even the local effect will be minimal. Roy should have mentioned that…”
Why? Unlike you he’s not a rabid alarmist.
Roy does these article for purposes of information, not propaganda.
As co2 is quite heavy it will sink quickly to the ground so it would be more a fog than a cloud
C,
Not quite. Brownian motion and diffusion means that CO2 eventually becomes evenly mixed.
Don’t depend on this to save you in the next 10 minutes or so, particularly if you are in a ship’s bilges, a sewer, or something similar.
Nitrogen will kill quickly, without warning if there is insufficient oxygen to sustain life. CO2 at least will make you pant, well before it becomes toxic, even when sufficient oxygen is available.
Be prepared. I would go far away, if there was active volcanic activity in my area. Science and scientists be buggered – I’m off. Stay if you wish – don’t blame me if your assumption is wrong.
Each to his own.
Cheers.
Sorry. I should have said well-mixed.
Cheers.
Mike…”Be prepared. I would go far away, if there was active volcanic activity in my area”.
I can’t believe that people built their dream homes on the edge of an active volcano. Don’t get me wrong, I feel for people suffering over there but we need to give Mother Nature some respect.
Up here in Canada, people build beside a nice little stream or river, never realizing that the nice little stream could flood big time.
Just down the road from us, Mt. St. Helens blew its top and covered us in ash some 200 miles north. Blocked the Sun for days. We have mountains nearby with geothermal activity.
Gordon,
I’m lucky, I suppose. No active volcanoes around – just earthquakes, cyclones, extreme lightning activity, and some soil borne bacteria that can kill you before the tests come back telling you what you died from.
I figure Nature is trying to kill you from the time you are conceived. Eventually she does, although I intend to live forever.
So far, so good. The trend is my friend – good climatological thinking, I believe.
I wish the residents of Hawaii all the best. I’m glad I’m not there, just now.
Cheers.
SO2 is of course very toxic, hence warnings to people. Same stuff emitted by coal fired plants.
With coal burning power plants, such as those recently built in China and India, the lack of scrubbers results in lots of SO2 emitted to the atmosphere. The use of coal to make steel also adds to the mix in China. One result is the “Asian Brown Cloud” seen in satellite data
While that SO2 is removed rapidly, the fact that there is a continual stream being dumped into the atmosphere results in a significant impact on climate. That’s why it’s been called “the Human Volcano”. That’s similar to what happened in the early 1970’s when coal burning in the U.S. and Europe resulted in lots of SO2 emissions and “acid rain” pollution.
This is the direct aerosol and cloud albedo effect that dominate climate sensitivity uncertainty in IPCC climate models.
What parameter, if any, shows a significant impact of SO2 reductions from coal fired power plants in the US on climate?
James, I am seeking clarity. What are you asking?
The Aerosol factors on the IPCC Radiative Forcing table both represent the hidden warming that dominates the high case models climate sensitivity. Anyone that doesn’t understand the literature about this feedback doesnt understand the models enough to have an opinion on climate change without suffering from a severe case of the Dunning Kruger effect.
https://www.ipcc.ch/publications_and_data/ar4/wg1/en/tssts-2-5.html
Thanks, I am not really interested in trying to understand the multiple models that make up the IPCC report. And you are probably right, I may not understand these models enough to hang with the gang. Nevertheless, models, while they have a role, when uniformly/accurately supported by observational data are helpful. Unfortunately that is often no longer the case. Method sections of journal articles often highlight the limitations of these models. Yet they continue to get published and help create policy; even when observational data may suggest otherwise.
My question was for E. Swanson, and more specifically, what is the “significant impact on climate” in the US since the SO2 source has been effectively turned off in recent years? But, Aaron, I welcome your input too.
“All models are wrong, but some are useful.”
– George Box, British statistician
Climate models are all wrong. Some are useful.
Yes, climate models are a subset of “all models.”
Just to complete the picture, rain is mildly acidic anyway. In his book ‘Air Pollution’ (2nd Ed) on P259 Jeremy Collis states that “In the clean atmosphere, water is in equilibrium with 360ppm CO2, giving a pH of 5.6. In remote temperate areas of the world, average rain pH is about 5.0”
He also comments: “The average annual pH of European precipitation ranges between 4.1 and 4.9”, and on page 435 “Clean rain is weak carbonic acid with a pH of 5.6”
Typo – my apologies. The author of the book on air pollution is Jeremy Colls, not Collis.
Every day images? I thought this sat was sun synchronous on a 101 min orbit. It takes weeks before the sat is over the same spot on earth. I think.
Yes, Mt. Pinatubo caused a 0.5 C drop in temp over 1-2 years because the SO2 reached the stratosphere. But does continuous SO2 entering the troposphere from coal fired power plants have any effect on temperature?
SO2 has the greatest impact on the increase of rainfall. The temperature is most affected by dust in the stratosphere.
Particulate Matter < 1 m
mass of atmospheric particles with a diameter less than 1 micron
https://earth.nullschool.net/#current/particulates/surface/level/overlay=pm1/orthographic=-158.35,19.64,3000
Dust that can form a ring over the equator in the stratosphere can have a significant effect on the global temperature drop.
Several years back when it was thought there was a hiatus, it was speculated that emissions from coal plants in China and India may have been partly responsible. But no calculations AFAIK. (But Santer et al did write a paper on a potential influence from smaller volcanic eruptions.)
DA…”Several years back when it was thought there was a hiatus….”
There was a hiatus, the IPCC reported it then NOAA fudged the SST retroactively to show a trend.
The flat trend still stands, it’s there in the non-fudged data of UAH.
Gordon, you have no evidence of anything untoward. Why don’t you put up or shut up.
Has anyone estimated the effect of 20th century emissions of aerosols on cooling? Does So2 in the troposphere have the same cooling ability as in the stratosphere?
Good question. As a start, here is a PNNL study on SO2 emissions from 1850-2000 (anthropogenic only, I think):
https://www.pnnl.gov/main/publications/external/technical_reports/PNNL-14537.pdf
You can see in it that emissions really took off in about 1950, and peaked in about 1980, which aligns mostly with the 1945-1975 hiatus in mean global temperature….
thanks David. Peaks at the right time.
I do not know the answer. But just for grins I did a few minutes of research on SO2 emissions from coal plants. Best as I can tell there are 20,000,000 tons SO2/year emitted from coal plants world wide, mostly from China. The volcano is currently emitting 15,000 tons SO2/day. Mt Pinatubo eruption is estimated to have put a total of 20,000,000 tons of SO2 into the atmosphere.
The following shows the range of particle SO4.
https://earth.nullschool.net/#current/particulates/surface/level/overlay=suexttau/orthographic=-175.61,17.96,1500
However, this is very little compared to SO4 over India and China.
https://earth.nullschool.net/#current/particulates/surface/level/overlay=suexttau/orthographic=-270.09,27.88,568
Live Video: Kilauea Lava Flow Activity In Lower Puna Hawaii
https://www.youtube.com/watch?v=HtihmXFWqGo
Dr Spencer, this post is off topic, but I think NASA has a real problem with those boys up at GISS. Real Scientists don’t publish this kind of nonsense, and certainly not the organization that put a man on the moon. The errors are laughably obvious. Isn’t there some kind of QA or ethics dept at NASA? Who is watching what these people are publishing?
Multiple Sources Now Confirm; Climate Data Adjustments are Obvious Fraud to Anyone Choosing to Look
https://co2islife.wordpress.com/2018/05/21/multiple-sources-now-confirm-climate-data-adjustments-are-obvious-fraud-to-anyone-choosing-to-look/
THAT’S your proof, the usual junk from Tony Heller?? Please.
Read and learn:
“Thorough, not thoroughly fabricated: The truth about global temperature data: How thermometer and satellite data is adjusted and why it *must* be done,” Scott K Johnson, Ars Technica 1/21/16.
http://arstechnica.com/science/2016/01/thorough-not-thoroughly-fabricated-the-truth-about-global-temperature-data/
“Understanding Adjustments to Temperature Data,” BEST
http://berkeleyearth.org/understanding-adjustments-temperature-data/
“Understanding Time of Observation Bias,” Zeke Hausfather, 2/22/15.
https://judithcurry.com/2015/02/22/understanding-time-of-observation-bias/
And the rotten appell chooses the most blatant fabricators in the climate-pseudo-science arena to pretend there is no FAKE adjustments from TOB.
ARSEtechnica, and Zeke both RABID AGW operatives.
Data says TOBs is a FAKE
Get over it.
And BTW, adjustments REDUCE the long-term warming trend, not increase it.
“Turns out that global temperature adjustments actually reduce the long-term warming trend, mostly due to oceans.”
– Zeke Hausfather, BEST analyst, 2/9/15
https://twitter.com/hausfath/status/564921572096348160
CO2…”I think NASA has a real problem with those boys up at GISS….”
NASA tried to do something about GISS during the Clinton era and were over-ruled from on high in the Clinton admin.
I don’t think it was Bill, he was too busy in the Oval Office with female interns. Al Gore was off with his wife Tipper, investigating alleged Satanic messages in rock recordings. Maybe Gore took some time off from those more important matters to help his buddy James Hansen at GISS.
“Something?” What does that mean? Where can I read more about this — I’m interested.
I didn’t think Gordon had a reply. He never does when he posts b.s. like this.
CO2,
Ive got some other info for you on Sandy Hook fake, pizzagate, and the deep state conspiracy
James see above. It depends who you talk to but the IPCC clearly thinks SO2 and other aerosols have a significant influence.
To be clear I am a skeptic of IPCC models and feel they are exaggerated for warming based on a comprehensive review of peer reviewed literature. So we seem mostly in agreement. Aerosols in general are currently thought by the IPCC to be suppressing much of the warming from manmade ghg. So the logic goes as global pollution of aerosols decreases in the future there will be less albedo from clouds (human aerosols seed clouds, but so do natural processes) and direct aerosols and the hidden warming from CO2 will suddenly take off. This is how the high case models with 4 to 7 degrees warming from doubling CO2 produce so much warming despite the measured data showing much less climate sensitivity. You can see the error bars in the graphs I attached and the more negative today is the more future warming with less pollution (in the models). So the US pollution would have impacted the trend, but bigger picture global development has maintained high levels (China). The problem is the IPCC uses a base case at about the median so including many models with this brings up the A2 scenario. Also they exclude several negative feedbacks like solar magnetic influence on albedo. Basically they exaggerate the warming using statistics. IMHO.
Aaron S says:
Aerosols in general are currently thought by the IPCC to be suppressing much of the warming from manmade ghg.
Much? More like a third, according to Table 8.6 in the 5AR WG1 Ch8 p696:
https://www.ipcc.ch/pdf/assessment-report/ar5/wg1/WG1AR5_Chapter08_FINAL.pdf
Aaron…”To be clear I am a skeptic of IPCC models and feel they are exaggerated for warming based on a comprehensive review of peer reviewed literature”.
Not only that, the models are unvalidated, making them essentially useless. In electronics, you can easily validate a model by building a real circuit and comparing results.
That has never been done with climate models. It would not do any good anyway, they are programmed with pseudo-scientific nonsense like a positive feedback from CO2 that can warm the surface to a higher temperature than it is warmed by solar energy. And, they have attributed a warming factor of 9% to 25% for CO2 without the slightest bit of evidence re how much it warms the atmosphere.
Even the IPCC has lost faith in them. They have dropped their projections to between 0.3C and 0.7C, claiming the lower range is most likely.
Gordon Robertson says:
Not only that, the models are unvalidated…
Says who? The largest chapter in the IPCC 5AR WG1 is about model validation. Have you read it?
And, they have attributed a warming factor of 9% to 25% for CO2 without the slightest bit of evidence re how much it warms the atmosphere.
This lie again. You’ve never presented an iota of evidence to back up this claim. You clearly don’t have any — you just made this up out of whole cloth. Shameful behavior on a science site.
DA…”Says who? The largest chapter in the IPCC 5AR WG1 is about model validation. Have you read it?”
I try not to read fiction unless it’s really good, like from Dickens or Dostoevsky. I find IPCC fiction to be dreary and kind of amateurish.
I’m not surprised you avoid reading science. You prefer to think you know everything better than anyone else. And it shows.
DA,
This is what the IPCC wrote –
“The climate system is a coupled non-linear chaotic system, and therefore the long-term prediction of future climate states is not possible.”
Not scientific enough for you?
What parts do you not understand?
No wonder there is no testable GHE hypothesis! What would be the point?
Cheers.
DA…”Im not surprised you avoid reading science. You prefer to think you know everything better than anyone else. And it shows”.
What makes you think my preference is invalid? With alarmists on here like you, with your pseudo-science and propaganda, I don’t need to prefer, I know.
Besides, I like non-fictional science, not the fictional type produced by alarmists.
Gordon, you can try to read any science you want. You’ve demonstrated on this blog that you understand very little of it. And I’m hardly the only one here who thinks that.
The surface temperature of the Pacific and Atlantic at 23 May 2018 is low.
http://pics.tinypic.pl/i/00965/7nlefgrq2896.png
1/3 is much. And individual models are higher
I think “much” means at least > 1/2. But I understand it’s a vague word and can mean whatever.
In the Ar-Rab al-Khali desert on the Arabian Peninsula, the cyclone will fill dry river beds.
My background is science but in a different field. I’m a long-time reader of the site.
I have a question:
How do large volcanic eruptions affect global temperature readings in the short term? I assume the affect is so localized its irrelevant.
But do the plumes ever grow large enough to contaminate readings from one of the satellites for a period of time? If so, how is the data handled?
Darren wrote:
If you look at the data for the Stratosphere, the impact of the SO2 aerosols is most obvious. There’s a warming at high altitudes in the records for TLS. There is also a corresponding cooling impact at lower levels, but it is less obvious. AS I understand it, there’s no direct effort to correct the readings, although models have been used to remove the effects. You can see plots on the RSS site HERE.
Darren…”I have a question:
How do large volcanic eruptions affect global temperature readings in the short term? I assume the affect is so localized its irrelevant”.
See UAH graph at following link. The period from 1979 – 1997 was mainly under the baseline and claimed to be affected by eruptions like Pinotuba which erupted in 1991. You can see a significant dip in the global average for several years.
http://www.drroyspencer.com/wp-content/uploads/UAH_LT_1979_thru_April_2018_v6.jpg
It will be cool to watch the temperature trends over the next few years as a result of this volcano. Added particles in the air will help reflect some heat.
Very little-to-no impact.
In a few days, geomagnetic and volcanic activity will increase again, due to the coronal hole in the vicinity of the solar equator.
Live Video: Active Kilauea Lava Flow In Lower Puna, Hawaii
https://www.youtube.com/watch?v=yyQyVkvOGm0
DA…”Read and learn:”
No matter how butt-kissing alarmists spin data fudging by NOAA, the truth is apparent. NOAA fudges surface temperature data blatantly and retroactively.
1)NOAA has slashed 90% of surface data stations since 1990. They have used 10% of real data in a climate model to synthesize the slashed data. Makes it easier for them to politicize the fabricated warming.
2)NOAA and GISS reduce confidence levels by 50% or more to make certain years APPEAR to be records. Only blatant cheaters and politically motivated liars would resort to such tactics.
And yet their results are replicated by everyone else.
You can do it yourself if you pick 50 random stations.
Why can different years not have overlapping probability?
https://tinyurl.com/ycwunbya
svante…”And yet their (NOAA’s) results are replicated by everyone else”.
Yes…there are butt-kissers everywhere in science. Pity!!! IPCC reviews are riddled with them and some of the biggest perpetuators were caught in the Climategate email scandal.
Gordon,
How many people are involved in this fudging do you think?
How much of this SO2 has ended up in the stratosphere?
Still active.
Reviews on Louis Vuitton Outlet in Vancouver, BC – Louis Vuitton Holt Renfrew Vancouver, Louis Vuitton Hotel Vancouver, High End Resale, cheap louis vuitton outlet 2009 ‘rich corner’ behind the photos. (Left to right) 10 Corso Como founder Carla Sozzani, photographer Nick Waplington