UAH Global Temperature Update for April, 2018: +0.21 deg. C.

May 1st, 2018 by Roy W. Spencer, Ph. D.

The Version 6.0 global average lower tropospheric temperature (LT) anomaly for April, 2018 was +0.21 deg. C, down a little from the March value of +0.24 deg. C:
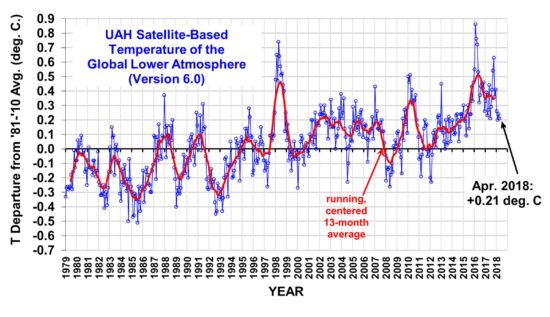
Global area-averaged lower tropospheric temperature anomalies (departures from 30-year calendar monthly means, 1981-2010). The 13-month centered average is meant to give an indication of the lower frequency variations in the data; the choice of 13 months is somewhat arbitrary… an odd number of months allows centered plotting on months with no time lag between the two plotted time series. The inclusion of two of the same calendar months on the ends of the 13 month averaging period causes no issues with interpretation because the seasonal temperature cycle has been removed, and so has the distinction between calendar months.

Some regional LT departures from the 30-year (1981-2010) average for the last 16 months are:

YEAR MO GLOBE NHEM. SHEM. TROPIC USA48 ARCTIC AUST
2017 01 +0.33 +0.31 +0.34 +0.10 +0.27 +0.95 +1.22
2017 02 +0.38 +0.57 +0.19 +0.08 +2.15 +1.33 +0.21
2017 03 +0.23 +0.36 +0.09 +0.06 +1.21 +1.24 +0.98
2017 04 +0.27 +0.28 +0.26 +0.21 +0.89 +0.22 +0.40
2017 05 +0.44 +0.39 +0.49 +0.41 +0.10 +0.21 +0.06
2017 06 +0.21 +0.33 +0.10 +0.39 +0.50 +0.10 +0.34
2017 07 +0.29 +0.30 +0.27 +0.51 +0.60 -0.27 +1.03
2017 08 +0.41 +0.40 +0.42 +0.46 -0.55 +0.49 +0.77
2017 09 +0.54 +0.51 +0.57 +0.54 +0.29 +1.06 +0.60
2017 10 +0.63 +0.66 +0.59 +0.47 +1.20 +0.83 +0.86
2017 11 +0.36 +0.33 +0.38 +0.26 +1.35 +0.68 -0.12
2017 12 +0.41 +0.50 +0.33 +0.26 +0.44 +1.36 +0.36
2018 01 +0.26 +0.46 +0.06 -0.12 +0.58 +1.36 +0.42
2018 02 +0.20 +0.24 +0.16 +0.03 +0.91 +1.19 +0.18
2018 03 +0.24 +0.39 +0.10 +0.06 -0.33 -0.33 +0.59
2018 04 +0.21 +0.31 +0.10 -0.13 -0.01 +1.02 +0.68

The linear temperature trend of the global average lower tropospheric temperature anomalies from January 1979 through April 2018 remains at +0.13 C/decade.

The UAH LT global anomaly image for April, 2018 should be available in the next few days here.

The new Version 6 files should also be updated in the coming days, and are located here:

Lower Troposphere: http://vortex.nsstc.uah.edu/data/msu/v6.0/tlt/uahncdc_lt_6.0.txt
Mid-Troposphere: http://vortex.nsstc.uah.edu/data/msu/v6.0/tmt/uahncdc_mt_6.0.txt
Tropopause: http://vortex.nsstc.uah.edu/data/msu/v6.0/ttp/uahncdc_tp_6.0.txt
Lower Stratosphere: http://vortex.nsstc.uah.edu/data/msu/v6.0/tls/uahncdc_ls_6.0.txt


1,557 Responses to “UAH Global Temperature Update for April, 2018: +0.21 deg. C.”

Toggle Trackbacks

  1. E. Swanson says:

    For those who still hold to the claim that the Greenhouse Effect violates the Second Law of Thermodynamics, I present the latest results from of my mechanical model of the Green Plate Effect.

    https://app.box.com/s/w6gzam9tbk9oa1h8geio1p4lnufe0yrv

    With this sixth version, I have been able to further reduce the vacuum within the bell jar to a level of about 100 microns. Also, I ran the demonstration by first heating the device at atmospheric pressure, then switching on the pump, thereby showing the effect of the vacuum on the temperature of the Blue plate. The vacuum reduces the convective cooling of the Blue plate, which then warms by 21.7 C in order to balance the energy input from the work light. The Green plate is then raised into position, resulting in a further warming of the Blue plate by 10.1 C.

    While some convection may remain within the jar, its clear that the lifting the Green plate results in warming of the Blue plate, which can best be explained as the effect of the added thermal radiation from the cooler Green plate. This so-called back radiation is similar to the process which is the basis for the Greenhouse Effect of CO2 and other radiative gases within the atmosphere.

    • Norman says:

      E. Swanson

      Excellent work. It clearly shows that Eli was spot on and the so called skeptics (who seem to know nothing at all of any real physics) are wrong. When in doubt, experiment and you have done just this.

      I wonder if you could post your results on Joe Postma’s blog. He may not accept it (he is a fanatic cult leader) but it is possible a few of his followers may see this and realize the validity of Eli’s thought experiment.

      Eli proposed a thought experiment based upon real valid physics. It was rejected by the unscientific skeptics. You have experimentally verified Eli was the correct one. Thanks again for you efforts.

    • La Pangolina says:

      Thanks E. Swanson for your continuous and convincing work.

      Only a few boring, ignorant denialists will refute your demonstration; but none of them will be able to scientifically falsify it.

      • Joe Rancourt says:

        I ignore name callers on all sides and viewpoints (there are more than 2 by the way). Name calling is one of those things you learn are wrong in kindergarten. This puts you in a group with your least favorite president.

        • Snape says:

          Name calling comes with a lot of nuance. Just a couple examples:

          Idiot!! – An expression of anger or frustration with someone.

          Miss piggy – cruel and demeaning

        • La Pangolina says:

          Joe Rancourt says:
          May 2, 2018 at 10:38 AM

          I ignore name callers on all sides and viewpoints (there are more than 2 by the way). Name calling is one of those things you learn are wrong in kindergarten. This puts you in a group with your least favorite president.

          *

          Are you a newcomer here, Rancourt?

          May be you go back on Roy Spencer’s threads, and experience what I mean with ‘boring, ignorant denialists’ before you start criticising me.

          I speak here of persons not only calling others ‘dumbass’, ‘idiot’, ‘stupid’, etc, but also denying (among lots of other things)

          – that e.g. GPS’s accuracy is based on Einstein’s work concerning time dilation, redshift and Sagnac effect
          but also
          – Lorentz’ and Einstein’s work as such!

          And you, Master Joe Rancourt, pretend to ‘ignore name callers’ ???

          Vielen Dank / Many thanks
          R. J. K. (Germany)

    • Nate says:

      Once again, very nice Eric.

    • Gordon Robertson says:

      swannie…”While some convection may remain within the jar, its clear that the lifting the Green plate results in warming of the Blue plate…”

      Don’t know what this has to do with the current thread on the April temperatures. All you are doing when you raise the green plate is blocking the radiation from the blue plate which blocks its ability to dissipate heat.

      This demonstrates a heat dissipation problem not proof that the 2nd law does not apply. Will you give it up? The 2nd law has withstood 150 years of scrutiny far beyond your efforts.

      • Tim Folkerts says:

        “All you are doing when you raise the green plate is blocking the radiation from the blue plate which blocks its ability to dissipate heat.”

        All you are doing when you add greenhouse gases is blocking the radiation from the earth’s surface, which blocks its ability to dissipate heat.

        So the earth’s surface warms up, just like the blue plate warms up. Glad we all agree 🙂

        • Mike Flynn says:

          Tim,

          No it doesnt. Any more than trying to say the Earths surface increases in temperature at night. So-called blocking does not stop the surface from cooling.

          Try again.

          Cheers.

        • goldminor says:

          “Block” doesn’t quite seem right though. If anything it is a tiny block at best.

          • Tim Folkerts says:

            CO2 blocks up to ~ 20% of the IR spectrum near room temperature. At low concentrations that might take a km of atmosphere, but 20% certainly not “tiny”.

          • Tim Folkerts says:

            Also, water blocks the IR much better than CO2. And clouds block better yet. With low clouds, basically 100% of upward IR is blocked.

          • goldminor says:

            The “block” then emits the energy in all directions. You do not have 20% redirected solely down to the surface.

    • Gordon Robertson says:

      All this proves is that norman, binny, and nate, have not the slightest clue as to the difference between blocking heat dissipation and back-radiation.

      • Svante says:

        Please add me to the list Gordon!

        • Gordon Robertson says:

          svante…”All this proves is that svante, norman, svante, binny, svante, and nate, have not the slightest clue as to the difference between blocking heat dissipation and back-radiation”.

          Sorry I missed you svante.

      • Nate says:

        Gordon,

        “blocking heat dissipation” if thats the way you understand it, fine. Its acting like insulation.

        • Mike Flynn says:

          Nate,

          Are you trying to say that the atmosphere has insulating properties?

          Could you then explain how increasing the amount of insulation between a heat source (the Sun) and the Earths surface results in the surface increasing in temperature? I cant.

          Is the reverse also true? Does allowing more radiation to the surface result in in a drop in temperature? This seems impossible to me, but GHE supporters cant even describe this supposed GHE, so it is difficult to figure out what it is actually supposed to do!

          Could you describe the GHE – in terms of the insulating powers of insulation, or anything else you like? It would help if you could include CO2 and H2O in your description, plus the words increased temperatures (if you think the GHE description should include such things).

          Of course, if the GHE has nothing to do with CO2, H2O, or increased temperatures, then leave those terms out of your explanation. Good luck. i wont hold my breath while I wait for your explanation, as I believe you cant do it. I assume you agree, but fell free to surprise me.

          Cheers.

          • Nate says:

            For the Nth time, Mike. As Tim and I have explained. The insulation is between Earth and very cold SPACE. Doubtful that N+1, will be different.

          • Michael David says:

            I can explain it – it’s quite simple really. The ‘insulation (co2)’ is transparent to incoming higher energy (uv) radiation from the sun, but it ‘blocks (absorbs)’ lower energy radiation (ir) from the Earth’s surface, just like glass in a greenhouse does – hence the greenhouse gas effect moniker.

          • David Appell says:

            “The atmosphere is an insulator. CO2 is around 90 to 750 times as opaque to some wavelengths of light as N2 or O2.”

            – Mike Flynn, June 18, 2017 at 3:34 AM
            http://www.drroyspencer.com/2017/06/a-global-warming-red-team-warning-do-not-strive-for-consensus-with-the-blue-team/#comment-251624

          • Gordon Robertson says:

            michael david…”blocks (absorbs) lower energy radiation (ir) from the Earths surface, just like glass in a greenhouse does…”

            You need to upgrade your dogma, michael.

            How can CO2, at 0.04% of atmospheric gases block anything when each atom on the Earth’s surface is radiating IR? Calculate the number of molecules of CO2 in the atmosphere then the number of atoms comprising the surface and the oceans and I’m sure you’ll find the CO2 is dwarfed by the number of surface/ocean atoms.

            I would venture that 99% of the radiation leaving the surface bypasses the CO2.

            With regard to the real greenhouse, Wood, circa 1909, an expert on IR posited that IR could not heat the atmosphere as claimed. He did an experiment to prove that greenhouses warm due to a lack of convection, not through trapping IR.

            Even if a greenhouse did trap IR, what’s it going to warm, the 0.04% of the greenhouse air represented by CO2? Makes far more sense that a greenhouse warms due to the nitrogen and oxygen warming through direct contact with the heated soil in the greenhouse.

            Joe Postma put it really well when he claimed we build greenhouses to do what the atmosphere cannot do.

          • Mike Flynn says:

            MD,

            Your mechanism doesn’t seem to work at night, or in the winter, for that matter.

            It obviously hasn’t worked for four and a half billion years, either. The Earth is less of a molten blob than it was.

            Greenhouses at night cool down. Even greenhouses don’t exhibit your greenhouse effect.

            Learn some physics, then try again.

            Cheers.

          • Nate says:

            Greenhouses are not warmer than the air outside, Mike? Why do they bother building them to grow tomatoes??

            At home I made a cold frame, which is just a mini greenhouse, to start plants earlier in the season. It worked…until I forgot to crack open the lid on a sunny day and the temp inside went to > 110F when it was 50 ish outside, and the plants baked.

            Explain that Mike.

          • Mike Flynn says:

            Nate,

            Easily explained. Sun shines, inside gets hot. No convection, no wind. Sun goes down, inside gets cold.

            What would you disagree with? Nothing? I thought so. My pleasure.

            Cheers.

          • Nate says:

            Glad you understand greenhouses actually do produce warming, by placing something between the sun and earth surface. Contradicts your oft-stated meme, doesnt it?

            “Could you then explain how increasing the amount of insulation between a heat source (the Sun) and the Earths surface results in the surface increasing in temperature? I cant.”

            And by the way, at night, the inside is warmer than the outside. The plants dont freeze.

          • Tim Folkerts says:

            +1 Nate

          • David Appell says:

            Gordon Robertson says:
            How can CO2, at 0.04% of atmospheric gases block anything when each atom on the Earths surface is radiating IR?

            How does water vapor block anything?

          • Mike Flynn says:

            Nate,

            Your stupidity is exceeded only by your ignorance. Matter does not react to a decrease in the amount of energy impinging on it by raising its temperature.

            You are wrong.

            As to greenhouses “retaining” heat at night, they dont, nor during winter.

            For example –

            “Top ten tips for heating a greenhouse in winter

            . . . But heating a greenhouse can be an expensive luxury, and nobody likes the idea of wasting energy or money. So weve put together some top tips to help you keep costs down and make your greenhouse heating more efficient this winter.

            – is but one of multitudinous industry pieces of advice based on fact, rather than your wishful thinking.

            No wonder rational people might get sick of dimwits such as yourself offering pseudoscience which is both pointless and useless.

            Accept reality. Learn physics. If you can bring yourself to do it, of course.

            Cheers.

          • David Appell says:

            Gordon Robertson says:
            “How can CO2, at 0.04% of atmospheric gases block anything when each atom on the Earths surface is radiating IR?”

            Because it has a huge cross section for ab.sorp.tion, peaking at about 10^4 m2/kg.

          • David Appell says:

            Gordon Robertson says:
            “How can CO2, at 0.04% of atmospheric gases block anything when each atom on the Earths surface is radiating IR?”

            Paint several targets on the side of a barn. Stand back, and throw a ball at them.

            What’s the chance of hitting one?

            It obviously depends on the number of targets.

            BUT IT ALSO DEPENDS ON HOW BIG EACH TARGET IT.

            People like Gordon are only thinking about the first number, while ignoring the second. Very unscientific.

          • Nate says:

            “As to greenhouses retaining heat at night, they dont”

            OK, Mike. Maybe you never lived in a place that has seasons.

            http://homeguides.sfgate.com/protect-year-round-growing-greenhouse-plants-frost-97014.html

            “A greenhouse traps heat from the sun during the day, allowing plants inside the greenhouse to stay warm at night.”

            Winter-no-not without help.

            As to “Matter does not react to a decrease in the amount of energy impinging on it by raising its temperature.”

            Thats a rather inadequate description of a greenhouse, Mike, obviously, since they do warm up.

        • Gordon Robertson says:

          nate…”Gordon,

          blocking heat dissipation if thats the way you understand it, fine. Its acting like insulation”.

          If CO2 acts as an insulator, at 0.04% of the atmosphere, it would be equivalent to covering yourself with a tattered, thread-bare blanket comprised of a few threads of cloth.

          Physicist/meteorologist, Craig Bohren, in his book on Atmospheric Radiation, referred to your theory as a metaphor at best, and at worst, plain silly.

      • Norman says:

        Gordon Robertson

        So exactly how does the green plate in E. Swanson experiment block heat dissipation from the heated blue plate? The energy is emitted the same if the green plate is there or not. The energy the blue plate emits is a product of its temperature. It will emit this same energy if the green plate is there or not. If you were not a lazy man you could do the test yourself and have IR measuring devices pointed at the blue plate in both cases. You would find the IR flux measured by the instrument is only effected by the temperature of the blue plate. Your physics is still horrible and misleading and you still will not work to correct our bogus ideas.

        The effect the green plate has on the blue plate (at least in rational established physics, not so in your made up version of reality that you peddle here) is to radiate energy toward the blue plate, that the blue plate absorbs. This adds to the internal energy of the blue plate and it increases in temperature.

        I does not violate the 2nd Law of Thermodynamics in any way. I only violates your misunderstanding of the real Law. It violates your made up version. Not the real one.

        I think Snape did a great job on the other thread to help you about how a poor man can make a rich man richer. He used dimes instead of joules. I think you were not able to process his thought process and probably ignored it as you do with most real science.

        • Gordon Robertson says:

          norman…”So exactly how does the green plate in E. Swanson experiment block heat dissipation from the heated blue plate? The energy is emitted the same if the green plate is there or not”.

          ***

          I told you, by blocking the radiation.

          The energy is not radiated the same with/without the green plate. When the green plate is close to the blue plate, radiation from the blue plate warms the green plate. That reduces the temperature differential and according to S-B:

          q = ebA(Thot^4 – Tcold^4)

          It’s not clear to me what Tcold would be with the green plate lowered, maybe it’s the temperature of the glass. With the green plate in proximity, Tcold becomes the heated temperature of the green plate.

          If Tcold increases till it equals Thot, heat dissipation on that side would stop completely. At temperatures in between the conditions between green plate up and green plate down, the heat dissipation would keep reducing till Tcold = Thot. So, raising the green plate affects the temperature differential in the neighbourhood of the blue plate.

          However, there is no radiation absorbed by the blue plate from the green plate in order to satisfy the 2nd law. That also satisfies Bohr’s equation E = hf for EM. Ecold does not have the energy intensity or the frequency to satisfy Ehot. EM from the cooler plate cannot be absorbed by the blue plate.

          • Ball4 says:

            “However, there is no radiation absorbed by the blue plate from the green plate in order to satisfy the 2nd law.”

            This real process Gordon describes does NOT satisfy the 2nd law as universe entropy is not increased in such a process. Gordon needs to add more depth to his study of radiative transfer processes.

          • Norman says:

            Gordon Robertson

            Why? Why do you have to make up unreal physics all the time?

            YOU: “The energy is not radiated the same with/without the green plate. When the green plate is close to the blue plate, radiation from the blue plate warms the green plate. That reduces the temperature differential and according to S-B:

            q = ebA(Thot^4 Tcold^4)”

            Gordon you clearly are out of your league here. The vast majority of posters here know real actual physics. Your made up versions are very bad and only work to discredit any potential debate you might attempt.

            The ENERGY from the BLUE PLATE IS radiated exactly the same if the green plate is there or NOT. That is why I said instead of posting your trash made up physics experiment! Again you are far too lazy to do any real experiments so you will persist in your phony made up physics and false declarations. If you would take the time and do this experiment yourself you will find that the energy emitted by the Blue plate does not change (IS NOT BLOCKED)!! The only thing that will change the energy emitted by the blue plate is when its temperature changes! This is reality! These are facts you are not willing to accept! You could easily prove these facts if you were not so lazy and unmotivated! Do the experiment as E. Swanson set up and get IR sensors pointing at both the blue plate and the green plate and monitor the changes in the emitted energy. You will find the blue plate will not change its emission until its temperature goes up. You will also measure energy coming from the green plate to the blue plate, this is what is causing the temperature of the blue plate to rise to a new equilibrium temperature. Before the green plate is moved to position, the blue plate is only receiving IR from the cooler glass (which E. Swanson recorded).

          • Norman says:

            Gordon Robertson

            This is just total crap you made up, based upon nothing at all. Wish you would stop with the fake physics and learn the real material. I have tried to educate you but you will not learn.

            YOU: “However, there is no radiation absorbed by the blue plate from the green plate in order to satisfy the 2nd law. That also satisfies Bohrs equation E = hf for EM. Ecold does not have the energy intensity or the frequency to satisfy Ehot. EM from the cooler plate cannot be absorbed by the blue plate.”

            Where do you get this nonsense from? Where please tell me!

            I posted on the other thread showing you don’t have the slightest idea of what you are talking about. I will re-post it here, you will ignore it here as well. You just do not want to learn.

            http://www.drroyspencer.com/2018/04/new-lewis-curry-study-concludes-climate-sensitivity-is-low/#comment-299949

    • Mike Flynn says:

      E,

      Wait for night. Turn off your heat source. Wait for a bit.

      You will discover there is no temperature difference at all between the two plates. Just like the Earth at night.

      Things heat up during the day, cool down at night. As Fourier pointed out, at night the surface loses all the days heat, plus a little bit of its own.

      After four and a half billion years, the surface has cooled several thousand K, and continues to do so.

      Antarctica is presently covered with ice to kilometer depths in places – previously, it supported a varied range of flora and fauna. Nature doesnt agree with your assertions. Sad.

      Youll figure out your incorrect assumption, I hope. Lord Kelvin went to his death bed insisting that the Earth could not possibly be older than 20 million years! are you smarter than Lord Kelvin?

      Oh well, if you arent, it’s not my problem, is it?

      Cheers.

      • Norman says:

        Flynn

        What point are you trying to make? The point is that the green plate put in position caused the powered blue plate to move to a higher equilibrium temperature. Look at the graphs on E. Swanson link.

        What evidence do you have to support your made up statement that the surface of the earth continues to cool? It is at a relatively equilibrium temperature which allows liquid water to exist for billions of years. It has been in the range of liquid water at life supporting temperatures for billions of years. Your points are lame. They don’t even make sense on any level. What are you talking about?

        • Mike Flynn says:

          N,

          Just a quote – you won’t believe real scientists, obviously –

          “There are three processes at work: the first is the latent heat in the Earth’s core left over from the formation of our planet out of an accretionary disc of rock and dust approximately 4.57 Ga ago. The Earth cooled from the outside-in and as the core cools, that heat escapes into the mantle. The second process, which produces the majority of the heat, is caused by the decay of radioactive isotopes Potassium 40, Uranium 238, Uranium 235 and Thorium 232. The third is frictional heating caused by denser material sinking towards the core.”

          Keep believing that magic stops the 5500 K core from losing heat to the 3 K or so of space.

          No GHE. So sad, too bad.

          Cheers.

          • E. Swanson says:

            MF, The material between the Earth’s core and the surface acts as an insulator. The energy flow from the corer to the surface has been repeatedly measured and shown to be very small, compared to the average of the energy from the Sun. Ever heard of bore hole measurements of temperature vs. depth? Also, if there really was a lot of thermal energy coming up from the core, how could there be any permafrost below the yearly active zone?

          • Mike Flynn says:

            S,

            I’m glad you agree that the Earth has cooled, and that the cores is still cooling – it has no choice, has it, being 5500 K, and all!

            Yes, I have heard of the Earth’s geothermal gradient – that is why nobody has managed to drill deepe into the crust than 14 km. Too hot. No cold waves, if that is where you are heading. Complete nonsense.

            The Sun’s influence is not discernible beyond 20 m.

            I suppose you know –

            “Permafrost extends to a base depth where geothermal heat from the Earth and the mean annual temperature at the surface achieve an equilibrium temperature of 0 C.”

            Do you think that your gotcha may have rebounded, and got youinstead? What else are you incapable of finding out for yourself? Are you really so stupid and ignorant that you are reduced to seeking information from me?

            I should be surprised, but GHE believers often behave irrationally.

            Maybe you could try telling me again how you make thermometers hotter by putting more CO2 between the thermometer and a heat source?

            Cheers.

          • E. Swanson says:

            MF, You are the one who threw out the red herring, suggesting that geothermal energy has a significant influence on the surface temperature. Of course that energy is added to that from the Sun which then heats the atmosphere, but the Sun’s energy is by far the dominant quantity in climate.

          • Svante says:

            Yes Mike, what was the point again when we know that:
            “Mean heat flow is 65 mW/m2 over continental crust and 101 mW/m2 over oceanic crust.”

          • Mike Flynn says:

            S,

            Indeed. The fact that the molten core is hotter than the surface – even in bright direct sunshine – indicates that the Earth is cooling. Observations of the amount of heat being lost, and the absence of any perfect insulator which would prevent heat form the core reaching the surface, support this view.

            The Earth has cooled for four and a half billion years. That causes problems for anybody who attempts to describe the non-existent GHE. Do you really believe that the net result of a global heating effect is to reduce the surface temperature of the Earth? It seems so, but I doubt that is what you are trying to say.

            The result is that you cant actually say in clear terms what the GHE is supposed to do.

            Give it a try. if you like.

            Cheers.

          • Svante says:

            That’s right Mike.
            The core adds about 0.1 W to the 161 W solar input.

    • Joe Rancourt says:

      Why would you present this here ?

    • goldminor says:

      @ E …so make a prediction, if you can about what effect on the system can be expected from your superior physics.

      • E. Swanson says:

        goldminor, If you are asking me for a prediction, you’ve missed the point of the exercise. For more than ten years, some folks have claimed that the CO2 greenhouse effect is impossible because it violates the 2nd Law of Thermodynamics. Their theoretical interpretation of the 2nd Law also applies to solid bodies and my demonstration supports the opposite world view.

        A prediction? Those who deny the science of Global Warming will continue to denigrate and ignore my results without offering any counter evidence, as they have done now for almost 4 months.

        • goldminor says:

          I misunderstood your intent, sorry. I see what you are saying now. Certainly CO2 has some ability to warm just as water vapor does. It most certainly is not a main driver of the climate though as it builds in the atmosphere. It will lead to further warming as the concentration rises. Almost all agree on that.

          • La Pangolina says:

            goldminor says:
            May 2, 2018 at 1:24 PM

            Almost all agree on that.

            That’s new to me and a lot of others here.

          • goldminor says:

            @ La Pangolina …that should be taken in the context of after another 100 ppm are added that there should be an added warming effect. I think that natural processes can override the tiny effect of increased levels of CO2. To my mind the natural processes are always the main influence in comparison to the warming ability of CO2.

        • Gordon Robertson says:

          swannie…” Their theoretical interpretation of the 2nd Law also applies to solid bodies and my demonstration supports the opposite world view”.

          The 2nd law is not a world view or an opinion, it is a fundamental law of thermodynamics that has withstood over a century and a half of close scrutiny.

          It states clearly that heat can NEVER be transferred from a colder body to a warmer body without compensation. Your experiment does not prove in any way that heat can be transferred from the cooler green plate to the warmer blue plate that warmed it. To state such a conclusion is utter nonsense.

          I have pointed out to you that your green plate is interfering with the radiation field of the blue plate. Without the green plate, the blue plate is free to radiate from that side and it reaches an equilibrium temperature. When you raise the green plate, you are effectively blocking the ability of the blue plate to dissipate heat via radiation therefore it warms.

          The warming has absolutely nothing to do with back-radiation from the green plate. The 2nd law MUST prevail and you should be trying to understand your experiment in that respect. Over-riding a century and half of an established law does not make the law wrong, all it does is make you look inexperienced.

          It has been claimed that CO2 at 0.04% of the atmosphere can interfere with radiation in a similar manner to your solid metal plate. That’s ridiculous. Compared to the amount of radiation from each atom making up the surface and the oceans, the CO2 would look like a metal plate with large holes punched in it. 99% of the radiation would pass right through.

          • Tim Folkerts says:

            Gordon says: “I have pointed out to you that your green plate is interfering with the radiation field of the blue plate. “

            And how would you explain the mechanism by which the Green plate interferes with that radiation field? The most obvious (and correct) answer is that the green plate’s own radiation field interferes with the radiation field of the blue plate. The green plate’s radiation back toward the blue plate limits how much energy the blue plate loses. I don’t know about you, but I would tend to call radiation back from the green plate “back-radiation”.

          • Ball4 says:

            “It has been claimed that CO2 at 0.04% of the atmosphere can interfere with radiation in a similar manner to your solid metal plate. Thats ridiculous.”

            Prof. Tyndall thought it ridiculous too until he bought the lab equipment and ran the test. Then found out his data showed invisible lab air with CO2 at 0.04% of the atmosphere did interfere with radiation in a similar manner to a solid metal plate.

          • Mike Flynn says:

            Ball4,

            You would have to be as dumb as a box of hair, if you believe that putting a solid metal plate between a heat source and a thermometer, makes the thermometer hotter!

            Just how stupid are you? Rhetorical question, I know, but feel free to answer if you wish.

            Cheers.

          • Ball4 says:

            No, I disagree with you Mike, the thermometer would not become hotter as you write & Prof. Tyndall proved. Only those that admit they haven’t the faintest idea what we’re talking about and believe in magic such as Mike Flynn would write such a thing.

            I do have to admit Mike has written out testable hypotheses for Earth GHE accurately though so he’s not completely clueless on Earth surface climate like some others here.

          • Nate says:

            Mike, anyone who thinks what people are discussing here is “putting a solid metal plate between a heat source and a thermometer”

            must be as dumb as a box of hair.

          • Nate says:

            When you say “Without the green plate, the blue plate is free to radiate from that side and it reaches an equilibrium temperature. When you raise the green plate, you are effectively blocking the ability of the blue plate to dissipate heat via radiation therefore it warms.”

            I think we all agree with your interpretation, more or less. And we agree that it doesnt violate the 2LOT.

            So where do we now disagree? Just the name of the effect?

          • Nate says:

            That was a question for Gordon.

          • Mike Flynn says:

            Nate,

            Ball4 wrote –

            ” . . . did interfere with radiation in a similar manner to a solid metal plate.

            I agree that Ball4, like yourself is as dumb as a box of hair, to use the vernacular, but you may choose to disagree.

            Learn to read.

            Cheers.

          • Nate says:

            Mike, good job with the partial quotes missing key info. Yes plate, no not between heat source and thermometer.

      • David Appell says:

        Gold:It is impossible to make predictions in climate science, because no one knows the future path of greenhouse gas emissions.

        This should be very obvious to you.

    • AndyG55 says:

      “This so-called back radiation is similar to the process which is the basis for the Greenhouse Effect of CO2 and other radiative gases within the atmosphere.”

      No, its not !!

      Not in any way what so ever.

      • Ball4 says:

        Andy 4:00pm – The blue plate only situation is Earth surface with no atm. radiating to deep space sink. The green plate adds in another object (as does adding Earth atm. object) between Earth surface and deep space.

        So there is a way. Despite your views.

        • Mike Flynn says:

          Ball4,

          Does not seem to have stopped the Earth from cooling for four and half billion years, does it?

          And obviously, if the core is hotter than outer space, it will continue to cool.

          Or do you have some hidden magic which prevents hot objects from radiating energy?

          And if you did, how would you know the objects temperature? No radiation, no means of knowing temperature, is there?

          Stupid and ignorant if you believe you can stop the Laws of Thermodynamics from operating. All part of climatological pseudoscience!

          Cheers.

          • Ball4 says:

            “Does not seem to have stopped the Earth from cooling for four and half billion years, does it?”

            Nor the universe. The same four and half billion years of surface cooling would have happened if Earth had no IR active gases (except today’s end point would be globally 33K cooler) and with the IR active gas constituents.

            “Or do you have some hidden magic which prevents hot objects from radiating energy?”

            Mike, your believing magic exists is not helpful in science discussions. All real objects radiate at all frequencies at all temperatures all the time. Check with Dr. Planck on that.

            “And if you did, how would you know the object’s temperature?”

            Kinetic temperature is measured with a thermometer and brightness temperature with a radiometer Mike.

            “No radiation, no means of knowing temperature, is there?”

            No. I recall Mike admitting he hasn’t the faintest idea what we’re talking about here so you could study up on the basics of kinetic thermometer measurement fundamentals if you don’t have a radiometer handy. Or not, your choice.

            Please don’t become better informed Mike, it is so much more entertaining Mike not having the faintest idea about fundamentals of climate discussion.

          • Gordon Robertson says:

            ball4…”All real objects radiate at all frequencies at all temperatures all the time….”

            Yes, but they don’t all absorb equally, hence the 2nd law.

          • Gordon Robertson says:

            ball4…”so you could study up on the basics of kinetic thermometer measurement fundamentals…”

            You spelled it wrong bally, it’s Kinetik thermometer, with Kinetik being a trade name. What the heck does such a thermometer measure, kinetiks?

            I have heard of mercury thermometers, thermister-based thermometers, and the infrared thermometer you mentioned.

            Certainly thermometers mention heat, which is the kinetic energy of atoms in motion. Perhaps you have revised your definition of heat and now recognize it’s proper definition. I notice you refrained from associating thermometers with heat.

          • Ball4 says:

            “What the heck does such a thermometer measure, kinetiks?”

            Measures mean kinetic energy of the object constituent particles the kinetic thermometer touches hence the term, an electronics tech. ought to know that. Of course I refrained, (kinetic or brightness) temperature is not heat Gordon, they even have different units.

            “Yes, but they don’t all absorb equally, hence the 2nd law.”

            No, Kirchhoff settled that objects do absorb equally by the mid-1800s. Think about the temperature (i.e. explosion) problems if real objects didn’t have emissivity and absorp.tivity equal, an experienced electronics tech. ought to come to the same conclusions as did Kirchhoff.

          • Nate says:

            ‘ some hidden magic’ yes its called science. To cavemen, such as yourself, many modern technologies seem like magic.

        • Gordon Robertson says:

          ball4…”The blue plate only situation is Earth surface with no atm. radiating to deep space sink. The green plate adds in another object (as does adding Earth atm. object) between Earth surface and deep space”.

          ***********

          It’s a poor analogy. If you built a shell of steel right around the planet solar radiation would be blocked and it would absorb the solar radiation. If there was another spherical plate inside, it would get heated by radiation and conduction/convection if there was air in between.

          Comparing 0.04% of CO2 to a metal plate is ingenuous, but that’s how desperate you alarmists have become to prop up dumb theories like the GHE and AGW.

          CO2 cannot act in any way like an intermediate metal plate that would block radiation. Besides, the premise of the green plate blue plate is that the heated blue plate warms the cooler green plate which back radiates EM to raise the temperature of the blue plate. That idea has to rate as some of the worst physics I have ever encountered.

          That’s perpetual motion!!! If the GP warms the BP then it radiates more EM to the green plate. It warms and radiates more EM to the BP which warms further. Let’s stop being so silly.

          There is a fundamental error in the assumption which contradicts the 2nd law. Heat can NEVER be transferred from a cooler object to a warmer object without compensation.

          The idea that an intermediate plate can slow heat dissipation from a warmer plate is nonsense UNLESS the intermediate plate is in close proximity and/or interferes with convection. CO2 does neither plus it is such a rare gas it could not possible absorb enough radiation to present a continuous surface to radiation.

          It’s not the intermediate surface that slows the dissipation it’s the TEMPERATURE of the intermediate plate. Unless CO2 in the atmosphere can raise atmospheric temperatures significantly, and there’s no proof of that, it cannot interfere with surface radiation.

          It makes infinitely more sense that the 99% N2/O2 in the atmosphere affects surface radiation.

          • Ball4 says:

            “It’s a poor analogy.”

            No, it is not an analogy, the radiative transfer science eqn.s are the same Gordon.

            “Heat can NEVER be transferred from a cooler object to a warmer object without compensation.”

            Sure it can. Gordon is consistently wrong on this point as Gordon doesn’t fully understand 2LOT. Maxwell & Boltzmann both showed how heat can be transferred from a cooler object to a warmer object without compensation as long as universe entropy is increased in the process.

          • Ball4 says:

            “That’s perpetual motion!!! If the GP warms the BP then it radiates more EM to the green plate. It warms and radiates more EM to the BP which warms further.”

            No. The 2LOT will stop this process when universe entropy reaches its maximum amount. The 1LOT had to be supplemented with the 2LOT for this reason.

          • Ball4 says:

            “CO2 cannot act in any way like an intermediate metal plate that would block radiation.”

            The world of the Royal Society was stunned as was Prof. Tyndall when he revealed invisible .04% CO2 gas in lab air acted just like a metal plate although with much more transmissivity. Tyndall was expecting opposite results to what he found in the data because his Mark 1 eyeball couldn’t see in the IR. That caused him to repeat the experiment like hundreds of times to be sure of confidence in his results.

          • Mike Flynn says:

            Ball4,

            Complete fantasy. “A metal plate with much more transmissivity”?

            You made that up, didn’t you?

            Dream on laddie! You cannot even write decent fiction. Don’t give up your day job (if you have one, of course).

            How are you going with finding a testable GHE hypothesis? Not so well?

            Keep on making stupid stuff up. Maybe some other gullible nitwit will believe you. Good luck.

            Cheers.

          • Ball4 says:

            “How are you going with finding a testable GHE hypothesis?”

            Already have, from Mike Flynn who has repeatedly written out testable GHE hypotheses based on reading Prof. Tyndall’s work.

          • RWturner says:

            Yup, another horribly stupid analogy. In case you weren’t aware, the Earth is heated from an external source, not from an internal power source like this blue plate.

            The grade-school understanding and comparing of CO2 to insulation around a heated source is laughable. Why do you think the surface of the moon is MUCH hotter than the hottest surface of the Earth in the day? Because the atmosphere is a conductor of thermal energy. Oh look, all of a sudden your “insulator” is playing a huge roll in cooling the planet.

            Now I know, you’re going to say, what about at night? Yeah, the atmosphere is retaining heat and keeping the surface warmer than it would be, but not because the 15K back radiation, but because of this thing called heat capacity. That’s why they Sahara Desert loses more heat into space than it receives from the sun, because the dry air has far lower heat capacity, despite there being just as much CO2 in the atmosphere over the Sahara as anywhere else on the planet.

    • MrZ says:

      If this is true why are maxtemps not increasing?
      Averages are indeed increasing but only because of increasing mintemps ie milder nights and winters.

  2. AaronS says:

    For a La Nina 0.21C is warm. If ENSO goes neutral and L.- trop global temperatures respond as per previous events the “hiatus” will be over.

    • Timmy S says:

      The latest La Nina is basically over. Expect the global temps to start rising next month or the one after. Typical lag time is around 4 months, and the Nino 3.4 SST bottomed out in late Feb. and was 0.0 last week.

      • Global temperatures will not be rising this time.

      • barry says:

        Global lower trop temps tend to lag ENSO events by several months,so we may yet see a further drop.

        OTOH, it has been a pretty mild-to-non-existent la Nina, so other factors may dominate global temps for the next few months.

    • TheFinalNail says:

      AaronS

      “For a La Nina 0.21C is warm.”

      I agree. I was expecting UAH to register in the low 0.1s area, given its past correlation with ENSO, taking the lag into consideration even.

      TFN

      • goldminor says:

        The oceans take some time for that heat to dissipate,imo. That is the hard part in figuring out projections. It took me a while to understand that, causing me to miss a few of my predictions.

    • barry says:

      Aaron,

      According to many ‘skeptics’, the “hiatus” was over the moment the linear trend since 1997/98 went positive in early 2016.

      How are you reckoning it?

      • AaronS says:

        2016 2017 was a major El Nino. The ~0.5deg C increase is natural/ short-term and should be removed or ignored from global warming debates. It is a way to detect bias when people ignore ENSO because it supports their position. Notice how much media was occurring in 16 and 17. It was an absurd position bc the data were global warming plus El Nino warming.
        Same with La Nina now. Based on analogy global temp are suppressed during 2018 because of a signifocant La Nina. For example- today the global temperature is ~equal to 2001, but I dont think that because we are in La Nina cool phase.

        I believe some thermometer data sets have factored in the deeper pacific to remove the wild ENSO swings, but obviously El Nino still lifted global in L. TROP data.

      • barry says:

        I detect bias as soon as people refer to the ‘pause’ or ‘hiatus’. It comes with a start year that has been promoted by skeptics for years.

        1) It begins with the strongest el Nino of the 20th century
        2) It ignores the uncertainty in the trend

        15 or 18 or 20 years just isn’t enough.

        Skeptics always banged on about the linear trend and never mentioned uncertainty.They ignored that the result was statistically non-significant.

        When the linear trend went positive, a fair number of skeptics remained consistent and said the trend was over.

        Other skeptics suddenly became interested in statistical significance and piped that argument to keep the ‘hiatus’ alive.

        Other skeptics started saying that a linear trend was not a legitimate way to look at the data.

        Yet other skeptics decided that it was unfair to include the 2016 el Nino, but completely fair to keep the 1998 el Nino. When challenged on it, they developed an argument that the 1999/2000 la Nina “canceled out the ’98 el Nino.”

        I had a completely different take. The linear trend from 1998 to any time beyond was not statistically distinguishable from any trend before that year. There was never enough statistical information to say that there had been a change in trend in any direction, let alone a ‘pause’.

        Looked like a whole lotta people making over-confident summaries about trends in global temps over time periods that were too short to ascribe much meaning. Looked like politics. Still does.

        • La Pangolina says:

          Exactly right barry.

        • Gordon Robertson says:

          barry…”I detect bias as soon as people refer to the pause or hiatus. It comes with a start year that has been promoted by skeptics for years.

          1) It begins with the strongest el Nino of the 20th century
          2) It ignores the uncertainty in the trend…”

          ******

          So you detected the bias in the 2013 IPCC announcement that the previous 15 years from 1998 – 2012 were a warming hiatus. Please note the IPCC also began the hiatus with 1998.

          *********

          “I had a completely different take. The linear trend from 1998 to any time beyond was not statistically distinguishable from any trend before that year”.

          The IPCC called it a warming hiatus between 1998 and 2012 and you did not detect a difference to trends from bygone years???

          Now that’s what I call denial.

          BTW…are you referring to the trend after it was retroactively fudged by NOAA to show a trend, or before?

          • barry says:

            Gordon, I read the whole paragraph on the ‘hiatus’ in the IPCC. Clearly you are blind to all but a portion of a sentence.

            I can’t help you with your blinkers.

        • goldminor says:

          It is fair to keep the 1998 El Nino after the passage of enough years. Then one can look back and see that the step change was long lasting. That is where you are going wrong in your thoughts, imo. It is unfair to use this last El Nino until we can see what happens after the current negative ENSO is over.Then we may well see another step change. That would be indicative of continued warming. .

          • barry says:

            I don’t think ‘step’changes’ in the temp record are validated. Possibly a shift in the mid-70s, but not every time there’s a strong el Nino. It only looks that way.

          • goldminor says:

            @ barry …my bet is on e step down from here.

        • RWturner says:

          Sort of like basing my age on the day I was born is cherry-picking…

    • goldminor says:

      ENSO is going down hill from here. The next El NIno will take place some time in 2020, imo.

    • RWturner says:

      Silly. That’s like saying the last stock market crash was small for a crash because the down market was twice as large as the down market in the 1980s. Hysteresis!

  3. jimc says:

    Thanks Dr. Spencer. It’s good to have real data as opposed to the “looks about right” model data and endlessly adjusted surface data. If I close one eye and squint through the other, it seems even the 0.13 K/decade may be jeopardy.

    • jimc says:

      … in jeopardy.

    • Joel says:

      The decade trend number has not actually been at 0.13K/decade since 2010 (0.131). Since then it has dropped as low as 0.110 in 2014, then rebounded to 0.128 (rounded to 0.13) at the end of 2017.

      If 2018’s average temp anomaly is <0.21K, then the trend will be rounded down to 0.12K/decade, but still remain within the range it has been for the last 20 years. In 1997, the trend was 0.09K/decade. Since 1998, the trend has not dropped that low again.

      The trend data robustly shows continuing warming. No cooling, no significantly reduced warming, no pause.

      • jimc says:

        Thx. Linear regression of all UAH global data points?

        • Joel says:

          @jimc

          To do it quickly and easily, I’ve just used the average anomaly for each year. There will likely be some slight difference if you used the monthly data.

      • Gordon Robertson says:

        joel…”The trend data robustly shows continuing warming. No cooling, no significantly reduced warming, no pause”.

        Presented by Joel Shore,
        Uber-alarmist.

        Joel even contradicts the IPCC who claimed a 15 year hiatus in 2013.

        • Joel says:

          I’m sorry, I can’t hear you over the sound of an irrefutable trend.

        • David Appell says:

          Gordon Robertson says:
          Joel even contradicts the IPCC who claimed a 15 year hiatus in 2013.

          Gordon keeps lying about this.

          He knows new data have come in since then, showing there was no pause. That will be reflected in the new AR now being organized.

          Gordon doesn’t care about truth, only about his talking points. He’s as pure as deniers get.

  4. Rob Mitchell says:

    Compared to the globe, it appears we are in a Tropical cooling phase. And in the short-term, it looks like the Arctic has been getting the lion’s share of heat from the Tropics.

    • barry says:

      ?

      Who is “we” compared to the globe?

      • Gordon Robertson says:

        barry…”Who is we compared to the globe?”

        Anyone with a lick of sense. It’s plain on the UAH graph that a negative trend has been in effect since February 2016.

        • David Appell says:

          Gordon Robertson says:
          Its plain on the UAH graph that a negative trend has been in effect since February 2016.

          Natural variation – transition from El Nino to La Nina. Your little trend says nothing about climate change.

          It’s not even close to being statistically significant, either.

      • barry says:

        Your comment bears no relation to mine or Rob’s.

        Who is “we” compared to the globe? Do you even understand what Rob means by that? I assumed he was referring to US-only temps (compared to the globe), but I asked for clarification.

        • Rob Mitchell says:

          Barry, you and David are making waayyyyy too much of a big friggin’ issue out of the word, “we.” Thank you Gordon for applying a little common sense to the discussion. To clarify for Barry, the word “we” is a word for humans, you know, folks like you, me and everybody else. I am basically just looking at Dr. Spencer’s data and commenting on what is going on in the short term. I am not trying to prove anything. I am just observing two things going on at the same time. It might be meaningless. But a weatherman like me knows that the earth is constantly transporting heat vertically and horizontally. Is there ever such thing as a “balance?” There is a constant imbalance between the equatorial region and the polar regions of the earth. At the moment, it appears that the Tropical region is shedding some of its heat. That heat has to go somewhere, and according to UAH data, it looks like the Arctic is catching quite a bit of it.

          I am not a research meteorologist. I am strictly an operational meteorologist, aka weatherman. But I am interested in the issue of Climate, and I just so happen to think that Dr. Spencer and Dr. Christy have a better handle on this subject than most. If that upsets some people, then so be it. They’ll live.

  5. Still warm but going in the correct direction.

    Overall sea surface temperatures now only +.187c above means down from around +.34c or so this past summer.

    I still say it is weakening solar/geo magnetic fields which determine the climate.

  6. The NCEP CFSV2 global surface temperature anomaly was up slightly from +0.321C in March to +0.365C in April referenced to the CFSR averages for 1981-2010.

    Monthly trend graphs here:
    https://oz4caster.wordpress.com/monthly-trends/

    Daily trend graphs here:
    https://oz4caster.wordpress.com/cfsr/

    I noticed this morning that the latest SSTA global plot from the University of Maine Climate Change Institute shows a global anomaly of only +0.1C for 4/30/18 and a 2018 YTD average of only +0.2C referenced to 1971-2000. Not very impressive if you’re looking for global warming.

    • David Appell says:

      Not very impressive if youre looking for global warming.

      Data for 4+ months is not indicative of climate change or climate anything, bud of weather and natural variations.

      • David,

        We are talking about global average sea surface temperature anomalies here, which do not change near as much as air temperatures and are very slow to change by comparison. So a 4-month average is a bit more meaningful than for surface air temperatures. The global SSTA average has overall been dropping since the last El Nino peak in 2016. It seems to be leveling off for now, but again global SSTA of +0.1C is not very impressive for 18 years since the end of the reference period.

  7. Kristian says:

    Thanks, Roy. Nice.

    The correlation over time between the global TLT anomaly data (UAHv6) and the global all-sky ToA OLR flux anomaly data (CERES EBAF Ed4) appears just as tight and impressive as before:
    https://okulaer.files.wordpress.com/2018/05/uahv6-gl-tlt-vs-ceres-ebaf-ed4-gl-olr.png

    There is still not a hint of any gradual, systematic divergence between the two.

    • Svante says:

      Could you add trend lines to that graph please?

        • Svante says:

          Because we’re looking for a very small divergence, which would hard to spot by eye-balling.

          Natural variations are very large compared to our small annual increase.

          • Kristian says:

            Yeah, but you see, statistically generating a linear trend line across these data won’t tell you much. In fact, it would most likely fool you into
            thinking you see a divergence that isn’t really there.

            Look, comparing linear trends specifically obscures what the data behind is saying. People tend to get way too caught up in statistical trend lines and what they’re supposedly showing, and end up forgetting or ignoring the actual data.

            If you start out with a La Nina and end with an El Nino, the linear trend will be higher than if you don’t. IOW, the noise directly affects your trend. You need to look past the noise. LOOK AT THE DATA! And UNDERSTAND what the data is showing you, what variables you are in fact plotting and looking at. Understand the processes behind.

            That’s what you need to do, Svante. You don’t need any statistical tools beyond the plotting, if you have all the data, eyes in your head, and an understanding of the physical phenomena being plotted.

            If you don’t LIKE what the data shows you in plain sight, THAT’S when you start manipulating it (or its central message). Focusing on ‘linear trends’ is one such method, very popular indeed in “climate circles”.

            But go ahead. All the data are freely available. Do whatever you want with it.

          • Nate says:

            “Look, comparing linear trends specifically obscures what the data behind is saying. People tend to get way too caught up in statistical trend lines and what theyre supposedly showing, and end up forgetting or ignoring the actual data.”

            Are you sure you’re not Bart?

            Eyes not stats. Linear trends, no point.

            But the trend IS precisely what you said we need to be testing:

            K: “The only way you could ever see an enhanced GHE causing global warming in effective operation in the Earth system is by observing over time that the total All-Sky OLR at the ToA TRENDED systematically DOWN relative to tropospheric temps. Problem is, it doesnt:”

            K:

          • Kristian says:

            Nate says, May 2, 2018 at 5:16 AM:

            But the trend IS precisely what you said we need to be testing:

            Yes. And you ‘test’ it by looking at the data.

            Something systematically trending down relative to another thing. No linear trend line required.

            ‘trend’:
            1. To show a general tendency; tend
            (…)
            3. To extend, incline, or veer in a specified direction

            I’m not talking about applying a linear trend line to the data, Nate. That’s specifically a statistical tool. I’m talking about showing a general tendency. I’m talking about veering in a specified direction.

            We don’t need a linear trend line to spot such a tendency. We have 32-33 years of data:
            https://okulaer.files.wordpress.com/2018/05/uah-tlt-vs-erbsceres-olr-60-602-b.png
            https://okulaer.files.wordpress.com/2018/05/tlt-vs-olr-trop-erbsceres2-b.png

          • Bart says:

            People who don’t really get math think it’s some magic crystal ball, instead of merely a means of quantifying what you can see with your own eyes. Statistics are means of data compression, not for divining truth.

          • Nate says:

            Kristian,

            “We dont need a linear trend line to spot such a tendency. We have 32-33 years of data:”

            Data manipulated to make conform to your belief.

            http://www.drroyspencer.com/2018/05/uah-global-temperature-update-for-april-2018-0-21-deg-c/#comment-300166

          • David Appell says:

            Trends aren’t going to help here (nor will the difference calculation I suggested below), because the quantities have different units.

            What might help is a scatterplot of OLR(T) [as anomalies]. Does that have a trend?

          • David Appell says:

            On second thought, Kristian’s (arbitrary) scale factor effectively makes the units the same, so it’d make sense to compare linear trends.

            I’ll do that if someone points me to the OLR data file.

          • Kristian says:

            Bart says, May 2, 2018 at 10:12 AM:

            Statistics are means of data compression, not for divining truth.

            Thanks, Bart. I think I’m done with this particular bunch of data deniers. There’s no way to get through …

          • Kristian says:

            David Appell says, May 2, 2018 at 1:21 PM:

            On second thought, Kristian’s (arbitrary) scale factor effectively makes the units the same (…)

            It’s not arbitrary, David. Heard of the Stefan-Boltzmann Law?

          • Nate says:

            If by troll, you mean point out the very real concerns with your analysis/conclusions, then yes Im here to troll.

            Look if your ideas cannot stand up to scientific scrutiny, then they are not really science are they?

          • David Appell says:

            Kristian says:
            Its not arbitrary, David. Heard of the Stefan-Boltzmann Law?

            What does that have to do with your choice of scale factor? (And, yes, it is a choice.)

            You graph isn’t well labeled so it’s hard to know what you mean by it.

            But I do see you won’t share your data. That’s all it takes to know you aren’t being honest here.

          • Nate says:

            Guys,

            the trend for the OLR 3/2000-9/2016 is from this paper
            https://journals.ametsoc.org/doi/full/10.1175/JCLI-D-17-0208.1

            Table 7, All sky, LW, Ed 4.0

            is 0.19 +- 0.21 W/m^2/decade.

            To compare to a temperature trend, divide OLR by 4.

          • Kristian says:

            David Appell says, May 3, 2018 at 12:48 PM:

            What does that have to do with your choice of scale factor? (And, yes, it is a choice.)

            It’s not a choice, David. The scale factor is given by the Stefan-Boltzmann Law itself.

            Going from 254.9K to 255K (+0.1K) will result in a 0.376 W/m^2 increase in thermal emission flux (the all-sky OLR at the ToA), according to the S-B equation. 1 divided by 3.76 is 0.266. Try it.

          • Svante says:

            You need the 4th root, not division by 4.

          • Kristian says:

            HOW TO SELF-DECEIVE BY FOCUSING PURELY ON LINEAR TREND LINES AND THUS IGNORING THE DATA BEHIND …

            Just to show the honest people reading this blog how silly, petty and downright disingenuous the ‘request’ (demand, really) by the usual defenders of the idea that “CO2 must be the cause, no matter what the evidence says” that I statistically generate ‘linear trend lines’ from my data and calculate their slopes so as to somehow enable me (and them) to “properly analyse” that very same data, which is already plotted for everyone to see and study for themselves, really is, I will describe, using graphs, how applying linear trend lines to plotted data in fact turns out to be, first and last, little more than a cherry-picking exercise – it can provide you with whatever result you WANT!

            And one might very well ask how come these compulsive whiners don’t see this themselves …! How they are all of a sudden apparently oblivious to this pretty well-known fact. Considering how much time and effort has been spent – and is still being spent – on discussing, endlessly back and forth, start and end points on temperature curves with regard to things like “The Pause”.

            Again, the bottom line is, you will always be able to get exactly the answer you want. Using STATISTICS.

            And these people of course know this very well.

            There’s a reason behind the adage: “There are three kinds of lies: lies, damned lies, and statistics.”

          • Kristian says:

            OK, so let’s start with the graph I put out originally:
            https://okulaer.files.wordpress.com/2018/05/uahv6-gl-tlt-vs-ceres-ebaf-ed4-gl-olr.png

            Here’s a more compressed version of the exact same data plotted:
            https://okulaer.files.wordpress.com/2018/05/tlt-vs-olr-2000-2017.png

            Try to track with your eyes the red and the blue curves as they move along, from the beginning of 2000 on the left to late 2017 on the right.

            Do you see any kind of systematic, gradual divergence between the two? Does the blue curve slowly, but steadily veer upwards and away from the red one over time, from start to finish? Or is there simply something big going on right at the end, around that late spike of the 2015/16 El Nio? Hmmm.
            https://okulaer.files.wordpress.com/2018/05/tlt-vs-olr-2000-2017-b.png

            Is there any obvious ‘gradual divergence’ to be discerned before late 2015 (the autumn build-up to that Nino peak)?

            Watch, now, as we apply the linear trend lines:
            https://okulaer.files.wordpress.com/2018/05/tlt-vs-olr-2000-2017-c.png

            Yup. That’s PRECISELY what they’re after, isn’t it? And they knew the outcome all along. This is the graph all CO2 enthusiasts want to see! “Alternative theory” debunked! CO2 is back to being the climate ‘control knob’. The cause and driver of all medium and long-term warming!

            The trend lines diverge gradually. Which must mean the two DATASETS diverge gradually also. Right?

            Problem is, the trend lines are LINEAR, by definition and by default. If one goes up more from A to B than the other, it will naturally APPEAR to rise more/faster in a steady, systematic manner (as if from a gradually increasing “radiative forcing”!). EVEN IF THE DATA BEHIND DOESN’T!

          • Kristian says:

            So how can we tell these two datasets don’t actually diverge gradually from 2000 to 2017? That it’s nothing but a statistical trick. That the difference in statistical trends is specifically caused by noise and nothing else.

            Well, if the divergence between the two datasets in question were indeed systematic (gradual and consistent across all the ENSO-induced peaks and troughs; no general linking back up once detached) over the period as a whole, and not just a random result of ‘endpoint’ noise, then we SHOULD (at least qualitatively) see the same trend-line divergence tendency even when removing the final two years of the series.

            But we don’t. Not at all. That’s simply not what’s going on:
            https://okulaer.files.wordpress.com/2018/05/trendlines-2000-2015.png
            https://okulaer.files.wordpress.com/2018/05/trendlines-2001-2015.png
            https://okulaer.files.wordpress.com/2018/05/trendlines-2001-2013.png

          • Kristian says:

            Let’s now extend this analysis back in time. TLT vs. OLR, 60N-60S, 1985-2017:
            https://okulaer.files.wordpress.com/2018/05/60n-60s-tlt-vs-olr.png

            What do you see? Endpoint problems once more. We start with a La Nina (LN) and end with an El Nino (EN):
            https://okulaer.files.wordpress.com/2018/05/60n-60s-tlt-vs-olr-b.png

            Linear trend lines WITH both the early LN and the late EN included:
            https://okulaer.files.wordpress.com/2018/05/60n-60s-tlt-vs-olr-1985-2017-trend.png

            There you have it once again: The TLT trend is steeper than the OLR trend. Systematic, gradual divergence confirmed …? Er, no.

            Linear trend lines with the early LN and the late EN REMOVED:
            https://okulaer.files.wordpress.com/2018/05/60n-60s-tlt-vs-olr-1986-2015-trend.png

            What a difference a couple of years make!

          • Kristian says:

            Folks, we can’t ignore the impact of ENSO (and volcano) noise on the trends! We can’t just pretend it’s not there. Or that it doesn’t matter. IT DOES!
            https://okulaer.files.wordpress.com/2018/05/60n-60s-tlt-vs-olr-enso-pinatubo.png

            Tropics, now:
            https://okulaer.files.wordpress.com/2018/05/20-20-tlt-vs-olr.png

            Early La Nina, late El Nino:
            https://okulaer.files.wordpress.com/2018/05/20-20-tlt-vs-olr-b.png

            (BTW, if you for some reason were to believe that the final (2017) blue TLT uptick is somehow a ‘systematic’ one, then, no:
            https://okulaer.files.wordpress.com/2018/05/tropical-tlt.png )

          • Kristian says:

            Again, linear trend lines WITH both the early LN and the late EN included:
            https://okulaer.files.wordpress.com/2018/05/20-20-tlt-vs-olr-1985-2017-trend.png

            Yes. No surprises there. Steeper TLT trend. But, yet again we must ask: Is it ‘real’? Or is it merely circumstantial? ‘Accidental’.

            Linear trend lines with the early LN and the late EN REMOVED:
            https://okulaer.files.wordpress.com/2018/05/20-20-tlt-vs-olr-1986-2015-trend.png

            * * *

            What, then, am I trying to say with all this?

            This is all about cherry-picking the start and end dates of our analysis. The individual slopes of our linear trend lines change according to the change our start and end dates. Even from positive to negative!

            The data itself, however, NEVER DOES! It consistently tells its story, no matter what …

            People: JUST LOOK AT THE DATA!

          • Svante says:

            Good analysis Kristian!

            Should the graph use the OLR 4th root to make them comparable (or TLT ^4)?

          • Kristian says:

            Svante says, May 5, 2018 at 1:52 AM:

            Should the graph use the OLR 4th root to make them comparable (or TLT ^4)?

            No. What you want is to ‘translate’ the OLR flux (W/m^2) into temps (T) via the Stefan-Boltzmann equation.

            What you do is simply apply the S-B equation to a specific rise in temperature, say, +0.1 K. What do you get? An increase in OLR of +0.376 W/m^2, which is 3.76 times as much as the rise in temp.

            You can do this operation yourself, Svante. q/A = σ T^4. Try it.

          • Svante says:

            Kristian,

            The S/B ‘T’ is the absolute temperature.
            You can not apply that to a delta value.

            Your graph has different absolute temperatures.
            You have to apply T^4 all along your graph.

          • Kristian says:

            Svante says, May 6, 2018 at 1:55 AM:

            You have to apply T^4 all along your graph.

            I am. That’s the whole point.

          • Svante says:

            What absolute temperature range did you use then?

          • Kristian says:

            Svante says, May 6, 2018 at 2:51 PM:

            What absolute temperature range did you use then?

            It’s in my original response to Appell:
            http://www.drroyspencer.com/2018/05/uah-global-temperature-update-for-april-2018-0-21-deg-c/#comment-300463

            Look, this is very simple. A temperature of 254.9 K will produce a thermal emission flux of σ 254.9^4 = 239.383 W/m^2. A temperature of 255 K, 0.1 K higher than the first one, will produce a thermal emission flux of σ 255^4 = 239.759 W/m^2. That’s an increase in the thermal emission flux intensity of [239.759 – 239.383 =] 0.376 W/m^2.

            So as the temperature value rises by 0.1 K, the thermal emission flux value rises by 0.376 W/m^2, 3.76 times as much, only with a different unit. Which means that, if you want to translate your thermal emission flux values into temperature values, you will have to divide them by 3.76. And THAT’S the scaling I’ve used (for the global plots). And you see how well it fits. There’s nothing coincidental about it …

          • Svante says:

            So you are making a linear approximation of x^4.
            Fair enough, the error is about 1.7% between 1986 and 2016.

          • Kristian says:

            Svante says, May 7, 2018 at 10:59 PM:

            So you are making a linear approximation of x^4.
            Fair enough, the error is about 1.7% between 1986 and 2016.

            Are you telling me you don’t get this, Svante!?

            There is no such “error”. The only uncertainty is the precise value of Earth’s T_e. Is it 255 Kelvin, or is it 0.1, 0.2 or 0.3 Kelvin more or less than this?

            Going from 254.7 to 254.95 Kelvin would increase the thermal emission flux by 0.9383 W/m^2, 3.7532 times as much as the absolute rise in temperature (+0.25 K).

            Going from 255.3 to 255.55 Kelvin would increase the thermal emission flux by 0.9449 W/m^2, 3.7796 times as much as the absolute rise in temperature (+0.25 K).

            The difference between 3.7796 and 3.7532 is 0.7%. So, yes, you could say there’s an “uncertainty” to my ‘approximation’ (it’s not a ^4 approximation, though; it’s a T_e approximation) of about x0.0264, or 0.7%.

            That is pretty darn precise.

          • Svante says:

            It’s hard to explain, but if you have:
            x = 1,2,3,4 then
            x^4 = 1,16,81,256

      • barry says:

        Because it looks like there is a gradual divergence between the 2 sets of data.

        • Kristian says:

          Oh, and what “gradual divergence” is that?

          https://okulaer.files.wordpress.com/2018/05/uahv6-gl-tlt-vs-ceres-ebaf-ed4-gl-olr-1.png

          You blindly look at the end point, barry. That will get you confused.

          Like I told Svante above: The noise will directly affect your trend. Which means you need to look past the noise. LOOK AT THE DATA! And UNDERSTAND what the data is showing you, what variables you are in fact plotting and looking at. Understand the processes behind.

          • Nate says:

            “The noise will directly affect your trend. Which means you need to look past the noise. LOOK AT THE DATA! And UNDERSTAND what the data is showing you, ”

            Indeed the noise affects trend. What the data should tell you then, is you cannot conclude what Kristian concludes about the trends.

            ‘Look past the noise’ = apply confirmation bias.

          • Kristian says:

            *Sigh*

            There’s a divergence in the linear trend lines, Nate. That’s a different thing altogether. There’s no divergence in the actual data.

            We are not comparing two different datasets describing one and the SAME parameter. We are correlating two datasets describing two DIFFERENT parameters. We are looking at correspondence. The OLR is basically translated (via the S-B equation) into temperatures (or the other way around, the temps are translated into thermal emission fluxes).

            We thus can’t – and we don’t – expect two different parameters like this to respond equivalently in all circumstances, to all processes and events taking place within the Earth system. IOW, we can’t concentrate on the noise. On ENSO events. On volcanic eruptions. We have to concentrate on extended stretches of relatively neutral conditions spread out over the entire time period.

            What we’re looking at is MEAN LEVELS, not ENSO amplitudes up and down. We want to see whether the mean levels of the two different datasets in question follow each other over multidecadal timespans or not. And they do. They absolutely do.

            There is NO gradual divergence here, Nate:
            https://okulaer.files.wordpress.com/2018/05/uahv6-gl-tlt-vs-ceres-ebaf-ed4-gl-olr-1.png
            https://okulaer.files.wordpress.com/2018/05/uah-tlt-vs-erbsceres-olr-60-602-b.png
            https://okulaer.files.wordpress.com/2018/05/tlt-vs-olr-trop-erbsceres2-b.png

            If you somehow manage to ‘see’ gradual divergence here, it is only because you WANT to.

            You need to stop acting like an obstinate child that can’t have its way. You’re in full denial mode. Cognitive dissonance.

          • Kristian says:

            Nate says, May 2, 2018 at 5:28 AM:

            ‘Look past the noise’ = apply confirmation bias.

            No. It’s this:
            https://okulaer.files.wordpress.com/2018/05/uah-tlt-vs-erbsceres-olr-60-602-b.png
            https://okulaer.files.wordpress.com/2018/05/tlt-vs-olr-trop-erbsceres2-b.png

            Managing to see a gradual divergence over this 32-33 year period is what would require a serious case of confirmation bias, Nate.

          • Nate says:

            Thiis 33 y global plot that you are so fond of is suspect for several reasons

            1. You start with your premise So could we possibly merge our two OLR datasets (ERBS & CERES) by simply letting them track Ttropo (as represented by UAHv6 TLT) all the way from 1985 to 2017?

            Lets try it.

            Then all adjustments you make after that turn out to make this occur. You mention trying to avoid confirmation bias, which is admirable, but it seems clear that you have not avoided it.

            2. I may have missed it, but I dont see in the published literature, the same offset you give to the post 2000 data, in order to try to match it up with pre 2000 data. I havent seen any plots like yours showing global OLR from 1985-2016.

            3. In the literature, the emphasis is that the data revisions continue to produce significant offsets from previous versions. Ie these offsets are not well pinned down. That is why the CERES experts are not deriving strong conclusions about long-term climate-related trends in the data as I think you are.

            4. The offset you give to the post 2000 data adds ~ 1W/m^2 to OLR for the entire post 2000 period relative to the 1990s. This is extremely unlikely to be correct. This is large enough that it should produce a significant NET loss of OHC for 16 y. While we know that during this period, the there has been a a NET gain of 0.6W/m^2 in OHC.

            5. There is no such post 2000 offset shown in Loeb 2016. The OLR anomaly hovers around 0.

          • Nate says:

            “” missing in #1. Try again.

            1. You start with your premise K:”So could we possibly merge our two OLR datasets (ERBS & CERES) by simply letting them track Ttropo (as represented by UAHv6 TLT) all the way from 1985 to 2017?

            Lets try it.”

          • Nate says:

            Kristian,

            “IOW, we cant concentrate on the noise. On ENSO events. On volcanic eruptions.”

            Yes that is exactly when you need to use fitting to a linear trend, when there is noise, and your eyechrometer (Ha!) cannot see past the noise.

            This whole argument that eyes are better at detecting a long-term trend in noisy data then fitting is quite ridiculous.

            If only YOU are able to discern something in the data, and others cannot, then that is the essence of self-deception.

          • David Appell says:

            Kristian wrote:
            Theres a divergence in the linear trend lines, Nate. Thats a different thing altogether. Theres no divergence in the actual data.

            Funny.

          • Kristian says:

            Nate says, May 2, 2018 at 10:43 AM:

            This whole argument that eyes are better at detecting a long-term trend in noisy data then fitting is quite ridiculous.

            If only YOU are able to discern something in the data, and others cannot, then that is the essence of self-deception.

            Stop fooling around, Nate, and start LOOKING AT THE DATA!

            Where exactly do you SEE the gradual divergence between these two datasets?
            https://okulaer.files.wordpress.com/2018/05/uahv6-gl-tlt-vs-ceres-ebaf-ed4-gl-olr-1.png
            https://okulaer.files.wordpress.com/2018/05/tlt-vs-olr-trop-erbsceres2-b.png
            https://okulaer.files.wordpress.com/2018/05/uah-tlt-vs-erbsceres-olr-60-602-b.png

            You SEE how they’re tightly connected all the way from the mid 80s to the mid 2010s. So the ONLY reason you could possibly have to demand I draw some linear trend lines across the data, even as you SEE how the two curves follow each other to a tee (outside the ENSO and volcano noise) right there in front of you, is a complete unwillingness to ACCEPT what the data itself is in fact telling you.

          • David Appell says:

            Kristian won’t share his data or calculate trends because he’s afraid there IS a divergence, and then he would have to throw out his claim.

        • barry says:

          You asked why linear trends should be applied after Svante requested that.

          It is to test for a gradual divergence. It looks like there is one.

          So a comparison of linear trends is a fair first step to testing for that.

          It’s also a way for a rigorous skeptic like yourself to check if you are self-deceived about there being no gradual divergence.

          What tests have you run on the data to come to that conclusion? Surely not just the eyecrometer?

          • Kristian says:

            barry says, May 2, 2018 at 7:51 AM:

            You asked why linear trends should be applied after Svante requested that.

            It is to test for a gradual divergence. It looks like there is one.

            Again, where and how does it look like there is one, barry? Where do you ‘see’ the gradual divergence?

            https://okulaer.files.wordpress.com/2018/05/uahv6-gl-tlt-vs-ceres-ebaf-ed4-gl-olr-1.png
            https://okulaer.files.wordpress.com/2018/05/uah-tlt-vs-erbsceres-olr-60-602-b.png
            https://okulaer.files.wordpress.com/2018/05/tlt-vs-olr-trop-erbsceres2-b.png

            It’s also a way for a rigorous skeptic like yourself to check if you are self-deceived about there being no gradual divergence.

            The deception would rather lie in applying a linear trend line to a set of data that is readily observable, that is there right in front of you, having the linear trend line showing divergence when the data itself shows no such thing.

            THAT’S when you’re fooling yourself, barry.

            You need to know HOW to look at the data. You need to know what to look for. You need to understand the data. The processes behind. And you need to see past the noise. Applying a linear trend line would allow the noise determine the outcome.

            What tests have you run on the data to come to that conclusion?

            Why are you people so stuck on having to use statistical methods to find out what the data right in front of you actually says!?

            I know why? Because you can’t accept what the data itself is telling you. So you feel a natural urge to do ‘something’ about it. To manipulate the data. Smooth it. Massage it.

            Somehow force it to comply with YOUR preconceived idea of what they SHOULD say.

            There just HAS TO be an “enhanced GHE” at work causing all this ‘global warming’, isn’t that right, barry?

          • Kristian says:

            barry says, May 2, 2018 at 7:51 AM:

            You asked why linear trends should be applied after Svante requested that.

            It is to test for a gradual divergence. It looks like there is one.

            Again, where and how does it look like there is one, barry? Where exactly do you ‘see’ this gradual divergence of yours?

            https://okulaer.files.wordpress.com/2018/05/uahv6-gl-tlt-vs-ceres-ebaf-ed4-gl-olr-1.png
            https://okulaer.files.wordpress.com/2018/05/uah-tlt-vs-erbsceres-olr-60-602-b.png
            https://okulaer.files.wordpress.com/2018/05/tlt-vs-olr-trop-erbsceres2-b.png

            It’s also a way for a rigorous skeptic like yourself to check if you are self-deceived about there being no gradual divergence.

            The deception would rather lie in applying a linear trend line to a set of data that is readily observable, that is there right in front of you, having the linear trend line showing divergence when the data itself shows no such thing.

            THAT’S when you’re fooling yourself, barry.

            You need to know HOW to look at the data. You need to know what to look for. You need to understand the data. The processes behind. And you need to see past the noise. Applying a linear trend line would allow the noise determine the outcome.

            What tests have you run on the data to come to that conclusion?

            Why are you people so stuck on having to use statistical methods to find out what the data right in front of you actually says!?

            I know why? Because you can’t accept what the data itself is telling you. So you feel a natural urge to do ‘something’ about it. Manipulate the data. Smooth it. Massage it.

            Somehow force it to comply with YOUR preconceived idea of what they SHOULD say.

            There just HAS TO be an “enhanced GHE” at work causing all this ‘global warming’, isn’t that right, barry?

          • Svante says:

            The old “eye ball 1.0” argument. Seriously?
            Step changes and pauses next?

          • Nate says:

            “I know why? Because you cant accept what the data itself is telling you. So you feel a natural urge to do something about it. Manipulate the data. Smooth it. Massage it.

            Somehow force it to comply with YOUR preconceived idea of what they SHOULD say.”

            Perfect description of what you appear to have done to get your 32 y graph to tell you what you wanted.

            http://www.drroyspencer.com/2018/05/uah-global-temperature-update-for-april-2018-0-21-deg-c/#comment-300166

          • barry says:

            “Why are you people so stuck on having to use statistical methods to find out what the data right in front of you actually says!?”

            This is hilarious.

            Your “testing” amounts to circling portions of the data that correlate at various increments.

            What Svante, and now I, are asking for is a linear trend….

            as a FIRST test of the data to see if there is not a “gradual divergence” as YOU put it.

            The lines will, of course, not be parallel, but that doesn’t mean an actual divergence. Next step is to assess the relative uncertainty envelopes.

            And that’s just the beginning of testing. David suggested a scatterplot, which seems like another reasonable step to test the correlation.

            What’s hilarious is that YOU are the one making all the bold claims using your eyecrometer (the primary way to deceive yourself), and Svante and I (and others) are being purely skeptical.

            We’re not saying there definitely is a divergence, we’re questioning it – as well as your methods for making your claims.

            And you accuse us – wrongly – of having false conclusions when we have no conclusions, while you are full of absolute surety.

            I’m surprised you can’t see this pattern clearly, as you’re obviously not completely stupid.

          • barry says:

            Of course, scaling one data set is a degree of freedom that allows plenty of wiggle matching. That’s been pointed out above, yet you exhibit no natural skepticism on this yourself. Your absolutism engenders no trust in your approach.

          • Ball4 says:

            “Why are you people so stuck on having to use statistical methods to find out what the data right in front of you actually says!?”

            You people? Ross Perot got in big trouble with that phrase. History repeats.

            Also, the answer is because statistics is very useful to show the level of confidence in history repeating. For those that have read Loeb 2018, the paper shows 95% confidence that Kristian’s Mark 1 eyeball is right about global mean TOA OLR flux trend during the period March 2000 to September 2016 all-sky observed by CERES Team.

            Statistics also tells us with an equal 95% confidence that Kristian’s Mark 1 eyeball is wrong.

            Because “the absolute accuracy requirement necessary to quantify Earth’s energy imbalance (EEI) is daunting. The EEI is a small residual of TOA flux terms on the order of 340 (W/m^2). EEI ranges between 0.5 and 1 (W/m^2) (von Schuckmann et al. 2016), roughly 0.15% of the total incoming and outgoing radiation at the TOA. Given that the absolute uncertainty in solar irradiance alone is 0.13 (W/m^2)…”

          • Gordon Robertson says:

            svante…”The old eye ball 1.0 argument. Seriously?
            Step changes and pauses next?”

            What is wrong with eyeballing data to see where you are at? The reason you cannot see the step change at 2002 on the UAH graph is that you refuse to look at it. You have CO2 warming on the brain and it blinds you to other possibilities.

            Before you plot a trend line through number crunching you should look at your data to see if there is an apparent trend. If there is an apparent trend and your calculations produce something weird, you know there is something wrong. Eyeballing is a great backup.

            Had I been asked to plot a trend through plotted UAH data, with the red running average curve intact, the first thing I would have noted is a general trend in the negative anomaly region of the red curve. I would have wondered why 17 years of data was generally below the baseline. That was explained by UAH as due to volcanic aerosol cooling.

            Then the obvious flat trend from 2002 – 2015 would have stood out like a sore thumb. Anyone trained in looking at graphs would have seen that immediately and wondered why. With a little more experience you’d have noticed the narrow EN peak of 98 was followed by a broader negatively peaked anomaly and realized it would likely average out pretty low.

            The cosine curve from 2008 to 2011 is a dead give away for a flat trend.

            Had I been commissioned to apply an overall trend I would have advised my client as to the two contexts that were not covered by the number crunched trend.

          • Svante says:

            I know Gordon, but I really didn’t think Kristian would fall to this level.

            I thought he had an interesting science based argument.

          • Kristian says:

            Svante says, May 2, 2018 at 12:21 PM:

            The old “eye ball 1.0” argument. Seriously?
            Step changes and pauses next?

            LOL!

            “There are three kinds of lies: lies, damned lies, and statistics.”

            We all know why you CO2 warmists prefer “statistics” over “data”.

            Because statistics will always provide you with the means of forcing the data into compliance with your own dogma.

            Just looking at the data, however, won’t give you that leverage.

            The data tells its OWN story. You don’t LIKE that story, so you apply statistics to the data to make it conform to YOUR story. Simples.

            This is obviously why you’re SOOO in love with that ‘data smoothing’ and those ‘linear trend lines’. They let you ignore everything that happens along the way, so that you can rather claim a ‘slowly increasing long-term “radiative forcing”‘ as the driver of change.

            Pretty basic stuff …

          • Kristian says:

            barry says, May 2, 2018 at 4:33 PM:

            “Why are you people so stuck on having to use statistical methods to find out what the data right in front of you actually says!?”

            This is hilarious.

            No. It’s just sad.

            A linear trend line won’t tell you whether the datasets diverge or not. A linear trend line will FOOL you into THINKING that the datasets diverge. When you have the DATA itself telling you otherwise. The first (eye-ball) test clearly tells you the datasets DON’T gradually and systematically diverge. There is ENSO and volcano noise, yes. So look beyond it. And focus on the MEAN LEVELS, the relatively neutral stretches in between. The two curves ALWAYS link back up. That’s not ‘gradual divergence’, barry.

            Again, for the third time: WHERE DO YOU SEE THE GRADUAL DIVERGENCE THAT YOU SO EAGERLY WANT TO ‘TEST’?

            https://okulaer.files.wordpress.com/2018/05/uahv6-gl-tlt-vs-ceres-ebaf-ed4-gl-olr-1.png

            https://okulaer.files.wordpress.com/2018/05/tlt-vs-olr-trop-erbsceres2-b.png

            https://okulaer.files.wordpress.com/2018/05/uah-tlt-vs-erbsceres-olr-60-602-b.png

            You need to point the ‘gradual divergence’ out first, so as to justify an attempt at quantifying it. Thus far, all you’ve done is make an assertion that it SEEMS to gradually diverge. Ok. How? Where exactly does it SEEM to?

          • David Appell says:

            Kristian says:
            A linear trend line wont tell you whether the datasets diverge or not. A linear trend line will FOOL you into THINKING that the datasets diverge. When you have the DATA itself telling you otherwise. The first (eye-ball) test….

            You’re willing to draw trend lines by eye, but not by any rigorous means. Says alot.

            How about a link to the OLR data? Then I can calculate the trend lines for myself.

          • David Appell says:

            Gordon Robertson says:
            What is wrong with eyeballing data to see where you are at?

            What’s wrong is it isn’t replicable.

            Science is about replication. Given the same data, everyone should come to the same conclusion.

            But “eyeballing” is subjective and subject to bias. It’s not science.

            Calculating trends is much more objective. That’s why statistics were invented, so remove the subjectivity and bias from scientific conclusions.

          • David Appell says:

            Kristian says:
            Again, for the third time: WHERE DO YOU SEE THE GRADUAL DIVERGENCE THAT YOU SO EAGERLY WANT TO TEST?

            Some people see it by eyeballing.

            Kristian, it looks suspicious that you don’t want to test for it,
            or make your data available.

            Science is about replication.

          • Svante says:

            Kristian says:

            “The data tells its OWN story. You dont LIKE that story, so you apply statistics to the data to make it conform to YOUR story.”

            You might be the most knowledgeable of all the AGW skeptics here, but how can you be so ignorant about statistics?

            Statistics is a branch of mathematics, where everything has a proof, OK?

            I don’t even think it’s fair to compare those measurements, they don’t have the same units for a start, TLT should be ^4. But since you did compare them why not follow through and prove it statistically, it might be like you say.

          • Nate says:

            the trend for the OLR 3/2000-9/2016 is from this paper
            https://journals.ametsoc.org/doi/full/10.1175/JCLI-D-17-0208.1

            Table 7, All sky, LW, Ed 4.0

            is 0.19 +- 0.21 W/m^2/decade.

            To compare to a temperature trend, divide OLR by 4 (from SB law).

            So 0.05 +- 0.05 C/decade

            Compare to various temperature trends for the same 3/2000-9/2016, use Kevin Cowtan’s site:

            UAH6 0.095 +- 0.2

            RSS4 0.164 +- 0.21

            HAD*crt 0.164+-0.13

            Berkeley 0.18 +- 0.13

            GI*SS 0.185 +- 0.14

          • Ball4 says:

            Nate, thanks for that look up. Interesting. Think you mean root 4 for S-B not divide.

          • Nate says:

            Divide OLR change by 4 to estimate temp change, is correct from SB law for a SMALL % change in temperature.

            IE suppose temp = 1 and changes by 1% to 1.01

            what does OLR ~ T^4 do?

            1^4 =1 1.01^4 ~ 1.04

            So a 1% change in temp gives a 4% change in OLR.

            Now T (trop) is around 250 K OLR is around 240 W/m2

            a 1% change in T =2.5K gives a 4% change in OLR = 9.6W/m^2

          • Nate says:

            Kristian,

            Re: stitching together different TOA flux data sets. Here is a paper that tries to do that for 1985-2012. They use a different approach than you, and get a different result.

            https://tinyurl.com/y8vk795j

            It makes clear that drawing conclusions about trends in the long records should be done with caution.

    • David Appell says:

      Let’s see a plot of the monthly difference between the two anomalies.

  8. What does the column AUST stand for? Thanks.

  9. Rob Mitchell says:

    My guess is Australia.

  10. This is the transitional year and looking forward I do not see temperatures rising from here at best neutral but likely down.

    I still say by the summer of 2018 global temperatures will be near a 0 deviation according to Dr. Spencer’s satellite data ,and in year 2019 at or below 1981-2010 averages.

    Which is still on the high side. We need to get to minus .20c or greater below the 1981-2010 averages.

    • Timmy S says:

      Will you finally give up this argument if the average goes back up in the next few months?

      Every transition from La Nina to El Nino in the record is associated with temperature increase (except when there was a major volcanic eruption involved). If we do transition to El Nino (which is not yet certain), your claim will be highly unlikely. Please promise us now that you will admit you are wrong.

      • On the other hand I think AGW side should admit they are wrong since the temperatures fail to fall unless a full blown El NINO is present.

        • correction fail to rise

          • Krakatoa says:

            Why don’t you answer him? What would you say if temperatures stay above .2 C during summer 2018?

          • barry says:

            Sal has previously indicated he would be obliged to strongly reconsider his views if (NH) summertime temps remain above the zero line.

        • Snape says:

          Sal

          Temps fall and “fail to fall” on a monthly basis, regardless of ENSO.

          As Timmy S pointed out, though, there will likely be a warming trend in the coming months, and an el nino is not expected anytime soon.

        • David Appell says:

          Salvatore Del Prete says:
          On the other hand I think AGW side should admit they are wrong since the temperatures fail to fall unless a full blown El NINO is present.
          correction fail to rise

          That’s not true.

          El Nino seasons are getting warmer, La Nina seasons are getting warmer, and neutral seasons are getting warmer.

          This La Nina season (July2017-June2018) is, so far, the warmest La Nina in UAH’s records.

          The last El Nino (July2015-June2016) was the warmest El Nino system, and the last neutral season (July2014-Jun2015) was the warmest neutral season.

    • TheFinalNail says:

      salvatore del prete

      “I still say by the summer of 2018 global temperatures will be near a 0 deviation according to Dr. Spencers satellite data…”

      I would have guessed that UAH should have bottomed out this month (April), if the best fit ENSO/UAH correlation was anything to go by.

      Given this unexpectedly high April value, I would guess that UAH will remain around the mid-0.2s for JJA 2018. Of course, I may be completely wrong.

      TFN

      • I think the down trend has just started.

        If temperatures stay say +.20 c or higher over the next several months that would not be good for my prediction at all.

        • Dan Pangburn says:

          UAH temperatures for the last 4 months have been below the trend line which is now at 0.33.

          • La Pangolina says:

            What do you understand under your trend line, Mr Pangburn?

            The linear trend estimate for UAH is 0.13 C / decade.

          • Dan Pangburn says:

            LaP,, No, 0.13 per decade is the SLOPE of the liner trend line. The trend is the linear regression through the anomaly data. 0.33 is the anomaly of the trend line at present. The values for the last 4 months are provided in the table above.

          • barry says:

            I get the END of the slope hitting 0.29 on OLS analysis.

            If the last few months being beneath the value of the last point on the trend line is in response to Sal’s comment “the down trend has just started,” it’s pretty nonsensical. A few months will tell us nothing at all, and anomalies above and below the trend line will occur even if the globe warms by 5C in the next 10 years.

            That would be quite a lot of hot air.

          • David Appell says:

            A certain number of points (appx 50%, but depends) are always going to be below the trend line.

            That’s what a trend line is.

  11. Why is the selected range for the 30-year average 81-2010? I would expect it to be the most recent 30 years or 88-2017.

    • jimc says:

      I think it’s because you would then have an ever shifting reference.

      • yes, it’s so other dataset producers and analyzers can make easy comparisons. And 30 years is a tradiation length of time for averaging. But the averaging period won’t matter for trends.

        • Svante says:

          “The 19812010 Climate Normals are NCEI’s latest three-decade averages of climatological variables”.

          https://tinyurl.com/m4sldpe

        • swampgator says:

          Thank you Roy for all of your excellent work. I do have a question: You state that the “averaging period wont matter for trends”
          This I understand, but it will matter for absolute month to month anomaly values, correct?
          In other works in my limited understanding if we chose 1925-1955 as the averaging period the monthly anomalies reported on this blog might be flat or even negative?
          And then the month to month trend of -0.2 or -0.32 or whatever would still remain as an overall trend?

          • barry says:

            swampgator,

            Yes, wherever you put the baseline, the trend will remain exactly the same. If the trend is positive at 0.1 C/decade, it remains positive at 0.1 C/decade whether the first year anomaly in the trend is 0.5C or -100C. The increments remains the same regardless of the absolute difference.

            If you chose 1925-55 as your baseline (difficult, as UAH satellite temps only go back to 1979), anomalies presently would be higher than reported.

            It was cooler back then, so the baseline would be lower than the 1981-2010 average. The recent anomalies reported on this blog would be higher with a baseline set further in the past.

            Here’s a visual for you:

            http://www.woodfortrees.org/plot/gistemp/from:1920/mean:13/offset:-0.43/plot/gistemp/from:1920/mean:12

            This is GISTEMP data set with the baseline at UAH (1980-2010) and also with the baseline as standard for GISTEMP (1951-1980). You can see which is which in the tables. (I’m slightly colour blind so I have trouble telling you which colour to look at).

            Because it’s warmer more recently, a baseline set in the last 30 or 40 years will put the baseline higher. Warm anomalies will be cooler in this case compared to what they would be if the baseline was set further in the past.

          • swampgator says:

            Hey thanks so much Barry,

            Are those temps from your link adjusted or raw data? The link suggests “raw data form the charity tip jar”
            I’m unsure if this is a validated data source.

          • La Pangolina says:

            swampgator says:
            May 1, 2018 at 5:21 PM

            In other works in my limited understanding if we chose 1925-1955 as the averaging period the monthly anomalies reported on this blog might be flat or even negative?

            swampgator, you can’t choose as baseline an averaging period outside of the period you have measured. That makes no sense, as there are no absolute values you could construct your averages out of.

            To barry’s comment I add a WFT graph containing in addition UAH6.0’s time series:

            http://www.woodfortrees.org/plot/gistemp/from:1920/mean:13/offset:-0.43/plot/gistemp/from:1920/mean:12/plot/uah6/from:1979/mean:12

            So you can see the effect of adjusting the two anomaly sets to the same baseline: the ‘0.43’ offset in barry’s example is exactly the average of GISTEMP’s data for the period 1981-2010.

            P.S. Do not be disturbed by the ignorant and unscientific blah blah of commentator Robertson, who thinks this is a manipulation. He does not understand anything about this topic.

          • La Pangolina says:

            There is a little mistake in barry’s WFT example. 100% correct would be:

            http://www.woodfortrees.org/plot/gistemp/from:1920/mean:12/offset:-0.43/plot/gistemp/from:1920/mean:12/plot/uah6/from:1979/mean:12

            All time series should have the same running mean, of 12 months here.

          • barry says:

            swampgator,

            “Are those temps from your link adjusted or raw data?”

            It’s NASA GISS global surface data, adjusted, interpolated, the whole shebang.

            For the point being made – about baselines – that doesn’t matter one little bit.

            It’s worth knowing that all the global temp data sets, including the UAH data set run by Dr Spencer here, include ‘adjustments’ of various kinds.

          • Bindidon says:

            swampgator says:
            May 1, 2018 at 6:37 PM

            Are those temps from your link adjusted or raw data?

            Of course it is not raw data. WFT’s engineer Paul Clark means with ‘raw’ data the source he uses before it is changed by his own users, e.g. by applying an offset, by scaling, etc.

            GISTEMP’s raw data for land is among other sources for example what GHCN or SCAR (Antarctica) stations provide.

            Here is a chart showing GHCN unadjusted, raw data together with the resulting GISTEMP data:

            http://4gp.me/bbtc/1525281428115.jpg

          • barry says:

            Is that showing GISS land temps having a lower trend than GHCN raw, Bin?

          • Bindidon says:

            Of course it is, barry.

            But above all it shows the result of homogenisation: GISS’ standard deviations are way way smaller than GHCN’s and therefore produce a more reliable trend information.

    • La Pangolina says:

      On the web site

      https://climate.copernicus.eu/news-and-media/press-room/press-releases/2017-extends-period-exceptionally-warm-years-first-complete

      we can read this:

      19812010 is the latest 30-year reference period defined by the WMO for calculating climatological averages. It is the first such period for which satellite observations of key variables including sea-surface temperature and sea-ice cover are available to support globally complete meteorological reanalyses such as ERA-Interim.

  12. Ice Age 2050 says:

    Global temperatures will not rise. We are in what is called a Grand Solar Minimum. Temperatures should be back at baseline average by 2019. Global warming and cooling are NATURAL

    • Krakatoa says:

      Same old story. Cooling is just around the corner. We have been hearing that for years now.

      • Gordon Robertson says:

        krakatoa…”Same old story. Cooling is just around the corner. We have been hearing that for years now”.

        I was experiencing it here in North America last winter and it’s effects are still lingering.

        • PhilJ says:

          Indeed,
          May is starting out like April… Damn cold…. Coldest spring in 50 years here in the center of the continent…

          If the sun stays dormant, next winter will be brutal….

    • Exactly Ice age 2050. They believe in AGW theory.

      With the weakening of solar/geo magnetic fields happening in tandem I do not see global temperatures on the rise.

      And an increase in major volcanic activity is one of the by products of weakening magnetic fields that is part of the equation when it comes to my forecast of lower global temperatures as I have said many times before.

      So if that happens I will be correct and ne can not say you correct because of a major volcanic eruption. I called for that.

      • Mike O says:

        How do weakening magnetic fields cause an increase in major volcanic activity?

        • https://www.iceagenow.info/author-interview-with-ben-davidson-2/

          This video sheds light on where I am coming from.

          The connection between an increase in only major explosive volcanic activity (only explosive volcanic activity ) is when galactic cosmic rays increase to a sufficient level the amount of muons a by product of cosmic rays that penetrate the earth’s surface increases to amounts that excite the magma chambers of calderas and causes the increase in explosive volcanic activity.

          I will send something else on magnetic fields versus ice ages

          • Svante says:

            “Felix is not affiliated with any university, scientific establishment, or corporation, and therein lies his strength. Untainted by institutional bias or conventional wisdom this architect turned author brings fresh insight to the study of the ice ages.”

            https://tinyurl.com/yde6gvpq

          • Gordon Robertson says:

            svante…”this architect turned author brings fresh insight to the study of the ice ages”

            As an architect, he’s be right at home as a climate modeler.

  13. My last sentence should have been: know one can say I am not correct because it was the major volcanic eruption which caused the cooling.

  14. Snape says:

    Dr. Spencer, I wonder if you could comment on this idea?:

    Measure the OLR emitted from a white t-shirt a person is wearing. Then have the person put on another layer. OLR should be less. Now wait until he/she has reached a steady (higher) temperature and measure the OLR again. It should, in theory, be at the same rate it was initially, correct?

    If so, then as expected a reduction in OLR (I’m ignoring conduction and convection to keep things simple) caused the person to get warmer. Also as expected the reduction in OLR was NEVER OBSERVED.

    Similarly, if we look at the atmosphere I would expect an increase in backradiation to cause a decrease in OLR at the TOA. I would not, however, expect that decrease to ever be measurable, as there is no discrete event from which to compare a starting and end value.

    • yes, I think it’s a valid analogy. It is well known that if the Earth warms due to a reduction in OLR (in the broadband sense) from increasing CO2, then the resulting warming causes OLR to go back up again to restore energy balance. So, one cannot observed a decrease in OLR from increasing greenhouse gases partly because warming raises the OLR again, but also because of the unknown LW feedbacks involved. The only way one would get decreasing OLR as CO2 increases is if virtually ALL of the extra energy was going into the deep ocean, without hardly any warming of the surface and atmosphere.

      • Kristian says:

        Roy W. Spencer, Ph. D. says, May 1, 2018 at 11:57 AM:

        It is well known that if the Earth warms due to a reduction in OLR (in the broadband sense) from increasing CO2, then the resulting warming causes OLR to go back up again to restore energy balance. So, one cannot observed a decrease in OLR from increasing greenhouse gases partly because warming raises the OLR again, but also because of the unknown LW feedbacks involved. The only way one would get decreasing OLR as CO2 increases is if virtually ALL of the extra energy was going into the deep ocean, without hardly any warming of the surface and atmosphere.

        Funny. Because this ‘well-known fact’ is apparently NOT ‘known’ by the models, and thus by “Mainstream Climate Science” (MCS) itself:
        https://okulaer.files.wordpress.com/2018/05/cmip5-mean-olr.png

        According to the CMIP5 model mean (RCP4.5), the Earth’s average thermal emission flux to space (the global all-sky OLR at the ToA) is about 0.75 W/m^2 LESS today than it was between 1860 and 1880, even though the world, according to the official global temperature series, is close to 1 K WARMER today than back then.

        A quote from Donohoe et al., 2014, explicitly describing the way MCS picture the origin of today’s positive radiative imbalance at the global ToA:

        “(…) given a present GHG forcing of about 2.8 W m-2, the increase in global surface temperature of about 0.85 K above preindustrial temperatures, and the observational estimate of λ_LW, Eq. 2 [-OLR= F_LW + λ_LW T_S] suggests an anomalous OLR of ≈ -0.8 W m-2, implying that OLR is still contributing to global energy accumulation. This apparent discrepancy can be attributed to the effects of tropospheric aerosols, which are acting to reduce global warming (and thus, OLR) through a negative SW radiative forcing on the order of 1 W m-2 (although with large uncertainty). Eq. 2 [ASR= F_SW + λ_SW T_S] and our observational estimate of λ_SW then suggest an anomalous ASR of ≈ -0.2 W m-2 in the current climate. Altogether, these estimates imply that the current global energy accumulation is still dominated by decreased OLR. However, they also suggest that a transition to a regime of global energy accumulation dominated by enhanced ASR could occur with only 0.5 K global warming above present – by the middle of the 21st century if warming trends continue as projected.”

        http://www.pnas.org/content/pnas/111/47/16700.full.pdf

        So MCS thoroughly believe – and consistently go by the story – that today’s positive radiative imbalance at the global ToA of ~ +0.6 W/m^2 is the result (to 133% !) of a reduction in OLR (Earth’s heat LOSS) and only countered somewhat (-33%) by a concomitant reduction in ASR (Earth’s heat GAIN): ASR – OLR = net; -0.2 – (-0.8) = +0.6 W/m^2.

        Has anyone actually OBSERVED this reduction? Of course not. Who needs that? It’s all in the models, after all. So it must be true. Right?

      • Bart says:

        “…then the resulting warming causes OLR to go back up again to restore energy balance.”

        That is a bit of an overstatement. The OLR will go up because the entire emissions curve will go up. But, equilibrium requires only that the entire integrated spectrum goes back up to where it was before. Relative to that entire spectrum, OLR as a percentage of the total should go down.

        • David Appell says:

          The integrated spectrum (= SB Law = emissivity*sigma*T^4) will show a higher temperature.

          • Bart says:

            The integrated spectrum will show the same result, as it must for balance. It’s the emissivity that putatively changes, presumably resulting in a higher T.

    • Snape says:

      Imagine a dam where inflow equals outflow and the reservoir’s water level is steady. If you raise the dam a few feet, outflow will be reduced (like OLR as a result of added GHG’s) and water the level will rise as a consequence. Eventually the water will have risen high enough so that inflow again equals outflow…… a new equilibrium is reached. The reduction in outflow would have been EASY TO MEASURE, because the cause (higher dam) was a discrete event.

      Now, instead, raise the dam’s height in tiny but continuous increments. The water level would also rise and reach new equalibriums in tiny but continuous increments.

      If you now measured rate of outflow from one hour to the next, one day to the next, you would see little or no change…….water level would be continuously rising as a result of reduced outflow, but the reduction has now become VERY DIFFICULT OR IMPOSSIBLE TO MEASURE.

      • Snape says:

        Dr. Spencer

        Thanks for your input. (I must have been writing about the dam while you had already posted it.)

      • gbaikie says:

        The ocean is a very, very large dammed lake.
        What happens when 3.5 C ocean warms to 4 C?
        Little effect upon tropical ocean, large effect ocean surface temperature towards the poles, particularly the winter ocean surface temperature.
        Tropical water surface is about 26 C, the colder water hundreds of meters below surface, getting a hit warmer, will have little effect, but outside of tropics you have a shallower warmer top layer of water, slight warming of the cold water would have greater effect upon winter ocean surface temperature.
        And should cause more rain/snow in winter. And less cold land surface air temperatures in seasons other than Summer time.

        But here it’s been rather cold lately, due to weather.

      • Gordon Robertson says:

        snape…”Imagine a dam where inflow equals outflow and the reservoirs water level is steady”.

        *******

        If you are going to offer thought experiments you should at least ensure they fit the problem. You are presuming inflow of energy from the Sun must be balanced by outflow as IR. In other words, you are stuck in a radiation model.

        There are different ways for gases to expand and contract, changing the temperature as they do. For example, suppose the gases in our atmosphere have reached an equilibrium state with solar energy. Suppose during the day, the gases heat and expand then at night the gases contract.

        You could compare that to a cylinder with a piston, where the vertical force offered by the piston is compressing the gas. Now heat the gas and it will expand, pushing the cylinder up, acting against gravity. Then remove the heat source and allow the gas to slowly contract.

        The same could be said about our atmosphere, that operates against gravity. When the solar energy heats the surface, the heat is transferred directly to all the gases and they expand. At night, under the influence of gravity, the gases will contract. The temperature will change on it’s own, without radiation to space.

        Again, I am presuming a long term equilibrium between solar input and atmospheric expansion/contraction.

        According to Charles Law, which deals with changing volumes and pressures, under a constant pressure, an increasing volume should cause a decrease in temperature. Therefore as solar energy heats the atmosphere via the surface, the expanding atmospheric gases absorb the heat.

        The fly in the ointment here is the pressure, can gravity keep it fairly constant?

        http://chemistry.bd.psu.edu/jircitano/gases.html

        The expansion and contraction affects the temperature. The solar energy is essentially doing work on the gases, causing them to expand. At night, gravity does work on the gases causing them to contract. Therefore heat is absorbed during the day through expansion and normalized during the night by contraction.

        When you deal with gases in a cylinder in a lab you are not all that concerned with heat loss due to radiation. The temperatures will rise and fall without radiative dissipation.

        Theoretically, there’s little need for radiation to space since the work within the gas allows for heat intake for half the day and for dissipation WITHIN THE GAS the rest of the day, all of it taking place in the gas.

        For you alarmists jumping up and down waving your arms, this is simply a theory. I have no proof that it is going on but it’s just as valid as the sci-fi based energy balance offered by Trenberth-Kiele which required a back-radiation from the atmosphere that nearly equals surface radiation.

        • Gordon Robertson says:

          I might add with respect to my claim that radiative loss in a lab during a heat engine experiment is not of concern, the same applies to a heat steam engine, or any engine.

          Normally, one is concerned with leakage in a cylinder that dramatically affects the pressure, or a misfiring spark plug that affects the temperature required to ignite a gas mix. Radiative heat loss is ignored. It’s not important since it does not sap much energy from a system.

          I am wondering if this fetish we have formed with heat transfer to space by radiation is not more of a red herring issue than an actuality.

          Don’t know, just asking. I have demonstrated theoretically that heat induced during the day by solar energy can be absorbed due to expansion then released during contraction WITHIN the gas. As the gas contracts it cools naturally.

          If you had an insulated cylinder in a lab with a reflective lining to prevent radiation, the gas temperature would still change with expansion/contraction inside the cylinder. That is a well-established law.

          • Gordon Robertson says:

            pps. there is nothing in the Ideal Gas Law that deals with radiation. I guess that’s partially why it’s called ideal. Then again, it addresses a relationship between pressure, temperature, volume, and mass. If radiation was that much of an issue, I’m sure it would have been addressed.

            It seems only certain modern climate scientists are concerned with radiation, to the exclusion of the ideal gas law.

          • David Appell says:

            Gordon Robertson says:
            there is nothing in the Ideal Gas Law that deals with radiation. I guess thats partially why its called ideal. Then again, it addresses a relationship between pressure, temperature, volume, and mass. If radiation was that much of an issue, Im sure it would have been addressed.

            Oh boy.

            It’s this simple: in some applications, radiation is important. In others it is not.

            If you’re building a steam engine, you don’t need to worry about radiation, just the properties of a gas. So stick with the ideal gas law.

            If you’re trying to explain atmospheric processes, you DO need to include radiation, so you need more than the ideal gas law. Much more.

            The ideal gas law is strictly classical — the gas particles are treated as billiard balls that don’t interact with one another or anything.

            But in the atmosphere gas molecules aren’t billiard balls, they’re quantum mechanical objects. So it’s vital to include their interaction with radiation – or you can reproduce how the atmosphere behaves.

            “Ideal” means the gas is simple, made up of classical objects, with no size, no interactions. It’s not a judgement about the physics.

            Where do you come up with this stuff??

        • Gordon Robertson says:

          Obviously the following makes no sense, “According to Charles Law, which deals with changing volumes and pressures, under a constant pressure…”

          It should read, “According to Charles’ Law, which deals with changing volumes and temperature, under a constant pressure…”

          The Ideal Gas Law is a combo of laws from Charles, Gay-Lussac, Dalton, and Avogadro. Pretty neat stuff if you ask me and relatively ignored by climate modelers and alarmists who presume everything in the atmosphere is due to radiation.

          • David Appell says:

            Gordon Robertson says:
            The Ideal Gas Law is a combo of laws from Charles, Gay-Lussac, Dalton, and Avogadro. Pretty neat stuff if you ask me and relatively ignored by climate modelers and alarmists who presume everything in the atmosphere is due to radiation.

            Completely false.

            At least read the abstract:

            “Thermal Equilibrium of the Atmosphere with a Given Distribution of Relative Humidity,” Syukuro Manabe and Richard T. Wetherald, Journal of the Atmospheric Sciences, v24 n3 (May 1967) pp 241-259.
            https://www.gfdl.noaa.gov/bibliography/related_files/sm6701.pdf

    • Gordon Robertson says:

      snape…”…Im ignoring conduction and convection to keep things simple…”

      Suppose the conduction/convection you have ignored is the main source of cooling. What then?

      Lindzen seems to imply that, in fact, he has stated that radiation is not the principle means of cooling the surface.

      • Snape says:

        Gordon

        “Theoretically, theres little need for radiation to space since the work within the gas allows for heat intake for half the day and for dissipation WITHIN THE GAS the rest of the day, all of it taking place in the gas.”

        I’ll give you an A for creativity, but with little or no energy radiating to space, you’ve created a situation where the solar flux is entering a closed system.

        You need to consider this:
        https://amp.livescience.com/50881-first-law-thermodynamics.html

  15. Bob Weber says:

    Dr. Roy Spencer, ultimately TSI is driving your temperatures series:

    https://www.dropbox.com/s/5iziahdthwm5yak/UAH%2C%20SST3%2C%20%26%20SORCE%20TSI%202016-2018.JPG?dl=0

    Snape, David Appell, and Kristian: I attempted to respond to you from the other day here and my comments disappeared.

    • Snape says:

      Bob

      Did your comments appear on the blog and then disappear or did they fail to post in the first place?

      • Bob Weber says:

        Fail to post, several times, several ways.

        • the WordPress gods have not been kind to Bob. They are quite fickle about what comments they allow, and never provide an explanation.

          • Gordon Robertson says:

            Roy and Bob…”the WordPress gods have not been kind to Bob. They are quite fickle about what comments they allow, and never provide an explanation”.

            We regular posters have become aware of certain words that WordPress does not like. One of the main culprits is ‘absorp-tion’. It doesn’t seem to like re-frig-er-ation but then there is a g phrase in there as well as the d-c in Had-crut.

            Bob…go over your posts, cutting them into mini posts if necessary and test each one. Looks for the words above and any words with d-c or g-e.

            I’ve found that solves most issues although a few are still puzzling.

          • Kristian says:

            It isn’t really about the word “absorp.tion” itself. It’s the particular consonant cluster “r-p-t” that’s the problem. I found out by happenstance just recently when I wanted to write “excerp.t”, but weren’t allowed to.

          • swampgator says:

            Sounds like peer review!

        • La Pangolina says:

          Bob Weber says:
          May 1, 2018 at 11:56 AM

          Fail to post, several times, several ways.

          Did you really care of avoiding to write
          – any word containing the consecutive letters ‘d’ and ‘c’, like ‘ncd-c’ or Had-CRUT’, written without the ‘-‘ inside separating them;
          – the word ‘absorp-tion’ without the ‘-‘ inside?

          These are the two main origins for comments not getting published here.

    • La Pangolina says:

      Bob Weber says:
      May 1, 2018 at 11:15 AM

      Dr. Roy Spencer, ultimately TSI is driving your temperatures series…

      *

      If you would show us the same graph for the entire satellite era instead of for a couple of years, you would become quite a bit more credible.

  16. PapaJim says:

    On Earth Day, April 22nd, NASA offered the website called “Worldview” where they promise no image is more than three days old. You can select an Arctic view and observe the polar ice sheet change by the day, month or year. The Arctic temperature used here is +1.02 above the norm. That does not show up as a reduction of the polar ice sheet. In fact, you can see that ice sheet extent is greater on April 30th this year than it has been since 2005.

    Additionally, the lower 48 was just -.01 degrees below the norm. Whoever came up with that surely doesn’t live here. Oklahoma is on track to break the record for the latest date for the first tornado. This is due to the cooler than normal weather. There is no need to mention the April blizzard nor the baseball games cancelled because of April snow. Wow!

  17. https://www.iceagenow.info/magnetic_reversal_chart/

    The above is the evidence or data which shows how magnetic reversals or excursions can be tied into the climate of course takng solar activity into much consideration.

    It is not just TSI , but also the speed of the solar wind (ap index), galactic cosmic rays ,and changes in EUV light , combined with what the geo magnetic field is doing that I think changes the climate.

    It changes the climate by first lowering the overall sea surface temperatures which is in response to mostly reductions in UV light and Near UV light wavelengths because those wavelengths penetrate the ocean surface to much greater depths then the other wavelengths.

    Now it also changes the climate by causing a slight reduction in albedo, by first all increasing cloud coverage and snow coverage due to a more meridional atmospheric circulation tied into changes in EUV light , and I think an increase in galactic cosmic rays.

    Here is the catch it is not only the increase in the amounts of galactic cosmic rays but where they are directed (latitude)and that depends on where the geo magnetic poles are located, as well as the strength of the geo magnetic field. Right now it is fading quite rapidly while the N. Magnetic pole is racing toward Siberia.

    In addition weakening magnetic fields may also cause a reduction in albedo due to an increase in explosive volcanic activity. This due to an increase in muons a by product of galactic cosmic rays which excites the calderas of these types of volcanos.

    So what am I looking for going forward? An increase in major explosive volcanic activity, an increase in global cloud coverage/snow coverage and a reduction in the overall sea surface temperatures. This being concurrent with weakening solar/geo magnetic fields.

    This to me is the best explanation against the backdrop in the big climatic picture of Milankovitch Cycles, ocean /land arrangements, the initial state of the climate ( that being how close is the climate to begin with to glacial /inter -glacial conditions when these changes I mentioned take place), consideration of asteroid impacts which throw the whole climatic system into chaos when they randomly occur, the super nova situation in the relative neighborhood of the earth which would greatly influence the amounts of galactic cosmic rays concentration that could enter the earth s atmosphere as magnetic fields weaken.

    This is not a simple one cause one effect explanation but rather a myriad of many factors, and this is why it is so hard to see the correlations when changes are minor.

    • ren says:

      During a geomagnetic storm, solar wind interacts with Earths magnetic field, transferring large amounts of energy into the upper atmosphere in the form of electric currents.

      While some of this energy can fuel auroras, most is transferred into heat in a process called Joule heating, which causes the upper atmosphere to expand.

      Eelco Doornbos from Delft University of Technology explained, Swarm has given us a novel view of how this heat is dispersed in the upper atmosphere.

      The animation shows that when the storm begins, heat enters the auroral zone. In response, the atmospheric gas above the aurora expands and is lifted to higher altitudes. It then falls in waves that cover the entire globe in a matter of hours. This is a truly massive movement of gas in the upper atmosphere.
      https://www.esa.int/spaceinvideos/Videos/2018/04/St._Patrick_s_Day_storm

    • ren says:

      Pole reversals are a natural phenomenon, evidence of which comes from the ocean floor. When new crust is created though volcanic activity, atoms of iron in the molten rock act like compasses, aligning themselves with the magnetic field and retaining their orientation once the rock has solidified.

      These magnetic fingerprints in sediments reveal that over the last 200 million years the poles have reversed, on average, about once every 200 000300 000 years. Reversals are a slow process and do not happen with any regularity. Nevertheless, the last time this happened was about 780 000 years ago, so we are now overdue for a reversal.

      Magnetic field changes
      In June 2014, after just six months collecting data, Swarm confirmed the general trend of the fields weakening, with the most dramatic declines over the Western Hemisphere. But in other areas, such as the southern Indian Ocean, the magnetic field had strengthened since January. The measurements also confirmed the movement of magnetic North towards Siberia. These changes are based on the magnetic signals stemming from Earths core.
      https://www.esa.int/Our_Activities/Observing_the_Earth/Swarm/Our_protective_shield

  18. La Pangolina says:

    For those who think the lower troposphere will soon warm up or cool down: here is a graph to bet:

    http://4gp.me/bbtc/1525211095376.jpg

    The periods after the El Niños in 1997/98 and 2015/16 are compared relative to their respective begin, thus showing how much stronger the 1997/98 event has really been.

  19. Cloudbase says:

    ENSO 3.4 was not 0 last week….it was still -0.25. ENSO 1&2 was -0.1 and a massive area of the SE Pacific has rapidly cooled over the last month…..so more likely that the ENSO zones with go further negative in the near future.
    https://www.tropicaltidbits.com/analysis/ocean/cdas-sflux_ssta_relative_global_1.png

  20. La Pangolina says:

    I picked up Kristian’s CMIP5 [email protected] output:

    https://okulaer.files.wordpress.com/2018/05/cmip5-mean-olr.png

    Amazing to see the volcanic influences in the plot

    – 1883: Krakatau
    – 1902: Mount Pele
    – 1912: Novarupta
    – 1963: Agung
    – 1982: El Chichon
    – 1991: Pinatubo

  21. Dan Pangburn says:

    ES,, Good job on the experiment although those of us who understand heat transfer analysis didnt need it and at least one person here stubbornly keeps the blinders on. The NET energy flow is always from warm to cool in compliance with 2lot. The so-called ghe exists but it is caused essentially all by water vapor.

    Water vapor is IR active AKA a greenhouse gas. Its presence in the atmosphere has made the planet warm enough and the huge effective thermal capacitance of the oceans has kept it steady enough for life as we know it. The WV trend is increasing at about 1.5% per decade. It has increased about 8% since the more rapid increase began in about 1960. The rising WV coincides with rising irrigation. WV has been rising more than twice as fast as expected from the temperature increase of the ground level liquid water (feedback). The five most recent reported months, thru March, 2018, are all below the linear trend.

    Delve deeper into the science with an understanding of thermalization and use of Quantum Mechanics (Hitran does the calculations) and discover that CO2 (or any other noncondensing ghg) does not now, has never had and will never have a significant effect on climate. http://energyredirect3.blogspot.com

    • Mike Flynn says:

      D,

      Until someone can at least provide a useful description of the GHE, good enough to allow someone to propose a testable GHE hypothesis, then claims of being able to predict anything at all relating to the GHE, are based on something which presently cannot even be described.

      There dont seem to be any observed natural phenomena which cannot be explained without the need for an affect which is so obscure it cannot even be described.

      The present occupants of the Earth are capable of living and reproducing from about -15 C to around 120 C, without shielding from the environment. Humans extend this range significantly. The atmosphere doesnt keep the planet warm. However, it does ameliorate extreme sudden diurnal temperature variations. The airless Moon demonstrates temperature extremes due to the increased radiation from the Sun, combined with the freedom of surface energy to flee to space with no intervening atmosphere.

      The Earth has cooled to its present temperature, and continues to do so – slowly but inexorably, as its radiogenic heat sources deplete in accordance with their various half-lives. Its present cooling rate, of somewhere between 1 and 3 millionths of a Kelvin per annum is not something that bothers me.

      No heating effect from any gas. Rather, a diminution of the Suns energy which actually reaches the surface. At night, the surface cools more slowly than the Moon, but still manages to get down to around -90 C in places. During the day, slower heating than the Moon. During the night, slower cooling. To compound comparisons, the molten interior of the Earth is surrounded by a thin crust of solidified rock – about 20 Km depth on average, or a bit less.

      The Moon’s crust much thicker, and the liquid core much smaller, as the surface/volume ratio of the Moon has resulted in faster energy loss compared with the Earth (everything else being considered equal).

      Now, if all these facts can be incorporated into a GHE description, I would be surprised. That there is no description that accords with observed fact, surprises me not,
      obviously.

      Just a few comments to allow the GHE supporters a chance to produce their amazing GHE from its hiding place, and lay me low! Im not quaking in my boots at the prospect.

      Cheers.

      • gbaikie says:

        –Until someone can at least provide a useful description of the GHE, good enough to allow someone to propose a testable GHE hypothesis, then claims of being able to predict anything at all relating to the GHE, are based on something which presently cannot even be described.–

        A planet orbiting a sun, will have a higher average surface temperature if it has an atmosphere, compared to a planet without an atmosphere.

        And different types of gases of atmosphere can add or subtract from this higher average temperature which is caused by having an atmosphere.

        • Mike Flynn says:

          gbaikie,

          Maybe you could describe the GHE, then?

          You could start with “The GHE is a phenomenon . . .” and proceed from there.

          Talk of average temperatures is, of course, pointless. Merely stating something as a fact does not make it so. The Moon demonstrates both higher and lower temperatures than the Earth, having no appreciable atmosphere at all. What is the relevance of an average?

          70% of the Earths surface is covered by water, and most of the rest is covered by soil, sand, vegetation, roads, buildings, and so on. Talk of surface temperatures is nonsensical.

          Measured temperatures on Earth due to the unconcentrated rays of the Sun vary between about 90 C to -90 C. Average?

          In any case, the climatological pseudo science seem to be based on maximum recorded temperatures – “The hottest year EVAH!”. “Record high temperatures.” – and so on.

          Still no adequate GHE description. Assertions that atmosphere makes planets hotter are made fairly pointless in light of the fact that the Earth has cooled over the last four and a half billion years.

          Cheers.

          • Mike Flynn:

            … which can described like follows: Some trace gas molecules like water vapour and CO2 absorb IR radiation at certain wavelengths and transfer this heat by collision to the surrounding other air molecues, thus warming the atmosphere compared to a state without these GHG.

            This is the first step of my explanation. If you agree, we can continue. If not, you have to explain. Or possibly you are using the physics of a different universe.

          • PhilJ says:

            JH,

            The thermalization of terrestrial radiation by so called GHG’s INCREASES the rate of convection, and thus the rate of cooling of the surface…

          • barry says:

            Phil,

            Are you saying that a GHG atmosphere makes the surface cooler than it would be, on average, without any atmosphere at all?

          • PhilJ says:

            Cooler during the day.. Warmer at night

          • Norman says:

            PhilJ

            Do you have support for your statement that GHG increase the rate of convection? I am thinking it may increase the height where convection stops (Tropopause) but I am not sure it will increase the rate.

            Also convection is a small player in the surface cooling of the globe. It is massive in some places but globally it is not a large contributor of cooling.

            https://en.wikipedia.org/wiki/File:The-NASA-Earth%27s-Energy-Budget-Poster-Radiant-Energy-System-satellite-infrared-radiation-fluxes.jpg

            I am not saying you are right or wrong. I would just like to read your source. I see lots of declarations made on this blog without any supporting evidence. I would like to see the source for you statement.

          • PhilJ says:

            Norm,

            “Do you have support for your statement that GHG increase the rate of convection? ”

            Yes, its called thermalization.

            If you increase the energy input of a volume of air it will expand and rise faster… Cooler (sinking )air will thus
            replace it more quickly as well…

            “Also convection is a small player in the surface cooling of the globe. It is massive in some places but globally it is not a large contributor of cooling”

            How do you figure that? At earth surface temps, convection is much more efficient at cooling a surface than radiation…

            If you dont think so then youve probably never used a fan or stood outside on a cold praire day with a 70 km wind blowing in your face

          • Phil and Barry,

            an atmosphere w/out so-called GHG would cause a cooler surface, because every IR radiationwill go out to the space at once.

            But having water on our planet and a temperature above 0C, we always will have water some vapour in the atmosphere.

            CO2 is always available, wheras vater vapour can be 0% or up to 4%.

          • PhilJ says:

            JH,

            “an atmosphere w/out so-called GHG would cause a cooler surface,”

            Is impossible because: chemistry and physics

            So why even think about it…. Using a fantasy atmosphere to draw your conclusions will surely lead to all kinds of errors

          • Second step of the GHG explanation: Nearly all material on the planet is emitting IR radiation.

            Even water vapour and CO2 are radiating IR according to the wavelengths of their temperature – in a random direction. Half goes to the space, half towards the surface in various angles.

            But this doesn’t mean that it is hitting the surface again, but mostly GHG molecules below or above. Because the air gets thinner with height, having less molecules, more radiation will go towards space without hitting a molucule.

            Above 10 km, there is nearly no water vapour. So only CO2 is absorbing and emissing – finally every heat towards space.

            Earth surface is a body which radiates as a nearly blackbody. GHGs are radiating only in certain wavelengths with much lower intensity.

            The difference between both radiations is the net heat transfer. Simple physics known for 150 years.

          • An analogy to the heat transfer of the earth is a room with a hot stove, say 300C surface temp. Opposit there is a cold wall with 10C. Outside it is minus 20C. The cold wall radiates towards the stove as well, reducing the heat loss.

            Without the cold wall it would be much colder.

            Earth radiates with about 15C towards the atmosphere. C02 is radating from TOA towards the surface with let’s say minus 70C. The background radiation of the space is -270C. So the atmosphere is 200 C “hotter” than the space, making it somehow comfortable on our planet.

          • Mike Flynn says:

            JH,

            You haven’t mentioned why this effect doesnt result in temperature increases at night, when it is raining, overcast, or after the Sun reaches its zenith, or why the Earth has cooled for four and a half billion years.

            After you have overcome these hurdles, we can move on to other questions.

            You arent doing too well so far. are you?

            That tends to be a problem with pseudoscience – having to explain why your idea only works sometimes.

            Try again. If your explanation is useful, it doesnt matter whether I agree or not, does it?

            Cheers.

          • Dan Pangburn says:

            Mike,, It appears we have the same perception, that CO2 has no significant effect on climate. Sorry I have not followed your posts enough to understand your reasoning. My perception is based on multiple compelling evidence (click my name); all based on engineering/science and/or science based findings.

            It appears that you reject GHE because you perceive it violates 2lot. It doesnt. The net energy flow is always from warmer to cooler. Unfortunately, several folks who post here apparently lack much engineering/science skill and experience in heat transfer analysis and lots of bogus stuff gets presented.

            Possibly the simplest example of what produces GHE is the common observation that cloudless nights cool faster and farther in the desert where absolute water vapor content is lower than they do where it is humid.

            Another is that the wet lapse rate is less than the dry lapse rate.

          • Mike Flynn,

            all I wrote was simple, basic physics.

            Why has the earth cooled? Because the earth radiates as a blackbody, and the so-called GHGs are radiating only in certain wavelengths, at a lower temperature and therefore with lower intensity than the surface.

            GHGs are reducing the heat loss to a certain amount, but they are also cooling the upper atmosphere by radiating all energy in the atmosphere towards space.

            The earth is just a small disturbance for sun energy travelling towards space.

            Overcast at day: No sunlight is entering.
            Overcast at night: the clouds are also a blackbody an radiating towards the surface with much higher intensity.

            Therefore cloudy nights are warmer than clear nights. You can measure the downwelling radiation wih a handheld IR thermometer.

          • barry says:

            PhilJ,

            I’d say albedo (clouds) and other gases keep the surface from getting warmer during the day than, say, the surface of the moon in full daylight. Clouds alone reduce incoming solar radiation by a significant fraction.

            The question I asked was about averaged temps – the average of temps over the diurnal range. This would give a better idea of how the atmosphere moderates surface temps relative to, say, the energy received directly from the sun.

            The surface of the moon is colder over the averaged diurnal range than the surface of the Earth. Much colder. The combined action of various atmospheric components serve to keep the earth’s surface warmer on average than the moon, which receives much more daytime solar radiation per square meter than does the Earth. It’s the nighttime temps on earth that put it ahead of average temps of the moon. It’s the greenhouse effect at work, slowing the escape of radiation to space at night. On the moon, there is no greenhouse effect to impede outgoing radiation from the surface, and the much hotter daytime surface temps soon dissipate to -160C.

          • PhilJ says:

            Barry,

            ‘I’d say albedo (clouds) and other gases keep the surface from getting warmer during the day..’

            Agreed as to albedo.. Which gasses and how?

            All the models are built on a constant solar input… It is the terrestrial output that we need to look at ….

            All the radiation is thermalized within a few hundred meters… Increasing convevtion and the rate of energy transfer up to the tropopause.

            Entropy rules… The natural system will evolve towards max entropy

        • gbaikie says:

          –Mike Flynn says:
          May 2, 2018 at 1:46 AM
          gbaikie,

          Maybe you could describe the GHE, then?–

          As you might be aware, I think GHE “theory” is pseudo science.
          So for description of that, I refer to belief of the Cargo Cult. Or discuss Groupthink, or mention Marxism and other obvious stuff which is pseudo science in our modern world.

          But as a lukewarmer, I think greenhouse gases could cause a higher average temperature. And I agree that water vapor should be causing the most amount of warming.
          But I don’t think warming effect of the most powerful greenhouse gas (water vapor) nor C02 has been measured.
          Or if it was measured then one could say the amount of warming it causes. The range I believe CO2 warms on Earth is 0 to .5 C
          per doubling, say from 300 ppm to 600 ppm.
          And what is important is such warming effect occurs within two centuries time (The idea of extending it for thousands of years is in my opinion not practical and would make it even less possible to be measurable). I tend to favor idea the effects should be fairly immediate, and should be seen within a decade.

          Now, my opinion, is that the ocean causes warming.
          Ocean surface average temperature is 17 C, land is 10 C, and the warmer ocean surface warms the land surface (land surface would colder than 10 C if not for the warming effects of the warmer ocean surface)

          • gbaikie says:

            I should add that most significant part of ocean in terms warming the rest of the world is the tropical ocean, which has average temperature of about 26 C.

            And practically everyone with an education regarding climate, has agreed (for centuries) that tropical ocean warms the rest of the world.

          • David Appell says:

            gbalkie wrote:
            Now, my opinion, is that the ocean causes warming.

            And why is the ocean warming?

          • gbaikie says:

            “David Appell
            May 2, 2018
            gbalkie wrote:
            Now, my opinion, is that the ocean causes warming.

            And why is the ocean warming?”

            The ocean is warm, the average surface temperature is 17 C. The ocean is cooled by the colder land surface, which has average temperature of 10 C.
            And the land has average temperature 10 C, because it is warmed from the higher ocean surface temperature.

            The Earth would be warmer if the entire surface was ocean, and would be colder if entire surface was land.

            Why ocean is warmer now, is because it is recovering from a cooler period, which is called the Little Ice Age.

          • David Appell says:

            gbalkie wrote:
            But I dont think warming effect of the most powerful greenhouse gas (water vapor) nor C02 has been measured

            Tyndall did it in 1859.

            and

            “First Direct Observation of Carbon Dioxides Increasing Greenhouse Effect at the Earths Surface,” Berkeley Lab, 2/25/15.
            http://newscenter.lbl.gov/2015/02/25/co2-greenhouse-effect-increase/

            “Observational determination of surface radiative forcing by CO2 from 2000 to 2010,” D. R. Feldman et al, Nature 519, 339343 (19 March 2015).
            http://www.nature.com/nature/journal/v519/n7543/full/nature14240.html

          • gbaikie says:

            “Tyndall did it in 1859”

            If Tyndall it in 1859, one would not have news stories claiming it was done in 2015.

          • barry says:

            Tyndall did it in the lab. Those news articles are about observations in the real atmosphere.

            Which you might know if you at least glanced at them before dashing your reply off.

          • gbaikie says:

            I did glance at them, and realized I read them and discussed them years ago.

          • David Appell says:

            Tyndall did it in a lab.

            Feldman+ did it in the field. Lots better instruments now, too.

            A simple, demonstration:

            https://www.youtube.com/watch?v=Ot5n9m4whaw&feature=related

          • David Appell says:

            gbalkie wrote:
            Why ocean is warmer now, is because it is recovering from a cooler period, which is called the Little Ice Age.

            But what’s causing the warming?

            Where is the heat coming from that’s warming the ocean?

          • PhilJ says:

            DA,
            The oceans are warmed by 2 sources.. Solar energy from above and thermal energy from below….

          • gbaikie says:

            Oceans could be warmed by geothermal heat, but I can’t read paper and/or there is not enough data to say by how much.

            It does seem quite possible that volcanic activity in the past could have something to do with hothouse climates.

          • gbaikie says:

            but I cant read
            Meant:
            but I cant say I have read a paper…

          • David Appell says:

            But why is the ocean’s heat content increasing?

            http://tinyurl.com/dbjrlr

          • PhilJ says:

            It isnt.. With the sun now dorment the oceans are cooling …

          • David Appell says:

            No, they’re not cooling, they’ve been warming strongly for decades. Here’s the graphs and data:

            http://tinyurl.com/dbjrlr

          • PhilJ says:

            Lol… Try reading what i said:

            ‘With the sun NOW dorment the oceans are cooling ‘

          • barry says:

            What, since February 6 at 04:14:23 GMT?

            The oceans have warmed in period when the solar cycle was in decline. There’s very little tying solar radiation changes to ocean heat content. The correlation just isn’t there.

            Maybe you should define what ‘NOW’ means. Are you being clairvoyant, or are you basing this on already observed data?

          • PhilJ says:

            Now, means right now, at this moment…

            With the sun dormant , the oceans must be cooling… (Unless of course there is a large increase in geothermal heating … But i think thats unlikely)

          • David Appell says:

            PhilJ:
            gbalkie:

            But what’s been causing ocean to get WARMER for several decades now?

          • PhilJ says:

            High levels of solar activity in the secomd half of the 20th century added a lot of energy to the oceans…

            Unless we return to those levels the oceans will cool..

          • David Appell says:

            gbaikie says:
            Oceans could be warmed by geothermal heat, but I cant read paper and/or there is not enough data to say by how much.

            So you have no evidence for your claim. That’s what I suspected.

            It does seem quite possible that volcanic activity in the past could have something to do with hothouse climates.

            Humans now emit 100-200 times more CO2 than do volcanoes.

          • La Pangolina says:

            PhilJ says:
            May 2, 2018 at 4:55 PM

            With the sun NOW dorment the oceans are cooling

            But… isn’t the Sun getting more and more dormant since quite a long time ago?

            The last top Sun Spot number was in october 1957. That is 60 years ago, and since then SSN is decreasing all the time.

            Should that not have had a cooling influence on the Global Ocean Heat Content, even with some enormous lag?

            I don’t see this influence in a comparison of SSN and OHC between 1950 and 2016:

            http://4gp.me/bbtc/1525384977793.jpg

            NB: over the period shown, SSN varies between 4 and 270, but OHC’s anomalies do between -8.5 and +9.5.

            I thought a fair way to compare them would be to shift and scale them such that both time series range between 0 and 100.

            Sources:

            – SSN: https://tinyurl.com/zw235cl (delta charlie syndrome)
            – OHC: http://www.data.jma.go.jp/gmd/kaiyou/data/english/ohc/ohc_global.txt

            PS: I’m not interested in warmism, alarmism or the like.

          • PhilJ says:

            LaP,

            “I thought a fair way to compare them would be to shift and scale them such that both time series range between 0 and 100.”

            I like that idea , but you havnt gone back far enough… Show the previous 100 years as well…and youll see the grand solar max that your current chart is. Everything above about 20% SSN is heating below is cooling…

          • gbaikie says:

            –David Appell says:
            May 3, 2018 at 11:07 AM
            gbaikie says:
            Oceans could be warmed by geothermal heat, but I cant say read a paper and/or there is not enough data to say by how much.

            So you have no evidence for your claim. Thats what I suspected.–

            What is my claim that you are referring to?
            There is a lot volcanic activity in the ocean, this obviously, is not my claim. The deep ocean lacks exploration, again obviously, not my claim.

            –It does seem quite possible that volcanic activity in the past could have something to do with hothouse climates.

            “Humans now emit 100-200 times more CO2 than do volcanoes.,”

            I meant the past before humans existed, in fact, humans had not existed during the last time Earth had a hothouse climate.

            But it is possible humans existed during times in which the ocean may have warmed by ocean volcanic activity more than the oceans currently are. Though again, I don’t recall reading a paper, specifically about this. Nor a paper claiming we are now having the most oceanic volcanic activity in last 2000 or say, 2 million years.

          • gbaikie says:

            “PhilJ says:
            May 3, 2018 at 3:32 PM
            High levels of solar activity in the second half of the 20th century added a lot of energy to the oceans

            Unless we return to those levels the oceans will cool.. ”

            Roughly, I don’t think the ocean can be warmed much within 50 year period. Even if you just referring to the top 200 meters of ocean, rather than entire ocean. The entire ocean can absorb a lot of energy, but for human lifespans one can call it “lost”.
            The ocean does not warm quickly, nor cool quickly. Though if talking about tens of meters of surface, one has various mechanism: El Nino, hurricanes, Gulf Stream, etc, which can involve rapid cooling processes. And this average surface has warmed about 1/2 C over last 100 years, and it could cool (or warm) in terms of years or decades.

    • Norman says:

      Dan Pangburn

      I like reading your material but I don’t think you are getting it right.

      The notches in the graph are because the CO2 is emitting at much colder temperatures. Lower atmospheric levels of CO2 have already absorbed all the surface IR in the bands that CO2 absorbs.

      Water Vapor is closer to the Earth’s surface temperature so its emission comes from warmer molecules.

      The Hitran data base you use at super low levels distorts the CO2 emission because the number of radiating molecules is so different.

      You need to have a much longer path length to get enough CO2 molecular emitters to rival those of H2O.

      The back radiant energy is not about the molecules absorbing then emitting right away. It is just about emission. Heated GHG will emit IR from molecular collisions raising the molecules to higher vibrational states. As you extend the path length you see that CO2 contribution goes up.

      I think this paper will explain it to you much better than I have.
      http://www.patarnott.com/atms411/pdf/StaleyJuricaEffectiveEmissivity.pdf

      • Norman says:

        Dan Pangburn

        This empirical data also confirms the paper I linked to. At one time I thought the DWIR was a product of CO2 absorbing IR from the surface and then redirecting this same energy downward.

        This empirical data shows that this is not the case. The actual DWIR is only a product of the temperature of the gas that is emitting the IR.

        https://www.esrl.noaa.gov/gmd/webdata/tmp/surfrad_5ae93209a5dd6.png

        As the surface cools at night (and the air cools at a slower rate) the Net IR gets less negative. During the day the surface (actual ground) warms at a rapid rate and the IR emission reflects this in the graph. The atmosphere does not warm as fast and so the Net IR gets more negative. If the GHE was the result of CO2 just emitting back what it absorbed the Net IR would stay the same.

      • Dan Pangburn says:

        Norm,, No worries. If you thought I was getting it right you would not be a warmer.

        I see things quite a bit differently. At all levels above a few meters, all the radiation energy from the surface has been absorbed by ghg molecules and further emission is only from ghg molecules. Because the relaxation time is thousands of times longer than conduction time, the absorbed energy is thermalized. Spectracalcs Hitran output shows essentially all of the emission at low altitude is from WV. This WV emission energy is absorbed only by WV molecules because of mandatory wavelength match and is, of course, thermalized. If you interrogate Hitran at successive altitudes you will see the influence of WV decline at increasing altitude wrt CO2. The greatly reduced-with-altitude number of ghg molecules allows much of the radiation from below to pass right through to space. By about 10 km, more than 99% of the radiation energy will not again be absorbed and will make it all the way to space.

        So yes the CO2 is emitting from higher-altitude/lower-temperature but less energy is being emitted (causing the notch) because part of the energy in the CO2 wavelength range had already been redirected to WV at lower altitude and radiated to space. Above about 10 km, radiation from WV is diminished to where CO2 can significantly participate comparatively with WV but there just is not much energy left to radiate.

        Your statement in your second paragraph ,,Lower atmospheric levels of CO2 have already absorbed all the surface IR in the bands that CO2 absorbs,, appears to conflict with fifth paragraph ,, need to have a much longer path length to get enough CO2,, (For some reason the blog will only print commas and periods from me so I use double commas for quote marks).

        The paper you linked has to do with equivalent emissivity if the gas is treated like a gray body emitter and does not appear to me to be relevant.

        • Norman says:

          Dan Pangburn

          I still am not sure how to read the Hitran data. I am reading the HELP information on how they calculate the data. It may take me a bit of time to figure it out.

          I think you could get a good determination of CO2 contribution to DWIR by looking at polar air that is much below freezing and is very dry.

          Maybe try CERES graphs of poles vs tropical regions for DWIR.

          You can use this to make your own graphs.

          https://ceres-tool.larc.nasa.gov/ord-tool/jsp/EBAFSFCSelection.jsp

          • Dan Pangburn says:

            Nor,, Thanks for the link. I will explore it later.

            The graphs I use from Hitran show the relative contribution of atmospheric molecule species to absorp.tion/emission including the effect of relative concentration. Each ‘stick’ (vertical line) applies to a specific specie at that particular wavenumber. At ground level, as shown, the contribution from CO2 is barely discernable compared to WV.

            CO2 dominates at the poles because there is very little WV for the abs.orbed energy to be redirected to. But then the low temperature means there is a lot less energy to be abs.orbed.

  22. Mike Flynn says:

    N,

    I’m glad to see you wrote –

    “As the surface cools at night (and the air cools at a slower rate) the Net IR gets less negative. During the day the surface (actual ground) warms at a rapid rate and the IR emission reflects this . . . ”

    Gee. Colder surfaces emit less IR than hotter ones!

    Gee. The surface warms rapidly when subjected to more intense radiation from a 5800 K source!

    I don’t need a GHE to explain these simple phenomena. If you do, you are obviously more stupid and ignorant than real scientists.

    Cheers.

    • Norman says:

      Flynn

      No you don’t need GHE to explain the diurnal cycle of night/day.

      And yet you are not able to comprehend simple physics so why your farce pretending you can? You can see in the graphs the atmosphere is emitting energy to the surface. This energy makes the surface warmer than it would be without the energy. That is the GHE. It is a relative comparison between states. An atmosphere with GHG and one without. The surface would average much colder temperatures without GHG. It is really that simple. You are not able to comprehend averages so I don’t know why you pretend to want someone to explain what you are not interested in. If you find a new player to put them through your stupid game that is one thing. I have already played your stupid game. If gets old after a couple of years.

      • Mike Flynn says:

        N,

        The Moon gets a lot hotter. No GHGs at all! You need to try harder.

        Cheers.

        • Norman says:

          Flynn

          You also know the Moon gets much colder. That is why I stated average temperature. You don’t know what that means so you keep playing your stupid game. Sad really. Wish you were a smarter human.

          The Moon’s average temperature is MUCH colder than the Earth’s. Sorry you need to gain a little thinking ability and be able to grasp the concept of average temperature.

          I can’t help you with your limited abilities. It is up to you to work on them. Read up on what averages are, why they are used, why they are important in science, why you can use them to establish trends.

          • Mike Flynn says:

            N,

            The GHE is supposed to increase temperatures, isnt it? As in, more GHGs, higher temperatures. More heat waves, Hottest year EVAH!, and so on.

            As I pointed out, the Earth has cooled over the last four and a half billion years. From an average temperature above the melting point of rock, to above the boiling point of water, down to where it is now. The average temperature of the Earths surface has fallen – or do you not like this inconvenient fact?

            As to the Moon, you havent got the faintest idea of its average surface temperature, have you? If you had, you would no doubt have supplied it. It would not change at all. No atmosphere, no GHGs, and all that.

            Averages are the refuge of the pseudo scientist. Generally meaningless, which is why real scientists use actual measurements – length, mass, and so on. The average of a 240 VAC voltage is zero. Applied through your torso via your hands for 100 milliseconds or so, it will probably kill you stone dead. Zero average voltage! Averages as a valid measurement? Pointless.

            Off you go, Norman. Keep trying to find a testable GHE hypothesis. Oh, you will have to define the GHE first – and you cannot even do that, can you?

          • Mike Flynn,

            you really live in a parallel universe in your brain. GHGs are not heating the earth, they are reducing heat loss.

            A similar way as a cold blanket can warm your body.

            But even with a very thick blanket in a cold surrounding you are not boiled to death. Still there is heat loss.

            As long as you are not grabbing that fact, every discussion with you is in vain.

            Farewell!

          • Mike Flynn says:

            JH,

            Try raising the temperature of a corpse or a concrete block with a blanket. Try heating your coffee by putting it in a vacuum flask.

            Try stopping the Earth from cooling for four and a half billion years by wrapping it with an atmosphere.

            As you say, there is still heat loss – it’s called cooling, for a body without sufficient internal energy to overcome the loss. The Earth is such a body.

            Learn some basic physics – more practical than pseudo science. No GHE. CO2 hears nothing, and putting more CO2 between the Sun and a thermometer doesn’t make the thermometer hotter, does it?

            How does that affect your attempt to define the GHE? Not as easy as you thought? That is why nobody has managed to do it so far. Sad but true.

            Cheers.

          • Ball4 says:

            Mike: Try slowing the cooling of a corpse from its former body temperature to the morgue refrigerator temperature or a concrete block with a blanket. Works!

            Mike Flynn really doesn’t have the faintest idea of what we are talking about as he has admitted in comments & his ill formed analogy demonstrates.

          • Mike Flynn says:

            Ball4,

            Why do you think that your admission that you cannot raise the temperature of a corpse or a concrete block by wrapping it in a blanket, means that you have raised its temperature?

            Reduction n the rate of cooling is not a rise in temperature – unless you are a climatologist, I suppose.

            Are you really that stupid, or are you just pretending for some weird foolish Warmist reason?

            I’ll go for endogenous stupidity, barring evidence to the contrary.

            Still no GHE. Not even a useful description. So sad, too bad.

            Cheers.

          • Ball4 says:

            “Reduction (i)n the rate of cooling is not a rise in temperature..”

            The evidence is in thermometer AND brightness temperature measured did increase due to the blanket v. no blanket though Mike so I see you still haven’t the faintest idea what we’re talking about.

            Carry on, make no progress understanding science Mike. Thanks for your various useful descriptions of Earth’s GHE too. No need for me or others to write out better ones.

          • Mike Flynno says:

            Ball4,

            Unfortunately, it appears the evidence is lacking from temperature readings – thermometers and so on.

            What a pity for your delusory imaginings!

            Interesting. Now you can heat things without additional heat. Where may I buy such a wondrous device? Can I get one that cools as well?

            I live in the tropics, and at the moment I insulate my house to keep a little cooler. Would reducing the amount of CO2 inside lower the temperature?

            The Earth has cooled for four and a half billion years – you don’t need to believe it, of course.

            Cheers.

          • Ball4 says:

            “Where may I buy such a wondrous device? Can I get one that cools as well?”

            Mike can find the equipment at the local hardware store as did Prof. Tyndall and possibly a visit to the local HVAC shop.

            Removing CO2 from the air inside your house would be an expensive waste of time Mike, only those that admittedly don’t have the faintest idea what we’re talking about and believe in magic such as Mike Flynn would try such a thing. But feel free to proceed if Mike wishes and report the results for our entertainment

          • Norman says:

            Mike Flynn

            Your last post to me confirms that only I am the idiot if I try to continue to reason with you. You have never taken a science course have you? Do you know what the term accuracy and precision mean? I think I need to quit wasting time with you. I am not even sure you are an actual human. Even the most stubborn people do not seem to repeat as much as you. I think you escaped from Westworld before they opened the program. You are still stuck in the loop.

            You actually don’t have a clue about what averages are, why they are used and why they are very valid whenever you have measured values.

            I have also given you links to the Moon’s average surface temperature. I guess you ignored those and now request them again. I don’t feed people who have zero interest in learning. Go back to Westworld they are missing the dumb android.

  23. ren says:

    Access of solar and galactic cosmic rays to the Earth’s magnetosphere is quantified in terms of geomagnetic cutoff rigidity. Numerically computed grids of cutoff rigidities are used to model cosmic ray flux in Earth’s atmosphere and in low Earthorbit. In recent years, the development of more accurate dynamic geomagnetic field models and an increase in computer power have made a real-time data-driven geomagnetic cutoff computation extending over the inner magnetosphere possible. For computational efficiency, numerically computed cutoffs may be scaled to different altitudes and directions of arrival using the known analytic variation of cutoff in a pure dipole magnetic field.

    Modeling geomagnetic cutoffs for space weather Applications. Available from: https://www.researchgate.net/publication/278669632_Modeling_geomagnetic_cutoffs_for_space_weather_Applications?ev=auth_pub [accessed May 02 2018].
    http://sol.spacenvironment.net/raps_ops/current_files/rtimg/cutoff.gif
    The graphics indicate the high availability of cosmic rays to North America. Please compare it with the circulation over North America during the winter and the temperature in North America.
    http://cosmicrays.oulu.fi/webform/monitor.gif

  24. ren says:

    SOLAR CYCLE 24 STATUS AND SOLAR CYCLE 25 UPCOMING FORECAST
    published: Thursday, April 26, 2018 19:18 UTC
    Current solar cycle 24 is declining more quickly than forecast. The smoothed, predicted sunspot number for April to May, 2018 is about 15; however, the actual monthly values have been lower. Will solar minimum be longer than usual or might solar cycle 25 begin earlier? Leading solar and space science experts will convene a meeting in the coming years and attempt to predict solar cycle 25.

    The “official” solar cycle forecast includes the month, year, and intensity of that maximum (peak, average sunspot number). The consensus forecast is the result of collaboration by a solar cycle prediction panel of solar and space scientists from around the world. Typically, the panel considers all new, relevant research results, observation trends, and model predictions available when the panel is convened.

    Just like hurricane season forecasts, solar cycle predictions have improved; however, there are still notable deviations in prediction versus actual activity. The previous solar cycle prediction panel’s forecast for solar cycle 24 called for a maximum average sunspot number of 90 to occur in May, 2013. After looking at the actual sunspot numbers and solar activity, it was determined the solar cycle 24 maximum was reached in April, 2014 and peaked at an average sunspot number of 82. While the peak value was within the expected range of error, the maximum occurred significantly later than the panel’s prediction.
    https://www.swpc.noaa.gov/news/solar-cycle-24-status-and-solar-cycle-25-upcoming-forecast

  25. ren says:

    Sea surface temperature (SST) and SST anomaly maps are generated from NOAA Optimum Interpolation SST version 2 (OISST V2). OISST is a 0.25×0.25 blendend dataset derived from satellite, ship, and buoy measurements. The SST anomaly is based on a 1971-2000 NOAA climatology.
    http://pics.tinypic.pl/i/00964/vo0e5r07fnqp.png

  26. Bufalo says:

    I am no scientist or expert, but very much like to follow your conversations here.

    I was expecting temps to drop further this last months. It seems it wont go down below 0.2. Considering we are entering a sun activity minimum, and considering neither distinct el Nio or la Nia conditions lay ahead of us, if temperatures remain in the 0.2 or above for the rest of the year, how would that affect the debate – just thinking that it looks there may not be significant warming or cooling for a while but instead temps appear to remain at what seems a new average of +0.2-0.3

    • gbaikie says:

      If remains at .2 until Dec 2018, we will have returned to the Pause. If goes to .0 or lower, slight cooling, if goes to .4 or higher, leaving pause, slight warming.

      But 6 months of temperatures, does not mean much.

    • Obama says:

      I’m not a scientist. But follow the discussion fairly well. My benchmark is the 0.13C/decade trend per UAH. If this trend moves to greater than 0.20C/decade per UAH then I will concede the debate to the alarmists. Until I see this empirical outcome I’m not going to lose any sleep over global warming.

      I’m not a statistician either. But if the range remains between +.2-.3 then I would call that a PAUSE or HIATUS of global warming – there just isn’t much sensitivity between human caused CO2 and global warming.

      • La Pangolina says:

        Obama says:
        May 2, 2018 at 10:14 AM

        If this trend moves to greater than 0.20C/decade per UAH then I will concede the debate to the alarmists.

        1. Why to the alarmists? Is it alarmism to think of an increase of 2 C / century since 1850 by 2100? So what.

        2. Why ‘per UAH’? UAH measures at about 5 km altitude, what sometimes strongly differs from what is measured at surface.

        And surface is where we live, Obama.

        • Obama says:

          I’m not a scientist.

          Q1 – Speaking personally, maybe I should have said, “I might be more alarmed” that the warming trend would be greater than 0.20C/decade. Personally, I really think we need more empirical evidence of dangerous AGW. I think this may require more research and TIME. Right now, I’m not losing any sleep over AGW. And I’m skeptical as to the sensitivity between human CO2 and Global Warming. I remain in “watch and see”. And I’m open minded.

          Q2 – UAH should be able to measure increases in global warming. UAH measurements are easy to read, the graph is easy to read. UAH is very convenient method of tracking global warming for the LAY PERSON. Love the monthly presentation. And I trust the integrity of Dr. Roy Spencer. The UAH measurement is my preferred base line of following the discussion.

          Hope that helps!

          • La Pangolina says:

            Obama says:
            May 2, 2018 at 1:26 PM

            UAH should be able to measure increases in global warming.

            In some sense it does indeed.

            There is no reason at all for you to solely trust in UAH’s time series.

            I’m a lay person too, Obama.

            But the difference between us might be that I don’t trust only in UAH, but in other sources as well, e.g.

            https://tinyurl.com/y9rv7pjd

            (tiny url because of the had-crut problem here)

            And… do you know about the transition from UAH5.6 to UAH6.0 in 2015?

            Between July 2011 and May 2015, many people didn’t trust at all in UAH simply because it had shown too much warming…

          • Obama says:

            La Pag,

            Thats fine. But doesnt the climate and meteorological conditions exist above the surface to upwards of 1,000s of feet into the atmosphere.

            Are you saying that UAH data (up and down temps) does not correlate to other methods? It seems to me that if UAH temps go up over time than other methods would also show temps going up. I guess I assume directionally that UAH and other methods would be in some alignment.

            I try to go to other sites and methods but they are not as easy to understand as this site is. This site is very straightforward and easy to follow.

            Do you have any recommendations of sites to get monthly updated trends on global warming that would be comparably easy to read?

          • barry says:

            All the global surface and tropospheric temperature data sets show warming over the long term and very similar swings for annual anomalies.

            Obama, what “methods” are you referring to? Not clear if you mean the way the data is worked out for UAH, the way it is presented, or if you just like the forum layout.

            From my experience (layman but well read), the methods for gleaning temperature via satellites is harder to grasp than the methods used for the surface records.

          • Ebbets Field says:

            Obama – UAH’s weighted measurement is above 13,000 feet, not many folks live that high in the atmosphere. The highest capital city on the planet is below 12,000 feet. So the UAH average of the lower troposphere is equal to halfway up Mt. Everest.

  27. David Appell says:

    An anomaly of +0.21 C is still in the top 20% of UAH anomalies.

  28. La Pangolina says:

    PhilJ says:
    May 2, 2018 at 6:20 AM

    Indeed,
    Coldest spring in 50 years here in the center of the continent

    If the sun stays dormant, next winter will be brutal

    *

    Sure?

    http://4gp.me/bbtc/152528814597.jpg

    Maybe you manage to explain what exactly you mean, PhilJ…

    • PhilJ says:

      LAP,
      Not sure what that graph has to do with my statement that here, in the centre of NA , we are having the coldest spring in 50 years.

      • La Pangolina says:

        PhilJ says:
        May 2, 2018 at 3:41 PM

        LAP,
        Not sure what that graph has to do with my statement that here, in the centre of NA , we are having the coldest spring in 50 years.

        It had to do with

        If the sun stays dormant, next winter will be brutal

        The center of NA is – viewed from Europe – Rugby, North Dakota.

        My friend J.-P. alias Bindidon has shown in Roy Spencer’s previous thread that in Iowa, the December/January/February average for the daily minima collected by over 100 GHCN V4 stations during the winter 2017/18 was far far away from any record cold (position 36 in a list sorted by ascending absolute temperatures).

        http://www.drroyspencer.com/2018/04/new-lewis-curry-study-concludes-climate-sensitivity-is-low/#comment-299941

        Maybe you should make a similar comparison for March/April in North Dakota?

        • PhilJ says:

          LaP,

          Yes Rugby is the centre of NA. I live a little North of there…
          As for it being cold … Check this out:
          https://www.google.ca/amp/s/www.cbc.ca/amp/1.1320835

          • Bindidon says:

            PhilJ says:
            May 3, 2018 at 6:48 AM

            Yes Rugby is the centre of NA. I live a little North of there As for it being cold

            PhilJ, I agree with you as far as April 2018 is concerned.

            As I checked the temperature situation in Iowa, I went only till March this year, as the monthly anomalies were pretty warmer than those for January and February.

            And with only March included, the 2018 situation in North Dakota didn’t differ very much from Iowa:
            – January: 85th position (-17 C)
            – February: 19th (-21)
            – March: 82nd (-9)

            But upon a download of April, we see this:

            – April: 4th (-5.5) just behind 2013, 1907 and 1920.

            No wonder: on April 6th and 7th, temperatures well below -20 C were measured, e.g. in Max, Crosby, Dickinson, Underwood etc.

            So yes, PhilJ: that is really a harsh spring you experience in ND.

        • Gordon Robertson says:

          binny…”My friend J.-P. alias Bindidon has shown in Roy Spencers previous thread that in Iowa, the December/January/February average for the daily minima collected by over 100 GHCN V4 stations during the winter 2017/18 was far far away from any record cold (position 36 in a list sorted by ascending absolute temperatures)”.

          ***********

          Binny’s statistical assessments are about as schizophrenic as him disappearing from the blog in a huff then re-appearing a few days later as La P. No difference whatsoever in personality or mannerisms, just a change of nym.

          Binny thinks it’s smart to use a homebrew statistical setup using Excel, then use his amateur calculations to throw the real data, as provided by Roy, into disrepute. Doesn’t matter that Roy is a professional meteorologist who has been doing this work the past 39 years.

          • David Appell says:

            Gordon Robertson says:
            Binny thinks its smart to use a homebrew statistical setup using Excel, then use his amateur calculations to throw the real data, as provided by Roy, into disrepute. Doesnt matter that Roy is a professional meteorologist who has been doing this work the past 39 years.

            Roy calculates a linear trend every month, using the exact same methods that Excel uses.

            So you’re claiming that Roy, too, “throws the real data into dispute.” Nice.

  29. Tim Wells says:

    Wish we had some global warming in the UK. 2nd of May and still waiting for spring to start.

  30. Myki says:

    Alarmist? Me?
    “Pakistani city breaks April record with day of 50C heat”
    Citizens consider fleeing Nawabshah in fear of what summer might bring

    “Everglades under threat as Florida’s mangroves face death by rising sea level”
    The river of grass wilderness and coastal communities are in peril, with the buffer coastal ecosystems on a death march inland

    The first three months of 2018 have been between the fourth and sixth warmest first quarter on record since 1880. This is despite a modest La Nia event leading to a relatively cooler start to the year, compared to recent record warmth. Overall, 2018 is on track to be the fourth warmest year on record
    https://www.carbonbrief.org/state-of-the-climate-warm-start-to-2018-despite-la-nina-conditions

  31. Gordon Robertson says:

    tim folkerts…problem with duplicate post. You said…

    “All you are doing when you add greenhouse gases is blocking the radiation from the earths surface, which blocks its ability to dissipate heat”.

    *********

    There’s a huge difference between placing an equal sized metal plate a 1/4″ from a radiating surface and having a trace gas at 0.04% allegedly blocking radiation from a surface radiating a flux a bazillion times denser than the 0.04%.

    There is also a presumption in what you claim that the Earth’s surface cools only by radiation. A good portion of the 99% of the atmosphere made up of nitrogen and oxygen is in direct contact with the surface and the temperature of that mass will affect heat dissipation from the surface far more than the 0.04% of CO2.

    There is nothing in Stefan-Boltzmann that claims CO2 should have an effect on surface heat dissipation. According to S-B, it is a temperature differential that affects it. Fourier’s law of heat transfer in a solid has a similar temperature differential. Any absorp-tion by CO2, which should be minimal, could not equal the effect of the temperature of surface air comprised 99% of N2/O2.

    I mention S-B only because alarmists are inclined to apply it for calculating atmospheric temperatures. I don’t think that’s what S-B had in mind when the equation was issued. It’s a highly idealized equation related to blackbodies and not to our surface/atmosphere interface.

    All the same, if you are talking CO2 absorp-tion, you need to be talking temperature differential since absorp-tion by a trace gas alone has no effect on surface dissipation. It would be the temperature of CO2 that would offer any effect on heat dissipation and that would be negligible.

    • E. Swanson says:

      Gordo, You are conveniently ignoring the fact that the Earth is surrounded by the vacuum of deep space and is bathed by the cosmic background radiation equivalent to a temperature of 2.7 K. The Earth is constantly radiating IR EM at TOA to balance the incoming solar energy. The atmosphere moderates this process, thru various pathways, leading to what is call climate at the surface. Key ingredients of this process are the greenhouse gases, which absorb and emit IR EM radiation, in conjunction with convection and the water cycle, the result being the declining lapse rate from the surface to the Tropopause. Above the tropopause, there’s almost no water vapor and other greenhouse gases dominate thru the stratosphere, causing the temperature to increase with altitude.

      How does your deviant physics explain the well documented fact of an increase in temperature with altitude in the Stratosphere?

      • Mike Flynn says:

        E,

        Learn the difference between temperature, energy, and heat. The temperature of the gas in an operating neon tube is around 30 000 K, but you can hold it in your hand quite comfortably.

        Now tell me the relevance of the temperatures in the thermosphere. 5 000 K? Not nearly as hot as a neon tube, is it?

        Your apparatus shows nothing that is unusual – no GHE required. Turn off the heat source (just like the Earths surface at night), and tell me what temperature increase you record. None at all!

        You cant even define the GHE, much less propose a testable GHE hypothesis!

        Keep on with the pseudoscience.

        Cheers.

        • E. Swanson says:

          MF, Surely a fellow with your great knowledge would understand the requirement for a constant energy input in my demonstration of the Green Plate Effect. Tell you what. You turn off the Sun and I’ll try your suggestion. What, you can’t do that? Who would have thought?

          • Mike Flynn says:

            E,

            The Sun turns off” every night. Maybe you overlooked that? If you need a constant energy input, and still want to pretend you are demonstrating the non existent GHE, you need to keep your energy input stationary, and rotate your whole apparatus in front of it.

            You wouldnt be too happy about that, I guess. You would have to sit there raising and lowering your plates as the apparatus rotated! Unfortunately, the Earth just twirls around in relation to the Sun. Sometimes parts get colder (as in Winter), sometimes warmer. Overall, the Earth continues to cool, as any object 150 000 000 from the Sun, with a molten core of 5 500 K, and surrounded by a 4 K environment would do.

            Elementary, my dear Swanson.Thank you for appreciating my great knowledge. It is obviously greater than yours, so you should take notice, shouldnt you?

            Cheers

          • Ball4 says:

            “The Sun turns off” every night.”

            Ha, sorry no Mike, the sun is always on. No overlooking. No greater knowledge from Mike. Just GREAT entertainment from Mike.

            Keeps the threads alive with discussions. Some of the discussions from others are accurate, mostly not from Mike at least so far. Although Mike is accurate the Earth has cooled since inception.

          • Gordon Robertson says:

            ball4…”The Sun turns off every night.

            Ha, sorry no Mike, the sun is always on”.

            Mike’s play on words is far better than claiming it sets at night, suggesting it is revolving around us.

      • Gordon Robertson says:

        swannie…”How does your deviant physics explain the well documented fact of an increase in temperature with altitude in the Stratosphere?”

        Ren already explained that. Oxygen in the stratosphere absorbs UV and warms.

        As for the rest of your dogma, that’s what it is, a belief system. As Mike keeps telling you re the GHE and AGW…no proof, no testable hypothesis.

        BTW…the lapse rate has different definitions depending on where you look on the Net. The one that fits best for me is the effect of gravity on atmospheric gases. Gravity produces a natural temperature gradient and I have used Mt. Everest as an example.

        From sea level to the top of Everest, air thins to 1/3rd sea level pressure. The temperature also drops some 40C in summer, especially at night. The definition of lapse rate based on thermals cannot account for such a pressure reduction or temperature reduction.

        Gravity rules!!!

        • E. Swanson says:

          Gordo, The solar UV creates ozone in the stratosphere. Ozone is a greenhouse gas. Gravity acting on a compressible gas results in a non-linear decline in pressure with altitude. That does not cause the lapse rate, i.e., the decline in temperature with altitude in the troposphere.

          • Gordon Robertson says:

            swannie…”Gordo, The solar UV creates ozone in the stratosphere. Ozone is a greenhouse gas”.

            Ozone is oxygen, that means oxygen must be a greenhouse gas.

            “Gravity acting on a compressible gas results in a non-linear decline in pressure with altitude. That does not cause the lapse rate, i.e., the decline in temperature with altitude in the troposphere”.

            Where’s the proof that the effect of gravitational force is non-linear. Has Newton’s laws changed for the atmosphere?

            If gravity is not the cause of declining temperatures with declining pressure, then what is causing it? It seems once again that climate scientists have taken the liberty of changing the laws of physics.

            Nothing else explains the thinning of air with altitude and the subsequent reduction in temperature as does gravity.

          • David Appell says:

            Gordon Robertson says:
            Ozone is oxygen, that means oxygen must be a greenhouse gas.

            GHGs always consist of molecules of three atoms or more. Know why?

            If gravity is not the cause of declining temperatures with declining pressure, then what is causing it? It seems once again that climate scientists have taken the liberty of changing the laws of physics.

            Gordon, why do temperatures increase with altitude in the stratosphere and the thermosphere?

            They shouldn’t, if your theory is correct.

      • Gordon Robertson says:

        swannie…”You are conveniently ignoring the fact that the Earth is surrounded by the vacuum of deep space and is bathed by the cosmic background radiation equivalent to a temperature of 2.7 K”.

        I have never indicated that I deny any of that, I am simply questioning the way it is presented, as if the surface radiates IR straight to space and that radiation is the prime means of cooling the surface.

        I also question the 2.7K background radiation as being heat. That is the basis of the Big Bang theory, that the background radiation is heat left over from the BB. Free floating radiation is not heat and it cannot become heat till it contacts matter. It appears we have a crack in the BB theory.

        With the bazillions of stars out there could they not have perhaps considered that the background radiation may come from them?

        BTW…the other proof offered for the BB is based on Doppler shifting in stars. Stars moving away from us give off a different frequency of light. Based on that the BBers have concluded they are still moving away from the BB.

        After we get past the arrogance and conceit we must realize we have no idea how large the universe is or where the centre may be.

        May main interest is in questioning science that does not make a lot of sense, like AGW.

        • David Appell says:

          Gordon claims:
          Free floating radiation is not heat and it cannot become heat till it contacts matter

          Radiation has energy. Heat is energy. Energy is the ability to do work. Both heat and radiation can do work and can be converted into one another. They both must be considered when dealing with energy transfer, as in the atmosphere.

          You’re just playing word games.

    • David Appell says:

      Any absorp-tion by CO2, which should be minimal, could not equal the effect of the temperature of surface air comprised 99% of N2/O2.

      What is “minimal?” You keep saying this, but never provide any numbers. You also ignore radiative transfer, which is absurd.

      I mention S-B only because alarmists are inclined to apply it for calculating atmospheric temperatures. I dont think thats what S-B had in mind when the equation was issued. Its a highly idealized equation related to blackbodies and not to our surface/atmosphere interface.

      The Earth’s surface is a pretty good blackbody in the infrared.

      • Mike Flynn says:

        DA,

        You wrote –

        “The Earths surface is a pretty good blackbody in the infrared.”

        I suppose “pretty good” is about as scientific as climatology gets, is it?

        Completely irrelevant and pointless – how would it compare to bananas? Left on the surface, would they be colder or hotter than the surface – just before dawn? Do you think the infrared properties make a difference? Maybe it explains why your bananas remain warmer inside your house, if it is snowing outside.

        It is all a bit silly, isnt it?

        Learn some science. The cryptic pseudoscientific comments won’t restore funding, I suspect.

        Or create respect.

        Cheers.

      • Gordon Robertson says:

        DA…”What is minimal? You keep saying this, but never provide any numbers”.

        I have provided estimates several times. Based on a 1C warming, CO2 should contribute no more than 0.04C. I based that on the Ideal Gas Law and Dalton’s Law of Partial Pressures.

      • Gordon Robertson says:

        DA…”The Earths surface is a pretty good blackbody in the infrared”.

        S-B is mainly about the work of Boltzmann. He was trying to verify the 2nd law using statistical means and he visualized EM in a blackbody as a gas cloud of photons. He applied the theoretical entropy of each photon to a statistical analysis to see if he could find a distribution based on probability.

        I don’t think his work had anything to do with atmospheric problems and I think applying S-B in that manner leads to misunderstanding. It essentially ignores what happens with real gas particles in the atmosphere.

        • E. Swanson says:

          Gordo, As I understand it, Boltzmann did his work in the 1860’s, long before the notion of “photons” appears in theoretical physics after Einstein. Planck started it in 1900, when he realized that the Planck-Wein did not agree with experimental data for IR EM from cooler bodies, but did not pursue the issue, leaving it for Einstein to develop, beginning in 1905.

          • Gordon Robertson says:

            swannie…”Gordo, As I understand it, Boltzmann did his work in the 1860s, long before the notion of photons appears in theoretical physics after Einstein”.

            Mark this down somewhere…I agree with you. ☺

            However, the concept of blackbody radiation was introduced initially in 1860 by Kircheoff, and Boltzmann came between Planck and Kircheoff. Planck drew on the work of Boltzmann while developing his theory on quanta, from which, as you say, Einstein coined the word photon.

            Of course, Einstein was working on the problem of photo-emmission, which was a problem where light incident on a metal released electrons from the metal. I could be wrong, but it seems to me Boltzmann equated his equivalent of photons to particles of light and approached those particles as if they were real particles as in gases.

            Boltzmann did his work initially with gases from which came the Maxwell-Boltzmann Distribution. Circe 1877, he did work with blackbodies to develop his equation with Stefan on radiation distribution.

        • David Appell says:

          Gordon Robertson says:
          S-B is mainly about the work of Boltzmann. He was trying to verify the 2nd law using statistical means and he visualized EM in a blackbody as a gas cloud of photons. He applied the theoretical entropy of each photon to a statistical analysis to see if he could find a distribution based on probability.

          What???

          You’re inventing physics again….

          The SB Law describes radiation from a blackbody. It’s not about a gas of photons, or the entropy of anything, and it isn’t probabilistic.

          It has great utility in discussions of the atmosphere and climate and heat-seeking missiles and digital ear thermometers.

          Climate calculations use the Planck Law, which integrates to the SB equation.

          • Gordon Robertson says:

            DA…”Youre inventing physics again.”

            No, I’m not.

            Boltzmann worked with gases initially and developed an energy distribution that is now the Maxwell-Boltzmann distribution. Later, he did the same with EM as related to blackbodies but to get it done he treated particles of light as real particles, like a gas.

          • David Appell says:

            Youre confusing gases and blackbodies. The SB law is about the latter.

            Boltzmann worked before the photon was discovered. What you wrote is gobbledygook.

    • Tim Folkerts says:

      Gordon, 0.04% black ink in a column of water can have a TREMENDOUS impact on how visible light gets blocked. Why do you assume that 0.04% CO2 can’t similarly block IR quite well? The blocking ability is well-known and well documented and easily observed.

      Pretty much all IR flux near 15 um is blocked within a few 10’s of meters by Co2. That means that the upward IR flux near 15 um from the ground is about 1.01 times stronger than the downward flux, not about a ‘bazillion’ times stronger.

      As long as you start from some fundamental misconceptions like this, you will have trouble wrapping your head around some better science.

      • Mike Flynn says:

        Tim,

        And in spite of the misdirection and obfuscation, you still can’t actually describe the wondrous GHE, can you?

        Much less show any trace of a testable GHE hypothesis!

        The miraculous blocking doesn’t stop the surface cooling at night, during Winter, or for four and a half billion years. What is this GHE supposed to do? It doesn’t even stop the surface cooling, does it?

        Do you think it simultaneously heats and cools bjects at the same time? That would be average climatological pseudoscientific thinking, wouldn’t it?

        Oh well. Onwards and upwards, eh?

        Cheers.

      • goldminor says:

        Ok then, over the full length of the sat record CO2 has increased around 72 ppm. Yet we only see a linear trend of 0.5C over the 39 years shown. Now it is certain that CO2 does not cause all of the rise, at the very least. That lowers the sensitivity dramatically, imo.

        • Gordon Robertson says:

          goldminor…”Ok then, over the full length of the sat record CO2 has increased around 72 ppm. Yet we only see a linear trend of 0.5C over the 39 years shown. Now it is certain that CO2 does not cause all of the rise, at the very least. That lowers the sensitivity dramatically, imo.”

          I second that. In fact, I’ll go so far as to say the contribution of CO2 is insignificant.

          In the future, when Salvatore is proved right, it will cool and we’ll all wonder what this CO2 things was about.

      • Gordon Robertson says:

        tim…”0.04% black ink in a column of water can have a TREMENDOUS impact on how visible light gets blocked. Why do you assume that 0.04% CO2 cant similarly block IR quite well?”

        ******

        Tim…I’ve heard all the analogies and I have worked with electrical, electronic, and computer circuits for decades. I have seen many weird things take place.

        However, temperature is related to molecules of gas like CO2 according to Dalton’s law of partial pressures. Presuming the atmosphere is close enough to a constant volume for a ballpark relationship, Dalton says that the total pressure of a gas is the sum of the partial pressures of the individual gases.

        In a constant volume, temperature is directly proportional to the pressure therefore the partial temperatures contributed by each gas should be proportional to their partial pressures, which amounts to their percent mass.

        At 0.04%, that leaves only a few hundreds of a degree C warming from 0.04% CO2.

        I have heard the argument that 0.04% of arsenic in a cup of coffee will kill you and I get what you are saying about the same concentration of ink in a cylinder of water. However, ink, arsenic, and CO2 act very differently in their respective mediums and must abide by the related rules.

        Gases have been studied thoroughly for centuries and the laws applying to them have been verified over and over. I have no idea why climate modelers have overlooked such widely understood laws as the Ideal Gas Equation and Dalton’s law. Simply put, they have not done their homework.

        Roy has proposed that 1 CO2 molecule surrounded by 2500 N2/O2 molecules SHOULD spread it’s thermal energy to all 2500. That sounds reasonable on the face of it but the kinetic theory of gases does not cover that. The Ideal Gas Law and Dalton does, given a constant volume.

        Here’s an interesting article that addresses the issue:

        http://www2.ucdsb.on.ca/tiss/stretton/CHEM1/gases9.html

        “Dalton’s law of partial pressures follows from the KMT [Kinetic-Molecular Theory] of gases. If the gas molecules in a mixture are in constant and random motion and if there are no forces operating between the molecules except collisions, then on the average, the net effect of collisions with other molecules must be zero. For this reason each gas acts as if it were present alone”.

        That’s what I have done, treat the gases in air as if they are alone. Given the turkey shoot conditions of colliding molecules it’s not safe to assume that 1 CO2 molecule will spread its thermal energy to 2500 surrounding molecules. After all, the KMT is simply a statistical analysis.

      • Tim Folkerts says:

        Gordon, I have never heard the term “partial temperature” before, but I assume you mean something like:
        If 1 mole of gas @ 400K is mixed with 99 moles of gas @ 300 K, the final temperature will the the weighted average, ie 301 K.
        If that’s what you mean, that would be reasonable (and *is* covered quite well by kinetic theory!).

        What you seem to be missing in this model is that the CO2 can be continuously re-heated by IR. Rather than thinking of a simple one-time mixing problem, you need to think of a heat exchanger.
        1) The tiny amount of CO2 is warmed via IR from the warmer ground.
        2) The tiny amount of warm CO2 passes a tiny amount of thermal energy to the surrounding cooler gas molecules.
        3) Go back to (1)

        Slowly but surely, the tiny amount of CO2 would warm a much larger amount of other gases.

        • gbaikie says:

          “Slowly but surely, the tiny amount of CO2 would warm a much larger amount of other gases. ”

          Perhaps, it too little and too slow to make much of difference.
          What happens if other gas is a CO2 or H2O molecule?

        • David Appell says:

          Tim, Gordon denies radiative transfer.

          • Gordon Robertson says:

            DA…”Tim, Gordon denies radiative transfer”.

            Now you’re lying. I have described radiative transfer in detail, from heat conversion and emission by an electron to heat conversion and absorp-tion by an electron.

            I even went to pains to describe the radiative transfer of EM between communications antennas.

            It is you who is hung up on the incorrect notion that heat flows through space.

          • David Appell says:

            Energy flows through space. A gass temperature is based on kinetic energy. Etc. Energy is what matters to climate, not just one particular form of it.

        • David Appell says:

          Tim, Gordon denies radiative transfer.

          You’re trying to convince someone who pretends that entire aspects of nature do not exist.

        • Gordon Robertson says:

          tim…”Gordon, I have never heard the term partial temperature before, but I assume you mean something like:”

          You heard it here first on Roy’s blog.

          The article to which I linked claimed that a gas in a mixture can be treated as a separate gas. I have no argument with your averaged temperature for the entire mix, but if the overall temperature is due to the overall gas molecules, then a partial pressure of one gas should relate directly to it’s heat contribution. That is equated to its percent mass.

          I did not simply guess at that relationship, I drew it from inferences in the Ideal Gas Law, given Dalton’s Law, provided the atmosphere can be considered a ballpark constant volume.

          It’s presumed the CO2 is continually replenished by surface IR. I don’t see any proof of that in the literature. In fact, I am arguing that surface radiation is so weakened by the inverse square law that it won’t be heating much of anything more than a few feet above the surface.

          I got that from R.W. Wood, an eminent physicist circa 1909 who was an expert on IR. He worked closely with IR in photography and it was he who mentioned IR would not be effective at more than a few feet.

          His explanation for the GHE was the scavenging of heat from the surface by N2/O2 and the inability of those gases to release heat quickly.

          • Tim Folkerts says:

            “In fact, I am arguing that surface radiation is so weakened by the inverse square law that it wont be heating much of anything more than a few feet above the surface. “

            The inverse square law applies to point sources. Or to spherical surface as measured from the center of the sphere. So 1 meter (“a few feet”) above the surface of the earth, the power radiated by the surface in the form of thermal IR will have dropped by a factor of about

            (6,371,000/6,371,001)^2

            I.e. still 99.99997% as strong as when it left the surface 1 m below.

          • David Appell says:

            Wood was wrong.

          • Mike Flynno says:

            DA,

            And why was that?

            Provide detailed reasoning. Show your workings.

            Are you sure you have a PhD in physics?

            Cheers.

      • Mike Flynn says:

        Tim,

        You wrote –

        “What you seem to be missing in this model is that the CO2 can be continuously re-heated by IR. Rather than thinking of a simple one-time mixing problem, you need to think of a heat exchanger.”

        And at night, the net result is cooling. Shortly after the Sun passes the zenith, the net result is cooling.

        And after four and a half billion years, the net result is – cooling.

        What you are definitely missing in reality, is that you can’t even describe the GHE in any way that would make sense to a real scientist. So much for your stupid models and less than thoughtful pointless analogies.

        No GHE. CO2 heats nothing. No raised temperatures through slow cooling – just lower temperatures. Try heating up your soup by putting it in a vacuum flask. Isn’t the soup continuously being reheated by the IR reflected within the flask? It only gets hotter in your fantasy world!

        Oh well. That’s climatology for you.

        Cheers.

        • Tim Folkerts says:

          Yep, GHGs cool the earth — LIKE INSULATION COOLS MY HOUSE IN THE WINTER!

          Heat leaves my house via the insulation in the walls. Thus insulation only cools the house. It heats nothing! Nothing, I tell you! No warming from insulation, only cooling. I better go rip out all that insulation that only cools my house! Might as well open the windows too, since they only cool the house.

          (Of course, this will be lost on Mike, but everyone else should immediately get the point.)

          • Gordon Robertson says:

            tim…”Yep, GHGs cool the earth LIKE INSULATION COOLS MY HOUSE IN THE WINTER! ”

            GHGs are related to radiation whereas home insulation is solely about retarding heat loss via conduction.

            Now, if alarmists really understood what heat is, the kinetic energy of atoms, they’d realize CO2 as a molecule cannot trap the atoms required for heat.

            As Foghorn Leghorn would put it, y’all built too close to the ground, goes way…ah said….goes way over yer head.

          • Tim Folkerts says:

            “Now, if alarmists really understood what heat is, the kinetic energy of atoms … “

            Not to beat a dead horse, Gordon, but you are the one using the term “heat” in a manner inconsistent with modern science.

            The kinetic energy of atoms is (part of) the “internal energy”, denoted “U”. This is also sometimes called “thermal energy”. (Furthermore, internal energy includes not only kinetic energy of the particles, but also rotational energy and vibrational potential energy.]

            The word “heat” is reserved for *transfers* of thermal energy, denoted “Q”. Heat could be in the form of convection, or conduction, or radiation.

            Informally, many people use “heat” as you do — to mean “U”. But since you are chiding people for not “really” understanding, then you should be using the words in their technical sense.

            Basically, your quote says “If only (a) people realized I mean “U” when I say “heat” and (b) I realized they mean “Q” when they say “heat” … “

        • Mike Flynn says:

          Tim,

          You are correct. Insulation heats nothing. A pile of insulation just sits there. No warming at all. You need a heat source to heat things.

          I live in the tropics. My house is well insulated – TO KEEP COOL. You see, the insulation is between me and the Sun. Just like the atmosphere. Just like James Hansen wearing a hat to protect his head from the fierce rays of the Sun.

          Now you have apparently become quite deranged, you might like to demand that firefighters really shouldn’t use heavily insulated clothing to keep cool, that refrigerators don’t need insulation, and that desert Berbers shouldn’t wear long woollen robes showing only their eyes, while living in the hottest environment on Earth.

          You might as well spread some fear and alarm about the non existent GHE while you’re at it, don’t you think? Do let me know how you get on.

          Cheers.

          • Tim Folkerts says:

            “Insulation heats nothing.”

            Glad we can agree on something! Let’s see if I can get you to agree on something else.

            I build two *almost* identical houses on adjacent lots. The only difference is that House A has insulation in the walls and House B doesn’t. I turn on two identical furnaces (in the middle of winter on a cold day). Both furnaces have the same steady power (*not* thermostats set to the same temperature).

            Which house will get warmer — A or B? (Just “A” or “B” will suffice.)

            If you want to say more, please explain your reasoning.

            [P.S. Using insulation to keep things cool in hot surroundings is also valuable, but that is not the issue we are focused on atm.]

          • Gordon Robertson says:

            tim…”Which house will get warmer A or B? (Just A or B will suffice.) ”

            A will get warmer but not for the reason you think. It has nothing to do with radiation, house A gets warmer because the insulation prevents molecules of air getting to the outside walls and ceiling, where they’d quickly conduct heat to the outside.

            Houses designed to prevent radiation loss have a reflective barrier installed. Obviously no one is overly concerned with radiation loss.

          • Tim Folkerts says:

            Gordon, House A gets warmer for EXACTLY the reason I think — which is NOT radiation. It is all about insulation in this case.

            The point is that we all seem to agree that:
            * insulation does not heat the house.
            * insulation in fact cools the house (as heat moves from the warm house to the cool surroundings).

            And we all agree that House A is warmer!

            The insulation makes the transfer of heat from the warm house to the cold surroundings less easy. For a given temperature difference between inside and outside, less energy escapes with insulation in place. With the furnace running, House A with the insulation gets warmer until finally the escape of heat from the warm House A through the insulation is equal to the heat loss from the cool House B (ie equal to the heat input from the furnace). You could turn off the furnace for a few hours and House A would continue to be warmer than House B.

          • Mike Flynno says:

            Tim,

            You haven’t actually built two houses at all, have you?

            You certainly haven’t lived in the tropics, otherwise you wouldn’t be so fixated on getting hotter! Strange that GHE supporters prefer warm to cold!

            Unfortunately, the Earth’s furnace is external, being the Sun. Insulation serves to keep us a little cooler – luckily for us.

            Maybe you coukd imagine a testable GHE hypothesis into existence, but even your imagination may not be up to the task. Am I right, or am I right?

            Cheers.

          • Tim Folkerts says:

            So Mike — once again — is House A warmer than House B?

          • Mike Flynn says:

            Tim,

            So once again Tim, is my house cooler with or without insulation?

            If you must pose a gotcha, you need to pose a good one. You wrote –

            “Using insulation to keep things cool in hot surroundings is also valuable, but that is not the issue we are focused on atm.”

            No, Tim, that is the issue you want to focus on, not “we”. I want to be even handed, and look at both sides of the question. Your approach is about as stupid and ignorant as the NASA graphic showing the entire Earth bathed in the Sun’s rays at once, to overcome the major problem that night time causes the GHE believers.

            If you have an infinite heat source in your house, you must allow me to have a similar infinite refrigeration system in mine, surely. Then I can demand you tell me which house will be colder! Or are you trying to rig the game with loaded dice, so to speak?

            Demand answers to your stupid gotchas – maybe you can demand a testable GHE hypothesis into existence, but I doubt it.

            Cheers.

      • 0.001 % of Ga or As impurities in a Si crystal changes its electrical insulating properties drastically by many many orders of magnitude.
        (By the way It’s even because of this property that computers exist and a bunch of idiots can relentlessly post their nonsense here)

        Similarly so do 0.04 % of CO2 in air change its “thermal insulating” properties in a drastic way.

        • Gordon Robertson says:

          Idiot…”0.001 % of Ga or As impurities in a Si crystal changes its electrical insulating properties drastically …”

          You are a bit turned around here and it’s not your day, you have run into an expert on doping in semiconductors. The doping concentration is 10^13 atoms/cc to 10^18 atoms/cc, hardly trivial.

          The doped semiconductor has an impurity introduced as an atom with an excess of electrons OR with a lack of electrons. If the donor impurity has an excess, the silicon slab has an excess of electrons and is an N-type. If the opposite, it is a P-type.

          Shall I go on about joining an N type to a P type to form a diode? I could go into potential hills and all that.

          I will tell you the donor atoms to which you refer have nothing whatsoever to do with insulation. They affect conduction of electrons through silicon. Some people like to imagine P type silicon as having holes carrying current but they are as confused as you on 0.04% CO2 in the atmosphere.

          • Tim Folkerts says:

            Since you brought it up ….

            1 cc of Si = 2.3 g = 0.08 moles = 5 x 10^22 atoms

            Doping in the range of 10^13 to 10^18 corresponds to between 0.00000002% and 0.002% of the total atoms. In other words, the original claim that 0.001% can have large impacts was spot on — it is right near the top of the scale for doping that you yourself provided. And while you are claiming now that 0.002% or even 0.00000002% is “hardly trivial”, you dismiss CO2 @ 20x larger concentration as too small to matter.

            In fact, the concentration of CO2 in the atmosphere is around 10^16 molecules/cm^2. So by your own words, CO2 is “hardly trivial”!

        • One of the idiots readily shows up and blabbers

          The doping concentration is 10^13 atoms/cc to 10^18 atoms/cc,…

          That’s not even wrong, yet (for the idiots) this is nothing but 10^-7 % to 10^-2 % or 0;0000001 % to 0.01 % (atomic percent). In other words only one out of 10^4 to 10^9 Si atoms is replaced with a Ga or an As atom

          If that’s is

          hardly trivial

          according to the idiots

          then 0.04 % of CO2 or 1 molecule of CO2 out of 250 000 air molecules is hardly trivial either.

          Hilarious !

  32. barry says:

    gbakie said:

    If remains at .2 until Dec 2018, we will have returned to the Pause.

    This is nonsense.

    gbakie must have a peculiar definition of ‘pause’ here.

    The linear trend since 1998 will remain positive even if every month to December is at -0.6C

    It would go negative if every month from next month was at -0.7C

    • barry says:

      Which would be a monthly cold anomaly never before reached in the UAH record – for the next 7 months.

    • gbaikie says:

      “The linear trend since 1998 will remain positive even if every month to December is at -0.6C”

      If that happens, I would say, Salvatore Del Prete is correct.
      I would guess he is not predicting this much cooling.

      • Snape says:

        I think I’ve found a photo of Flynn’s home in the outback. Looks very hot. It’s no wonder he’s not familiar with blankets!

        http://outpoll.com/australian-outback-landscape-no-water.jpg

        • Mike Flynn says:

          S,

          I haven’t looked at your link, but I would be fairly sure that it does not show a copy of the still missing testable GHE hypothesis!

          I would guess it relates to the usual attempts by the stupid and ignorant to avoid discussing the purported indescribable GHE. Would I be right?

          How is the pseudoscientific avoidance strategy working out for you?

          Cheers.

          • Snape says:

            Mike

            You should look at the picture to see if I’m right. I promise it’s not a cave.

          • Snape says:

            ……..or a burrow.

          • Mike Flynn says:

            S,

            Why should I do anything just because some stupid and ignorant person says I should?

            Would you?

            Cheers.

          • Snape says:

            Mike
            Some people think John Tyndall
            discovered the GHE. Others think it may have been Edith Foote. What say you?

            http://rabett.blogspot.com/?m=1

          • Mike Flynn says:

            S,

            Considering nobody at all can actually describe the GHE in any sensible way, it has not yet been “discovered” by anybody.

            Read Tyndall’s experiments for yourself. Then figure out why only somebody really stupid and ignorant would claim that reducing the amount of energy reaching a thermometer would raise its temperature! Tyndall reached the conclusion from measurements that around 35% of the Sun’s energy doesn’t even get to the surface. NASA’s figure is very similar. Clever chap, Tyndall.

            Any gas can be heated to any temperature – compression is one easy method. Or do you believe that oxygen and nitrogen can neither be heated or cooled? Read Tyndall again. He even measured the proportions – and pointed out that 9996

            Still no GHE. The Earth has cooled over the last four and a half billion years. Don’t believe it if you don’t want to. Nature doesn’t care, and neither do I. Why should we?

            Cheers.

          • Snape says:

            Mike

            So you think Edith Foote discovered the GHE? That surprises me. I thought you were a big admirer of Tyndall.

          • Mike Flynn says:

            S,

            Why would I think anyone could discover something which cannot even be described?

            Certainly, neither you nor any of your fellow travellers can do other than try and fantasise such a thing into existence, by devout wishful thinking.

            Alas, still no GHE, is there? Where may it be observed? Has it been reproduced, perhaps, or measured?

            As to Tyndall, you are obviously either incapable or unwilling to actually read and absorb Tyndall’s excellent work. Just like the usual second rate fumbling bumblers, you just parrot what some other stupid and ignorant pseudoscientific wannabe tells you. It wouldn’t occur to you to think for yourself.

            Not my problem of course. Nor anyone else’s who takes the trouble to check foolish Warmist assertions. You probably don’t even believe that Fourier decided his early speculations about the atmosphere were wrong, after becoming aware of experimental work which he verified for himself.

            Keep believing on the GHE, the ether, unicorns and hobgoblins, if you think it is to your advantage. Many do.

            Cheers.

          • Snape says:

            Mike

            We need to find some common ground. Both of us agree that when a thermometer is placed between Earth’s surface and the icy depths of space, and add CO2, the thermometer will get hotter.

            The question is, who came to this conclusion first, Tyndall or Foote?

          • Snape says:

            Ooops, that was a bumbling fumble for sure. I should have said:

            “We both agree that if you add CO2 to the air between a thermometer on Earth’s surface and the icy depths of space, the thermometer will get hotter.”

          • Mike Flynn says:

            S,

            You can agree with yourself all you like. There is no point in expecting me to participate in your fantasy, you are doing fine by yourself.

            If you really believe that reducing the amount of insolation makes thermometers hotter, you are quite mad.

            The Moon shows how hot thermometers get without atmosphere. If you can manage to make a thermometer hotter by the magic of CO2, go ahead.

            Read Tyndall. The more CO2 between the heat source and the thermometer, the more the temperature drops. Some materials make it drop more, some less. The only truly energy transparent “medium” is a vacuum – in other words, nothing at all to impede transmission.

            I know you are too stupid and ignorant to accept real science, but other readers may be gullible enough to believe you, rather than thinking and enquiring for themselves.

            As to adding CO2 between the surface and the icy depths of space, I can only assume you think that a reduction in the rate of cooling is heating! Madness – dropping temperatures do not raise temperatures. That is delusional climatological thinking – the sort of nonsense that people like Schmidt, Mann, and all the rest of the madly capering climate clowns, put about.

            Sad.

            Cheers.

          • Snape says:

            You still haven’t told me which of the two you think discovered the GHE.

          • Mike Flynn says:

            S,

            You still haven’t managed to say what you believe the GHE to be. Rather difficult to discover something nobody has actually managed to describe, wouldnt you say?

            Maybe you could name someone who believes they can describe the GHE, if you can.

            How hard could it be? Do you believe it can be done? Do you believe that there is some sort of special effect concerned with greenhouses that needs description? Why would that be?

            Are you really stupid enough to believe that greenhouses were not nown in Roman times? Why are you obsessed with greenhouses? Questions, questions. You haven’t got any answers, because you are stupid, ignorant and lazy.

            Answer your own questions. Don’t expect me to do your work for you because you are incompetent!

            Learn physics – all will become clear, if you have any intelligence at all.

            Cheers.

          • Snape says:

            “You still havent managed to say what you believe the GHE to be. Rather difficult to discover something nobody has actually managed to describe, wouldnt you say?”

            If you think a proper description is lacking you should put forth your own version.

            In the meantime, stop making excuses and answer the question. Tyndall or Foote?

          • David Appell says:

            It was Fourier who discovered the GHE.

          • Snape says:

            David

            Just messing around with Flynn.

          • Mike Flynn says:

            S,

            You keep on with the gotchas, dont you? Demanding that I specify which person discovered something that doesn’t exist!

            I suppose you could put a more stupid and ignorant pointless demand, but I can’t think of one just now.

            You wrote –

            “If you think a proper description is lacking you should put forth your own version.

            Dont be stupid. Why should I attempt to describe the non-existent? You claim something exists, but you can’t actually describe it, you say. You then demand I answer a particularly inept gotcha.

            No. Why should I? You dug yourself into this particular hole – you dig yourself out.

            Still no non-existent and non-describable GHE, is there? Be my guest – fire off another stupid gotcha, or have a tantrum – I dont care one way or the other.

            Cheers.

          • Snape says:

            Mike

            You’re being very wishy washy. It’s either one or the other……shouldn’t be that hard.

            If you’re unable to make up your mind then, by default, I’ll put you down for Tyndall.

          • Mike Flynn says:

            DA,

            And how would you describe this GHE that Fourier discovered? You disbelieve his later writings in which he stated that his earlier speculations were incorrect?

            And no, you can look it up for yourself, if you are interested. Why should I do your investigating for you?

            Cheers.

          • Mike Flynn says:

            S,

            You may do as you wish, of course – I have no control over the vagaries of your delusional thinking. You may put yourself down for a Nobel Prize (like Michael Mann) if you wish. You might even put yourself down as a climate scientist (like the mathematician Gavin Schmidt).

            Have you considered just putting yourself down?

            That might save you future embarrassment.

            Cheers.

          • Snape says:

            Mike

            A nobel prize would be amazing. How about a Mt. Rushmore for climate science? Trenberth, Mann, Tyndall and Snape.

      • barry says:

        If that happens, I would say, Salvatore Del Prete is correct.
        I would guess he is not predicting this much cooling.

        Changing the subject is always an option, gbakie.

        There will be no ‘return to the pause’ for the next few years, if ever.

      • Sal could not predict what he is going to have for dinner tonight.

    • Gordon Robertson says:

      barry…”gbakie must have a peculiar definition of pause here”.

      You’re the one with the problem here. I’m sure gbaikie is going on the pause declared by the IPCC in 2013 from 1998 – 2012.

      • barry says:

        He said it would ‘return’ by the end of the year if temps remain at 0.2C for the rest of the year. That won’t even get close to a ‘pause’ from 1998, so his definition must be quite different to that of the IPCC.

        But you don’t care about the details of the discussion. You just wanted to mention the IPCC and’pause’ again. You’re such a phony.

      • gbaikie says:

        Yeah.
        If it averages .2 C to end of year, then next year averages -.6 C, that would be very bad.

      • David Appell says:

        Gordon Robertson says:
        Youre the one with the problem here. Im sure gbaikie is going on the pause declared by the IPCC in 2013 from 1998 2012.

        Look, suddenly the data is good enough for Gordon to cite. I thought NO.AA was fudging the data, Gordon?

        Which is it? Whichever suits your needs?

    • goldminor says:

      The linear trend though is deceptive, imo. in that CO2 has increased approximately 72 ppm over the length of the trend. So what it is that CO2 is supposed to be doing? One would think that adding half as much again from the original 280 ppm should be pushing the end point higher than what we now see.

      • David Appell says:

        Why would one think that?

        • goldminor says:

          Taking the entire satellite record and looking at the linear trend as of this month, we can see that the temp change now sits at 0.5C over the 39 years depicted. Only part of that can be inferred to caused by CO2 increases in the atmosphere.

          Let us say that half of the warming seen in the last 39 years is from CO2. That then means that an additional 72 ppm of CO2 has caused 0.25C of the warming seen on the UAH temp graph.warming. If that is carried forward in time until our fossil fuels supply diminishes at about 560 ppm total content, as I have heard some state, then there will only be another 0.6C rise in temps by early next century. That would be assuming that the overall Warm Period does not slide back into the next Cool Period by then.

          • David Appell says:

            Bad calculation. Ignores CO2’s logarithmic forcing, and it ignores feedbacks.

          • Mike Flynn says:

            Bad calculation sez the guy who believes that increasing the amount of CO2 between the Sun and the surface makes the surface hotter!

            Bad thinking, David. Bad thinking.

            Cheers.

          • goldminor says:

            @ DA …CO2’s ability to warm diminishes as it increases. Is that the logarithmic function you are thinking about?

          • David Appell says:

            Yes.

            But it’s then that positive feedbacks kick in.

          • goldminor says:

            @ DA …only in your dreams. Can you point to any sign of a positive feedback in today’s world? Of course you can’t, or it would already be visible for all to see. Your logical abilities are not impressive at all.

          • Nate says:

            An obvious one is arctic ice albedo feedback. The effect of more open ocean is seen in more absorbed solar energy, as detected from space.

          • goldminor says:

            @ Nate …by what mechanism does CO2 melt arctic sea ice? Even so your reasoning is weak. The ability for the Sun’s rays to warm the Arctic Ocean are minimal due to the angle at which solar energy strikes the arctic region. On top of that it is only for 4 months a year where the slight impact would be of any consequence. After that, it is all heat going out to space, when there is more open waters.

      • Ebbets Field says:

        goldm – Except you’re not adding 72 ppm to 280 ppm from 39 years, you’re adding 72 ppm to the 338 ppm of 39 years ago, not the 280 of two centuries ago. So the end point is higher for troposphere warming.

    • Kristian says:

      barry says, May 2, 2018 at 3:46 PM:

      gbakie said:

      If remains at .2 until Dec 2018, we will have returned to the Pause.

      This is nonsense.

      gbakie must have a peculiar definition of ‘pause’ here.

      The linear trend since 1998 will remain positive even if every month to December is at -0.6C

      This isn’t nonsense, barry. It is more or less correct. This pertains directly to the whole ‘actual data vs. linear trend line’ issue.

      If the data returns to the same mean level it hovered around between 2001/2002 – 2006/2007 (5 1/2 years) and 2014 – 2015 (1 1/2 year), about +0.2K above the 1981-2010 normal, there has been no overall rise in the mean level of the DATA itself. Of course, it’s still way too soon to tell whether this is in fact going to happen or not … But that’s a different matter.

      https://okulaer.files.wordpress.com/2018/05/uahv6-gl-tlt-nivc3a5.png

      A statistically generated linear trend line across the data, however, would naturally show a rather pronounced incline. Mostly simply because of ENSO amplitudes. But such a trend line would ignore the MEAN LEVEL of the data. And by ‘mean level’, I mean those parts of the data series that aren’t clearly affected by major ENSO amplitudes (large-scale noise).

      Now, I’ll be the first to admit that the period post 2016 (basically, 2017) very much appears to be elevated above the 2001-2015 mean level, by 0.1+ degrees. But I’d give it a year or three more before concluding on it with anything resembling absolute certainty.

      • barry says:

        This pertains directly to the whole ‘actual data vs. linear trend line’ issue.

        No. It certainly does not.

        When people talk about THE pause (note the definite article), they are referring to, as Gordon pointed out, the LINEAR trend since 1998. This is a canonical item.

        This is why I said gbakie has a peculiar notion about “THE pause.” The linear trend does not nearly go flat under the conditions he described.

        If gbakie meant something else by THE pause, he furnished no alternative ideas.

        • gbaikie says:

          “barry says:
          May 3, 2018 at 5:02 AM
          This pertains directly to the whole actual data vs. linear trend line issue.

          No. It certainly does not. ”

          Kristain is referring to what he discuss above in this thread.
          And yes it certainly does.

          Roy Spencer said:
          “The linear temperature trend of the global average lower tropospheric temperature anomalies from January 1979 through April 2018 remains at +0.13 C/decade.”
          And if it is + .2 C to Dec, Roy will say:
          The linear temperature trend of the global average lower tropospheric temperature anomalies from January 1979 through Dec 2018 remains at +0.13 C/decade.
          Or 1/2 year or a year don’t have much affect on 40 years.
          But Roy drawn red line, would go down. But Roy has said that red line does not matter very much.
          And if temperatures drop as Barry said by -.6 C thru Dec, it still would be
          Roy saying:
          The linear temperature trend of the global average lower tropospheric temperature anomalies from January 1979 through Dec 2018 remains at +0.13 C/decade.Dec

          Though it will crash the red line.
          And Roy will think something has gone wrong with his satellite instruments. As it would be unexpected.
          But if real, it means something.

          • David Appell says:

            gbalkie: do you know a trend line is? and how it’s calculated?

          • Mike Flynn says:

            DA,

            Do you what a trend line is? Or how it is calculated?

            Do you?

            Cheers.

          • ren says:

            There is no trend at global temperature. It changes depending on many factors, eg the ENSO cycle. The temperature is only real time.
            What about the fact that during El Nino winter in America is warm, when a year later it can be record cold.

          • David Appell says:

            Wrong, ren. Sorry. UAH says their trend is +0.13 C/decade.

  33. Gordon Robertson says:

    binny…”There is no reason at all for you to solely trust in UAHs time series”.

    Of course there is. UAH is the only series that is not fudged.

    I suspect that NOAA is intercepting the sat data and feeding UAH doctored data. It is NOAA sats UAH use for their data.

    • E. Swanson says:

      Gordo, No the UAH data is interpolated over the poles, as the scans don’t extend that far poleward. Of course, there are the corrections for satellite decay and drift of LECT, which must be made to connect data from some 13 different satellites. There are also other issues, such as the NOAA 9 warm target problem, the heating and cooling of the instruments as they progress from sunlight to dark, etc.

      Of course, you can dwell in paranoid fantasies all you want.

      • Gordon Robertson says:

        swannie…”Of course, you can dwell in paranoid fantasies all you want”.

        Do you call it a paranoid fantasies when NOAA proclaimed 2014 the hottest year in the temperature record using a confidence level of 48%? 2014 was not even withing 0.6C of 1998 or within 0.35 of 2010. They got rid of the difference by lowering the confidence level in half.

        I call that scientific misconduct. GISS was even worse, using a CL of 38%.

        Or when they retroactively fudged the temperatures post 1998 to a show a trend after extensive research by the IPCC showed a warming hiatus?

        Do you think it’s paranoia when NOAA erases the US record in 1934, because they thought it must be wrong given the AGW theory? Do you think it is paranoia when NOAA slashes over 75% of their real surface stations and uses less than 25% to SYNTHESIZE the slashed temperatures in a model?

        If so, you have a strange way of doing science. Of course, I already knew that the way you overturned the 2nd law.

        You should apply for work at NOAA or GISS.

        • David Appell says:

          Gordon Robertson says:
          Do you call it a paranoid fantasies when NOAA proclaimed 2014 the hottest year in the temperature record using a confidence level of 48%?

          For the Nth time, it wasn’t a confidence interval, it was a probability. Probably you don’t know the difference.

          ALL such reports will have such probabilities associated with them, because the measured numbers have error bars. ALL numbers in science have error bars, meaning all calculated results have error bars. Not to include the uncertainties and probabilities would be bad science.

          • Gordon Robertson says:

            DA…”For the Nth time, it wasnt a confidence interval, it was a probability. Probably you dont know the difference”.

            I call your POV splitting hairs. Probability, confidence, same thing.

            Why would anyone be so deceitful as to push a year into first place by claiming there is a 48% probability it was the warmest year? Especially when that year was half a degree cooler than 1998.

            Only an alarmist charlatan would have such an interest. Ditto for anyone supporting that scientific misconduct.

          • David Appell says:

            Gordon Robertson says:
            I call your POV splitting hairs. Probability, confidence, same thing.

            Dumb. No they aren’t.

            Go learn something for a change.

          • David Appell says:

            Gordon Robertson says:
            Why would anyone be so deceitful as to push a year into first place by claiming there is a 48% probability it was the warmest year? Especially when that year was half a degree cooler than 1998.

            What data shows it was cooler?

          • David Appell says:

            Gordon? What data shows it was cooler?

        • David Appell says:

          Gordon Robertson says:
          Do you call it a paranoid fantasies when NO.AA proclaimed 2014 the hottest year in the temperature record using a confidence level of 48%? 2014 was not even withing 0.6C of 1998 or within 0.35 of 2010.

          That’s a whopper of a lie, Gordon.

          NO.AA global average surface temperature anomaly:

          1998: +0.63 C
          2010: +0.70 C
          2014: +0.74 C

          Your lie is also absurd on the face of it – no one is going to claim a record year if it’s 0.6 C below another year! Shame on you.

          data:
          https://tinyurl.com/n2twzcm

          • Gordon Robertson says:

            DA…”NO.AA global average surface temperature anomaly:

            1998: +0.63 C
            2010: +0.70 C
            2014: +0.74 C”

            Like I said, NOAA are stinking liars.

            UAH has 1998 peaking at 0.75C with an average at 0.45C. They have 2010 peaking at 0.5C with an average just over 0.3C and 2014 with a peak of 0.2C with an average around 0.15C.

            On average, 2014 is 0.3C cooler than 1998….not even close.

            Time you opened your eyes and saw the outright cheating of NOAA and GISS. They are climate alarmists and have no business doing science…not that they do any anyway.

            Besides, the IPCC declared a warming hiatus from 1998 – 2012. UAH shows an apparent continuance of that flat trend through 2015. 2014 is within a flat trend area. No average warming.

            NOAA shows a significant trend and that makes them damned liars. They created that trend by retroactively fudging the record.

          • David Appell says:

            UAH and NO.AA aren’t measuring the same thing, Einstein.

          • David Appell says:

            Gordon Robertson says:
            NOAA shows a significant trend and that makes them damned liars. They created that trend by retroactively fudging the record.

            As a sometimes-journalist I would LOVE to have evidence that NO.AA is “fudging the record.”

            Please provide your evidence. Or email me directly, via davidappell.com

    • Snape says:

      “I suspect that NOAA is intercepting the sat data and feeding UAH doctored data.”

      We should notify Inspector Clouseau!

      • Gordon Robertson says:

        snape…”I suspect that NOAA is intercepting the sat data and feeding UAH doctored data.

        We should notify Inspector Clouseau!”

        ********

        That’s actually brilliant, it explains everything. NOAA is now run by Inspector Clouseau and GISS by Dumb and Dumber.

    • Norman says:

      Gordon Robertson

      YOU: “I suspect that NOAA is intercepting the sat data and feeding UAH doctored data. It is NOAA sats UAH use for their data.”

      Why do you suspect that? Is it because you are such a dishonest person you see everyone around as having the same corrupt dishonest behavior? You make up stuff constantly. You intentionally try to deceive people with long posts that have horrible and false physics in them. Many people have worked to correct your many flawed ideas but you completely ignore them and post the very same garbage on the next available thread pretending that no one challenged your nonsense.

      I think you are intentionally dishonest so you see the world through this lens. You accuse everyone but yourself of corruption and dishonest behavior. I see this sort of behavior in you.

      • Gordon Robertson says:

        norman…”Why do you suspect that?”

        Is it not obvious? The UAH record has hung up there despite serious cold the last couple of winter’s in the Northern Hemisphere.

        Look how far 2008 dipped below the baseline. I don’t recall 2008 being any colder than last winter. In fact, we set records last winter in the NH.

        Right now, we should be at the baseline or below.

        Thanks for bringing that up, now I’m convinced NOAA is feeding UAH fudged data.

        • David Appell says:

          So you think Roy is happy to use fudged data?

          • Mike Flynn says:

            DA,

            Why would you think that?

            Cheers.

          • Gordon Robertson says:

            DA…”So you think Roy is happy to use fudged data?”

            I have no idea what Roy thinks and even if he suspected NOAA is giving him bad data it would not be in his best interest to say so.

            NOAA is currently being investigated for data tampering. Maybe that will come out in the investigation.

          • David Appell says:

            Gordon Robertson says:
            I have no idea what Roy thinks and even if he suspected NOAA is giving him bad data it would not be in his best interest to say so.

            So you think you know more about the data than Roy does.

          • David Appell says:

            Gordon Robertson says:
            NOAA is currently being investigated for data tampering.

            By a climate change denier who answers to fossil fuel interests.

    • David Appell says:

      Gordon Robertson says:
      I suspect that NOAA is intercepting the sat data and feeding UAH doctored data. It is NOAA sats UAH use for their data.

      Pathetic.

      You are happy to quote the data when it suits your needs — IPCC’s pause, UAH’s pause, etc.

      You accusation has no evidence and no truth to it whatsoever. It’s amazing you can’t see how pathetic it is you keep repeating this.

      • Gordon Robertson says:

        DA…”You are happy to quote the data when it suits your needs IPCCs pause, UAHs pause, etc.”

        The IPCC got its data re the pause from Had-crut. Even NOAA showed the pause at one time.

        Why do you alarmists sit around praising that load of charlatans?

        • David Appell says:

          False, Gordon, it came from 5 datasets, including NO.AA.

          You have zero evidence of anything untoward. Shame on you for repeating this many times. Says.a lot about your morals and ethics.

          • Gordon Robertson says:

            DA…”You have zero evidence of anything untoward.”

            How many times do I have to reveal it to you?

            1)NOAA admitted to slashing over 75% of its reporting stations. It has been revealed that NOAA uses less than 25% of the real data in a climate model to manufacture the stations they slashed. In doing so they omit cooler stations and fudge the data statistically to show the cooler stations at a warmer temperature.

            2)NOAA reduces confidence levels to make recent years appear as the warmest year when they are not even close.

            3)NOAA has eliminated the 1934 record in the US for the warmest year.

            NOAA are cheats!!! Data fudgers!!!

          • David Appell says:

            Gordon Robertson says:
            “1)NOAA admitted to slashing over 75% of its reporting stations.”

            So what?

            How does that affect their numbers for GMST?

          • David Appell says:

            Gordon Robertson says:
            2)NOAA reduces confidence levels to make recent years appear as the warmest year when they are not even close.

            You still don’t know what a confidence interval is, and don’t understand how to compare warmest years.

            And you show no willingness to learn.

          • David Appell says:

            Gordon Robertson says:
            3)NOAA has eliminated the 1934 record in the US for the warmest year.

            Eliminated how? Because recent years have been warmer? That’s science, not “elimination.”

    • David Appell says:

      Gordon Robertson says:
      I suspect that NO.AA is intercepting the sat data and feeding UAH doctored data. It is NO.AA sats UAH use for their data.

      Pathetic.

      You are happy to quote the data when it suits your needs — IPCC’s pause, UAH’s pause, etc.

      You accusation has no evidence and no truth to it whatsoever. It’s amazing you can’t see how pathetic it is you keep repeating this.

    • Bindidon says:

      Gordon Robertson says:
      May 2, 2018 at 7:04 PM

      I suspect that NOAA is intercepting the sat data and feeding UAH doctored data. It is NOAA sats UAH use for their data.

      How ignorant, unscientific, dumb and paranoid is one allowed to be in life, Robertson?

      You are so dumb and so paranoid that you even don’t think you are insulting Roy Spencer here.

      How can you even imagine that this man would accept to use ‘doctored data’, let alone that he wouldn’t have discovered it long time before you greatest genius evah start insinuating it?

      • Gordon Robertson says:

        binny…”How ignorant, unscientific, dumb and paranoid is one allowed to be in life, Robertson?”

        This coming from someone who disappeared in a snit from the blog, saying good-bye, then re-appearing a few days later as La Pagolina. Then claiming they are friends. Anyone who fabricates a scenario like that is a few planks short of a load.

        Come on, are we supposed to be that stupid? La Pag has exactly the same personality as binny, argues the same, and has a memory of my insults toward him/her/it.

        And you call me paranoid and ignorant???

  34. Joe Rancourt says:

    I see the same name calling from multiple view points on this site and sites that see the situation as dire (eg Skeptical…) Its interesting, actually comical, that each month’s posting of average temperature starts the same rounds of largely the same arguments and definitely the same name calling. Like you wait for this day to repeat.

    • Bindidon says:

      What is really surprising, Joe Rancourt, is that people like you feel the need to teach us about that.

    • Bond says:

      Sad that someone would attack a request for sanity to prevail. This site has the ugly smell of Youtube.

      • Mike Flynn says:

        B,

        If you don’t like the smell, would itbe rational to either hold your nose or waft off to some sweeter smelling spot, do you think?

        What does Youtube smell like? Can you throw a few more irrelevancies in for the general amusement of all?

        Keep it up!

        Cheers.

    • goldminor says:

      @ Jie …they must spend the rest of the month in a state of depression.

  35. ren says:

    The temperature at the equatorial Pacific falls.
    http://images.tinypic.pl/i/00964/53p5j01cskju.png

  36. Laura says:

    “The linear temperature trend of the global average lower tropospheric temperature anomalies from January 1979 through April 2018 remains at +0.13 C/decade.”

    Peculiar thing. Thank you for the update, Dr. Spencer.

    • David Appell says:

      Short-term change is natural variability, not climate.

      • goldminor says:

        @ DA … that is part of the climate. The two are inseparable. The only thing is that one can not say with even a low confidence what inferences may be drawn from what 4 months means on that graph. That does not mean that there is zero value to the graph. It would be better for several years of the graph to be shown. Then some small level of interpretation may be derived.

        • David Appell says:

          Four months doesnt say anything about climate.

          Climate is the 30-year average of weather, perhaps longer.

          • goldminor says:

            Didn’t I just state that myself? Is part of your brain out of order this morning?

          • Gordon Robertson says:

            goldminor…”Didnt I just state that myself? Is part of your brain out of order this morning?”

            That’s the natural state of DA’s mind…out of order.

        • Bond says:

          Climate is the baseline. We are seeing variations about the baseline. That is not climate. In fact, the entire visible graph is a variation on the climate baseline, due to La Nina conditions.

          • Gordon Robertson says:

            bond…”Climate is the baseline”.

            Climate is not a precise number, it is a subjective generalization of average weather over the long term. The baseline on the UAH graph tells you nothing about climate.

          • David Appell says:

            Averages aren’t “subjective.”

          • Mike Flynn says:

            DA,

            Not subjective?

            Describe the climate of California in measurable objective terms. Climate is just an average, isn’t it?

            Oh, you can’t?

            What a pity!

            Cheers.

          • David Appell says:

            If fact, we’re seeing increases above the baseline.

          • Bond says:

            I am not using “baseline” in the 1981-2010 or “twentieth century average” sense. The earth has a baseline climate right now from which daily weather deviates. In that sense, today’s climate can’t be above the baseline. Only weather can be above or below that baseline. What is that baseline? Going by the UAH trend, around +0.29C globally.

    • Laura says:

      Come on now.

      “The jet stream will be wilder. There will be more wild temperature changes, more hail events, more earthquakes, more extreme volcano events, more snow in winters, lousy summers, late springs, short autumns, and more and more crop failures.”

      More earthquakes and extreme volcano eruptions?

      Is there really a need for more criminal delusion than the truckload we get daily from the antihuman climate alarmists?

    • gbaikie says:

      What indicates a Maunder rather then a something like Dalton minimum?
      Maunder lasted about 100 years, why couldn’t the return to modern maximum type cycles within say 30 years.

      And if it is the same or worse than Maunder, what evidence indicates there was a sudden climatic reaction to Maunder minimum?

      I tend to think we will get evidence of cooling, before we get it. And I applied similar guideline in regards to “global warming”. Didn’t see any evidence of earth becoming like Venus, nor have not seen signs of Earth becoming like Pluto.

      • David Appell says:

        This exact question was studied a few years ago by Feulner and Rahmstorf (GRL 2009), Song et al (GRL 2010) and Jones et al (JGR 2012), and it was found that anthropogenic greenhouse gas warming easily swamps any cooling from a Maunder Minimum-like sun. Cooling by 2100 would only be, at most, 0.3 C below IPCC projections. We will not be entering another Little Ice Age.

        “On the effect of a new grand minimum of solar activity on the future climate on Earth,” G. Fuelner and S. Rahmstorf, Geo Res Lett vol. 37, L05707 2010.
        http://www.pik-potsdam.de/~stefan/Publications/Journals/feulner_rahmstorf_2010.pdf

        “Increased greenhouse gases enhance regional climate response to a
        Maunder Minimum,” Song et al, Geo Res Lett vol. 37, L01703 (2010)
        http://www-cirrus.ucsd.edu/~zhang/PDFs/Song_et_al-2010.pdf

        “What influence will future solar activity changes over the 21st century have on projected global near-surface temperature changes?” Gareth S. Jones, et al, JGR v 117, D05103 (2012) doi:10.1029/2011JD017013, 2012.
        http://www.leif.org/EOS/2011JD017013.pdf

        See also:
        http://www.skepticalscience.com/what-would-happen-if-the-sun-fell-to-maunder-minimum-levels.html

        • Gordon Robertson says:

          DA…”This exact question was studied a few years ago by Feulner and Rahmstorf….”

          Rahmstorf seems awfully confused to me. I think you should refrain from quoting him.

        • PhilJ says:

          Wow, theyre all gonna have egg on their faces

        • gbaikie says:

          “…it was found that anthropogenic greenhouse gas warming easily swamps any cooling from a Maunder Minimum-like sun. Cooling by 2100 would only be, at most, 0.3 C below IPCC projections. ”

          9 years ago in middle of depth of solar min, we didn’t enter a Maunder Minimum, and as we are entering this solar min, it seems not likely we will.
          A main problem with paper is they expected a lot warming which has not made itself apparent and is very unlikely to occur.

          And if we to get decades of this lower solar activity, it seems we might get somewhere around .3 C cooling.
          But in terms of within a couple years from now, it seems to me more about weather, rather than global temperatures.

          If we get a century of this lower solar activity or something like decades of a constant spotless sun (or something like Maunder) seems unlikely we will return to the Little Ice Age conditions, but we might be looking like we are going in that direction.

      • Gordon Robertson says:

        gbaikie…”nor have not seen signs of Earth becoming like Pluto”.

        I want to see Pluto re-instated as a planet. I think it’s discriminatory that Pluto has been excluded. If we become like Pluto we’ll be de-classified as well.

    • Gordon Robertson says:

      Salavatore…”Correct”.

      Damning evidence to support your theory, Salvatore. Not looking forward to a mini Ice Age but I’ll suffer it gladly to get rid of this AGW nonsense.

      Unfortunately, the alarmists are already gearing up. One in the video was quoted as claiming the Ice Age will give us time to fix up our environment, likely meaning the same old, same old.

      Politicians won’t let go of the present cash cow vis-a-vis carbon taxes and they’ll keep at it till they are booted from office by people freezing.

  37. swampgator says:

    LaPangolina,

    but “you cant choose as baseline an averaging period outside of the period you have measured. That makes no sense, as there are no absolute values you could construct your averages out of.”

    So if I understand your position, the satellite record we can trust as absolute values, but NOT any of the other previous values per satellite era? I would actually be OK with this notion so long as we only look at that very short time period to compare global temperature anomalies. This is however exactly what is NOT being done.

    https://www.climate.gov/sites/default/files/CaG_GlobalTempAnom_1.jpg

    Nasa graph looks similar to NOAA

    You can’t simply pick and choose methods that match your fancy.

    • Mike Flynn says:

      S,

      I can’t help myself.

      You wrote – “You cant simply pick and choose methods that match your fancy.”

      /humour on

      She can, and she does!

      /humour off

      Cheers.

    • David Appell says:

      Swamp: LaP is right about baselines.

    • La Pangolina says:

      swampgator says:
      May 3, 2018 at 4:04 PM

      So if I understand your position, the satellite record we can trust as absolute values, but NOT any of the other previous values per satellite era?

      Sorry: I never and never told you that.

      Please remember your own question to Roy Spencer:

      swampgator says:
      May 1, 2018 at 5:21 PM

      In other works in my limited understanding if we chose 1925-1955 as the averaging period the monthly anomalies reported on this blog might be flat or even negative?

      The UAH data is available since december 1978.

      Daily, monthly, yearly nomalies are constructed by subtracting their absolute value from an average of absolute (daily, monthly, yearly) values over a given period.

      How should Mr Spencer manage to make ‘1925-1955 as the averaging period’ when no data exists for that period?

      I don’t understand what you mean here.

      • swampgator says:

        Thanks for the answer. My point is that Dr Spencer does not try and extrapolate current numbers compared to his baseline period vs historical data, but that EVERYONE else does this.
        If NASA is going to use current surface monitoring temps to compare records which THEY have adjusted from RAW data gathered 100 years ago, using completely different instruments and in many cases plugging in fake numbers when raw data numbers are missing, then I think Dr Spencer should do the same, using unadjusted raw temp surface data measurements from 1925 to 1955.
        It would be just as helpful as the data that some here seem to hold sacred.

        This is basically the Gavin Schmidt or Micheal Mann method, and most climate researchers LOVE that. Of course, most climate research is activism masked as science. I see this in my (medical) field as well. People get so convinced of the “rightness” of their position that everything else is ignored. That is why low fat diets were (and still are) pushed as the way to prevent heart disease and diabetes when almost every single RCT
        conducted over the past 50 years has not supported that hypothesis.

        • Gordon Robertson says:

          swampgator…”If NASA is going to use current surface monitoring temps to compare records which THEY have adjusted from RAW data gathered 100 years ago, using completely different instruments and in many cases plugging in fake numbers when raw data numbers are missing, then I think Dr Spencer should do the same, using unadjusted raw temp surface data measurements from 1925 to 1955″.

          Excellent point, but that’s why we skeptics love Roy and John Christy from UAH. They are honest to a tee.

          • David Appell says:

            Reminder: adjustments to the raw data REDUCE the long-term warming trend.

          • Mike Flynn says:

            DA,

            What is your point? Are you suggesting manipulating data to get the result you want – or more strangely – the result you don’t want?

            If you dont believe the raw data, dont use it. Unless you believe in climatology, of course. Then it is fine to torture data, ignore it, substitute it, create it, manufacture it, or generally bend it to your will!

            Off you go and re analyse some data. If you dont like it, make some up.

            Cheers.

          • swampgator says:

            Dave

            In 1999 NOAA concluded that there had been no warming in the US over the past 100 years. Today they have changed their minds. How come?

            It’s because the re-adjusted the data.

          • Bond says:

            swampgator
            Please link to this 1999 claim by NOAA.

          • David Appell says:

            swampgator says:
            In 1999 NOAA concluded that there had been no warming in the US over the past 100 years.

            Can you prove that? Because I very much doubt it, given that there was already an IPCC assessment report (AR1) that reported global warming.

          • Bond says:

            David Appell
            Actually, there had been two IPCC reports by 1999.

          • David Appell says:

            Even better. Thanks.

    • Gordon Robertson says:

      swampgator…”Nasa graph looks similar to NOAA”

      You that be due to the fact that the head of NOAA is on loan from GISS?

      There is no difference between them and now it seems RSS is in bed with both.

      • Myki says:

        Conspiracy arguments are the last refuge of scoundrels.

        • swampgator says:

          Ah, but Ad Hominem is just dandy?

          • Myki says:

            I assume you are referring to posts such as these:
            Gordon:”NOAA is now run by Inspector Clouseau and GISS by Dumb and Dumber.”

        • Gordon Robertson says:

          Myki…”Conspiracy arguments are the last refuge of scoundrels.”

          Are you admitting you are a scoundrel? I had assumed you are misinformed.

          • Myki says:

            I’m not the one inventing conspiracies.

          • David Appell says:

            Gordon is a scoundrel — he invents conspiracies whenever it suits his fancy, such as claiming NO.AA is altering the raw data UAH uses. He has zero proof of this, but is willing to lie anyway.

          • Gordon Robertson says:

            DA…”Gordon is a scoundrel he invents conspiracies …”

            I learned from the great conspiracists: Newton, Clausius, Planck, Bohr, Schrodinger, Pauling, Bohm, Einstein, Feynman….

          • Gordon Robertson says:

            Oh, I forgot: Lindzen, Spencer, Christy…

          • David Appell says:

            WOW, a list of names of scientists.

            How CONVINCING, Gordon.

          • Gordon Robertson says:

            DA…”WOW, a list of names of scientists. How CONVINCING, Gordon”.

            It’s basic logic. If I learned from scientists, and what they taught me made me a conspiracist, then they must be conspiracists.

            At least that’s the logic of alarmists.

            Are you now claiming they are all scientists and that what I am claiming is science?

            Fickle lot, you alarmists.

          • David Appell says:

            You apparentl learned from scientists who lived 100 years ago, and much of their knowledge is now known to be wrong.

            Is there some reason you wont cite the science as its known today?

            I think I already know the answer to that question, but give it your best shot.

          • Gordon Robertson says:

            DA…”You apparentl learned from scientists who lived 100 years ago, and much of their knowledge is now known to be wrong”.

            Only to misinformed alarmists like you who rely on pseudo-science for your catastrophic warming conspiracy theories.

            All the science of which I know from ‘old’ scientists like Newton, Kepler, Fourier, Faraday, Kircheoff, Clausius, Planck, Einstein, Bohr, Schrodinger, Bohm, Feynman, and Pauling is still as applicable today as it was in their day.

            There are a few modernists who think otherwise but they are deluded and wrong.

  38. Myki says:

    Warming? What warming?

    “It Was 122.4F This Week in Pakistan, Probably a World Record for April”
    Even in Pakistan, no stranger to blistering heat, the temperature on Monday stood out: 122.4 degrees Fahrenheit. The reading came from Nawabshah, a city of 1.1 million people in southern Pakistan, and meteorologists say it is the highest temperature ever reliably recorded, anywhere in the world, in the month of April.

    https://www.nytimes.com/2018/05/04/world/asia/pakistan-heat-record.html?module=WatchingPortal&region=c-column-middle-span-region&pgType=Homepage&action=click&mediaId=thumb_square&state=standard&contentPlacement=3&version=internal&contentCollection=www.nytimes.com&contentId=https%3A%2F%2Fwww.nytimes.com%2F2018%2F05%2F04%2Fworld%2Fasia%2Fpakistan-heat-record.html&eventName=Watching-article-click

    • Mike Flynno says:

      M,

      Pathetic. The Lut desert gets much hotter on a regular basis. Solar ponds get over 85 C.

      Undersea vents exceed 400 C.

      Warming? What warming?

      Cheers.

    • Gordon Robertson says:

      Myki…”Warming? What warming?”

      Scoundrel!!!

      • Myki says:

        Yes. I admit it. It took a good deal of effort going to Nawabshah, dodging islamic terrorists, finding the thermometers, and bribing the meteorologists there to alter the readings. I then had to bribe the police who arrested me and then bribe the politicians who would not let me leave. Fortunately Al Gore spoke up on my behalf. All went well since not even the press knew of the plan. Unfortunately I did not reckon on how perceptive you and Mike Flynn are. You two guys are way too smart for me.

        • Mike Flynn says:

          M,

          I presume you have a point, about something, somewhere.

          You are right about one thing – I am way to smart for you. I could challenge you to a battle of wits, but it would be bad form to duel with an unarmed opponent.

          Cheers.

          • Myki says:

            “I am way to smart for you.”
            Yes, way TOO smart.
            Lol

          • Myki says:

            “I could challenge you to a battle of wits, but it would be bad form to duel with an unarmed opponent.”
            Latest score
            TOO smart: zero
            Unarmed opponent: +1

          • Myki: Like everyone else here, you will learn to ignore Mike Flynn. He is someone who gets his jollies by calling people stupid and ignorant. He does this night after night, for reasons no one can fathom. What a hobby, huh?

        • Gordon Robertson says:

          Myki…”Yes. I admit it. It took a good deal of effort going to Nawabshah, dodging islamic terrorists, finding the thermometers, and bribing the meteorologists there to alter the readings”.

          Why would you have to dodge the terrorists? You climate alarmists have similar dogmas don’t you, not mindlessly violent but narrow-minded and propaganda-based? Some of you have even advocated putting skeptics in jail.

          I have put forth an invitation for David Appell to cross over and become a skeptic. The offer is open to you as well. It’s more fun doing real science.

          BTW…you don’t have to bribe alarmist meteorologists, they do it willingly, for ‘The Cause’.

          • David Appell says:

            An invitation to become a skeptic?

            A) You’re not a “skeptic,” Gordon, you’re a “denier.” And a blind & dishonest one at that.

            B) I understand the science. You do not. The science proved AGW at least two decades ago.

          • Myki says:

            “I have put forth an invitation for David Appell to cross over and become a skeptic.”
            Thanks but no. I do not fancy having half my brain removed.

          • Myki says:

            “you dont have to bribe alarmist meteorologists, they do it willingly, for The Cause.”
            My God! You have referred to the holiest of holy crusades. Please do not tell anybody else about it

          • Myki says:

            “Some of you have even advocated putting skeptics in jail.”
            Never!
            When the time comes we have a much worse punishment awaiting you.

          • Gordon Robertson says:

            DA…”I understand the science. You do not. The science proved AGW at least two decades ago”.

            Me and Mike Flynn are still waiting for proof. Not one testable hypothesis.

          • Gordon Robertson says:

            Myki….”When the time comes we have a much worse punishment awaiting you”.

            Thought police. Just like your terrorist brethern.

          • David Appell says:

            Gordon Robertson says:
            “Me and Mike Flynn are still waiting for proof. Not one testable hypothesis.”

            Give us a hypothesis that would meet your oh-so-exacting standards.

            How about, “The GHE reduces that amount of OLR that escapes Earth.”

            How about, “The GHE keeps the Earth’s average surface warmer than could be caused by the Sun.”

  39. ren says:

    Antarctica Concordia Station

    Now
    -69 °C

    Snow flurries. Sunny.
    Feels Like: -85 °C
    https://www.timeanddate.com/weather/antarctica/concordia-station/ext

      • ren says:

        Temperature anomaly in Antarctica -0.9 C.
        http://images.tinypic.pl/i/00964/45acz4xlob4b.png

      • Gordon Robertson says:

        bond…”Antarctica Carlini Station

        Now
        -2C”

        *********

        More alarmist propaganda. Carlini station is on the Antarctic Peninsula close to South America and surrounded by ocean.

        • David Appell says:

          Gordon doesn’t believe any data unless they are useful to his ideology and rotten science.

          • Gordon Robertson says:

            DA…”Gordon doesnt believe any data unless they are useful to his ideology and rotten science”.

            I did not say I did not believe the data at the Carlini station I simply pointed out that it is a notoriously warm part of Antarctica that is closer to the southern tip of South America than the continental centre. Mind you, the southern tip of SA, especially the Southern Ocean near the Cape is no picnic.

            Temperatures near Carlini are what alarmist use to infer warming in Antarctica. Mann and Stieg used those warmer temps to infer warming in Antarctica since 1950.

            It’s not too late for you to cross over and become a skeptic. You have pretty well exhausted all your pseudo-science. Why not try real science, you might like it?

          • David Appell says:

            Gordon Robertson says:
            Temperatures near Carlini are what alarmist use to infer warming in Antarctica.

            They do — just one station?

            I bet you can’t prove that.

          • Bond says:

            GR
            So … you are stating that Carlini itself has warmed then?

          • Gordon Robertson says:

            bond…”GR
            So you are stating that Carlini itself has warmed then?”

            It’s well known that a small part of the Antarctic Peninsula has warmed, but as I pointed out it is significantly north of the Antarctic mainland closer to the tip of South America.

            Whereas the area in question extends beyond the Antarctic Circle, some of the solid mainland touches the Circle. However, the Peninsula is very narrow and surrounded by ocean and it is not known what is causing the warming. It has been theorized warmer ocean currents are responsible but not there is not a shred of evidence the warming is related to CO2 warming.

            The fact that the solid part of the mainland is below average in temperature while some parts of the tip of the Peninsula are above average suggests more of a weather/ocean current-related phenomenon causing the warming.

            Alarmists are so desperate to prove warming in Antarctica they cling to this tiny area of warming while inferring the entire continent has warmed.

        • Bond says:

          Wow – you’re an aggressive sheet aren’t you.

          Average May night time temperature around Concordia: -64
          Reported temperature: -69

          So who is being ‘alarmist’ by trying to impress with low temperatures without indicating that his temperature is nothing special.

          For the record:
          Average May night time temperature around Carlini: -5
          Reported temperature: -2
          So yeah, nothing special there either. But that was my point. If this guy is permitted to impress with unspectacular cold temperatures, then I am permitted to do the same at the other end of the scale.

          • David Appell says:

            Are the temperatures there increasing over recent decades?

          • Bond says:

            Not sure. That wasn’t the point of my response.

          • David Appell says:

            If youre not sure, then find out and get back to us.

          • Bond says:

            I really don’t know what your issue is. I am here to argue FOR anthropogenic climate change. Nothing I have said should suggest otherwise. Here I am telling Gordon Robertson how aggressive he is, and someone who appears to be arguing against him comes at me with even more aggression.

          • I dont care what your view is you need to be more careful with your science

          • Bond says:

            Perhaps you could explain to me how saying:
            “Not sure. That wasnt the point of my response.”
            shows a lack of care with science. If all I am trying to do is show how this person cherry picked an innately cold station and pretend this temperature is exceptional, why would be interested in examining how much its average temperature has warmed or cooled over time? If that interests you so much, why don’t YOU look it up and get back to me instead of being a dick.

          • Gordon Robertson says:

            bond…”So yeah, nothing special there either. But that was my point. If this guy is permitted to impress with unspectacular cold temperatures, then I am permitted to do the same at the other end of the scale”.

            Big difference in contexts. Ren is showing typical cooling in the Antarctic mainland whereas you have cherry-picked a tiny area of warming near the tip of the Peninsula that is prone to warming via ocean currents.

            When polar expert Duncan Wingham, who leans to the alarmist side, was asked in an interview whether glaciers were melting on the mainland, he replied that it is far to cold on the mainland for glaciers to melt.

          • Gordon Robertson says:

            bond…”If all I am trying to do is show how this person cherry picked an innately cold station…”

            Ren was not cherry-picking, he was demonstrating typical temperatures for Antarctica. Yours was the cherry-pick. The -0.2C is typical for only a very small section at the tip of the Antarctica Penisula.

            With regard to aggressiveness on my part, I was not reacting to you personally, only to the typical cherry-pick used by alarmists regarding Antarctic temperatures. You’ll find that most alarmist scientists are hanging out in the area you indicated making much ado about nothing.

            Some companies are offering boat cruises to that area from Argentina. You won’t see similar cruises offered to the mainland.

          • Bond says:

            “he was demonstrating typical temperatures for Antarctica”

            No, he was trying to imply that this temperature was unusually cold for Antarctica.

          • goldminor says:

            No, nothing special at that spot for reasons to obvious for you to understand.

          • goldminor says:

            It looks to me as if Antarctica is going to experience a very cold winter this season. The cold set in early on the continent.

  40. gbaikie says:

    Most of Earth is very hot, and it has thin skin of about 10 km thick which is very cold compared to bulk of the planet. And above the oceans and land there is cold atmosphere which hundreds of km high which then merges with the space environment. The official boundary of space is where something can orbit Earth – which would at velocity of about 7.8 km per second (about 17,000 mph) – and is 100 km elevation, though Earth atmosphere extends much higher than this.
    Humans live on land which near sea level to about 5 km of land elevation. Most of land is in northern Hemisphere and most live in northern Hemisphere and it is very thin layer and small portion of the Earth’s surface. Billions of humans have travelled in pressured aircraft which fly at about 10 km elevation but without being pressured the humans couldn’t breathe at such elevation. If you were to define the space environment as air too thin to breathe, then billions of human have travelled into space. They travel at such elevation to fly faster with less air resistance. If or when we get commercial suborbital travel, it also mostly be about travelling much faster, with less air resistance.

    The average surface temperature of all land is about 10 C, and most people live in regions which warmer than this average temperature. China has average of less 8 C, but the large city of Shanghai, China is about 16 to 17 C.
    The U.S. average temperature is less than 10 C, but that includes Alaska, which is cold, and the beautiful State doesn’t have many people there and will tend to live in warmer
    parts of the State. Alaska average is about -3.5 C
    In terms continental US, it averages about 12 C and California
    (a higher population State) as average of 15 C.
    http://berkeleyearth.lbl.gov/country-list/
    The human as tropical animal would “naturally” live in regions with average temperature of + 20 C and in regions that doesn’t have freezing conditions, but due the human mind and it’s techology, humans can thrive in significantly colder conditions, like California.

    • ren says:

      Concordia Station
      Now

      -70 C

    • Gordon Robertson says:

      gbaikie…”The official boundary of space is where something can orbit Earth which would at velocity of about 7.8 km per second (about 17,000 mph) and is 100 km elevation, though Earth atmosphere extends much higher than this”.

      I’ll say. The Moon is at average distance of 384 km and change. It’s amazing the Earth’s gravitational force is able to hold it in orbit at that distance.

      *********

      “The U.S. average temperature is less than 10 C, but that includes Alaska, which is cold, and the beautiful State doesnt have many people there…”

      At least Alaska is in America, Hawaii is not. It’s in the US mind you, just not in America.

    • Mike Flynn says:

      g,

      As you point out, escape velocity is about 17,000 mph.

      You are also probably aware that individual atoms and molecules exceed this speed at the outer limits of the atmosphere, and escape the gravitational field of the Earth. Not a lot in mass per annum, but how multiply a little bit by four and a half billion years, and you might get a reasonable number.

      The point is, that given the atmosphere is a chaotic dynamical system, who can say what the effect of Jeans escape and other mechanisms might be?

      The more we know, the less we understand (vice versa, I suppose), it might seem. Have fun.

      Cheers.

      • gbaikie says:

        “g,

        As you point out, escape velocity is about 17,000 mph. ”

        7.8 km per second or 17,000 mph is the velocity needed to stay in low Earth orbit. Or if spacecraft were to slow to 16,000 mph it will fall into the lower and denser atmosphere (It would start re-entry and land or crash on Earth surface).

        If in orbit traveling 7.8 km per sec, one can add velocity to the orbital speed so as to achieve an escape trajectory.
        Earth escape velocity is about 11 km per second. So if add more than 3 km per second to 7.8, anything will escape from Earth’s gravity well. Or that would be Hohmann escape trajectory.
        But velocity added must be added to same direction of
        travel. And with random collisions of gas molecules that is unlikely. So gas molecules at 100 or 200 km elevation could require more than 11 km per second of velocity added to them for the gas molecules to escape Earth’s gravity well.

        • David Appell says:

          None of this has anything to do with climate science, or climate change.

        • gbaikie says:

          I should note, the atmosphere gas molecules aren’t staying in orbit, rather they doing all kinds of orbits, and mostly suborbital trajectories, spending maybe something like 60 mins or say 5 mins going up and down and having range velocities of say, 1 to 5 km per second. And they might collide with the solar wind (very low density (less than 1/100th Earth low density atmosphere at 100 km elevation) and the wind is going about 500 km per second).

      • gbaikie says:

        –You are also probably aware that individual atoms and molecules exceed this speed at the outer limits of the atmosphere, and escape the gravitational field of the Earth. Not a lot in mass per annum, but how multiply a little bit by four and a half billion years, and you might get a reasonable number. —

        Solar wind is about 6 atoms per cubic cm, so 6 million per cubic meter, and 6 million billion per cubic km.
        And per square km if traveling 500 km per second, it
        is 500 times 6 million billion atoms per square km cross section of Earth. Or 3.0 x 10^18 atoms per square km per second.
        And amount atoms in 1 cubic cm of sea level air is:
        2.7 x 10^19 molecules or about twice as atoms.
        And what effect does our magnetosphere have on this:

        The controversy stems from recent observations that show Mars and Venus are losing oxygen ions from their atmospheres into space at about the same rate as Earth. This came as something of a surprise, since only Earth has a strong dipolar magnetic fieldthat can prevent solar wind particles from slamming into the upper atmosphere and directly stripping away ions.

        “My opinion is that the magnetic shield hypothesis is unproven,” said Robert Strangeway from UCLA. “There’s nothing in the contemporary data to warrant invoking magnetic fields.”
        https://www.space.com/11187-earth-magnetic-field-solar-wind.html
        And:
        “Each of the three planets is losing roughly a ton of atmosphere to space every hour. Some of this lost material was originally in the form of water, so this begs the question: How did the planets end up with vastly different quantities of water if they are all “leaking” to space at similar rates? ”

        It seems it’s not as settled as I imagined.
        But as recall there is more than a ton of cosmic material falling on Earth per day, but they saying 24 tons per day is leaving. There could be a lot more than a ton entering- estimates vary.

        — The point is, that given the atmosphere is a chaotic dynamical system, who can say what the effect of Jeans ((gas? Earth?)) escape and other mechanisms might be?–

        Well, solar min and max has large effect upon Earth upper atmosphere- with our current solar min it lowers the atmospheric effects on orbiting objects, but for sake of simple, it is kept at a constant of 100 km elevation.

      • Nate says:

        Only the lightest atoms -He, H, can escape Earth.

        • gbaikie says:

          Say had a sealed pressure vessel.
          And we will make interesting.
          Have 10 meter diameter sphere, cut in half giving two 10 meter diameter hemispheres. We take one of these domes and seal bottom. And have wall thickness .5 cm and have made of clear transparent plastic.
          Have a greenhouse (which lacks a entrance and one can add that and make it sealable).
          Adding normal air plus some h2. Have pressure same as atm pressure outside it, and temperature about 20 C.
          The average velocity of N2 and O2 would be about 400 m/s and much less massive H2 molecules will have higher average velocity, because all gas molecules roughly have the same
          Kinetic energy. And kinetic energy = 1/2 mass times velocity squared. Or gram of H2 molecules must equal gram of N2 or O2 in terms of kinetic energy. Or since H2 is less massive, it’s average velocity will be faster.

          In upper atmosphere a molecule of gas may be hitting another molecule when traveling a distance of about 1 km, whereas in 1 atm the distance traveled in nanometers, so has less equalizing, but lighter gases go faster.

        • Mike Flynn says:

          Nate,

          Not so. Gas diffusion and chaotic motion ensures that gases are generally well mixed regardless of their relative densities, if not reactive. Even solid particles remain suspended in the atmosphere indefinitely due to Brownian motion.

          You demonstrate ignorance and stupidity by making such unsupported foolish statements.

          Learn some physics.

          Cheers.

          • Nate says:

            no mike, as usual you spout nonsense, and then project your flaws onto others. There is help for your affliction, a physics book and a therapist.

            You see thermal energy only gives high velocity (escape velocity) to light atoms.

  41. Gordon Robertson says:

    DA…”Gordon needs to address Tim at…”

    “And while you are claiming now that 0.002% or even 0.00000002% is hardly trivial, you dismiss CO2 @ 20x larger concentration as too small to matter”.

    *******

    Tim needs to address Tim and get his thinking straight. He is comparing apples and oranges.

    The doping in a semiconductor is to enhance the supply of free electrons or reduce them. If Tim can explain to me what that has to do with CO2 making up 0.04% of the atmosphere, it would be appreciated.

    Doped silicon can be used on it’s own as in Hall Effect devices, however, the advantage with lightly doped silicon is found when an N-type and P-type are butted together. The interaction at the joint is the basis for diodes and transistors.

    By controlling the doping you control the number of free electrons hence the current carrying capability of the silicon. If the percent of doping is increased too much the silicon starts behaving like a metal conductor rather than a semiconductor.

    I don’t see what any of this has to do with CO2s 0.04% concentration and how it can contribute heat to a mix of air. The analogies offered like ink in water or arsenic in a cup of coffee are not remotely related.

    • David Appell says:

      You claim 0.04% CO2 can’t affect climate, based only on the smallness of that number (i.e. not based on science.)

      Yet you accept the cause-and-effect of numbers much lower in other situations.

      That’s inconsistent.

      • Gordon Robertson says:

        DA…”You claim 0.04% CO2 cant affect climate, based only on the smallness of that number (i.e. not based on science.)”

        I have based it on science, I used the Ideal Gas Law and Dalton’s Law to show that warming is based on the percent-mass of atoms/molecules in a mixed gas. The percent-mass of CO2 is so low it could not contribute more than a few hundreds of a degree C to a 1C warming.

        It is climate model theory that is not based on science. They have arbitrarily given CO2 a warming factor of 9% to 25% which is not based on any science of which I am aware. It’s picked out of a hat.

        • Svante says:

          No no no, it depends only on how much energy it can catch.

          You can not have two mixed gases at different temperatures, CO2 will share all of its captured energy, so the percentage is irrelevant.

    • Bond says:

      0.04% is one part in 2500. How many air molecules do you think a photon of IR radiation would encounter between the earth’s surface and the top of the atmosphere? More or less than 2500?

      • David Appell says:

        Less. Much less. A photon doesn’t “encounter” a molecule unless that molecule has a significant cross section for IR photon ab.sorp.tion.

        N2 and O2’s cross sections are essentially zero.

        CO2’s peaks at about 10,000 m2/kg.

        • Bond says:

          Much MORE. An imaginary cylinder of diameter 15 microns (the IR wavelength of interest, and about 40000 times the diameter of an O2 molecule) that runs from the earth’s surface to the top of the atmosphere contains about 10^19 air molecules.

          It is not the size of the CO2 molecule that determines whether it absorbs IR. It is that fact that diatomic molecules such as O2 and N2 have only one mode of vibration, and that mode doesn’t permit a separation of charge. CO2 is triatomic and has three modes of vibration. Two of those three modes result in a separation of charge, so a vibration can be induced by the oscillating E field of EM radiation.

          • David Appell says:

            No one ever said it was the size of the CO2 molecules that matters.

            Try again.

          • David Appell says:

            You are confusing the size of CO2 molecules with their cross section for ab.sorp.tion of infrared radiation.

            They are very different things.

          • Bond says:

            I’ll say it again:
            (1) My cylinder has a diameter 40000 times the diameter of an O2 molecule.
            (2) The number of air molecules in my cylinder is 10^19.

            Now, feel free to quote a value for the radius of your “cross section for ab.sorp.tion” that goes close to negating this ratio of more than 10^14.

          • David Appell says:

            I already quoted a value for the cross-section of CO2 at maximum, about 10,000 m per kilogram.

            You clearly seem to again misunderstand what a cross section is, confusing it with a molecules size.

            It is nothing like that.

          • *Square meters per kilogram.

            I wrote the same originally, but it didnt render.

          • Bond says:

            How on earth can a cross-section be measured in m/kg?
            It is either a distance in metres (ie. the diameter) or an area in m^2. Mass plays no role in determining the cross section.

          • I corrected my comment its square meters per kilogram

          • Bond says:

            Whether you have m or m^2 is not relevant to my point. A cross-section cannot be measured in units that involve mass.

          • Bond says:

            That’s all? Just “false”?
            Perhaps you’d care to EXPLAIN how the mass of a molecule is relevant to a statement of its cross-sectional AREA. Assuming for a moment we were discussing spheres, if a sphere has a radius of 1 metre, how does its cross-sectional area depend on whether the sphere is made of lead or whether it is a balloon filled with air?

          • Mike Flynn says:

            B,

            In climatology, anything can be redefined to mean anything at all, particularly if awkward questions are asked. Hence, a non-existent greenhouse effect which doesnt exist, has nothing to do with greenhouses, and is of no effect. Supposedly defined to make the planet hotter by reducing the amount of solar radiation reaching the surface.

            So if a climatological cultist says False”, he has probably just redefined the word True” to mean “not True”.

            Tricky little scamps, these pseudoscience believers.

            Cheers.

          • Ecause the cross section for scattering clearly depends on how many molecules there are

          • Bond says:

            (1) I have already accounted for the number of molecules in my calculation. Why would I factor it in a second time?
            (2) Where did you get this number from?

          • Tim Folkerts says:

            I thought I relpied but it got lost. Basically my quick research agrees with David.

            This link shows CO2 cross-section.
            http://vpl.astro.washington.edu/spectra/co2pnnlimagesmicrons.htm

            Near 15 um it peaks around 5e-18 cm^2/molecule. This can be rewritten as
            5e-18 cm^2/molecule.
            5e-22 m^2/molecule.
            300 m^2/mole
            7 m^2/g
            7,000 m^2/kg

            Which is right in line with David’s statement (and shows how “m^2/kg” is a perfectly fine way to express cross-section).

          • Bond says:

            Tim Folkerts

            My comment wont post, so I am breaking it up into parts so I can see where the issue lies. Ill let you know when it is finished, so please dont reply until then. Part 1:

            For starters, I don’t see any description of the graph, nor do I see any units on the vertical scale. How do you know it is is even measuring cross section, and how do you know whether the vertical scale is in units or square units?

          • Mike Flynn says:

            Conventional definition of a cross section –

            1. a surface or shape exposed by making a straight cut through something, especially at right angles to an axis.

            Climatological definition of a cross section –

            “Anything you like.

            Cheers.

          • Bond says:

            Part 2:
            But let’s assume it is correct.

            Firstly, even is David’s figure is correct, it is a rather odd way of expressing it.

            Further, an area of 5e-18 cm^2 corresponds to a diameter of 0.025 nm. That means my calculation is only out by a factor of 15, or slightly more than one order of magnitude.

          • Bond says:

            Part 3:

            So, restating:
            The 15 micron diameter of my imaginary cylinder is 600000 times the diameter of attraction of a CO2 molecule, or (3.6 times 10^11) times the AREA of the zone of attraction of that molecule.

            The number of air molecules in that vertical column is still 10^19.

          • Bond says:

            Part 4:

            Divide 3e16 by 10^19, and each photon sees about 28 million air molecules ahead of it.

            Divide that by 2500, and the photon would pass withing the zone of influence of 11000 CO2 molecules between the earth’s surface and the ‘top’ of the atmosphere.

          • Bond says:

            Part 5:

            I have assumed all molecules have the same weight. But this is only meant to be an order-of-magnitude calculation, so it is close enough. From what I know about the mean free path before ab.sorp.tion for 15 micron radiation (it is just over 30 cm), I believe I am out by a factor of 2. But that could be just because a CO2 molecule will not necessarily absorb a 15 nm photon just because it comes within its zone of influence.

          • Bond says:

            Finished. Interesting that this site accepted each part of my comment, but would not accept the whole thing. Surely there must be a better option than WordPress.

          • Tim Folkerts says:

            Bond,

            1) The page that linked to the graph gave the description.
            http://vpl.astro.washington.edu/spectra/co2.htm
            “Images of PNNL data in cm2/molecule vs. microns”

            2) For a 15 micron cylinder, my calculations give about the same number of molecules: 10^19. If that was pure CO2, that would be encountering ~ 10,000,000 molecules. At current 400 ppm, that would be encountering ~ 4000 CO2 molecules on the way up. (all numbers are meant to be orders of magnitude).

          • Bond says:

            Good. So my original implication was correct – that a 15 micron photon would “encounter” significantly more than 2500 air molecules, and hence encounter significantly more than just one CO2 molecule on its path to the top of the atmosphere. In fact, a 15 micron photon is first absorbed by a CO2 molecule on average only just over 1 foot above the ground.

            A random walk calculation shows that the probability of such a photon escaping the atmosphere if it has to get through n CO2 molecules is 1/n. So almost all photons at that wavelength are returned to the earth’s surface, and in fact have been for eternity.

            It turns out that the effect of adding more CO2 is not about what happens right at 15 microns because the greenhouse effect is already saturated there. It is about the wavelengths in the neighborhood of 15 microns. The zone of saturation around 15 microns is gradually broadening as we add more CO2.

            Those who deny the greenhouse effect don’t understand that even at those concentrations, it is almost impossible to draw a straight line from the ground to the top of the atmosphere without intersecting a CO2 molecule, in fact many CO2 molecules.

          • Svante says:

            Yes Bond, and then the saturation argument is even more bogus because you are adding more layers to the TOA, particularly above water vapor.

            You need a FEM like program like this to do the iterations:
            https://tinyurl.com/pg3bd8p

          • Gordon Robertson says:

            bond…”Those who deny the greenhouse effect dont understand that even at those concentrations, it is almost impossible to draw a straight line from the ground to the top of the atmosphere without intersecting a CO2 molecule, in fact many CO2 molecules”.

            Total theory based on immature logic. As Gerlich and Tsceuschner pointed out, the radiation of IR to the atmosphere is a many body problem.

            https://en.wikipedia.org/wiki/Many-body_problem

            G&T on page 12 0f 115:

            https://arxiv.org/PS_cache/arxiv/pdf/0707/0707.1161v4.pdf

            “In particular, from the viewpoint of theoretical physics the radiative approach, which uses physical laws such as Planck’s law and Stefan-Boltzmann’s law that only have a limited range of validity that denitely does not cover the atmospheric problem, must be highly questioned.

            For instance in many calculations climatologists perform calculations where idealized black surfaces e.g. representing a CO2 layer and the ground, respectively, radiate against each other. In reality, we must consider a bulk problem, in which at concentrations of 300 ppmv at normal state still

            N ~ 3.10^4.V.L
            ~ 3×10^4 . (10 x 10^-6)^3 . (2.687 x 10^25)
            = (3 x 10^4) . 10^-5 . (2.687 x 10^25)
            ~ 8 x 10^6

            CO2 molecules are distributed within a cube V with edge length 10um, a typical wavelength of the relevant infrared radiation. In this context an application of the formulas of cavity radiation [blackbody] is sheer nonsense.

            It cannot be overemphasized that a microscopic theory providing the base for a derivation of macroscopic quantities like thermal or electrical transport coeffients must be a highly involved many-body theory. Of course, heat transfer is due to interatomic electromagnetic interactions mediated by the electromagnetic field. But it is misleading to visualize a photon as a simple particle or wave packet travelling from one atom to another for example. Things are pretty much more complex and cannot be understood even in a (one-)particle-wave duality or Feynman graph picture”.

            **********

            In other words treating CO2 as a blackbody surface and applying laws like Boltzmann and Planck is bogus.

          • Svante says:

            Gordon says:

            “N ~ 3.10^4.V.L
            ~ 310^4 . (10 x 10^-6)^3 . (2.687 x 10^25)
            = (3 x 10^4) . 10^-5 . (2.687 x 10^25)
            ~ 8 x 10^6”

            “In other words treating CO2 as a blackbody surface and applying laws like Boltzmann and Planck is bogus.”

            Thank you for supporting me, you need MODTRAN:
            https://tinyurl.com/pg3bd8p

          • Bond says:

            Gordon
            And of course you understand every detail of your little cut-paste job?

      • Gordon Robertson says:

        bond…”How many air molecules do you think a photon of IR radiation would encounter between the earths surface and the top of the atmosphere?”

        You can’t do science and talk in terms of what one photon might or might not do. No one knows if IR radiated from the surface reaches TOA and I have yet to see a calculation for the flux field produced by every atom/molecule on the Earth’s surface/ocean.

        It stands to reason that the atoms in the Earth’s surface and oceans radiating IR vastly outnumber the number of CO2 molecules in the atmosphere. If as you claim, there is a one to one correlation between an emitted photon and a CO2 molecule, which is unlikely, what percentage of the surface flux can CO2 molecules absorb?

        I claim it’s not a lot. Most surface flux should bypass CO2 molecules, even water vapour molecules. If the theory is true, that one CO2 molecule in 2500 can warm all the others then our atmosphere should be a constant temperature all the way out.

        It’s not, and obviously the warming due to the absorp-tion of IR by CO2 molecules at -50C is not happening. In other words, this one-to-one AGW theory is pseudo-science.

        Further to that fact, if R.W. Wood is right, that surface IR would be too weak to be effective more than a few feet above the surface, then CO2 molecules at altitudes greater than a few feet are not being warmed at all. Same applies for WV.

        Lindzen’s theory makes far more sense, that all air heated by the surface rises high into the atmosphere, especially in the Tropics, and is carried upward and poleward by convective currents. Then it is radiated when the air masses reach TOA.

    • Tim Folkerts says:

      Gordon, with all due respect to what I am sure are considerable skills in electrical engineering, I am not the one who needs to get thinking straight here. Just within this thread, you have significantly misunderstood
      * the inverse square law.
      * the nature of CMB radiation
      * Boltzmann & photons
      * the strength of flux from CO2 vs ground
      * the modern meaning of the word “heat”

      ———————————————-

      The doping example is interesting, but as you say, it is not directly applicable to CO2. Perhaps I misunderstood your original comment, but it sure sounded like you were trying to correct someone about doping, when you were basically agreeing with them.

      However, the ink/water example *is* germane. Fill two clear baggies with water — one with no ink and one with 0.04% black ink added. If you put them in the sun, do you suppose the water with ink will warm faster and end up warmer than the clear water? (Dang — now i want to go do this experiment!)

      • Mike Flynn says:

        Tim,

        Stupid, stupid, stupid.

        Put the baggie between the Sun and thermometer – just as the atmosphere is between the Sun and a thermometer. Off you go, and do the experiment. That’s reality, not pseudoscience.

        Cheers.

        • Tim Folkerts says:

          Its my experiment — designed to show a specific result. I’ll put the baggie in the sun if I want. Make your own experiment if you are so inclined.

          The dark baggie gets hotter than the clear baggie. This shows that 0.04% impurity can warm the other 99.96% of the materials. This shows the feasibility to Gordon of 0.04% CO2 warming the other 99.96% of the air.

          • ren says:

            Funny. I did not know that CO2 is black.

          • Tim Folkerts says:

            Ren, IR is quite black @ 15 um. If you don’t know IR absorbs IR, you have a lot of catching up to do!

          • Tim Folkerts says:

            ^^ If you don’t know CO2 absorbs IR …

          • Bond says:

            Actually, that wouldn’t be true. CO2 both absorbs and emits CO2. What is true is that a blanket of CO2 with the thickness and density of the CO2 in our atmosphere would be a black TRANSMITTER at 15 microns, but a very bright “REFLECTOR” at 15 microns. That is, a beam of 15 micron light shone at the atmosphere would almost all come back at you, though not as a beam but extremely diffuse.

            Not that this raises the slightest objection to your experiment.

          • David Appell says:

            Bond says:
            “CO2 both absorbs and emits CO2. What is true is that a blanket of CO2 with the thickness and density of the CO2 in our atmosphere would be a black TRANSMITTER at 15 microns, but a very bright REFLECTOR at 15 microns. That is, a beam of 15 micron light shone at the atmosphere would almost all come back at you, though not as a beam but extremely diffuse.”

            No, it’s not reflection. After ab.sorp.tion of IR by CO2, the molecule then re-emits IR, but in a random direction. So about half goes back downward, but then it must contend with other CO2 molecules below that might ab.sorp it. It’s really integral equations that must be solved, called the Schwarzschild equations or two-stream equations.

          • Bond says:

            “After ab.sorp.tion of IR by CO2, the molecule then re-emits IR, but in a random direction.”

            Yes, thanks for the lecture. I am fully aware of the process. Why, after doing your cut-paste of my comment, did you then deliberately remove the quotes that I put around “reflector”? Those quotes would indicate to any knowledgeable reader that I was using only a rough analogy. Honestly, you seem to believe you have something to prove.

            Macroscopically, it still looks like a reflection process, and allowing for the looseness of the analogy and the point I was trying to make, my statement was 100% correct.

            To a good approximation, the only integral required is to find the ‘effective height’ of the atmosphere. That is, the height that the atmosphere would have if it were all compressed to have the same density as it has at the earth’s surface. From memory, the effective height of earth’s atmosphere is about 7 km, but I could be out by a few km.

            Once you know the effective height and the mean VERTICAL free path between ab.sorp.tions at the earth’s surface, it is a simple random walk calculation:
            Probability of escape = (Effective height)/(mean free path)

            If you are after an order-of-magnitude calculation, that is all there is to it.

            And restating my entire point from my initial comment:
            IF every molecule in the atmosphere were CO2, a 15 micron photon would have to battle ORDERS OF MAGNITUDE MORE than 2500 molecules of CO2 on its way to the top of the atmosphere. Given that only one in 2500 molecules is CO2, such a photon is almost certain to interact with a CO2 molecule on its upward journey.

          • Bond says:

            Oops – my fraction is upside down:

            Probability of escape = (mean free path)/(Effective height)

          • gbaikie says:

            –Tim Folkerts says:
            May 5, 2018 at 7:42 AM
            Ren, IR is quite black @ 15 um. If you dont know IR absorbs IR, you have a lot of catching up to do!–

            The Moon is quite dark, but the light of the Moon does not appear black.

            Mars is covered with mostly 25 trillon tons of CO2, in orbit does Mars appear black (during night or day) if seeing @ 15 um?

        • Mike Flynn says:

          Tim,

          Or you could find something that doesnt warm up when you put it in the Sun?

          Or maybe you could warm something, and show that it wont cool down after you remove the heat source – maybe you could find something that traps heat!

          You can do all sorts of experiments to show that things get hotter when allowed to heat up. Other pseudoscientific minds will no doubt be mightily impressed. Can you do an experiment to show the existence of the GHE? No, because you would have to say what the GHE is supposed to do, and you cant!

          Off you go now, and demonstrate that you can raise temperatures using a heat source.

          Cheers.

      • Gordon Robertson says:

        tim…”Just within this thread, you have significantly misunderstood
        * the inverse square law.
        * the nature of CMB radiation
        * Boltzmann & photons
        * the strength of flux from CO2 vs ground
        * the modern meaning of the word heat”

        I want to say first that your reply is typical of an alarmist reply. You either lack the ability to expound in scientific terms or you are replying in the manner of an ad hom. Try explaining what you find wrong with what I am saying. I get many terse replies from people acting as authority figures who obviously have no idea what they are talking about.

        1)Inverse square law…understand it fine but I did not originate the theory about surface radiation being ineffective a few feet above the surface. That came from R.W. Wood, an eminent authority on IR, so eminent that he was consulted by Neils Bohr on IR theory as related to sodium emissions.

        I was demonstrating it practically to Norman. I know it’s tough to separate the warming from directly heated air molecules from the radiation but what I am trying to get through is that radiation from a 1500 watt ring is essentially ineffective, moreso in short distances as you move away from the source. If it had any effect it would burn your skin really close to the surface as the directly heated air might.

        We had a similar issue with swannie’s first experiment. He place a tin plate on a stove ring and measured the temp. Then he mounted a cookie sheet on soup cans above the plate, measuring the tin plate temp again. He claimed the tin plate’s temperature rose, claiming that as proof that the cookie sheet was radiating back to the tin sheet and warming it.

        I pointed out that all he accomplished was blocking convection from the tin plate. To me, it was a heat dissipation problem.

        I advised him to get a fan and blow it across the tin plate to blow away the heated air. He tried but obviously did not use a fan with enough power to eliminate as much convection as possible. You would likely never get rid of all of it but I think you could reach a steady state where the tin plate barely heated at all with the cookie sheet in place.

        If we could do the same with a fan on the 1500 watt ring, I’m sure the radiation from the ring alone would still cook the skin if it was close enough. However, a few inches away it could barely warm the skin never mind burn it. That was intended as my demonstration of the inverse square law.

        The ISL is about drop off in intensity with distance from the source and that’s what I am talking about.

        I have worked with this stuff directly in electronic communications systems. We studied inverse square law several times in electrical and electronics theory.

        2)CMB radiation…what is there to know about it? It is radiation measured by radiotelescopes but those who discovered it in 1964 ‘heard’ it as a background hum. They claimed to have eliminated all other causes then leaped to the amazing conclusion the CMB was a sign of the beginnings of the universe.

        Are we in grade school here? That’s one of the most absurd conclusions I have ever heard.

        Tell me something Tim, do you really believe that bs about our universe beginning in a flash out of nothing for no apparent reason and no evidence anywhere in physics that it could actually happen?

        EM cannot be measured till it interacts with matter. There is no way to measure it from a distance. The fact that it produced a hum tells you right away that matter is involved since EM cannot produce a hum.

        If you have a radio receiver that can receive atmospheric background EM, you will get all sorts of noises. Jumping to the conclusion that a persistent background hum is caused by EM from the origins of the universe is just bad science.

        The point is that the EM causing the hum was picked up at their receiver antenna in the here and now, not 4 billion years ago. To infer the here and now signal was EM floating around for 4 billion years is just stupid. Obviously the hum is coming from something they have not yet identified.

        3)Boltzmann and photons…Big B was studying blackbody radiation circa 1877 in the same way he earlier studied gases. How else would he get an equation about radiation density?

        4)strength of surface flux versus CO2’s ability to capture it….you alarmists don’t like problems you can’t answer, or that conflict with your theories.

        5)the modern meaning of the word heat has been passed off to me in this blog exactly in the manner I have stated. It has been defined as a process of energy transfer and I think ball4 claimed it does not exist.

        I have seen the generic form of energy used very loosely to gloss over what it is in relation to moving atoms…heat.

        • E. Swanson says:

          Gordo, You are distorting the results of my first round of Green Plate demonstrations. For the last version, I replaced the cookie sheet with a layer of IR transmitting plastic film. The result was no “back radiation” and no warming of the high temperature plate.

          And, I’m the one who first thought to use the fan to move the heated air away from the space between the hot plate and the cookie sheet.
          http://www.drroyspencer.com/2018/01/sydney-heat-and-bomb-snowstorm-pimped-out-for-climate-change/#comment-281570

          You keep trying to ignore reality, but you just keep digging yourself into a deeper hole.

          • Ball4 says:

            Gordon: “Try explaining what you find wrong with what I am saying.”

            Many have already done so, thread after thread, & are simply ignored by Gordon to Gordon’s great discredit.

            “It has been defined as a process of energy transfer and I think ball4 claimed it does not exist.”

            Heat does not exist in nature or science since the colorless, odorless caloric fluid theory was thrown out of science by elegant experiments.

            U may change with time (dU/dt) because of the interaction of an arbitrary but specified system of molecules with its surrounding molecules. These interactions take two forms:

            1) Those interactions for which the net force vanishes on average yet the energy of the system changes because of random collisions with surrounding molecules having a different average energy (Q)

            2) Those interactions for which the net force does not vanish on average (W)

            The best way to stop getting confused by the term “heat” is simply stop using it.

          • Ball4 says:

            Gordon writes: “The point is that the EM causing the hum was picked up at their receiver antenna in the here and now.”

            Yes good point. The receiver horn antenna temperature was around 62F (289.7K) on Earth surface. The emitter of the hum is around uniform 2.7K much cooler. Yet according to Gordon writing 6:28pm: “Even via radiation, heat can only be transferred from a higher energy potential to a lower energy potential. The reverse transfer IS NOT POSSIBLE…The EM from a cooler object lacks the energy and the frequency to be absorbed by the electrons in the hotter body. The 2nd law is upheld.”

            What do you know, Gordon writes both absorbing the EM is possible (detecting the hum) and absorbing the EM is NOT possible (the hum could not have been detected).

            Actually, detecting the hum proves Gordon is wrong about “The EM from a cooler object lacks the energy and the frequency to be absorbed by the electrons in the hotter body” as for that process universe entropy is increased thus 2LOT is upheld and hence the hum was detectable.

        • Tim Folkerts says:

          “I want to say first that your reply is typical of an alarmist reply. You either lack the ability to expound in scientific terms or you are replying in the manner of an ad hom. “

          I first want to say that I (and others) already DID expound in scientific terms up-thread. Furthermore, dismissing my points because I am “an alarmist” is itself clearly “ad hom”.

          1) “The ISL is about drop off in intensity with distance from the source and thats what I am talking about.”
          The drop-off in IR as you get farther from the surface is about ATTENUATION — an exponential drop off, not inverse square.

          2) I believe that the big bang theory is the best current scientific theory to explain the history of the universe. Tell me something, Gordon, do you have a BETTER hypothesis that explains CMB, motion of galaxies, the mixture of elements in the universe and the age of the oldest known stars? (PS your hypothesis that CMB might come from stars has huge problems.)

          3) “How else…?” is not an argument. It is simply as statement that you don’t know the answer.

          4) I did answer, and it doesn’t conflict with my theory.

          5) “Heat” is used colloquially to mean lots of things, including internal energy and temperature. That doesn’t make it right. The most important thing is to be clear and consistent. When you say heat, I know you mean U not Q. But that doesn’t mean you can complain about ‘mistakes’ when people properly use “heat” to mean Q.

  42. David Appell says:

    Demonstration of the effect of black ink at CO2 concentrations:

    https://www.youtube.com/watch?v=81FHVrXgzuA

    • Mike Flynn says:

      DA,

      Gee. Black ink. A change from overcoats and pot lids, I suppose.

      Still no testable GHE hypothesis, is there?

      Cheers.

    • Myki says:

      Excellent demonstration.
      Obviously wasted on some people.

      • Mike Flynno says:

        M,

        A demonstration of nothing at all if supposedly relating to a non-existent GHE.

        I suppose you and your ilk have to find something to keep you from facing the fact that you can’t actually find a testable GHE hypothesis.

        Have you tried denying the Earth’s cooling since its creation?

        Cheers.

        • Myki says:

          Cooling? What cooling?
          “Two dominant dates for creation exist, about 5500 BC and about 4000 BC. These can be calculated from the genealogies in two versions of the Bible, with most of the difference arising from two versions of Genesis.”

        • Myki says:

          Sorry – I forgot to say that there is no evidence of cooling since creation.
          You therefore have an invalidated “cooling” hypothesis (as opposed to a “testable GHE hypothesis”)

        • Mike Flynn says:

          M,

          You are in good company. Lord Kelvin believed that the Earth couldnt possibly be older than 20 million years.

          Are you still denying the Earth has cooled since its creation?

          If you believe the Earth was created around 5500 BC, all that supposed climatological research based on proxies from before that date would have to be rubbish, wouldn’t it?

          Carry on – I hope the rest of your ilk are as stupid and ignorant as you. At least Governments will have good reason to stop funding such people. I suppose you also believe in alchemy like Sir Issac Newton, or caloric, phlogiston and the ether, like many other famous scientists?

          You are free to believe what you like. Others are free to laugh at you as much as they wish, I suppose. Keep the humour coming – it hasn’t any adverse side effects, as far as I know!

          Cheers.

          • Myki says:

            “all that supposed climatological research based on proxies from before that date would have to be rubbish, wouldnt it?’
            Obviously. You have opened our eyes to the corrupt nature of climate science.
            But that still means there is no evidence that the Earth cooled since creation. I don’t think the bible makes any mention of it anyway. If you wish to believe in frauds such as Lord Kelvin – go right ahead: “You are free to believe what you like”.

          • Mike Flynn says:

            M,

            You used an oxymoron – climate science.

            What makes you imagine that endlessly reanalysing historical numbers qualifies as a science? Climate is the average of weather – nothing more, nothing less.

            Thank you for agreeing with me about freedom of thought. Gavin Schmidt thinks he is a climate scientist, Michael Mann believed he was a Nobel Laureate, and GHE proponents believe that increasing the amount of CO2 between the Sun and a thermometer makes the thermometer hotter!

            As long as these bizarre religious thoughts neither break my leg, nor pick my pocket (as Thomas Jefferson said), the mentally deranged are free to think as they wish.

            Carry on thinking. Maybe you could think a testable GHE hypothesis into existence? I jest, of course!

            Cheers.

          • Myki says:

            Your response sounds suspiciously similar to countless others you have made here.
            Could you please try and be, if not humorous, then a at least be a bit more creative.

          • Myki says:

            Speaking of Thomas Jefferson, you may like to consider his observation in relation to your “cooling theory”:
            “The moment a person forms a theory, his imagination sees in every object only the traits which favor that theory.”

          • Mike Flynn says:

            M,

            You are fantasising, like all sufferers from delusional psychosis.

            To which “cooling theory” do you refer? Am I supposed to have one in particular, or is this just a figment of your delusion?

            Obviously, if you find yourself unable to even define the GHE which exists only in your imagination, you will attempt to deflect any queries, rather than admit you are stupid and ignorant enough to believe in something you cannot even describe to yourself!

            Keep up the attempts to deny, divert, and confuse. It worked for years, why not now?

            Cheers.

          • Myki says:

            “To which cooling theory do you refer? Am I supposed to have one in particular, or is this just a figment of your delusion?”
            HUH? I’m not the one stating:
            “Have you tried denying the Earths cooling since its creation?”
            Seriously, are you not capable of staying on-topic?
            Or do you have selective memory loss like the present POTUS ?

          • Mike Flynn says:

            M,

            Are you disagreeing with something I said, or just thrashing about because you can’t even properly describe the non-existent GHE?

            I know it is awkward to be unable to clearly state what it is you support, let alone being unable to find a testable GHE theory.

            Keep on with the demands and general silliness. Do you think people should believe that stupid and ignorant climatologists have the power to stop the climate from changing?

            It probably won’t help if you don sackcloth and ashes, wear a funny hat, and start speaking in tongues. Facts tend to more persuasive for rational people.

            Others can make up their own minds as to the usefulness or otherwise of climatological pseudoscience. Some might even enjoy being told what to think, by such as yourself. Good luck.

            Cheers

          • Gordon Robertson says:

            Myki…”Your response sounds suspiciously similar to countless others you have made here”.

            Myki…the offer is still open, you can come over to the skeptic side. It does not sound like your heart is into catastrophic theories.

            Don’t allow the acerbic alarmists to throw you off, they claim I am a denier but they cannot explain what it is I am denying. I don’t deny the warming, or the climate, and I certainly don’t deny the scientific method as most alarmists do.

            Mike is actually quite creative. he has the alarmists on this blog lining up to debate him, or sling darts. It requires creativity to lure followers as Mike has done.

          • David Appell says:

            Easy: You’re denying radiative transfer.

      • Gordon Robertson says:

        Myki…”Excellent demonstration”.

        Kissy, kissy.

    • Gordon Robertson says:

      DA…”Demonstration of the effect of black ink at CO2 concentrations:”

      What does that have to do with climate? Do you see black ink clouds floating around the sky?

      My 0.04% CO2 concentration is related to the Ideal Gas Law and Dalton’s Law which PROVE that such a low concentration of CO2 in the atmosphere could not possibly warm it more than a fraction of a hundredth of a degree C for a 1C rise in temperature.

      Standby for Henry’s Law.

  43. David Appell says:

    Notice how Gordon avoids all the replies he gets above. Avoiding questions is what his ideology gets by on.

    • Mike Flynn says:

      DA,

      The GHE doesn’t exist. Your gotchas are an attempt to avoid this obvious fact. Keep up the avoidance – keep believing in magic!

      Press on.

      Cheers.

  44. ren says:

    The Hawaii volcano can still be dangerous.
    In two days, a quick solar wind will reach the Earth from the coronal hole located on the solar equator. It will cause geomagnetic storms.
    http://files.tinypic.pl/i/00964/b0igw9kq9fol.jpg
    http://files.tinypic.pl/i/00964/kixog87dit9n.gif

  45. ren says:

    Concordia Station

    Now

    -71 C

    • Bond says:

      Why are you focusing on one station that happens to be having a cold day?

      • ren says:

        I wonder if the forecasts are wrong.
        Concordia Station
        Now

        -72 C
        https://www.timeanddate.com/weather/antarctica/concordia-station/ext

        • Bond says:

          The site is timeanddate for chrissake. They don’t actually employ meteorologists. Do you think anybody actually spends time coming up with forecasts for a population of 13? And where exactly do you think they would get the data from to make such a forecast? That requires instruments in neighboring localities. The temperatures are real, the “forecasts” are lottery numbers.

          • Gordon Robertson says:

            bond…”The site is timeanddate for chrissake. They dont actually employ meteorologists. Do you think anybody actually spends time coming up with forecasts for a population of 13?”

            Uber-alarmists (notice the German, binny) Mann and Stieg were not bothered by a lack of meteorologists or Antarctic population. It did not even bother them that one of their reporting stations was under 4 feet of snow.

            No. The intrepid alarmists carried on fudging data to show Antarctica had warmed since 1950. Saner minds intervened and proved Mann and Stieg had extrapolated temperatures from the warmer station you quoted in a recent post in order to raise the overall Antarctic temperature.

            Fudge, fudge, fudge.

            You would think that Mann, a geologist, would give up his climate aspirations after the number of kickings he has received.

          • Bond says:

            Nice story.

        • La Pangolina says:

          ren

          Concordia Station is one of the most important research corner on Earth, climate included (see their huge ice core).

          But it is not a weather station.

          • Gordon Robertson says:

            binny…”But it is not a weather station”.

            Does that make it warmer? Maybe it’s really -80C.

  46. Kristian says:

    Regarding the whole ‘data’ vs. ‘linear trend lines’ discussion, a string of six posts starting here:
    http://www.drroyspencer.com/2018/05/uah-global-temperature-update-for-april-2018-0-21-deg-c/#comment-300743

    • Snape says:

      Kristian

      Good argument. I agree with you that trend lines can be misleading.

      • La Pangolina says:

        Of course they can be.

        That is the reason why Bindidon and I learned to concentrate comparisons on running means whose length is adapted to that of the time series they are intended to enlighten.

        http://4gp.me/bbtc/1525532428941.jpg

        P.S. That is the kind of graph the average pseudoskeptic considers fake (due to the necessary reference period alignment).

  47. Tim Folkerts

    The doping example is interesting, but as you say, it is not directly applicable to CO2.

    Let’s recall that the “point” was allegedly that such a minor CO2 component or “impurity” in air at a concentration as small as only 1 out of 2500 molecules cannot change seriously its physical properties.
    Experimental physics tells us since long that this kind of reasoning is utterly false since it is obviously at odds with the example of doped semiconductors. And there are other most striking examples.

    Now, it’s quite true that this is usually not the rule for most physical properties and often, as one might expect intuitively the effect of such tiny amounts of impurities is indeed small or negligible. For instance the heat capacity of air or a semiconductor is hardly modified because of the small CO2 respectively dopant contents.

    Yet it nevertheless happens that the origin of the strong effect of dopants in semiconductors is actually really comparable to the strong effect of IR active “impurities” in air from a physical point of view.

    In both case there is a big effect on relevant property because the presence of any impurities definitely destroys an emergent generic state of matter namely a perfect electrical insulator (at T= 0K) with the appearance of mobile hole or electron quasi-particles or an IR transparent gas or “perfect IR thermal conductor” with the appearance of IR “scattering centers” in the form of IR active impurities.
    In both cases one just strongly modulates conductivity, electrical via the number of charge carriers, holes or electrons, in semiconductors and thermal via the scattering of the heat carriers or IR photons in atmosphere.

    • Bond says:

      Another example is supercooled water. Water can (and does) exist at -10C without freezing if there are no impurities for the ice to crystallize on. But add a couple of grains of impurity to the supercooled water, and it freezes over in a couple of seconds.

      In the case of atmospheric CO2, the real reason is that 15 micron radiation just doesn’t “see” O2 and N2. As far as that radiation is concerned, it’s as though those molecules aren’t even there. Out of the gases that IR can “see”, 100% are greenhouse gases.

      • ren says:

        Why do you compare gas to solid particles and water? Do not be ridiculous.

      • David Appell says:

        Another example is ozone. In the ozone layer of Earth’s atmosphere, its concentration is about 1 ppm. But without it we’d all be dead.

        • Snape says:

          A typical “serving” of LSD is only 0.00002 of a gram. Has quite an effect.

          • Gordon Robertson says:

            snape…”A typical serving of LSD is only 0.00002 of a gram. Has quite an effect”.

            The more you guys offer such analogies to justify CO2 heating in the atmosphere the more I get it that you have no idea what you’re talking about.

            The effect of LSD on the human brain has no relationship whatsoever to the action of CO2 in the atmosphere at 0.04%.

            I have tried to advise you to get off thought-experiments and deeply consider what is really going on.

            Kristian has advised people to look at the data to see what it is telling you. Great advice. I am saying essentially the same thing: try to understand how gases work and what laws apply to them. If you do, you’ll be way ahead of climate modelers who apparently have not the slightest idea how they work.

            I’ll bet you have not the slightest idea how LSD works in the human brain. I can testify as to the effect it has, and sometimes I think you alarmists are on it.

            Here’s a test: Did you bring your lunch or take the bus? If that question makes you pause to ponder, then giggle in confusion, you’re stoned.

            What’s faster, a carrot or a fire-hydrant?

          • Snape says:

            San Francisco, 1967:

            “Don’t do it, Gordon, that’s way, way too much!”

            “Don’t be ridiculous”

            **************

            Explains a lot.

          • Mike Flynn says:

            S,

            Or you could have just one virus, with a weight of, say, 1 x 10^-18 gm, which can lead to the death of the largest living animal on Earth.

            Or go further, and point out that a photon with zero rest mass, but enough energy to interact with an appropriate electron eventually causing a fatal cancer, means that you can be killed by something weighing nothing at all!

            All completely pointless and irrelevant, isnt it?

            There is no minimum change in input to a chaotic system which can be shown to make the difference between chaotic and non-chaotic behaviour. That is nature of chaos, which does not even need any external change to produce completely unpredictable outputs.

            Averages are useless. Predictions are useless. A chaotic strange attractor appears completely random. The fluid dynamics of the atmosphere appear chaotic in nature. Assumptions that tomorrow will be much the same as today are about as reliable as anything else.

            What to do, then? Assume that you will be alive, that the Sun will rise as usual, and that history will repeat itself, more or less. Follow trends if you wish, and maybe you will gain a vast fortune on the stock market. My assumption is that you wont, but maybe you can look into the future better than I.

            Still no GHE. Not even a useful description, let alone a testable GHE hypothesis. Just assumptions, which may or may not come to pass. Who knows? Tossing a coin will probably do just as well.

            Cheers.

        • ren says:

          The significance of electromagnetic radiation increases in the stratosphere. However, in dense troposphere, convection definitely dominates. Therefore, the kinetic energy of ozone is highest at the top of the stratosphere and falls with altitude.

        • ren says:

          Ozone is oxygen and the oxygen and nitrogen is very much in the atmosphere.

      • Snape says:

        GHG’s are not usually thought of as a heat source, but maybe they should be? The sun heats the earth’s surface, the surface heats GHG’s and GHG’s heat the surrounding air (by conduction).

        • Bond says:

          They are NEVER thought of as a heat source. They are a heat RE-DIRECTOR. There is no creation of new heat.

          They don’t get a chance to heat the surrounding air because they emit a new photon almost immediately after receiving one.

          • Snape says:

            Bond

            “They are NEVER thought of as a heat source. They are a heat RE-DIRECTOR. There is no creation of new heat.”

            You could say the same thing about Earth’s surface, but I’ve often seen it described as the atmosphere’s primary heat source.

            **********

            “They dont get a chance to heat the surrounding air because they emit a new photon almost immediately after receiving one.”

            This is something I’m not familiar with and probably misunderstood. Could you explain what happens, on average, when a CO2 molecule collides with an oxygen or nitrogen molecule? Is there a net exchange of energy or is it just a swap?

          • Norman says:

            Bond

            I have read conflicting evidence. Do you have a link to support your claim?

            YOU: “They dont get a chance to heat the surrounding air because they emit a new photon almost immediately after receiving one.”

            I am not sure empirical evidence supports this claim.

            I have posted this to others. Let us see how you interpret the data.

            Actual empirical material. A snapshot but consistent.

            https://www.esrl.noaa.gov/gmd/webdata/tmp/surfrad_5af117f5cc33b.png

            This graph does not support the re-direction hypothesis. It supports that the GHG emit IR based upon their temperature.

            If the re-direction hypothesis were a valid one the evidence should have the NET IR and mostly flat-line. As the surface heats up and emits more IR upward, there should be the same increase in DWIR. This is not the case. The DWIR only increases slowly, as the air heats, during the day. It seems more based upon air temperature rather than re-direction of UWIR.

          • Norman says:

            Bond

            Here is an example of what I am claiming.

            https://www.esrl.noaa.gov/gmd/webdata/tmp/surfrad_5af1194843bdf.png

            You can see how the DWIR follows the air temperature.

          • Snape says:

            Hi Norman

            The data you presented is very interesting. Fun to think about.

            As a side note, I have seen many, many descriptions of how the GHE works, but almost all exclude the role of non-GHG’s, which make up most of the atmosphere. Was hoping Bond would see my question and give his input.

        • Mike Flynn says:

          Snape,

          You may think of CO2 in any fashion you wish.

          It will make no difference at all. CO2 can be heated, and allowed to cool, llike any other matter in the universe. No magic properties.

          As a matter of fact, the less CO2 between a heat source and a thermometer, the higher the temperature. The complete opposite of what some stupid and ignorant people try to claim. Obviously, removing all obstructions between a heat source and a thermometer (a vacuum) results in maximum energy transmission.

          Maybe if you think really, really, hard, while furiously clenching your teeth, and squinting as hard as you can, you can overturn the presently accepted laws of physics. On the other, you could ask yourself why you can’t find a testable GHE hypothesis. Think away, young Snape, think away.

          Cheers.

        • Gordon Robertson says:

          snape…”GHGs are not usually thought of as a heat source, but maybe they should be? The sun heats the earths surface, the surface heats GHGs and GHGs heat the surrounding air (by conduction)”.

          **********

          If that AGW theory is correct, there are a couple of issues you missed.

          1)The AGW premise is not that GHGs heat surrounding molecules, it is that GHGs radiate IR to the surface to raise the surface temperature beyond what it is heated by solar energy.

          The other premise is that GHGs slow heat dissipation from the surface, which is just plain silly.

          2)You have mentioned that GHGs heat other air molecules by conduction but failed to mention all those other molecules are heated directly by the surface. The GHGs do not heat by conduction since they are too far apart, they heat through collision, which is hit or miss.

          There is no proof of what happens during collisions. If the air temperature is at -50C, why should absorbed IR by 0.04% of air molecules representing CO2 do much of anything? They certainly won’t raise the air temperature high enough to exceed the surface temperature, a necessity for heat transfer.

          • Snape says:

            “You have mentioned that GHGs heat other air molecules by conduction but failed to mention all those other molecules are heated directly by the surface.”

            It was my understanding that O2, N2 are heated by conduction from multiple sources……the surface, airborne particulates, and GHG’s. According to Bond, who seems to know his stuff, I’ve been wrong about the GHG contribution.

          • David Appell says:

            Gordon Robertson says:
            You have mentioned that GHGs heat other air molecules by conduction but failed to mention all those other molecules are heated directly by the surface. The GHGs do not heat by conduction since they are too far apart, they heat through collision, which is hit or miss.

            What exactly do you think conduction is, Gordon?

        • David Appell says:

          No, GHGs aren’t a heat source, any more than is the coat you wear to keep warm or the blankets you sleep under.

          Why is this so difficult to understand????

          • Snape says:

            In a fit of stupidity, I imagined that N2/O2 recieved the lion’s share of energy in their exchange with GHG’s, reasoning that GHG’s are constantly absorbing LWIR whereas N2 and O2 are left out.

            Clearly not the case.

      • Gordon Robertson says:

        bond…”Another example is supercooled water. Water can (and does) exist at -10C without freezing if there are no impurities for the ice to crystallize on”.

        You’ve been adding vodka to your water, haven’t you?

        Salty sea water freezes at -1.9C and it’s full of impurities. If impurities are aiding the freezing, why doesn’t salt water freezing at a higher temperature?

        Remember, water freezes at 0C at STP.

        • Bond says:

          You COULD do your own investigation. But that would never occur to you, would it. Let me help you out:
          https://en.wikipedia.org/wiki/Supercooling
          http://www1.lsbu.ac.uk/water/supercooled_water.html
          http://www.popsci.com.au/make/hacks/make-instant-slushies-with-supercooling,463411
          https://aip.scitation.org/doi/full/10.1063/1.4737907

          Perhaps when you are finished you will be so intrigued by the science you will want to do even more research yourself. Perhaps you will investigate airplane crashes due to supercooled water condensing on the engines. But I won’t hold my breath. Science for you people means only ‘debunking’ something or perhaps earning an income. There is no innate interest, and no desire to delve deeply into a concept.

          • Gordon Robertson says:

            bond…”You COULD do your own investigation. But that would never occur to you, would it”.

            ********

            You present an outlier whereby a small percentage of water can remain liquid to -10C while inferring that is the case with all water.

            If you had studied anything in chemistry related to phase diagrams and eutectic points you would not need to Google for information. All I did was offer you an example where water heavy with impurities actually required a lower temperature to freeze.

            Not everything I post is an assault on other posters.

          • Gordon Robertson says:

            bond…”Perhaps you will investigate airplane crashes due to supercooled water condensing on the engines”.

            Yes…it’s known in aviation circles as icing. Here in the frozen wastes of Canada, airports in such regions have de-icing equipment on hand.

          • Bond says:

            Please learn the difference between “imply” and “infer”.
            If A says something to B, only A can do the implying, and only B can do the inferring.

            You incorrectly inferred a non-existent implication.

    • Gordon Robertson says:

      idiot…”In both cases one just strongly modulates conductivity, electrical via the number of charge carriers, holes or electrons, in semiconductors and thermal via the scattering of the heat carriers or IR photons in atmosphere”.

      ***********

      Your notion of CO2 as an impurity in the atmosphere is not even close to the purpose of dopants in semiconductors. For another, holes are not charge carriers, they are imaginary entities that, for some, enable better visualization. They are supposed to be the holes vacated by electrons in the valence bands of silicon atoms or the dopant atoms. The only entity carrying charge in a semiconductor is the electron.

      I have gone through decades of a career in electronics without once using hole theory. I simply visual electrons as flowing against the arrows in the semiconductor diagrams and have no problem whatsoever. That applies to both P-type and N-type.

      Dopants in a semiconductor do not modulate conductivity, either strongly or otherwise. They merely supply an excess of charge carriers (electrons) or create a shortage of them. Modulation in electronics is the addition of a low frequency signal to a high frequency carrier wave. The actual current through a semiconductor is controlled by series resistance and or voltage applied to the gates of FETs or current through the emitter-base circuits of BJT transistors.

      • Bond says:

        “Modulation in electronics is the addition of a low frequency signal to a high frequency carrier wave.

        Assuming you are talking about AM, the process is NOT one of addition. The signal becomes the envelope for the carrier. If the waves were being added, the carrier would oscillate about the signal instead of being contained by it.

        • Gordon Robertson says:

          bond…”Assuming you are talking about AM, the process is NOT one of addition. The signal becomes the envelope for the carrier. If the waves were being added, the carrier would oscillate about the signal instead of being contained by it”.

          How do you think a carrier wave running at 3.58 Mhz gets the shape of a lower frequency signal as an envelop?

          One way is to run the constant amplitude RF signal through a transistor via its base and use a low frequency modulator in the collector circuit. The low frequency signal adds and and subtracts from the RF signal impressing its shape on the carrier.

          What you get is a high frequency signal carrying a low frequency signal. When applied to an antenna, the hf modulated electrical signal is converted to a high frequency modulated EM signal that can be transmitted through space.

          Where have I hear that before?

          Oh, yeah, electrons convert heat to exactly the same kind of EM and it can be transmitted through space. If the low frequency modulating signal was audio from a microphone one would not expect audio to travel through the air from an antenna. Why should anyone expect heat to travel through space as EM?

          I have explained this several times and all I get are ad homs. Norman thinks I am making it up and David Appell refuses to take it in. Not one alarmist has tried discussing this with me.

          • David Appell says:

            Gordon Robertson says:
            Why should anyone expect heat to travel through space as EM?

            Because that’s what’s observed.

            Do you know how a heat-seeking missile works, Gordon?

    • Gordon Robertson says:

      Idiot…There are no HEAT carriers in EM. If you are going to talk science then please get it right. Heat is the kinetic energy of atoms in motion and must be CONVERTED to EM by electrons in order to generate EM into air. Once the EM is in the air it becomes far-field EM and has no relation to heat.

      I am emphasizing this point for a reason. If the generated EM is from a hotter body it can be absorbed by a cooler body when the electrons in the cooler body’s atoms convert it back to heat. Even via radiation, heat can only be transferred from a higher energy potential to a lower energy potential. The reverse transfer IS NOT POSSIBLE.

      That eliminates one side of the AGW theory that claims heat can be transferred from cooler CO2 molecules at 0.04% to a warmer surface that supplied the heat. Especially, the claim that the trace gas can supply enough heat to raise the temperature of the surface beyond the temperature it is heated by solar radiation.

      The notion that CO2 molecules in the atmosphere can slow down heat dissipation from a source, or act as a heat trapping blanket, is false. Heat dissipation is performed by valence electrons in atoms of the source material, they cannot sense CO2 in the atmosphere. All they can sense is the temperature immediately adjacent to them and that is not even a real sense.

      Electrons in a heated object (all objects are heated above 0K) reside in an atom at higher energy orbitals than the electrons in atoms of a cooler object. As long as the ambient temperature surrounding the object is the same as the atoms in the object, the electrons won’t drop en masse to a lower energy orbital and cool below the ambient temperature.

      The EM from a cooler object lacks the energy and the frequency to be absorbed by the electrons in the hotter body. The 2nd law is upheld.

      • Bond says:

        I want to transport water to my neighbor’s farm 5 miles away.
        To make the transport process easier, I freeze it to create ice blocks, truck the ice blocks to my neighbor’s farm, then dump the ice into his water supply where it melts.

        Only a pedant would state that I didn’t transport water.

        • Gordon Robertson says:

          bond…”I want to transport water to my neighbors farm 5 miles away.
          To make the transport process easier, I freeze it to create ice blocks, truck the ice blocks to my neighbors farm, then dump the ice into his water supply where it melts”.

          ********

          I have tried to warn people about using analogies in thought experiments that do not apply.

          When you freeze water and transport it by foot you are still carrying molecules of water in the frozen state. No heat is carried by EM since that would require transporting the atoms to which the heat is related.

          Heat transfers through space in name only. The transfer refers to a reduction of heat in the hotter body and an increase in the cooler body.

          The transfer is possible because the electrons can convert heat to EM. Once the conversion is made, the heat as kinetic energy disappears from the atom and is converted to electromagnetic energy as potential energy. That potential energy can be converted back to kinetic energy (heat) in a cooler body when the electrons in that body absorb it and convert it to kinetic energy.

          • Gordon Robertson says:

            you can call this a pedantic explanation if you like but there is a very important principle involved here that is the 2nd law. The EM from two bodies can intercept each body but the 2nd law requires that only the EM from the hotter body can be absorbed by the cooler.

            That’s why I keep hammering at the obvious. Even though EM can travel both ways heat can only TRANSFER one way. The notion that a net sum of EM can satisfy the 2nd law is wrong. Heat cannot be transferred in both directions simultaneous between bodies of different temperatures.

            The notion of a net heat transfer is unscientific given the manner in which electrons are confined to certain restrictions re absorp-tion and emission.

          • David Appell says:

            Gordon is an expert on the 2LOT, don’t you know.

            Shame he doesn’t have the motivation to write even a single paper on it, and set every straight after all these decades.

            I guess there will be no Nobel Prize for GR. Americans usually win them anyway.

          • Bond says:

            “The EM from two bodies can intercept each body but the 2nd law requires that only the EM from the hotter body can be absorbed by the cooler.”

            So when EM impinges upon a body:

            (1) How does the body know whether the source was a hotter or colder body? Does the photon carry with it a note that says “delivered courtesy of a 5000 degree star”?

            (2) Once the body makes this impossible decision, where does the unabsorbed radiation go?

            The laws of thermodynamics are MACROSCOPIC laws based on averages and associated with probabilities. Individual photons have probabilities of being absorbed that have nothing to do with where they came from. The laws of thermodynamics are an emergent property when very large numbers of photons are considered.

            You need to extend yourself beyond the basic formulations of the laws of thermodynamics that are taught in undergraduate courses, and study post-graduate STATISTICAL THERMODYNAMICS that considers the emergence of these large-scale properties from microscopic probabilities.

      • Tim Folkerts says:

        Gordon, pretty much everything you say here is incorrect. Some is archaic; some is simply wrong.

        “Heat is the kinetic energy of atoms …”
        No, “internal energy”, U is the kinetic (and potential) energy of atoms.

        “Electrons in a heated object (all objects are heated above 0K) reside in an atom at higher energy orbitals than the electrons in atoms of a cooler object.”
        ON AVERAGE electrons in a WARM object are at higher levels. Some electrons in cool materials are indeed at higher levels than some electrons in warm materials.
        [Also, the description of thermal energy residing in electrons in different “orbitals” is problematic.]

        “The EM from a cooler object lacks the energy and the frequency to be absorbed by the electrons in the hotter body.”
        The EM radiated from any body covers a RANGE of energy/frequency/wavelength. Just like there are fast molecules zipping around the air and slow molecules — all at the same temperature!

        Both the hot sun and cool earth can emit 4 um IR photons. How in your hypothesis would an object know whether it should absorb a 4 um photon when the object has no knowledge of where that photon came from???

        “That eliminates one side of the AGW theory that claims heat can be transferred from cooler CO2 molecules at 0.04% to a warmer surface that supplied the heat.”
        That is not a claim of AGW or GHE theory!
        The measurable, macroscopic, net transfer of thermal energy (ie heat) is ALWAYS from warmer to cooler — exactly as classical thermodynamics predicts. Even for IR, the transfer (356W/m^2 – 333W/m^2 using the oft-quoted Trenberth numbers) is 23 W/m^2 from the warm surface to the cooler air/clouds.

        *******************

        PLEASE — if you disagree, find even a single textbook (written in the last 80 years!) that agrees with you on these issues and disagrees with me. Point us to the source.

        • Gordon Robertson says:

          tim…”No, internal energy, U is the kinetic (and potential) energy of atoms”.

          Tim…I am not interested in one-upping you here, I am trying to learn by discussing the science as I understand it at different levels. You calling me wrong, or me calling you wrong, is not helpful.

          Internal energy is not some kind of mysterious free-floating generic energy. Internal energy is kinetic in nature since the internal energy applies to the vibration of atoms in their lattices. When you add heat to a solid, it is absorbed in the vibrating lattices, causing them to vibrate harder. If you add enough, you will break the bonds.

          The first law is Q = U + W. Clausius created that term U and he explains it as both the heat and work of atoms. He instructed that heat can be added externally and/or work done on the solid.

          I suggest that you have been lead astray with your instructions in thermodynamics and I’d like to see you open up a bit in that regard. Being right serves no purpose in science. Modern theory is not correct unless it makes sense.

          **********

          “ON AVERAGE electrons in a WARM object are at higher levels. Some electrons in cool materials are indeed at higher levels than some electrons in warm materials.
          [Also, the description of thermal energy residing in electrons in different orbitals is problematic.]”

          Not enough info, Tim. You need to specify cooler and hotter. I would agree that cooler and hotter wrt to near-thermodynamics equilibrium condition might meet your definition. Under such conditions there would be little or no heat transfer.

          The thermal energy related to different orbitals comes from the wave equation which defines the orbitals. It is based on the angular momentum of the electrons hence their kinetic energies.

          *********

          “The EM radiated from any body covers a RANGE of energy/frequency/wavelength”.

          The frequency is the main problem. E = hf. The lower the temperature the lower the frequency. It also depends on which orbitals differences are involved. I regard the frequency aspect wrt tuned, resonant circuits. If the tuning is sharp, frequencies outside the bandwidth are rejected. Norman just posted a link to that effect.

          It is my understanding that transitions between the ground state and the next state are not frequent and that it would require energies from the UV range to force a ground state electron to the next energy orbital. I don’t think it’s likely that a cooler object will emit a broad range of EM frequencies. Look at the Earth.

          It’s obvious that for a heated object the source of its heat must remain intact. With a cooling object it is a different kettle of fish. If an object is maintained at a higher temperature, and it’s electrons have all relocated to higher energy levels, I see no reason why EM from a significantly cooler object should be able to move them even higher.

          That would imply with a heated object that EM from a cooler body could make it even warmer and that has proved not to be the case. If it was true it would create a possible perpetual motion condition.

          ********

          “How in your hypothesis would an object know whether it should absorb a 4 um photon when the object has no knowledge of where that photon came from??? ”

          Why does it matter, all an electron cares about is that the photons E = hf matches its E = hf? It’s not yet clear to me what happens if E = hf cool > E = hf hot.

          Not only is the frequency important, the E must match the potential difference between energy orbitals. I regard that as a double whammy.

          ********

          “The measurable, macroscopic, net transfer of thermal energy (ie heat) is ALWAYS from warmer to cooler…”

          There is no such thing as a net transfer of thermal energy. Due to the quantum nature of electrons and electron orbitals, heat cannot transfer both ways simultaneously, nor can EM.

          There are rules and one of the most basic is the 2nd law which says nothing about a net transfer.

          **********

          “Even for IR, the transfer (356W/m^2 333W/m^2 using the oft-quoted Trenberth numbers)….”

          I not only think Trenberth is full of crap, I personally regard him as dishonest. His calculations are based on misinterpretations of Stefan-Boltzmann and I think he is way off base.

          In the Climategate emails he admitted the warming had stopped but when the emails were published he back-peddled furiously. He was also involved with interference in peer review.

          • David Appell says:

            Gordon Robertson says:
            I not only think Trenberth is full of crap, I personally regard him as dishonest. His calculations are based on misinterpretations of Stefan-Boltzmann and I think he is way off base.
            In the Climategate emails he admitted the warming had stopped

            Gordon lies again.

            On purpose.

          • David Appell says:

            Kevin Trenberth:

            In my case, one cherry-picked email quote has gone viral and at last check it was featured in over 107,000 items (in Google). Here is the quote: “The fact is that we can’t account for the lack of warming at the moment and it is a travesty that we can’t.” It is amazing to see this particular quote lambasted so often. It stems from a paper I published this year bemoaning our inability to effectively monitor the energy flows associated with short-term climate variability. It is quite clear from the paper that I was not questioning the link between anthropogenic greenhouse gas emissions and warming, or even suggesting that recent temperatures are unusual in the context of short-term natural variability.

            http://www.cgd.ucar.edu/staff/trenbert/emails/

          • Tim Folkerts says:

            Gordon says: “Internal energy is kinetic in nature since the internal energy applies to the vibration of atoms in their lattices. “
            The “spring” energy (potential energy) must also be included in the internal energy to get the right specific heat.

            “Clausius created that term U and he explains it as both the heat and work of atoms.”
            I would be surprised if he explained U in such a way (and even if he did, we should look to the improvements that have been made to the theories, not the very first statement of theories). Nothing “contains” work (W) — work is a process that transfers energy. If I push on a car I *do* work (W) but the car *gains* kinetic energy (KE). If I push down on a syringe, I *do* work on the gas in the syringe, but the gas *gains* internal energy, (U).

            Similarly, nothing “contains heat” — heat is the process that transfers energy. if I put a pan on a hot stove, heat (Q) is the process that transfers energy, but there is no “heat” in the pan.

            “It is my understanding that transitions between the ground state and the next state are not frequent and that it would require energies from the UV range to force a ground state electron to the next energy orbital.”
            That is a good understanding for photons FROM INDIVIDUAL ATOMS.

            For a molecule like CO2, there are ALSO vibrational and rotational energy levels. These modes are at much lower energy — typically IR levels. These CAN occur frequently at room temperature.

            For solids, there are even MORE possible energy levels, allowing many solid to emit photons at pretty much any energy. This allows many solid to emit photons at pretty much any energy and to generate a spectrum of outgoing photons that look much like a blackbody spectrum.

            “all an electron cares about is that the photons E = hf matches its E = hf?”
            Yes — the absorbing object only cares about the energy of the photon! And so since CO2 can absorb 15 um photons, it absorbs a 15 um photon just a well whether it came from a hotter source or a colder source.

            *****************************

            That is more than enough for now. Basically, you have some fundamental misunderstandings that lead you to be quite confidently wrong about many things.

      • To the above relevant comments by Tim Folkerts and a few others one may add this:

        GR further claimed:

        For another, holes are not charge carriers, they are imaginary entities that, for some, enable better visualization.

        This is wrong and archaic too but by the way points to a very interesting fundamental concept in physics.
        There is now ample evidence that holes in semiconductors are actually particles exactly as real as are the electrons in that same semiconductor. Both carry charge, mass, momentum and energy. Their measured or “effective” mass depends on the material in which they exist and even electrons have a mass that depends on material and that differs definitely from the mass of a free electron in vacuum.
        In super conduction one observes similarly even particles with twice the charge of an electron and in quantum Hall effect one observes particles whose charge is fractional, for instance one third of the electronic charge.
        All these things are called quasi particles because they are obviously not elementary particles and show up only in a material at low enough temperatures.

        • Gordon Robertson says:

          idiot…”For another, holes are not charge carriers, they are imaginary entities that, for some, enable better visualization.

          This is wrong and archaic too but by the way points to a very interesting fundamental concept in physics.
          There is now ample evidence that holes in semiconductors are actually particles exactly as real as are the electrons in that same semiconductor. Both carry charge, mass, momentum and energy”.

          ********

          Shockley coined the term ‘hole’ and he admitted in the first page of his book that the hole is an abstraction that gives a convenient method of describing the electron. If an electron vacates a space in a valence band of an atom and a nearby electron moves into the vacated hole, if viewed over the entire slab of a semiconductor it appears as if the holes are flowing the other way.

          The electron carries a charge but the only way the hole left behind can be regarded as a positive charge is wrt the other electrons left behind. That is not a real charge, it more akin to an atom as an ion, where a missing or excess electron can give the atom an apparent +ve or -ve charge. In the case of ions, it simply means the atom has more or less electrons that it should have.

          The only real charge equivalent to the electron is the proton in the nucleus, which has a real positive charge. Of course, positively charged nucleii in solids do not move.

          A hole left behind when an electron vacates is no different than a hole dug in the ground or a hole left in a line of parked cars when one car leaves. If you want to claim that space has mass, a charge, momentum, and such, fill your boots.

          • David Appell says:

            GR says:
            “the only real charge equivalent to the electron is the proton in the nucleus”

            actually the best equivalent to an electron is the muon, which is just a heavy electron.

            next would be the positron.

        • All these quasi particles are actually elementary excitations of some reference ground state of a system, for instance a crystalline insulator in the case of electrons and holes and even something more remarkable called excitons and phonons in semiconductors. They describe its low energy excitation spectrum and are generic. They may sometimes have a naive interpretation in terms of “electrons jumping between orbitals” as is the case with electrons, holes and excitons in semiconductors. But generally there is definitely none as is the case with the example of super conduction, fractional quantum Hall effect or ferromagnetism. Nor is there vith phonons, the quasi particles associated with sound in a crystal.
          In this respect when the reference system is not a crystal but a single molecule such as CO2 such elementary excitations similarly exist but are no longer quasi particles. The vibration mode at 15 micrometers of CO2 is precisely such an elementary excitation of the molecule on the one hand and has no naive interpretation in terms of “electrons jumping between orbitals” on the other hand, a point that definitively goes over the head of GR.

    • Tim Folkerts says:

      IT, I agree with pretty much everything you say.

      The big challenge is that everyone here operates at different levels and has different priorities. They have followed different parts of the conversation.

      So an analogy might seem too simplistic to some, but go right over the heads of others. Some might apply it too the wrong situation. Some might ignore it and go off on their own completely different tangent.

      So we are doomed to incomplete conversations that are at cross-purposes.

  48. ren says:

    Please see what is happening in Hawaii.
    http://quakes.globalincidentmap.com/

  49. gbaikie says:

    — Insight Has Left Earth
    By Keith Cowing on May 5, 2018 9:42 AM.

    Insight Is On Its Way To Mars (with video)

    “An Atlas V rocket lifted off at 7:05 a.m. EDT (4:05 a.m. PDT) from Space Launch Complex 3 at Vandenberg Air Force Base in California, carrying NASA’s InSight spacecraft. … ”

    From:
    http://nasawatch.com

    If it lands on Mars safely, it should get interesting results.

  50. Petwap says:

    Hi Mike Flynn. I follow your logic and I wonder what you have for background? myself i am a simple forensics technician!

    • Svante says:

      What logic ???

      • Petwap says:

        The logic that says there is a rule for rational thinking that says to be careful to construct hypotheses that automatically confirm themselves!

    • Mike Flynn says:

      Petwap,

      My background is extremely broad, it would seem. I dont go into specifics to avoid argument. I present what I believe is fact, based on personal knowledge (often backed up by a quick check, just in case my memory has led me astray).

      People tend to argue based on whose expert is more expert than the others. I find facts more persuasive. Unfortunately, facts have way of changing. Continental drift, causes of stomach ulcers being a bacterium, and many others.

      I hope people dont change their views just because I say something (although I would fell flattered if they did, of course), but rather because they agree with my view after checking the facts for themselves.

      Oh well. Back to asking to see a testable GHE hypothesis, I suppose. At least some of my history shows that a certain amount of tenacity and repetition can be required to overcome obstacles which seemed insurmountable at first.

      Thanks. I havent answered your question at all, really. I apologise, but I have good reasons.

      Cheers.

    • Gordon Robertson says:

      petswap…”Hi Mike Flynn. I follow your logic and I wonder what you have for background? myself i am a simple forensics technician!”

      Simple or not, if you stick to the scientific method, question paradigms that make no sense, and try to get your ego out of observations, you can’t go wrong.

      Remember this: the observer is the observed. If you have an active observer, as in a self or ego, it will tend to see in an observation what the self has been conditioned to see.

      If you want an example of that, stick around and watch the alarmists here appealing to authority, regurgitating paradigms, offering thought experiments in lieu of the scientific method, and using general ploys to justify their pseudo-science.

      • Petwap says:

        True. Well, I do not really know if the examples are so interesting. But a solid GHE hypothesis would have been interesting.

        • Gordon Robertson says:

          petswap…”But a solid GHE hypothesis would have been interesting”.

          Richard Lindzen, an MIT professor in atmospheric physics has called the GHE overly-simplified. I think he was being kind.

          It amazes me that no one seems interested in proposing a GHE theory that makes sense. Why stick with an explanation that would embarrass kids in kindergarten (more German for binny)?

          • David Appell says:

            Sure, Gordon knows what GHE “makes sense,” but tens of thousands of PhD scientist/researchers in the 20th century do not.

            Gordon, where are your paradigm disproving published papers?

            It’s a shame you have no motivation to write them.

        • Nate says:

          Petwap,

          Mike has been given the GHE hypothesis here many times. Yet he ignores these or has severe memory lapses, and just keeps repeating the question. He also seems unable to use Google to look up answers that he is seeking. Then he blames others for his own lapses.