The 36 Costliest U.S. Hurricanes Have Not Increased in Intensity Over Time

September 12th, 2018 by Roy W. Spencer, Ph. D.

UPDATE: Includes all 36 most-destructive U.S. hurricanes in the U.S. Govt. report.

As part of the 2nd edition of my Kindle e-book Inevitable Disaster: Why Hurricanes Can’t Be Blamed On Global Warming, I include the following graph, based upon data in a January 2018 U.S. Government report.

In the top panel we see that the average monetary damages of the 36 most costly hurricane disasters in U.S history has gone up dramatically in recent decades.

But in the 2nd panel we see that the average intensity of those 36 most costly storms has not increased actually decreased..

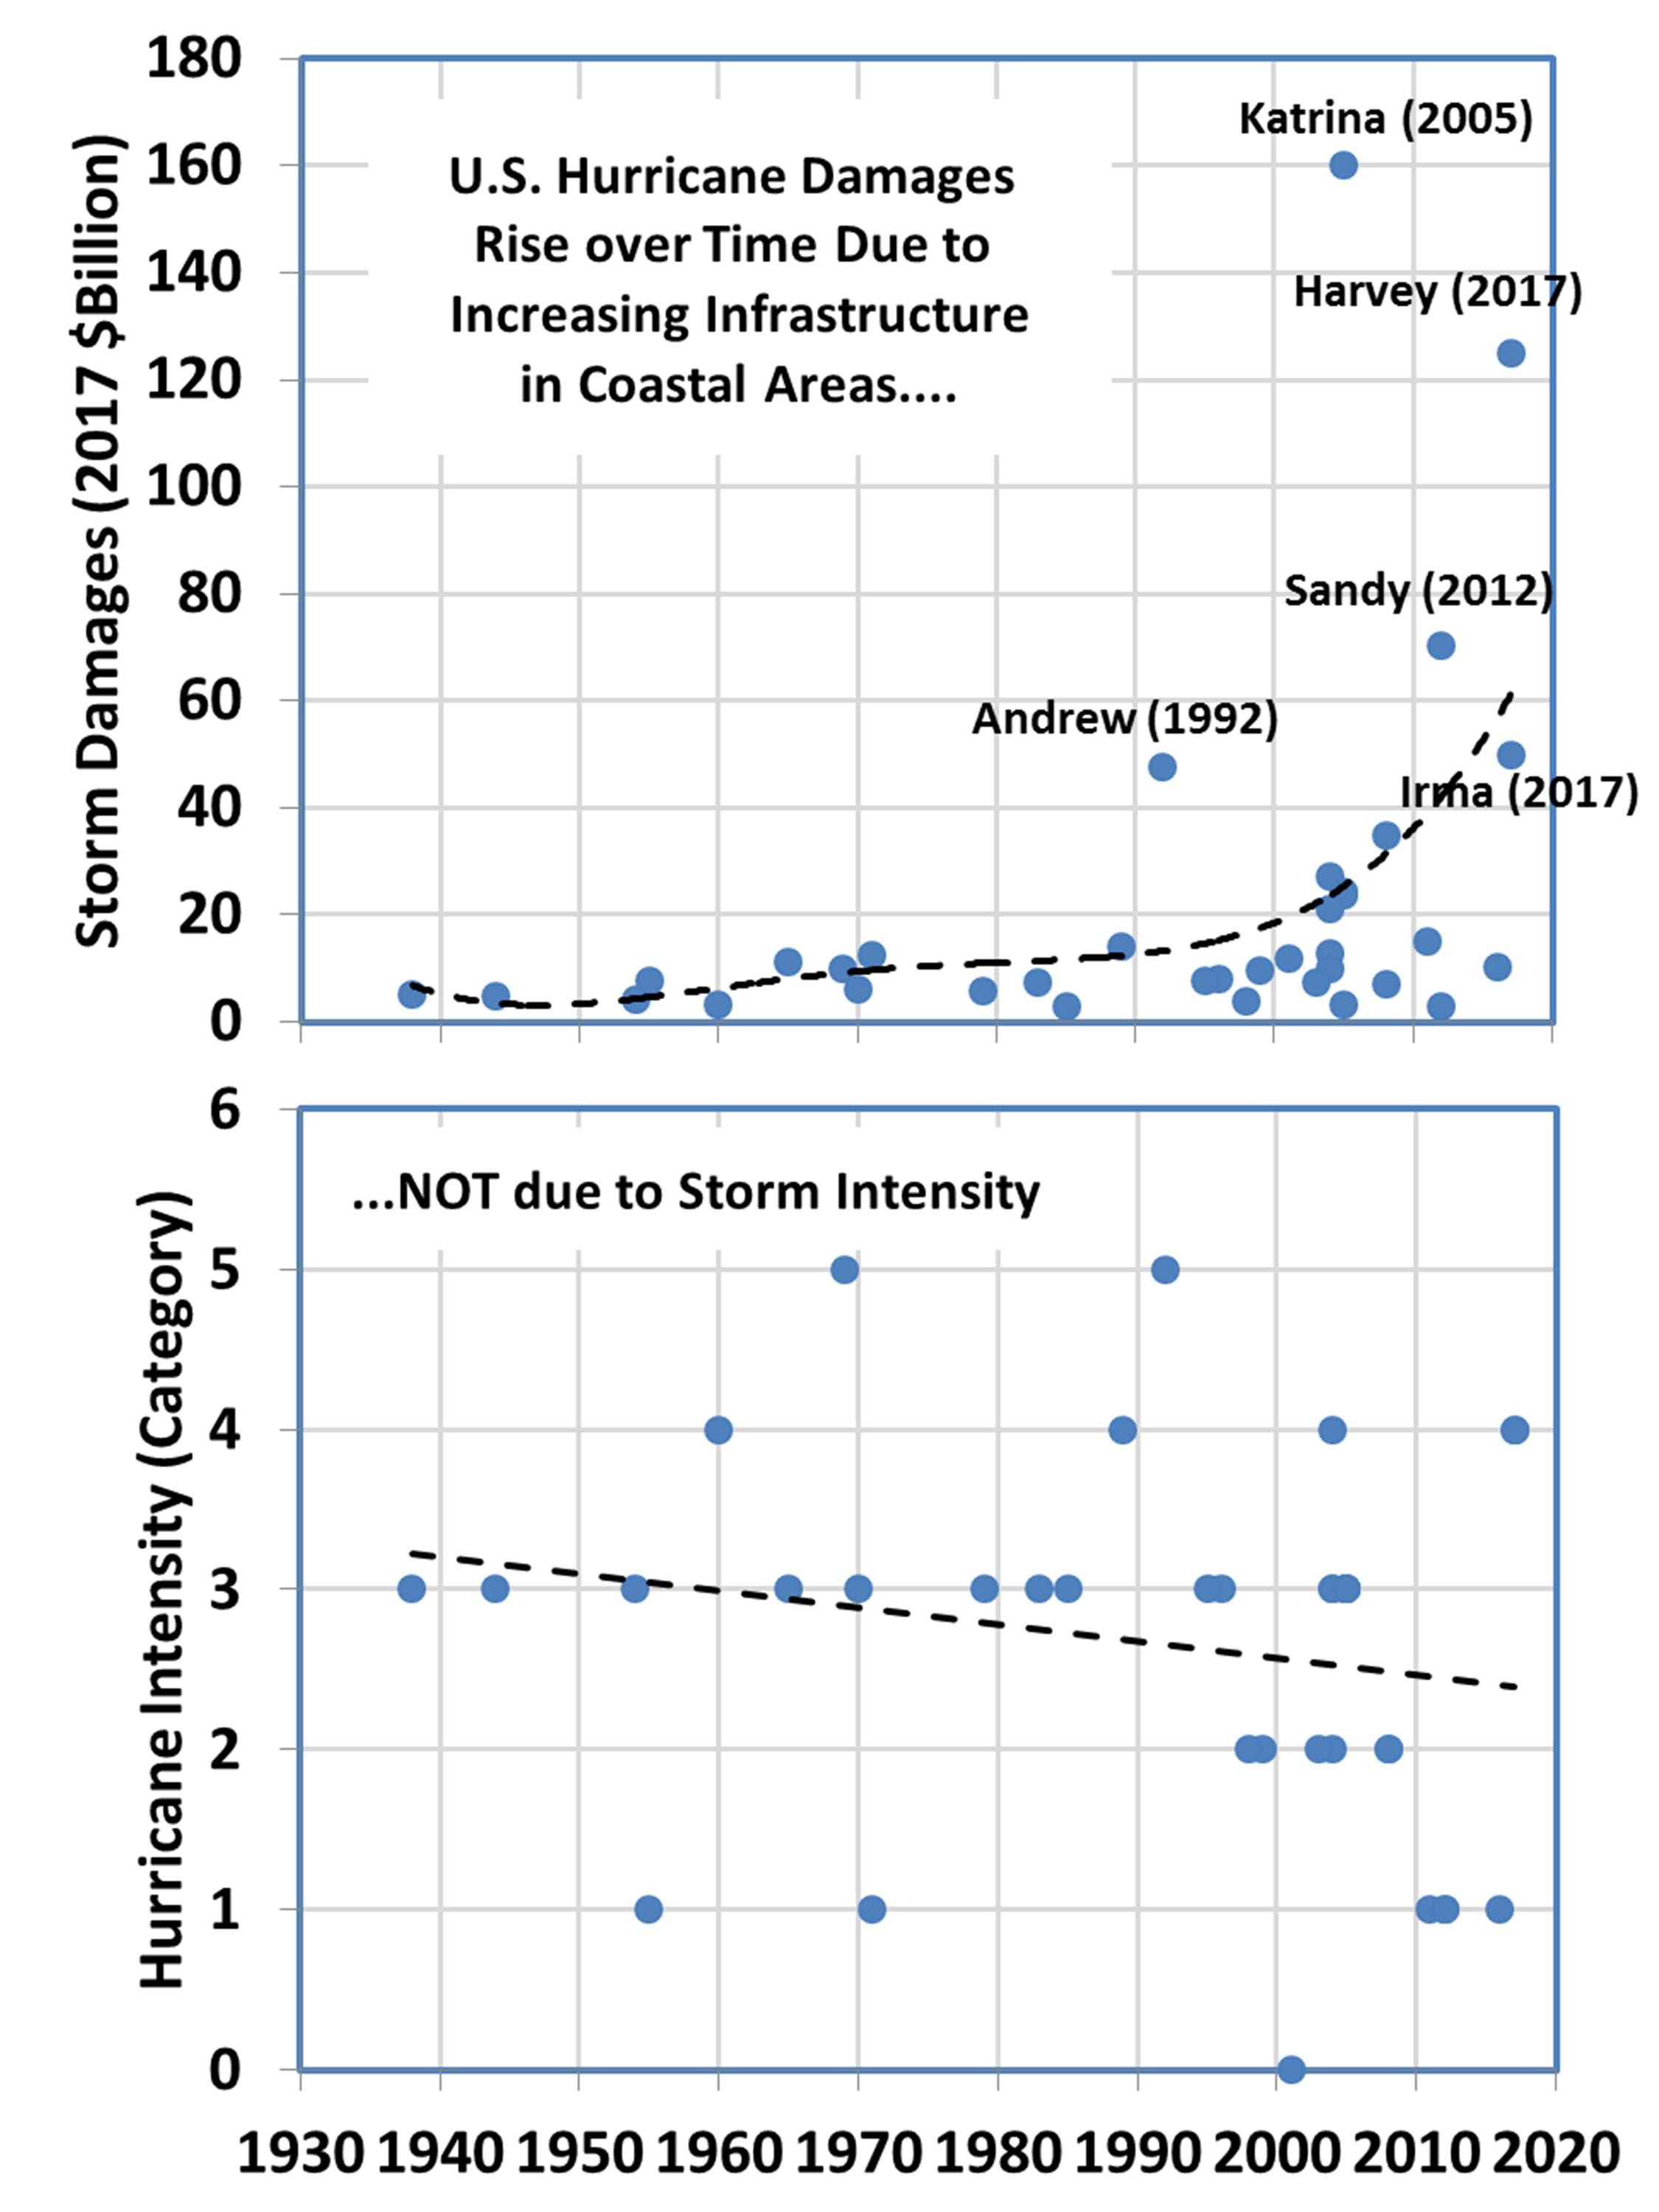
Most recent (2018) U.S. Government analysis of the 36 most costly hurricane disasters in U.S. history, showing that increasing damages are due to increasing population density and infrastructure vulnerability, not due to storm intensity.

The increasing number of “damaging” storms in recent decades is, of course, an artifact of the increasing monetary damages with time: only the 36 most costly storms are included.

Of course, this is what Roger Pielke, Jr. has been saying for years.

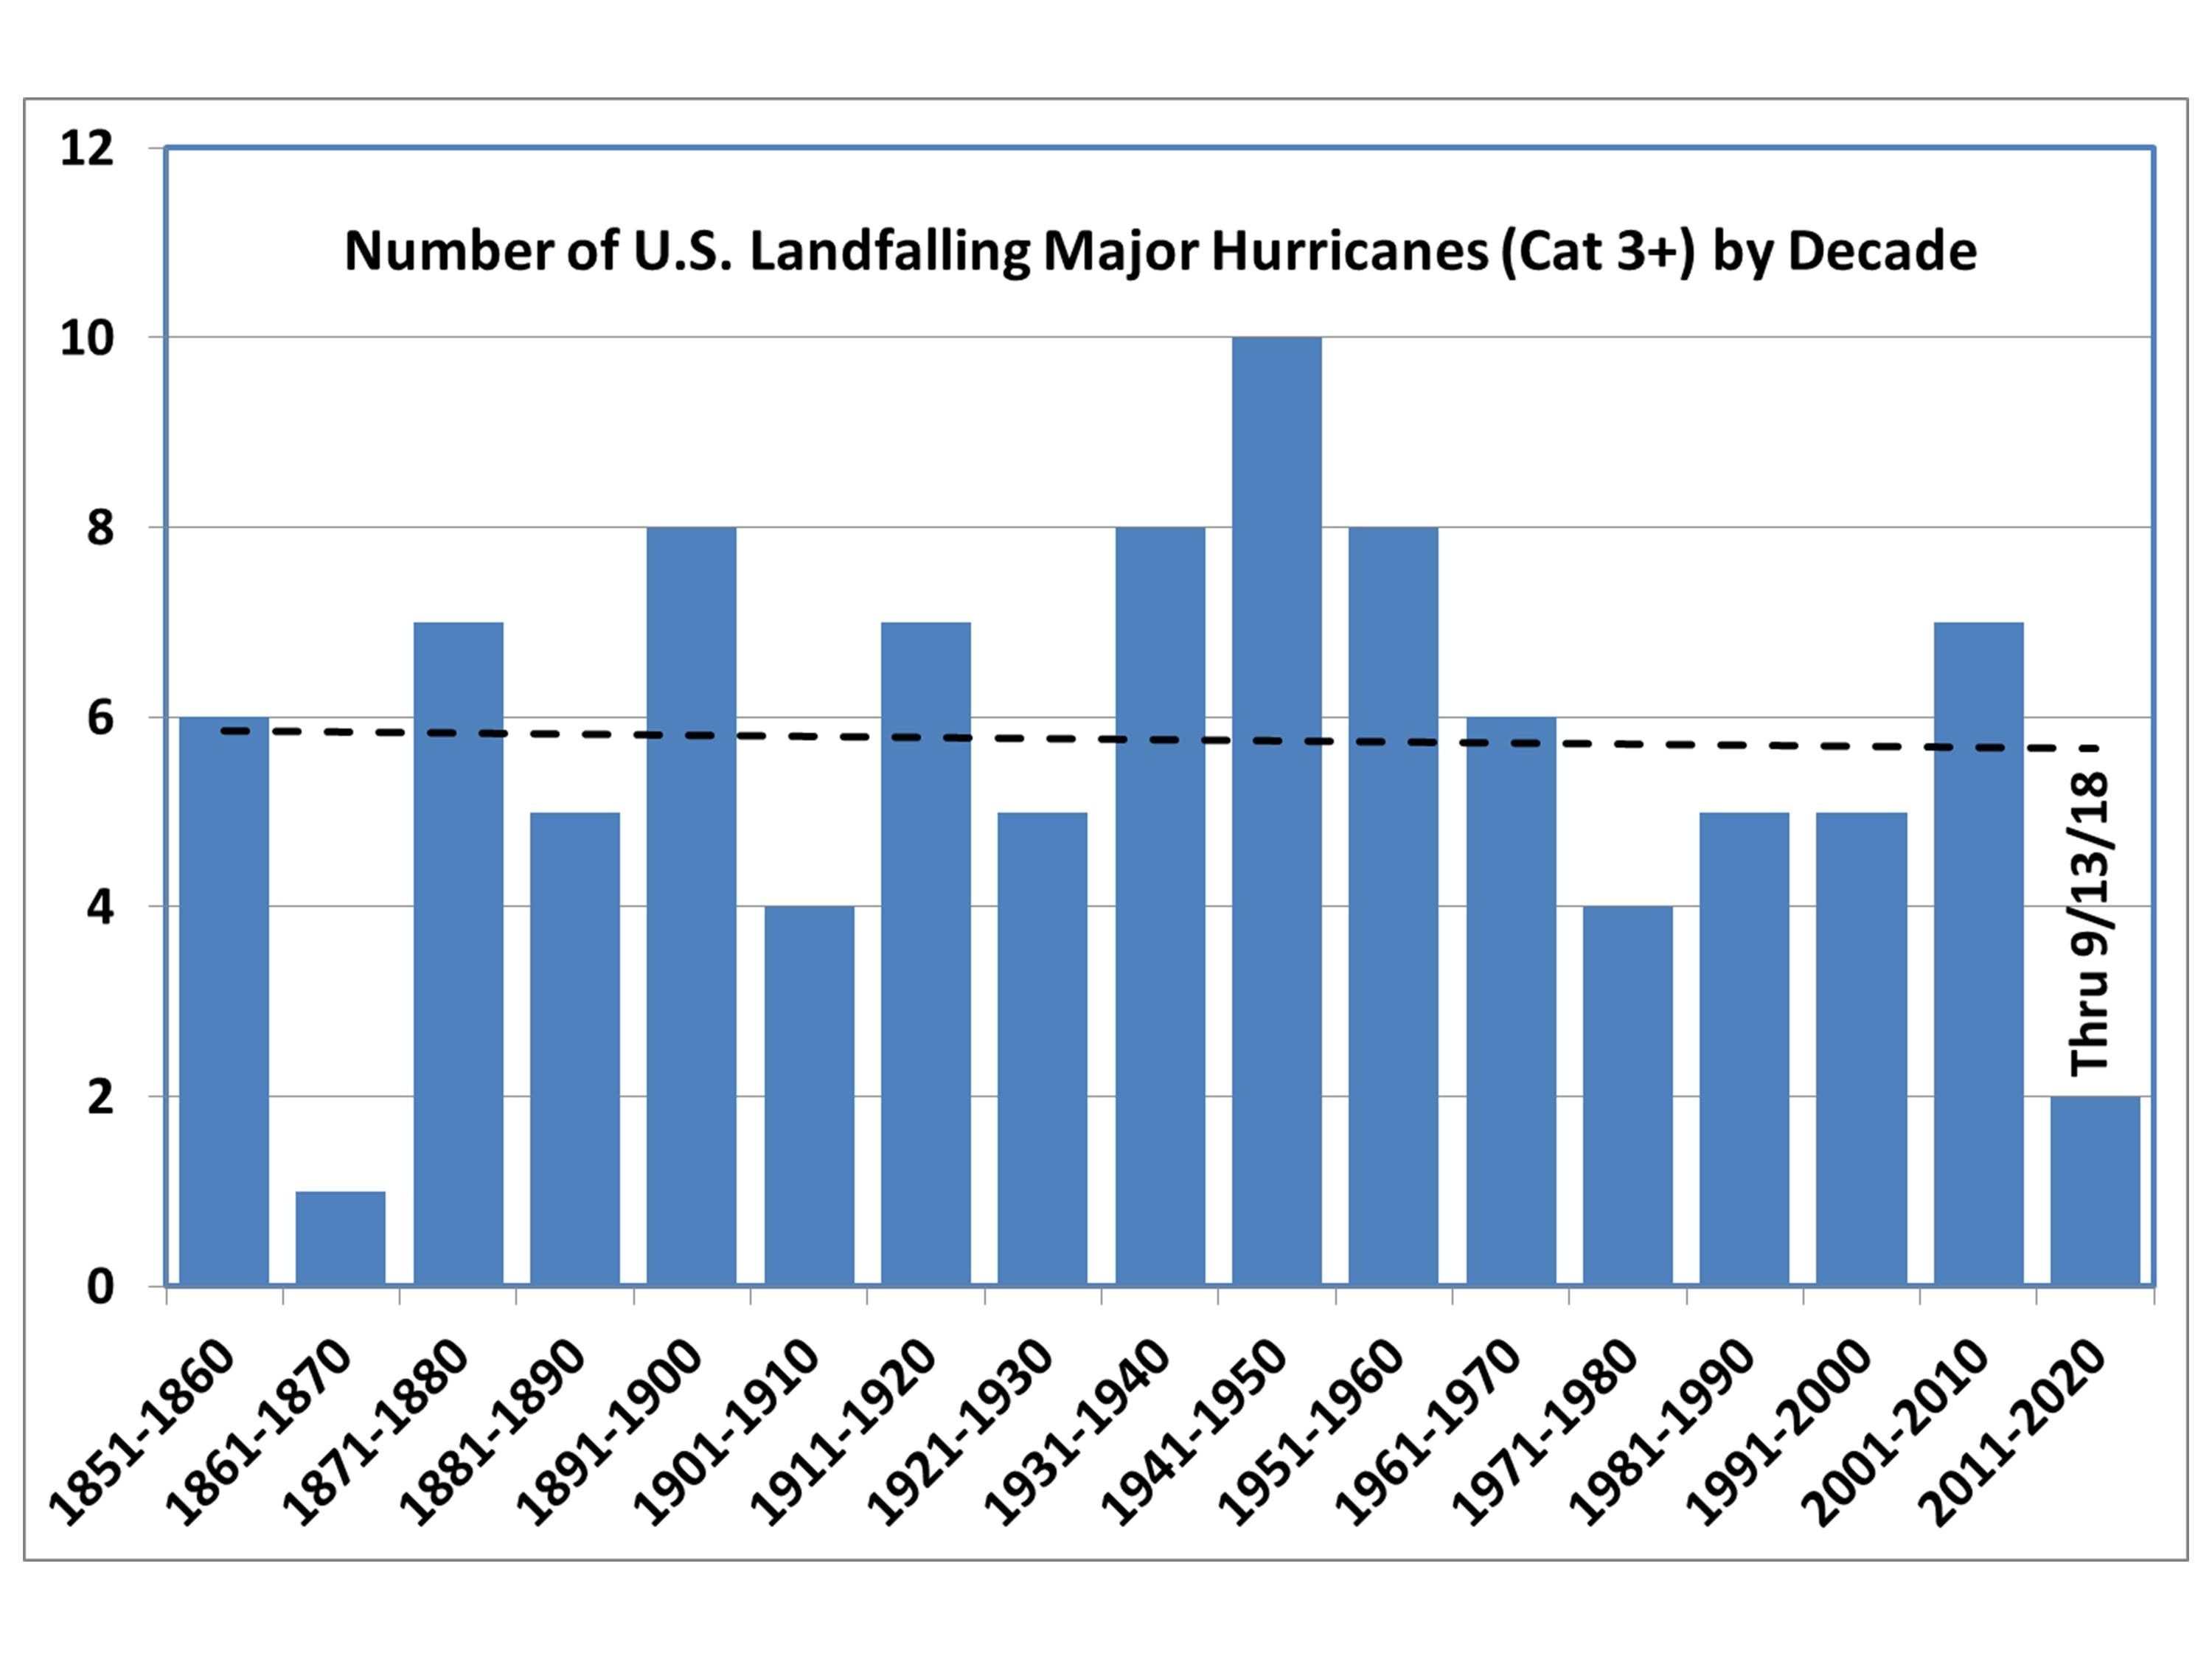
If you are wondering about whether the number of ALL major hurricanes (whether causing major damage or not) have increased, here’s that plot. Even considering there’s still some time left in the current decade, I’d say there’s no statistically significant trend…and certainly a downward trend since the 1940s!:


39 Responses to “The 36 Costliest U.S. Hurricanes Have Not Increased in Intensity Over Time”

Toggle Trackbacks

  1. Mickey Prumt says:

    When was the last Us landfall ?

    Last years we had awsome statistics about that.

    This year : nothing.

  2. Ric Werme says:

    I just made a mention about Hurricane Hazel wiping out Myrtle Beach in 1954. (I’ve never been there – what a target today!)

    Your graphic shows a Cat 1 dot for the 1950s.

    It appears that Hazel (Cat 4 at SC landfall) didn’t cause enough damage to make the list!

    However, two did:

    23 Diane 1955, cat 1
    34 Carol 1954, cat 3

    Oh. Carol isn’t in the top 30. That’s amazing, it was one of the iconic storms of that decade.

    Nevermind, your graphic looks right.

    And the hurricane of ’38 is only #32. That’s the event safety directors in northern New England most fear to see repeated.

    • Gary says:

      Extensive damage from the 1938 storm and flooding of downtown Providence, RI by Carol in 1954 caused the state to construct a hurricane barrier in the 1960s. It has controlled gates and a pumping system to expel water collecting behind it because Providence is sited on the confluence of two rivers and the commercial sector sits in a basin. The barrier has been effective with smaller storms, but has not been challenged yet by one of historical proportions.

      • Ric Werme says:

        Yes, New York City was not in the right front quadrant of the storm and didn’t learn from Providence. They didn’t even take steps to prevent the subway system from flooding until Sandy “reminded” them.

      • As I recall, New Orleans was a disaster waiting to happen. The Corps of Engineers designed and built levee and seawall systems sufficient for a cat 3 – knowing full well the eventual probability and catastrophic consequences a 4-5 storm would pose. Then again – given much of the city below sea level – and massive exposure via the river and canal systems – you have to wonder, was a cat 5 capable system even realistic or feasible? Or cost prohibitive?

  3. Rah says:

    During my driving this week seen a lots of evidence of pre-positioning of assets and supplies. At least 40 utility trucks have passed by me just in the last hour as I sit here in a Rest Area off I-81 south of Harrisonburg, VA. Have seen convoys of tankers and even HVAC trucks during my travel east on I-80 and south on I-81.

  4. Nate says:

    We have the infrastructure and population density that we have, today.

    What your plot doesnt show is how hurricanes of different strengths would impact the same locations, today.

    Intuitively a stronger hurricane would have a greater impact than a weaker one on the same city, today.

    But your plot obscures this relationship.

    In the recent 30 y, the strongest hurricanes have been the costliest. Andrew,cat 5, Harvey cat 4, Charley cat 4, Hugo cat 4, Katrina, a cat 3 at landfall, was a cat 5 just prior, and was very wide. Sandy is an outlier in its location and circumstances.

    • Chic Bowdrie says:

      “But your plot obscures this relationship.”

      Neither plot obscures the cost vs. hurricane intensity relationship, because the plots weren’t intended to show what is intuitively obvious. What is obscured by the first plot (that huricane costs are not increasing due to “climate change”), is clarified by the second plot.

    • Nate says:

      Perhaps. I plotted all since 1990. Cost vs cat.

      This produces a line, with $13 B increase for increase by 1 in category.

      Is so, then increasing strengths will increase costs, clearly.

  5. Lou Maytrees says:

    The title of your ebook Dr. Spencer is confusing. Who ever said that AGW is to blame for hurricanes? I have not heard one single scientist say that before b/c they all know that it is an incorrect statement. Just wondering why such a title?

    • Gary says:

      Every politician and journalist invoking the AGW meme makes the erroneous claim. The book is written for people subjected to their alarmism.

  6. ren says:

    Florence moves north and weakens.

  7. ren says:

    Florence is still around 400 km from North Carolina.
    https://files.tinypic.pl/i/00971/nzgiqy0opwr1.jpg

  8. Entropic man says:

    Dr Spencer

    Your second graph shows the 30 most damaging hurricanes and claims a downward trend in intensity.

    The mean intensity is 2.6 and the 95% confidence limits +/- 3.2.

    The uncertainty is much bigger than the claimed trend.

    Claiming a decline, no change, or an increase on the basis of that data is meaningless.

    The Accumulated Cyclone Energy (ACE) index is a better measure of the overall intensity trend.

    https://en.m.wikipedia.org/wiki/Accumulated_cyclone_energy

    That also has too much variability to be statistically significant yet, but is more likely to show any long trend, because it does not require any economic corrections.

    • Nate says:

      Yes, and I see Maria, a cat 4/5, and one of costliest, is not included, and Irma and Harvey were both cat 4s. So there should be 3 dots in 2017 at cat 4

    • Chic Bowdrie says:

      “The uncertainty is much bigger than the claimed trend.”

      The claim was no trend. Dr. Spencer: “…the average intensity of those 30 most costly storms has not increased.”

      Claiming otherwise would require some indication of statistical significance.

      • Entropic man says:

        Chris Bowdrie

        Exactly. The problem with the available hurricane data is that the confidence limits are large enough to preclude demonstrating a statistically significant trend in either direction.

        I cannot prove that hurricanes are becoming more intense and Dr Spencer cannot prove that they are becoming less intense.

  9. ren says:

    The North Carolina coast is already within reach of a hurricane. Florence maintains the direction of NW.
    https://images.tinypic.pl/i/00971/ol1bus65tnun.png

  10. ren says:

    Hurricane Florence weakened and virtually has the strength of a tropical storm. The radar shows strong precipitation on the North Carolina coast.

  11. Nate says:

    We had 3 majors in 2017..you show 2 for the decade

  12. argus says:

    Matthew could potentially be ruled out. I only count 2 in this list if that’s the case.

    https://www.usatoday.com/story/money/2018/09/12/most-destructive-hurricanes-of-all-time/36697269/

  13. Nate says:

    Maria, Harvey, Irma majors in 2017

  14. argus says:

    This seems to correlate for mainland landfall. I was confused on the previous post, like usual.

    http://www.aoml.noaa.gov/hrd/tcfaq/E23.html

  15. AndyHcd says:

    In regard to hurricanes and near hurricanes, there have been several lately that brought considerably rain. Fairly recently, perhaps two years ago, there was one that almost ran into the Carolinas but veered out to sea.

    However, it soon ran into high pressure blocking and stalled for awhile where it was able to continuously suck up water. At the same time, another air mass provided a low pressure trough from the storm into shore, directing heavy rain onto land.

    Last year Harvey stalled for three days over the coast, for the same reason as I understood it, bringing much sea water, in the form of rain, onto the coast.

    I believe I read something about Sandy doing something similar, with New York being the target but I’m not sure. Now however, some similar blocking has been declared a fair probability for Florence, which would mean prolonged heavy rain in the Carolinas again, even if the storm is less intense than first feared.

    While the rate of intense storms is lower than last century, and the overall energy isn’t gong up, is this kind of atmospheric blocking, leading to heavy rains, seem tp be any more common than in the past 100 years?

  16. CO2isLife says:

    Here is a good review of the Al Gore Bill Nye experiment. Pay special attention to the special glass needed for IR Photography.

    Bill Nye, The Sophistry Guy: The Truth is Out There, Only No One is Listening
    https://co2islife.wordpress.com/2018/04/06/bill-nye-the-sophistry-guy/

  17. Gunga Din says:

    Nice job highlighting that the storms themselves haven’t changed but that the only the “cost” of them has. The “cost” has increased because of more people building more expensive stuff in harms way.
    “They” love to use “cost” of an event as a measure to confuse people as to the intensity of the actual event to make sound like it was a stronger storm.
    (Caused by Man’s CO2 of course and not more people building more expensive stuff in harms way.)

  18. Chris Facts says:

    This is a poor example of critical thinking. You use a small sanple of all hurricanes (those that hit the US and caused damage) and use that to extrapolate that hurricanes have not increased in intensity. You would get laughed out of a Stats 101 class. The sample size should be all hurricanes and typhoons worldwide and you would see that across the world the intensity of those storms ARE increasing. Selecting only the ones that hit that US unnecessarily limits your sample size. Of course that is probably why you did it… to be able to give your poor argument that global warming isn’t happening.

  19. richard hedges says:

    the earth has been gradually cooling since it was formed. after an ice age, what happens? the temperature gradually rises.

  20. Andrea Leong says:

    You can’t have it both ways, my dude. *Either* we worry about the human and economic cost of hurricanes because that’s what matters to us, *or* we count the severity of hurricanes as significant regardless of whether they made landfall or not.

  21. White or yellow. May use a variety of blowing agents. Resistant to water wicking and water vapor.
    https://www.foamprosdenver.com

  22. Raymond says:

    Thanks for the good link party. I am sure it is here but I cannot find the code for your link party button. Could you direct me please? https://flirtymania.com/de.html

  23. Kate12873 says:

    A very beautiful building. And an interesting story. I get inspired by these things, thank you. My friend from chat rolett showed me several buildings in her city, we communicate via video link. My dream is to come there live and see these beautiful objects with my own eyes. Traveling is one of the most beautiful emotions in my life.

Leave a Reply