Even before our December numbers are in, we can now say that 2018 will be the 6th warmest year in the UAH satellite measurements of global-average lower atmospheric temperatures, at +0.23 deg. C (+0.41 deg. F) above the thirty-year (1981-2010) average.
(Jan. 2, 2019 update confirms this.)
The following plot ranks all of the years from warmest to coolest, with the ten warmest and ten coolest years indicated:
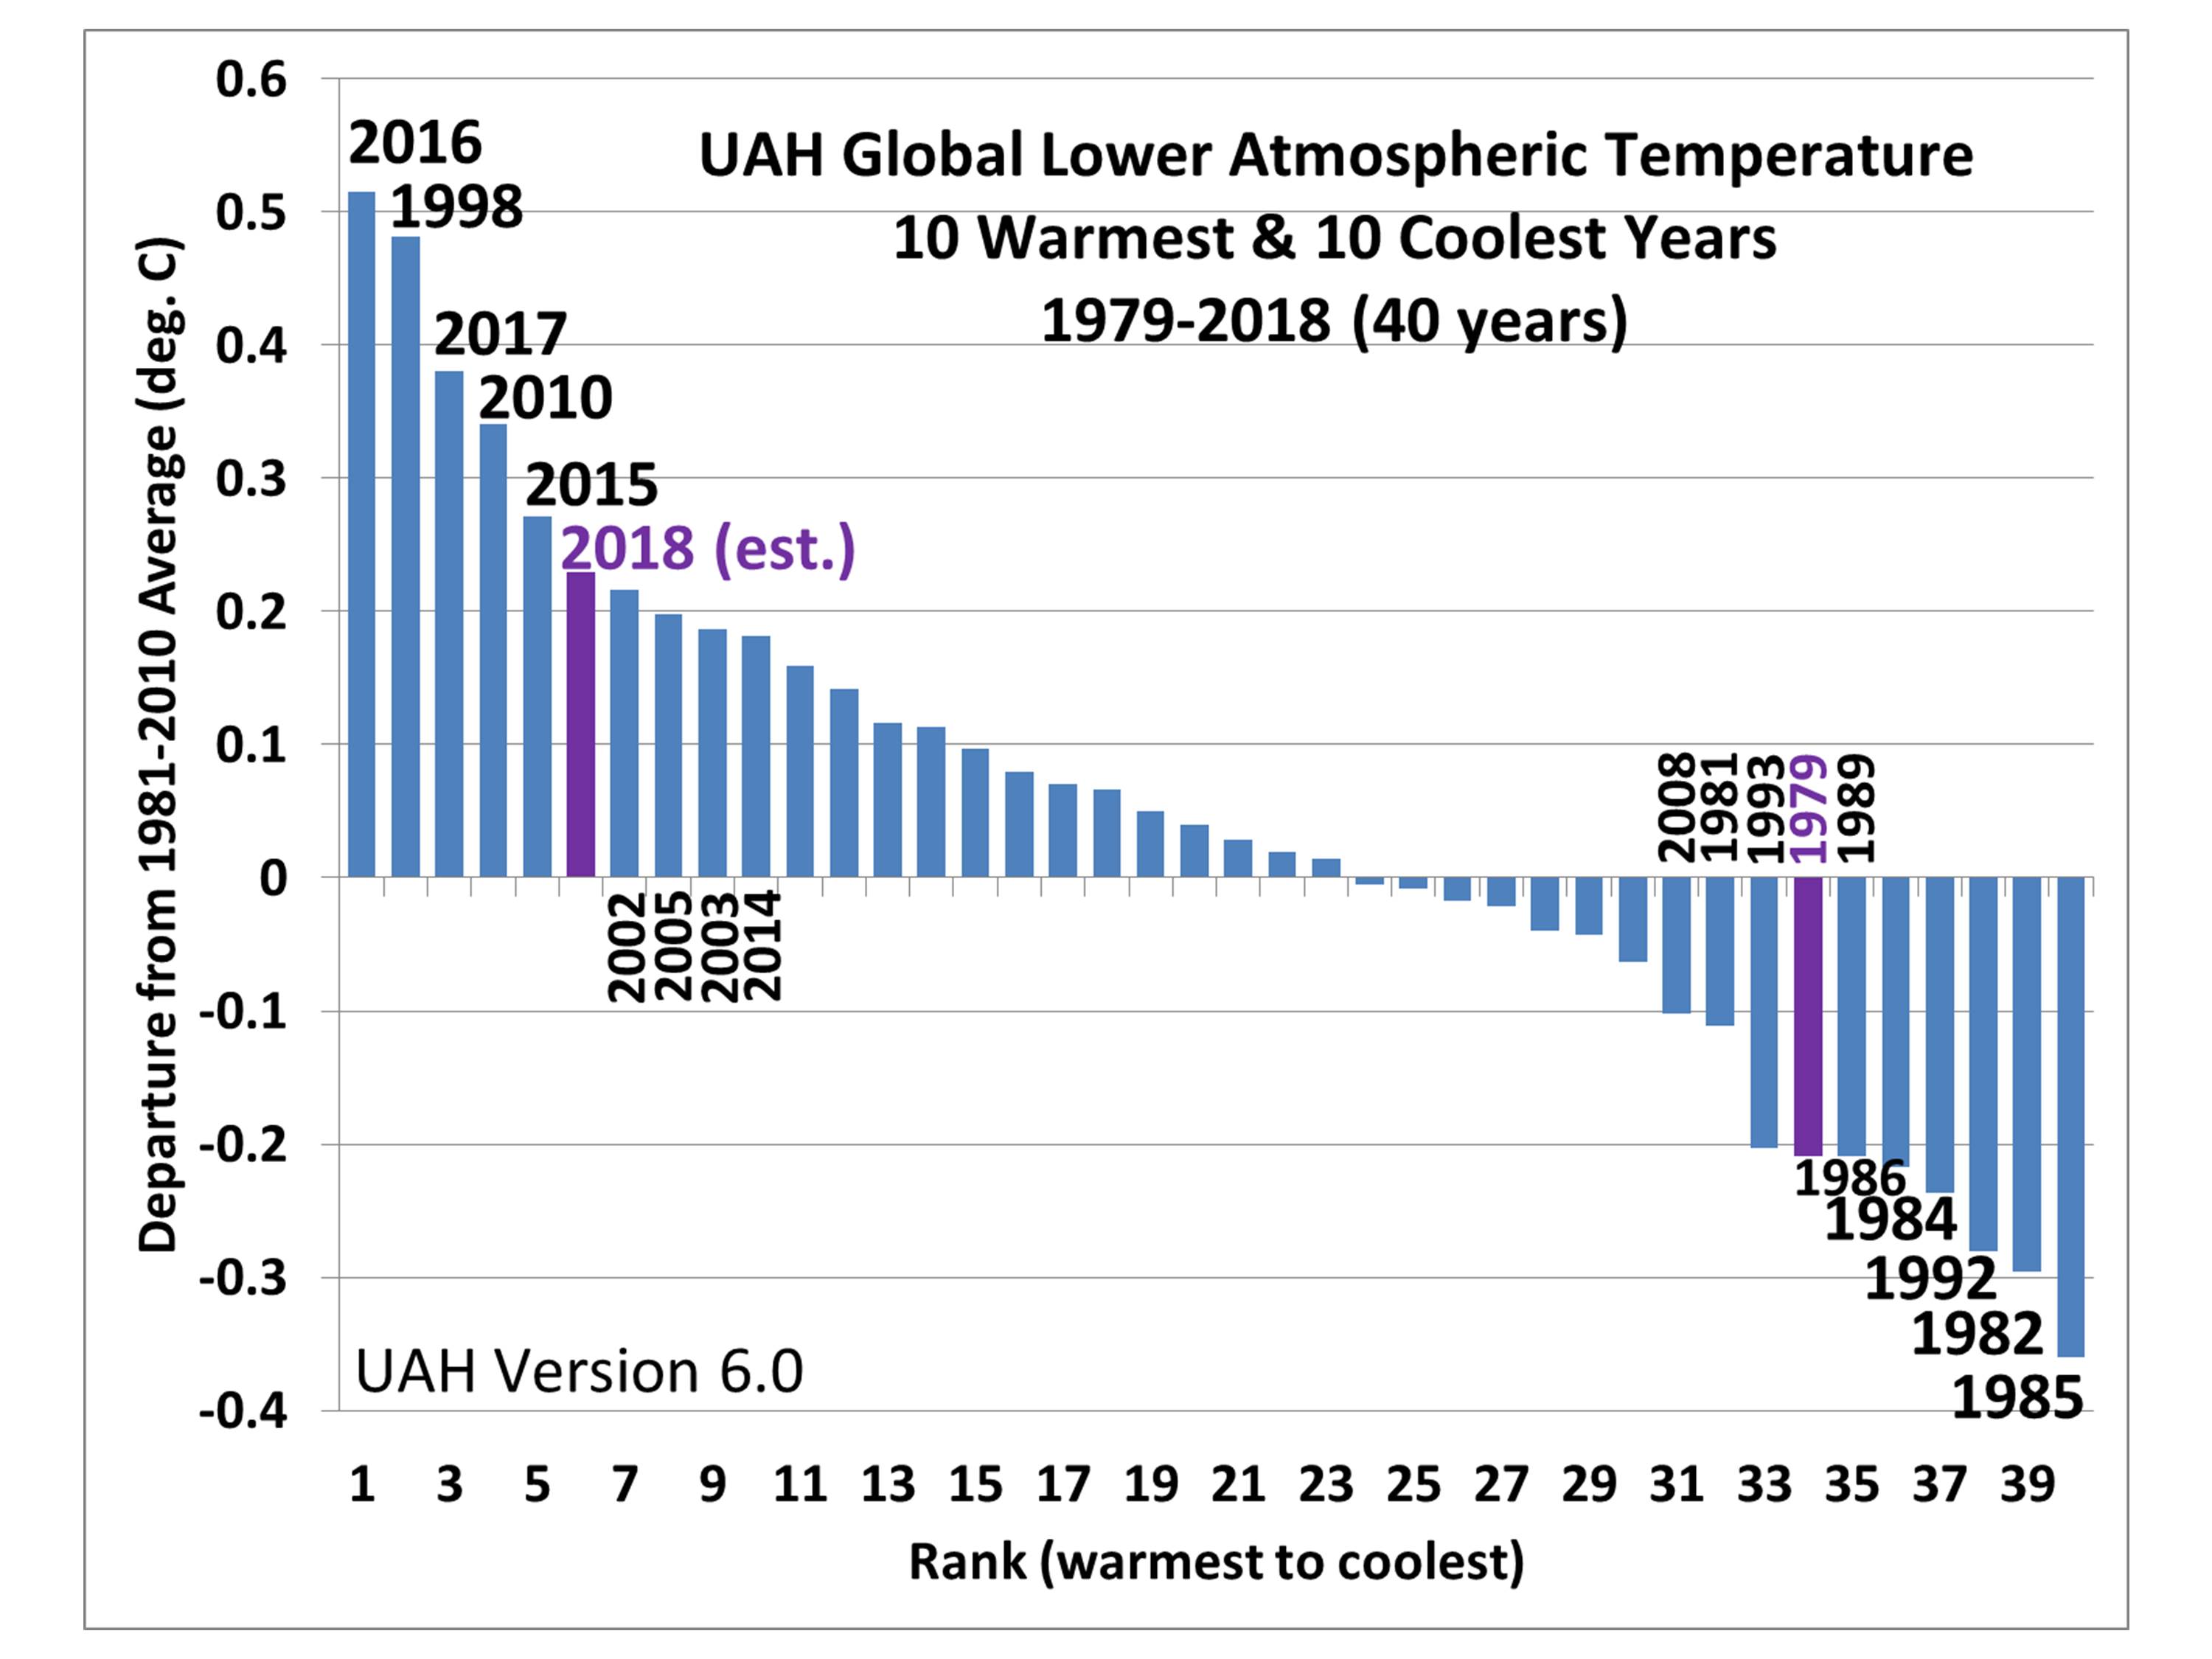
The first (1979) and last (2018) years in the record are indicated in purple.
2018 is also the 40th year of satellite data for monitoring global atmospheric temperatures.
We are currently working on Version 6.1 of the dataset, which will have new diurnal drift corrections. Preliminary results suggest that the resulting linear warming trend over the 40 years (+0.13 C/decade) will not change substantially, and thus will remain considerably cooler than the average rate of warming across the IPCC climate models used for energy policy, CO2 emissions reductions, and the Paris Agreement.
I loved this: “and thus will remain considerably cooler than the average rate of warming across the IPCC climate models used for energy policy, CO2 emissions reductions, and the Paris Agreement.”
RSS’s LT warming is about 50% higher.
OTOH, when obvious temperature noise (ENSO, volcanoes and AMO) are removed from the data the trend falls to .06 C / decade. This is right in the ballpark that Akasofu found to be the recovery from the Little Ice Age.
The fact is there exists sound science that tells us that AGW may be a very minor effect. A little warming at night and in winter appears to be about the extent of it.
I understand that UAH figures are well supported by radiosonde readings (weather temperature balloons) whereas RSS are not.
Also, some of the RSS changes made to support their latest version appear to be questionable. Could you give us the reasons why the latest RSS adjustments (which show much higher warming than previous RSS versions) should be considered more accurate than UAH. I would be most interested to know.
Thank you.
How do the balloon correlations fare? Happy Birthday!
We will have to see if the cooling trend now in place since 2016 continues meaning the next few years should be telling.
You will cause David to melt even with that cooling statement.
Not so much. By now it’s clear Salvatore has nothing scientific to say — he’s just hoping.
Not sure!
A few weeks ago Salvatore wrote the same, but with ‘months’ instead of ‘years’.
David and Bindidon, please stop trolling.
What’s your prediction Salvatore? Will 2019 be the 3rd straight year you label “THE transition year”?
Merry Christmas to all.
Here’s the BBC’s Q&A of Dr Phil Jones in 2010 after the Climategate scandal. This is question A below and his answer.
He lists 4 warming trends and if we test those SAME trends today we find that the two earlier trends have been adjusted DOWN and the two later trends have been adjusted UP, although the 1975 to 1998 trend not so much.
But the longer 1975 to 2009 trend has today been adjusted up from 0.161c/dec ( 2010 interview) to now 0.193c/dec. Here’s the BBC link.
So no statistically significant difference just 8 years ago, (between the 4 warming trends) but since changed through their adjustments.
http://news.bbc.co.uk/2/hi/science/nature/8511670.stm
Q&A: Professor Phil Jones
“Phil Jones is director of the Climatic Research Unit (CRU) at the University of East Anglia (UEA), which has been at the centre of the row over hacked e-mails.
The BBC’s environment analyst Roger Harrabin put questions to Professor Jones, including several gathered from climate sceptics. The questions were put to Professor Jones with the co-operation of UEA’s press office.
A – Do you agree that according to the global temperature record used by the IPCC, the rates of global warming from 1860-1880, 1910-1940 and 1975-1998 were identical?
An initial point to make is that in the responses to these questions I’ve assumed that when you talk about the global temperature record, you mean the record that combines the estimates from land regions with those from the marine regions of the world. CRU produces the land component, with the Met Office Hadley Centre producing the marine component.
Temperature data for the period 1860-1880 are more uncertain, because of sparser coverage, than for later periods in the 20th Century. The 1860-1880 period is also only 21 years in length. As for the two periods 1910-40 and 1975-1998 the warming rates are not statistically significantly different (see numbers below).
I have also included the trend over the period 1975 to 2009, which has a very similar trend to the period 1975-1998.
So, in answer to the question, the warming rates for all 4 periods are similar and not statistically significantly different from each other”.
“Here are the trends and significances for each period:
Period Length Trend
(Degrees C per decade) Significance
1860-1880 21 0.163 Yes
1910-1940 31 0.15 Yes
1975-1998 24 0.166 Yes
1975-2009 35 0.161 Yes”
See York Uni tool ( Cowton etc) link here for HAD Crut 4 global. Had Crut 4 global is the longest and preferred data-set of the IPCC.
http://www.ysbl.york.ac.uk/~cowtan/applets/trend/trend.html
2010 was 1.5 climate-science-lifetimes ago.
Is your middle name “Denial”?
Interesting. Thank you for taking the time to do all this work, Roy.
The last of the sensible people leaves the administration.
https://tinyurl.com/y78hdu5h
How come Mattis is the last of the so called sensible people?
USA co2 emission trend is much lower, while China, India and non OECD emissions are booming and they have every intention of using more coal and building 100s of new coal fired power stns.
USA now generates just 17.1% of TOTAL energy from coal while China generates 66.7%.
In fact USA co2 emissions are about the same as 1990 levels, so what’s your problem? When will people wake up and check the data/evidence for themselves?
I meant the presidents nominees only.
I agree China is biggest problem.
The US has been great at lowering emissions ever since 2005.
Neville, the US has already emitted over twice as much CO2 as has China, and about 10 times more than India. All that CO2 counts just as much (and arguably more, since CO2’s RF is logarithmic) as any CO2 emitted today.
Moreover, the US emits about twice the CO2 per capita than does China, and about 9 times more than India.
We’re the sloppy energy hogs, not them.
DA, CO2 is plant food.
You need to throw away all your pseudoscience. Learn some real science.
And lose some weight, so no one can accuse you of being a sloppy hog.
If CO2 is plant food, where are there no plants on Venus or Mars, where atmospheric CO2’s concentration is 90+%?
DA, there are no plants on Venus because there are no plants on Venus.
Blind fish can live in darkness, but do blind fish live in your head?
(Your stupid questions don’t help you not look stupid.)
David,
You’ve outdone yourself.
Please, take your meds, call us tomorrow.
“If CO2 is plant food, where are there no plants on Venus or Mars, where atmospheric CO2s concentration is 90+%?”
Wow. Your credibility just went to zero with me.
China and India will reach the same level of development, they just have to decouple growth from CO2, just like the US has since 2005.
Tariffs on their goods and services will be infinitely more expensive for both them and their trading partners. Feel free to put a tariff on their CO2 content though, if they don’t prefer to tax it themselves.
If we accept that China and India has to reach the same level of development (read, CO2 output) as the West, then we are doomed. The fact that the IPCC doesn’t acknowledge that is a clear indication that their goal is more about a global redistribution of wealth than it is about saving the planet from an environmental catastrophe.
The best thing the OECD nations could do is to scrap the Paris agreement; place prohibitive tariffs on goods and services from China and India to slow the economic growth in those countries; and use the West’s wealth to invest in reliable, alternate fuel sources.
If warmists were concerned about third world countries, they would encourage their use of fossil fuels. Read “the moral case for fossil fuels” by Alex Epstein.
China and India will reach the same level of development, they just have to decouple growth from CO2, just like the US has since 2005.
Tariffs on their goods and services will be infinitely more expensive for both them and their trading partners. Feel free to put a tariff on their CO2 content though, if they don’t prefer to tax it themselves.
Only 6th place, Roy? What will the alarmists do, find a new metric to cry crocodile tears about?
Happy Holiday to you and yours, Roy! Please pass that along to John Christy, too.
Regards,
Bob
6th place, not bad for a mostly La Nina year.
Indees. Where does 2019 rate amongst La Nina years?
‘indeed’ …. and …. ‘2018’
Bob, the sensible thing to do would be to look at long-term trends from all available climatic data sets.
Apologies Bob, and I know I’m completely off subject,
I just happen to think the whole ” Happy Holidays” trend instead of the traditional Merry Christmas is right up there with the whole hand wringing, media driven, PC brigade – which seems to be what all the climate alarmists embrace..
apologies if you hold that conviction to be dear,
Just wanted to get that off my chest..
I feel better now 🙂
Kind regards
Brad
You can call Trumps special thank you number and thank him for bringing back Merry Christmas.
But, if we say Merry Christmas to everyone, regardless of whether they are Christian, arent we admitting that Christmas has become a non-religious holiday?
I’m not 100% certain that Happy Holidays is not all that bad – after all – even snowflakes that are unsure of the ‘data’ are included in festivities this time of year are they not? Happy Holidays includes a ‘Merry Christmas’ but overtly. When folks throw me a Happy Holiday – I respond ‘to you too and a Merry Christmas’…and we can all leave it at that –
This seems much like the vaunted Climate Change – while we all agree that climate does change…it seems that we can each get hung up on just how/why it changes…and everyone loves to play the game of where it is going and why – even when they have zero proof of it.
One hitch: Holiday = Holy Day.
So, if the 4th of July is a Holiday….it is also a Holy Day….
Well, I’ll buy into the Holiday/Holy Day .. Merry Christmas.
Neville, thanks for your comment and the links to the Phil Jones Q&A.
Regards, and Happy Holidays,
Bob
I use the UAH (and other global temp records) as a sort of a calendar for my life. I think back to my views on climate at different years. Around 2000 through my education I was on board with the GHG risk and even devoted my time to a PhD studying paleoclimate, by 2010 I was a skeptic because I measured solar cycles in 5 million year old tree rings and lake sediments that included climate sensitivity to the Hale magnetic cycle (which was not included in IPCC climate models), and approaching 2020 I am less certain what drives climate (Im starting to look into the Eccentricity 400k cycle). So the older I get and the more I know (simply as a function of time), the more uncertainty I have about the Earth’s climate system.
I appreciate this blog because it informs many people to balance the forces and keeps the conversations going. I learn much from Roy and John and all the contributions and links to papers from people commenting (like Dave A). So thank you to the entire community and have a Merry Christmas and/or Happy Holidays.
So why are the climate alarmists saying that “climate change” is accelerating?
Ben
Because over 90% of the trapped heat goes into the ocean, where heat content and sea level rise are accelerating.
“Using a 25-y time series of precision satellite altimeter data from TOPEX/Poseidon, Jason-1, Jason-2, and Jason-3, we estimate the climate-changedriven acceleration of global mean sea level over the last 25 y to be 0.084 0.025 mm/y2.”
R.S. Nerem et al, Climate-changedriven accelerated sea-level rise detected in the altimeter era, PNAS, February 12, 2018.
https://doi.org/10.1073/pnas.1717312115
DA entertains: “Because over 90% of the trapped heat goes into the ocean…”
DA, that is funny, but nonsensical.
Learn some physics.
Prove it wrong. You can’t.
DA, no one knows what fanatisies inhabit your head. But, all such falsehoods are easily disproven.
All you have to do is clearly identify which ones you want debunked, with your supporting “facts”, of course.
Not a problem.
Exactly. It is unfalsifiable.
We live in a warming world but it needs to get much warmer.
How much more sea level rise do you need?
DA starts his stupid question routine.
Not able to understand physics, all he can do is ask stupid questions.
Nothing new.
Are we at that daily point where, with nothing useful to say, you need to get some attention anyway?
DA starts his stupid question routine.
Nothing new.
3mm per ur for the last 800 yrs.you will never notice it in your lifetime. Just like no one noticed it until they were told. There is a rock where I learned to sea fish in 1959.it is on the North Sea coast at a place called the black middens. The rock is still there and kids still go to learn to fish from it at low tide. Just like our climate not much has changed
Bingo. Nothing really has changed on our coastline. The alarm seems to all be fabricated.
I’m not of the camp that believes that the alarm has been fabricated – rather (my opinion) that the alarm has been bent,abused and used for an agenda.
I very much agree our average sea-level rise is nothing noticeable over the course of a few life-times…. however given that we have seen sea-levels rise since coming out of our last ‘cold-spell’ some 20K years back we have about 400ft of sea rise…it would be rather silly to cry and whine about AGW causing it….unless of course one does not grasp the bigger picture outside of a myopic agenda.
Sea level scale on the right here, stable for thousands of years.
https://tinyurl.com/yb8sloql
Two degrees will wipe out the Greenland ice sheet, that’s about 20 feet.
I think sea level has been rising for centuries actually…albeit slowly and steadily…and in some places the land has risen due to earthquake or massive ice weight loss.
“The ice sheets at the last peak in
glaciation contained about 55×106 km3 more ice than
today and sea level on average was raised by about
130 m during the deglaciation phase” http://people.rses.anu.edu.au/lambeck_k/pdf/239.pdf
Yeah, I heard a few other doom and gloom posts about Greenland (by itself) contributing 21ft to sea levels… but that would be so very gradual that we as humans would easily adjust to the slowly rising see over time. However, I think all would agree, if a 2 degree temp rise would eventually melt off Greenland…it would be melting off a great deal more than just that and adding a great deal more than 20ft.
DA, how much can humans control sea level rise? How much decrease per decade can humans? How is that done? Whats the plan? Can we validate the efficacy of that plan?
I need about however many feet it would rise if Greenland et al would melt.
Just over 20 feet. It will take a few thousand years though.
Has anyone noted on Roy’s graph the significant negative trend from 2016 – 2018?
Also, note that 2014, the year claimed recently by NOAA to be the hottest year ever, is in 10th place with no fudged confidence level.
We need to remember as well that 1998 – 2015 was a flat trend on the UAH data sets. The 1979 – 1987 trend was positive only because it was a recovery from cooling.
Same as all global warming since 1850, a recovery from the cooling of the Little Ice Age.
CO2 is a lame gas in our atmosphere that could not warm a flea’s bum.
“CO2 is a lame gas in our atmosphere that could not warm a flea’s bum.”
One aspect about CO2 is that it was thought that global CO2 levels would rise faster than they did.
Or you could say China is only country which emitted as much as was expected- and perhaps even exceeded expectation.
And then a more important aspect is the amount of increase total countries emission remaining a fraction of the global of the increase in global CO2.
We living in a time where is was thought oil production would have essentially cease to occur.
Instead US is world leader in oil production AND the US is exporting natural gas. Or not predicted by anyone.
Many knew future would be unpredictable, but one might have thought that, say more off shore oil production would have occurred instead [and still possible btw].
Of course part of the reason the US world’s highest oil producer, is the lack of rest world in terms of it increasing it’s oil production. And US is mostly using it’s Natural gas rather burning it off- as would occur if oil production was being done in more remote region that is not near infrastructure that allows it to used.
Anyhow, it could have been thought, that we could have added 100 ppm more than we have currently. Plus facing future with even more dramatic global increase in CO2. Or facing in near term something like 8 ppm increase per year and reaching more than 10 ppm per year before 2050 AD.
Or say, that everyone doing was a China, rather than China being rather unique in terms it’s massive increase in the use of Coal.
So if we had already reached a global CO2 level of 500 ppm, it seems possible to me, that we might have had a measurable a warming effect due to CO2.
gbaikie says:
One aspect about CO2 is that it was thought that global CO2 levels would rise faster than they did.
Says what?
I’ve read it’s just the opposite.
Who did you read that said global CO2 levels would less than 410 ppm by 2019?
This guy looked at the temperature record over the past century and found that the greatest two year cooling trend in global temperatures just occurred. A decline of 0.56C.
https://www.realclearmarkets.com/articles/2018/04/24/did_you_know_the_greatest_two-year_global_cooling_event_just_took_place_103243.html
Obama bragged about how his election would stop the oceans from rising, yet during Trump’s first two years the Earth’s temperature cooled the most in any two year period in the past century. How ironic.
scott…”This guy looked at the temperature record over the past century and found that the greatest two year cooling trend in global temperatures just occurred. A decline of 0.56C”.
I think what’s strange about the decline is not the degree but that it took two years. There was a strong El Nino in 2016 and the warming was not related to CO2 warming. However, following an equally strong EN in 1998, the global average dropped back below the baseline within a year.
Also, following the 1998 EN, the global average returned to below the baseline then suddenly jumped about 0.2C in 2002. Then the average leveled off for the next 13 years around that 0.2C level.
It’s pretty obvious there is some kind of natural, turbulent action at play which no one can explain.
Gordon, how have back-to-back La Ninas in the 2016-17 and 2017-18 seasons affected global temperature?
David, please stop trolling.
Gordon Robertson says:
Has anyone noted on Roys graph the significant negative trend from 2016 2018?
A) it’s not statistically significant.
B) It’s due to ENSOs — “weather” in the ocean — which still dominates the warming signal over a few years, and still can for a decade or two.
Notice how ENSO years of all three flavors keep getting warmer when compared to past years of the same flavor:
https://davidappell.blogspot.com/2018/07/increasing-temperatures-of-enso-seasons.html
https://davidappell.blogspot.com/2018/07/we-just-had-2nd-warmest-la-nina-season.html
Has anyone noted the significant downward trend in the Dow Jones in the last three months? I guess that must mean that the story of Trump improving the US economy must be a lie.
No, the Feds raising interest rates.
Hey Roy,
Any chance you could send me the preliminary 6.1 dataset?… and NO, it’s not because I want to find something wrong with it!
Why would Roy do that????
No reason… but it doesn’t hurt to ask.
Because, unlike you, he’s a nice guy.
And along your line, why do you make such a comment? I should ask a leading question here.
“We will have to see if the cooling trend now in place since 2016 continues meaning the next few years should be telling.”
Salvatore del Prete
“Has anyone noted on Roys graph the significant negative trend from 2016 2018?”
Gordon Robertson
How can one have confidence in your predictions of long term cooling? You cannot tell the difference between a long term trend and the normal recovery from an El Nino.
I have plotted the 1998, 2010 and 2016 El Ninos. (ht Bindidorn)
http://www.woodfortrees.org/plot/uah6/from:1997/to:2001/every/plot/uah6/from:2015/to:2019/every/plot/uah6/from:2009/to:2013/every
Note the common pattern. You get a rapid temperature rise to a peak a few tenths above normal, then a drop back to normal over a couple of years.
entropic…”How can one have confidence in your predictions of long term cooling? You cannot tell the difference between a long term trend and the normal recovery from an El Nino”.
I said nothing about a long-term cooling, I have no idea what lies ahead. For all I know, the global average could rise again due to another El Nino.
I do think the global average should even out in the long term but I am not ‘expecting’ a long term cooling. I’d like to see a moderate long term cooling to shut up the politically-correct alarmists who are imposing carbon taxes and the likes.
However, I certainly don’t want to see another Little Ice Age, or worse.
Gordon Robertson says:
I do think the global average should even out in the long term….
So why hasn’t it?
DA…”Gordon Robertson says:
I do think the global average should even out in the long term.
So why hasnt it?”
No one has that answer. Unlike climate alarmists like you, we skeptics are not afraid to claim we don’t know. All we do know is that anthropogenic warming is pseudo-science.
Gordon Robertson says:
“So why hasnt it?”
No one has that answer.
Gordon, do you think CO2 doesn’t absorb infrared radiation, or do you think the Earth doesn’t emit it?
DA, how many times have you asked that same stupid question?
Do you believe doing the same stupid thing over and over, hoping for different results, is a good defintion of insanity?
Until Gordon et al have cojones to answer it.
Maybe insanity is better than your life now, DA.
Your choice.
I guess one really can make a life out of trolling.
As you are proving, DA.
The past trend has nothing to do with future trends.
“…here is my prediction for climate going forward, this decade will be the decade of cooling.”
– Salvatore del Prete, 11/23/2010
http://ourchangingclimate.wordpress.com/2010/10/20/andrew-dessler-debating-richard-lindzen/#comment-8875
David, please stop trolling.
The sun drives the ocean temperatures which means in time the ocean temperatures will be going down which means say good-bye to global warming.
What is different this time then in past cool downs is solar activity was not sufficiently weak enough in degree of magnitude change and duration of time to have any kind of significant climatic impact. Now it appears that this has changed and it would be the first time since the Dalton Solar Minimum ended.
“Global cooling has started, and it will be here for sometime to come. All the factors that control the climate are now in, or going toward a colder phase.”
– Salvatore del Prete, December 31, 2010
http://www.drroyspencer.com/2010/12/dessler-and-spencer-debate-cloud-feedback/#comment-8257
(Emphasis mine.)
Salvatore,
I suspect the buffering effect of the oceans is not well enough understood yet.
„The current magnitude/flavor of El Niño event and expected high-latitude blocking associated with the solar minimum (and backed up by the November blocking) add up to heavily skewed odds toward a colder, stormier late-winter period,” said Dr. Todd Crawford, chief meteorologist with The Weather Company.
http://ds.data.jma.go.jp/tcc/tcc/products/clisys/STRAT/gif/pole30_nh.gif
Very low pressure in Darwin.
https://www.longpaddock.qld.gov.au/soi/
That’s because he’s dead.
When the 30-day SOI index exceeds 10, we have La Nina conditions?
Thanks Roy,
Merry Christmas — from Washington State,
for us and most of the State, it will be white!
And a Happy new Year, from a reliably blue California.
John…”Merry Christmas from Washington State,
for us and most of the State, it will be white!”
I would not be focused on a white Christmas, I’d be hoping Washington does not get another tornado in December as you had recently.
That’s crazy, a tornado in winter in the Pacific NW.
From Tallbloke’s site comes this prediction of future cycle strength.
https://i.imgur.com/zt9Uc2P.png
https://tallbloke.wordpress.com/2018/06/09/leif-svalgaard-reveals-his-solar-cycle-25-prediction-at-last/
They expect cycle 25 to be stronger than cycle 24.
Professor Valentina Zharkova: The Solar Magnet Field and the Terrestrial Climate
https://youtu.be/M_yqIj38UmY
Solar Dipole and Multipole Components
http://wso.stanford.edu/gifs/DipallR.gif
No many people like Valentna Zharkova are expecting very low solar activity as we move forward.
The Wilcox Solar Observatory
http://www.vukcevic.co.uk/PF.gif
That doesn’t predict anything — it’s just the observed data.
Indeed, these are the hard data.
http://cosmicrays.oulu.fi/webform/onlinequery.cgi?station=OULU&startday=22&startmonth=11&startyear=1987&starttime=00%3A00&endday=22&endmonth=12&endyear=2018&endtime=23%3A30&resolution=Automatic+choice&outputmode=default&picture=on
The maximum (or double maximum for the waves with a larger phase shift of solar activity for a given cycle) coincides with the time when each of the waves approaches a maximum amplitude and the hemisphere where it happens becomes the most active one. This can account naturally for the north-south asymmetry of solar activity often reported in many cycles. Also the existence of two waves in the poloidal magnetic field instead of a single one, used in most prediction models, and the presence of a variable phase difference between the waves can naturally explain the difficulties in predicting sunspot activity on a scale longer than one solar cycle with a single dynamo wave since the sunspot activity is associated with the modulus summary curve of the two dynamo waves that is a derivative from these two waves.
https://www.ncbi.nlm.nih.gov/pmc/articles/PMC4625153/
This is true. It is something I noticed several years ago when I first started playing around with the SSN data. I will have to look through the article. Thanks.
Salvatore Del Prete says:
No many people like Valentna Zharkova are expecting very low solar activity as we move forward.
Based on what? How much attention they get in tawdry British newspapers?
Entropic man says:
From Tallblokes site comes this prediction of future cycle strength.
You’ve got to be kidding. Right?
Right??
😉
David, please stop trolling.
The driver of climate change is tide-induced geomag shifts in the vast ocean of the liquid metal upper core. So we can now predict El Ninos, La Ninas and Indian SW monsoon failures. Back record on the first 2 is perfect, prediction ahead should be. Eclipses are shadows, but mark the barycentre moving top to bottom of mantle, hence the mantl;e, core and crust. Solar eclipse crosses Pacific Equatonear year end, get El Nino. Solar elipse crosses India or near in June, SW monsoon fails. It also looks as though all massive famines correlate with solar eclipses. What got the early observers was, eclipse presaging can be at the antipodes, as tides bring highs opposite, but those in the far south not known till recently.
Try tell NASA? I did. The polite letter back said they only take notice of peer-reviewed literature. Disd not want the 2,000 page free report. That brought a smile. No new science is possible, is th mantra. If qwe dont knowofit, it dos not exist.
Peter, geo for 45 years, [email protected] Phone 617 3289 4470
Link, please.
Peter…”The driver of climate change is tide-induced geomag shifts in the vast ocean of the liquid metal upper core. So we can now predict El Ninos, La Ninas and Indian SW monsoon failures”.
It’s an interesting theory but the first question uppermost in my mind is why ENSO is isolated to a strip of ocean between Australia and the west coast of South America. And why does it change directions regularly?
Would geothermal events change like that so as to affect ENSO?
ENSOs are centered on the equator, Gordon.
So predict the next La Nina.
What is the Southern Oscillation Index (SOI)?
The Southern Oscillation Index or SOI is a standardised index of the barometric pressures over Darwin, Australia and Tahiti. Climate scientists use the SOI to assess the strength of the El Nino Southern Oscillation phenomenon (or ENSO), which in Queensland accounts for nearly 25 per cent of our year-to-year rainfall variability. For example, it is often wetter during a La Nina classified year (when the sustained SOI is very positive (higher than +7)) and drier during an El Nino classified year (when the sustained SOI is very negative (lower than -7)). The index scale ranges from about +35 to -35 using the Troup method of calculation used on Long Paddock.
https://www.longpaddock.qld.gov.au/soi/
ren, the SOI is a *proxy*. And not a very good one right now — the 30 day average SOI is > 0 (La Nina), while the Nino34 Index is about 0.5 C — on the edge of El Nino conditions.
David, please stop trolling.
I noted some time ago that the ~11 year solar period mixing with the ~9.3 year axial precession appears to match the ~5 year and ~60 year periodicities that can be observed in the temperature data. So, your hypothesis seems interesting.
Along the lines of what we usually discuss here, and on topic as far as the message associated with Roy’s current article, I want to report on a fairly severe wind storm in the Vancouver, Canada area yesterday December 21, 2018.
A couple of hundred miles below us near Seattle, they had a tornado. A real, live tornado that ripped the roofs off a couple of places. A tornado in December with no appreciable temperature differential? There are other forces at work besides global warming.
The result of the storm in Vancouver has become typical, we lose power through most of the Vancouver area as trees fall across power lines.
Why is this allowed to happen? Because, the same eco-alarmists who are pushing the propaganda about global warming/climate change have put so much pressure on local governments that it is virtually impossible to cut down a tree, even if it’s leaning over your roof and primed to collapse on it.
These alarmists care more about trees than they do about people. Here in British Columbia, the province in which Vancouver is located, we have the highest rate of child poverty in Canada. The government will protect trees at all costs but don’t give a hoot about a child in poverty. The previous government, an uber-right wing government, who allowed this state of poverty to exist for children, imposed a carbon tax on us.
It is vital that we remove all trees that threaten power lines yet the legislation is so strong that people don’t dare take that initiative into their own hands. In some cases, power lines run straight through the branches of trees.
Year after year, recently, we are shut down in many parts of the region for anywhere from a few hours to days, till Hydro crews can get the power grid re-established. There were over 500,000 people affected by power outages just because lame-brained eco-alarmists have a thing about cutting down trees.
Now Gordon is afraid to cut down a tree. And it’s all the fault of the libtards, don’t you know. They lead him around by the nose.
Protecting trees next to power lines, how likely is that?
It’s just bad maintenance Gordon, happens everywhere.
Of course it’s not economical to bring the risk down to zero, perhaps they had it just right. How often do you get a storm like that?
You sure? How much damage did the Camp Fire do in California, likely because of power lines.
Looks like you are right there, the utility company is being sued for negligence.
In Charlotte, NC, USA, the locals try to stop Duke Energy from removing limbs and trees from the power line right of way. It causes many problems during wind and ice storms, which the locals (mostly leftists) then blame on Duke Energy.
Just to the west of there – our local Coop, Rutherford electric tries to take 20 feet on each side of the lines. When they got to me, I told them take 30. Why, because I like electric power and there are plenty of trees, 13million acres in NC, a state of 26 million acres.
Gordon Robertson
This is because the low-pressure systems over the Pacific direct to the northeast and warm fronts to reach Vancouver.
https://pics.tinypic.pl/i/00976/ulavynzhqzte.png
DA is back with his usual silly nonsense. So DA please tell us how to fix/mitigate your so called CAGW? Using real data and evidence.
Fair dinkum, China, India and the non OECD must be laughing all the way to their banks.
Their emissions are soaring and the OECD countries emissions have been flat-lining for decades. But silly DA can’t add up simple sums and thinks we can change the climate,or stop natural SLR, or try and slim down the booming polar bear populations, or stop tornadoes and cyclones when nothing seems to be much of a problem at all.
OH and deaths from extreme weather events have fallen by 97% since the early 20th century and people have a much higher life expectancy today than 30, 50 , 100 and 200 years ago. This happened by magic apparently.
But again tell us how to fix your so called CAGW problem? Bet you can’t? BTW here’s Rosling’s BBC 200 countries video again and his TED video trying to help people to be less ignorant about the REAL planet earth. That’s opposed to some people’s fantasy planet.
Real DATA and EVIDENCE that challenges so much of the delusional nonsense that seems to infest the MSM.
https://www.youtube.com/watch?v=jbkSRLYSojo
Here’s his video trying to dispel our ignorance about the world. The first 5 minutes should help DA, but don’t count on it.
https://www.youtube.com/watch?v=Sm5xF-UYgdg
Where exactly do these videos disprove AGW? Give me the time stamps….
Better yet, quote from the videos where AGW is disproven. Also give the time stamps.
David, please stop trolling.
Perhaps Willis can help DA understand the problems of mitigation of his so called CAGW or perhaps NOT.
Willis provides the data according to BP but it is not quite the same as the IEA data used by Lomborg.
https://wattsupwiththat.com/2018/12/21/another-look-at-the-fuel-mix/
DA,
“Were the sloppy energy hogs, not them.”
Maurice would be proud…
Do you too, wish to deindustrialize the west?
No.
PS: Who is “Maurice?”
David, please stop trolling.
A different kind of forecast
https://goo.gl/VL21An
One of the comments:
“When this man made global warming scam is exposed, can we (tax payers) have our money back please.”
Eben can’t offer any real data.
David, please stop trolling.
I think there are somtething wrong about the thermometere temperature measurement and use og them in models and estimates.
Where I live in Norway the themperature in summer time has ben gradually colder since year 2001. Except 2018 that had been the warmest. The summers in 2010-2017 has been very cold.
The funny part is that the winter has been increasing stabile and colder. 86-99 was warm and windy teperature jumping up and down from -35c to 15c witch is pretty high for winter but not abnormal in history.
Temerature latest years dont wary a lot -25c to 5c
The winters has a increase in snow, early 90s had almoust no snow. Ski making companys went bankruptsy and we believed that skiing was for past generations. We were wrong. Increasing snow from late 90s. The top has been latest years. 2018 was a extreeme.
The winter has also been longer for a reason. Starting very early in october but ending a bit early, april. Vinter often turns back in may. Normal winter was a mild start in november/december and a sharp end in april/may. Making the months with winterlike temperatures 2-3 weeks longer now then 90s.
But when Im presented a model map of temperature form my part og the contry, it is always the opposite. Now glowing red hot. When I look at satellite datamap, it show a sligtly cooler trend. What I believe is exactly like my observations.
I am greatful for Roy Spencers work and that he follow his believes. And that the does it in a scientific way with accuracy!
Without it the AGW virus would had infected the whole world with lies.
Very interesting, Stein.
SRN…”I am greatful for Roy Spencers work and that he follow his believes. And that the does it in a scientific way with accuracy!”
**********
If you want to get right into how much the surface temperature record has been fudged, there are several reliable sources.
1)chiefio… https://chiefio.wordpress.com/gistemp/
just follow the links to get into the depths of it.
2)Kristian….who posts on here quite a bit has his own site:
https://okulaer.wordpress.com/category/climate-adjustments/
3)Bob Tisdale… https://bobtisdale.wordpress.com/
Stein: Your data?
David, please stop trolling.
Entropic man
Should you have some interest in Leif Svalgaard’s work, I recommend reading his most recent guest post at WUWT:
https://wattsupwiththat.com/2018/10/27/svalgaard-paper-reconstruction-of-9000-years-of-solar-activity/
Some comments, especially those made by henryp, are interesting as well.
As usual, the guest post has shown the differences in meaning between commenter Javier and Svalgaard. Nothing will be able to reconcile the two…
Time has passed Leif by what he says when it comes to solar/climate relationships is meaningless.
If you were able to express your critique against him at the scientific level he stays on, then I would understand and maybe even agree to you.
The scientific level one achieves does not equate to being correct.
I will put my solar/climate connection theory up against his any time.
from 2012:
“Temperatures in response to this will decline in the near future, in contrast to the steady state of temperature we presently have,or have been having for the past 15 years or so.”
– Salvatore Del Prete, 11/6/2012
http://www.drroyspencer.com/2012/11/uah-v5-5-global-temp-update-for-october-2012-0-33-deg-c/#comment-64939
David, please stop trolling.
Stein Roger Nybakke
I understand your claims, but… are you not confounding
– local with global?
– weather with climate?
I had a look at my GHCN daily station data, and generated time series out of all the 190 stations having been active in Norway between 1900 and 2018 (maximum was 129 in 2014).
You see here that subset of them having been active before 2000 and which are still active in 2018:
https://drive.google.com/file/d/1vMkMO7ywYqRZgMeIubDwZye0405h50ZJ/view
Here are two graphs, the one showing absolute values for 1900-2018, the other anomalies wrt mean of 1981-2010.
1. 1900-2018, absolute
https://drive.google.com/file/d/1xX7y5w52v4oS83CESOC8Yls5NXbHYGOl/view
2. 1900-2018, anomalies
https://drive.google.com/file/d/1dbu5MrQqDkhFg1LHzN6Qnrof2Nxdurbi/view
Now the same for the period 2000-2018.
3. 2000-2018, absolute
https://drive.google.com/file/d/1CzZ04HTzsc_IIYYvS8NjkyA3Qo1b1e5y/view
4. 2000-2018, anomalies
https://drive.google.com/file/d/1gTDHz5qkuIBn1bRs2PZKux82tasiQYfG/view
If you don’t find your weather/climate situation in these graphs, then please select those stations nearest to you in the NO station list, write a comment here containing them, and we do the same again…
P.S. I detected an inconsistency in the list: Vardø exists in two instances because it was registered twice (1951 and 1955), probably due to the ‘ø’.
binny….”I had a look at my GHCN daily station data, and generated time series out of all the 190 stations having been active in Norway between 1900 and 2018 (maximum was 129 in 2014)”.
One problem, binny, most of that GHCN data you are using is no longer used by anyone, including NOAA and GISS.
Robertson
Here too I answer like below.
You can repeat your discrediting, denigrating and lying blah blah as long as you want.
You wont change anything doing that, apart from getting applause from your few gullible followers.
You would never be able to generate any GHCN output, let alone to accurately compare it with NOAA or GISS data.
A simple-minded liar, that is all you are.
Bindidon, please stop trolling.
In March, ren noted that arctic temperatures were below “normal”:
https://tinyurl.com/y8ecoofw
Now we can compare integrals for the whole year:
https://tinyurl.com/yaqedxmu
Summer temperatures do not change much because of the phase change resistance:
https://tinyurl.com/y9e5lt5e
Yes, Svante
ren is the grand maître in looking at tiniest cooling points or moments with the electron microscope.
But those doing the inverse aren’t much better.
Yes, anecdotes instead of science.
binny…”ren is the grand maître in looking at tiniest cooling points or moments with the electron microscope”.
ren is not putting out fake graphs from an Excel spreadsheet. Nor is he using fudged NOAA/GISS pseudo-data.
People who live in glass houses should not throw stones.
When are you going to prove any data was “fudged.”
This is a major lie of your’s that you keep repeating evidence.
I’m sure you’ll avoid it again here.
David, please stop trolling.
Robertson
You can repeat your discrediting, denigrating and lying blah blah as long as you want.
You won’t change anything doing that, apart from getting applause from your few gullible followers.
You aren’t able to criticize anything on a scientific level. Even such a simple graph you don’t understand:
http://ocean.dmi.dk/arctic/plots/meanTarchive/meanT_2018.png
Look at your incredibly stupid reaction:
“What’s your point? The average is still well below 0C for the year and barely exceeds 0C at any time of the year.”
Your incompetence is simply terrifying.
binny…”Robertson
You can repeat your discrediting, denigrating and lying blah blah as long as you want.”
Oh, thanks, good to know.
Ever thought of talking some science between your tirades?
Gordon, do you honestly think your conclusions are based on science?
DA…”Gordon, do you honestly think your conclusions are based on science?”
Yep. Your problem is that your degree in Home Economics does not allow you to understand what I’m talking about.
Gordon, that’s just dumb.
You don’t even take yourself seriously.
David, please stop trolling.
svante…”Summer temperatures do not change much because of the phase change resistance:”
That’s a testament to how much ice there is in the Arctic Ocean year round. It takes a good deal of solar energy to change the phase of water from solid to liquid and obviously there is so much ice it has slowed the process.
It’s obvious that increasing CO2 has no effect on the warming of the Arctic Ocean.
Correct, except for the word ‘no’ in the last sentence.
svante…”Correct, except for the word no in the last sentence”.
I am still waiting for scientific proof that CO2 has any warming effect in the atmosphere. Thus far all I have received is the consensus opinion based on, ‘what else could it be’?
With regard to the Arctic, as long as the Sun disappears completely for a couple of months each winter, NOTHING will warm the Arctic. You could have 100% CO2 and it would not warm the Arctic.
“I am still waiting for scientific proof that CO2 has any warming effect in the atmosphere”
You will go on waiting. Science does not do proof, it does evidence and likelihood.
The physics indicates that as infrared moves from the surface to space, there should be some temporary warming of the atmosphere. It’s just that the atmosphere can NOT then warm the surface. The heat transfer is one-way, surface to space.
Sorry Svante and E-man for inserting some actual science into your comments.
Gordon Robertson
CO2 would not have a warming effect on the atmosphere because the CO2 molecules are absorbing and emitting IR continuously and in the Stratosphere they become a primary cooler of the atmosphere since space is not returning any significant energy that the CO2 emits away.
https://www.mathstat.dal.ca/~folkins/spectral-cooling.jpg
CO2 warming effect is on the surface. The downwelling IR. I have linked you many times to various measured values of DWIR from CO2.
Here is another.
https://scienceofdoom.files.wordpress.com/2010/07/dlr-spectrum-wisconsin-ellingson-1996.png
If you do the math with this graph you will find CO2 is returning about 40 w/m^2 back to the surface. This energy along with incoming solar energy will cause the surface to reach a higher temperature than it would without this DWIR.
To calculate from the graph multiply 0.125 W/m^2 by 100 (band of CO2 emission). You will get 12.5 W/m^2 but the units are in steradian so you will have to multiply this by pi to find the actual value of energy received by the surface from CO2.
Poor Norman continues with his confusion and dis-information.
1) The stratosphere contains insufficient amounts of CO2 to be a factor.
2) Downwelling IR is NOT proof the IR is absorbed.
3) Low energy IR radiative fluxes do NOT add to solar flux.
Nothing new.
JDHuffman
Okay so you believe I am confused. I disagree. Prove your points.
1) prove that CO2 in stratosphere is insignificant. Others disagree what makes you right and them wrong? What is your evidence?
2) What evidence do you have that the Earth’s surface will not abosrb nearly all the IR emitted by the atmosphere. Valid science (measured values) say it will. What evidence do you have to prove it will not?
3) And why would not the fluxes add? You say they don’t. All textbook physics say they do. What makes your declarations correct and textbook physics wrong. Provide supporting evidence for your bold declarations that go against all experimental supported physics.
Basically you make declarations but prove none. Now it is time for you to prove what you declare. Prove even one of your three points correct with supporting evidence.
1) Look up the concentration of CO2 in the stratosphere.
2) Try to warm a banana that is at room temperature using only the radiative flux from ice cubes.
3) Provide proof for your statement: “All textbook physics say they do.” That is pure nonsense. You try to change reality to fit your beliefs.
4) Also, your conversion from steradians is wrong.
You can’t learn until you can admit your mistakes.
JDHuffman
1) Telling me to look something up is not you supporting your claims. I hope you can see that.
2) That is a meaningless response that has no connection to point that a warm object can and does absorb IR from a cooler source.
It has been explained to you many times and you still do not understand the concept at all. The room temperature banana will absorb IR from the ice but it emits more. The banana is not being heated by an external source as the Earth’s surface is. It is a poor analogy that has no bearing on the point at all. Do better.
PROVE that IR emitted by a cold object will not be absorbed by a warmer one. You have NOT done so yet.
3) Obviously you have never done one problem dealing with radiant heat transfer with multiple objects. Each flux from each surface is calculated to determine the Net flow of energy away from a surface of choice. Try again. Read some textbooks. I have linked you to many, each has problem sets.
4) In this case I believe the steradian is to multiply by pi. When the term is applied it depends upon how they are using it. I could be variations of pi. In this case I think pi is the correct multiplier. If you have a different reason to think I am wrong then prove it with a valid supporting piece of evidence.
https://www.mathsisfun.com/geometry/steradian.html
If you were finding the energy of a sphere it would be a multiplier of 4 pi, a hemisphere is 2 pi I think they use it just as pi.
Norman, I realize you can pound on your keyboard all day, as you avoid reality. That’s why I don’t waste time with you anymore. Look up the concentration of CO2 in the stratosphere, then admit your mistake.
Unless you start admitting your mistakes, you will never learn.
JDHuffman
Again, telling me to look something up for myself is not you providing supporting evidence. Support your claims or are you too lazy to do it?
HERE:
https://ams.confex.com/ams/14CLOUD14ATRAD/webprogram/Paper250607.html
Here read this article, maybe you can learn something. CO2 contributes to stratospheric cooling.
https://agupubs.onlinelibrary.wiley.com/doi/pdf/10.1029/1998JD200099
Maybe do some real science instead of unsupported declarations. This blog has posters who know actual science. You don’t have the audience that posts on Joseph Postma blog or Scientific Principia International.
JDHuffman says:
2) Try to warm a banana that is at room temperature using only the radiative flux from ice cubes.
It’s warmer than it’d be in a vacuum.
JDHuffman says:
1) The stratosphere contains insufficient amounts of CO2 to be a factor.
See Figure 4 in
“Global distribution of CO2 in the upper troposphere and stratosphere,” Mohamadou Diall et al, Atmos. Chem. Phys., 17, 38613878, 2017.
http://www.atmos-chem-phys.net/17/3861/2017/
https://www.atmos-chem-phys.net/17/3861/2017/acp-17-3861-2017.pdf
Norman, if you are now admitting that you were wrong about C02 concentration in the stratosphere, then I accept your admission.
If, however, you are trying to deny your own words, then that’s “nothing new”.
JDHuffman says:
3) Low energy IR radiative fluxes do NOT add to solar flux.
{rolls eyes & snickers}
Yes DA, your snarky remarks and stupid questions are a lot easier than learning some physics.
I understand – no one likes to be proven wrong. Buck up.
JDHuffman
YOU: “Norman, if you are now admitting that you were wrong about C02 concentration in the stratosphere, then I accept your admission.”
Good Lord JDHuffman, read the material in the links I put into my post to you on this issue. It clearly shows that the CO2 in the Stratosphere has a cooling effect on this part of the atmosphere. Where do you get that I am wrong? Help your empty mind. I am not even sure anyone can possibly communicate anything with you.
You do not provide any material to support your claim. I do some research and it proves you are wrong and then you try to reverse reality. You have a sick mind. It needs much help. Only reading good sound science will help you.
More pseudoscience computer models: “In this study, we construct a new monthly zonal mean carbon dioxide (CO2) distribution from the upper troposphere to the stratosphere over the 20002010 time period.”
No wonder DA and Norman get so confused. They actually swallow this stuff!
Look at the evidence (esp since you have none).
See Figure 4 in
“Global distribution of CO2 in the upper troposphere and stratosphere,” Mohamadou Diall et al, Atmos. Chem. Phys., 17, 38613878, 2017.
http://www.atmos-chem-phys.net/17/3861/2017/
https://www.atmos-chem-phys.net/17/3861/2017/acp-17-3861-2017.pdf
DA, you’re making my point for me.
“This reconstructed CO2 product is based on a Lagrangian backward trajectory model driven by ERA-Interim reanalysis meteorology and tropospheric CO2 measurements.”
Then you must reject UAH’s temperature numbers, right, since it comes from an even more complicated model?
“Without models, there are no data.”
– Paul N. Edwards, “A Vast Machine”
http://pne.people.si.umich.edu/PDF/Edwards_2009_A_Vast_Machine_Introduction.pdf
Look how Ger*an (=JD Huffman) completely avoids even discussing Figure 4 in
Global distribution of CO2 in the upper troposphere and stratosphere, Mohamadou Diall et al, Atmos. Chem. Phys., 17, 38613878, 2017.
http://www.atmos-chem-phys.net/17/3861/2017/
https://www.atmos-chem-phys.net/17/3861/2017/acp-17-3861-2017.pdf
entropic…”You will go on waiting. Science does not do proof, it does evidence and likelihood”.
Oh, gee, and I thought science is based on the scientific method. Where is likelihood covered in the scientific method?
It’s interesting to see that intelligence and logic is not part of alarmist methodology.
norman…”CO2 warming effect is on the surface. The downwelling IR. I have linked you many times to various measured values of DWIR from CO2″.
You have linked me to all sorts of pseudo-science. Please don’t offer evidence from comedy and farce sites like scienceofdoom. They too are utterly confused about the 2nd law.
Gordon Robertson says:
Please dont offer evidence from comedy and farce sites like scienceofdoom.
This is *exactly* what deniers do — immediately refuse any information without considering it or disproving it.
Usually, like now, they don’t even understand what they’re denying, like on SOD’s site.
“Learn some physics.” “Farce site.” It a rejection of intellectualism and of the scientific method. It’s atrocious, and they know it, which is why Gordon nor Ger*an has the guts to comment under their real name/identifier.
norman…”What evidence do you have that the Earths surface will not abosrb nearly all the IR emitted by the atmosphere…… And why would not the fluxes add? You say they dont. All textbook physics say they do.”
The 2nd law states specifically that heat cannot be transferred from a colder atmosphere to a warmer surface.
The fluxes cannot add because they are in different frequency bands, and as JD pointed out, the terrestrial IR back-radiated is a tiny fraction of the solar radiation.
If you want to add signals, their frequencies should overlap (have a phase relationship). It’s called superposition. The heating frequencies in solar energy are a long ways from the IR frequencies in terrestrial radiation. No one has ever proved there is an additive effect between SW solar and LW terrestrial IR. Any addition would have to be in the lower frequencies, and lower ampliftudes of the solar radiation band where there is a slight overlap in frequency.
You can combine different signals in an amplifier by applying one signal to the input and another signal inline with the output. That does not work in the atmosphere.
You won’t find such nonsense theories in reputable textbooks.
DA…”Then you must reject UAHs temperature numbers, right, since it comes from an even more complicated model?”
Nope. UAH time series come from actual temperature measurements, not modeled, fabricated data.
Gordon Robertson says:
Nope. UAH time series come from actual temperature measurements, not modeled, fabricated data.
No, stupid.
UAH’s raw data is irradiance from emissions from atmospheric oxygen molecules.
They then use a model to convert this to temperatures.
RSS does this too, but think their model is better. Hence RSS measures about 50% more warming than does UAH.
Gordon Robertson says:
The 2nd law states specifically that heat cannot be transferred from a colder atmosphere to a warmer surface.
Wrong again, dummy.
Gordon Robertson says:
entropicYou will go on waiting. Science does not do proof, it does evidence and likelihood.
Oh, gee, and I thought science is based on the scientific method. Where is likelihood covered in the scientific method?
Entropic is right. Neither science or the scientific method “proves” anything. At any time, just one experiment or observation can prove the science wrong.
JDHuffman says:
Look up the concentration of CO2 in the stratosphere.
I did. You wouldn’t look at it.
Gordon Robertson
Why do you always do this over and over and can’t correct your flawed thought? It does get old! Please consider altering your comments to deal with what posters actually say and not what you falsely think they say!!
YOU: “The 2nd law states specifically that heat cannot be transferred from a colder atmosphere to a warmer surface.
Over and over I state ENERGY EMR does transfer from a cold atmosphere to a warmer surface. I DO NOT SAY HEAT transfers from a cold atmosphere to a warmer surface. You insert the word “heat” when no one said it. Why do you need to keep doing this after I have pointed out to you many times not to??
Again reality for you (not that it has even a slight chance to wake you up!)
“It is important to note that when it is stated that energy will not spontaneously flow from a cold object to a hot object, that statement is referring to net transfer of energy. Energy can transfer from the cold object to the hot object either by transfer of energetic particles or electromagnetic radiation, but the net transfer will be from the hot object to the cold object in any spontaneous process. Work is required to transfer net energy to the hot object.”
From:
http://hyperphysics.phy-astr.gsu.edu/hbase/thermo/seclaw.html#c1
Same as any textbook on heat transfer will state. Same as Clausius said when formulating the Law (which many people have shown you with his own words that you ignore, I will post them again if you continue with your version of delusional behavior).
YOU: “The fluxes cannot add because they are in different frequency bands, and as JD pointed out, the terrestrial IR back-radiated is a tiny fraction of the solar radiation.”
Where in the world do you come up with this nonsense. You just make it up and think it is valid? Why do you need to make up stuff and pretend you know what you are talking about. Well you are totally wrong! Empirical data collected daily shows how ignorant you statement really is. Science will not help you but I will show you the error of your thought process.
https://www.esrl.noaa.gov/gmd/webdata/tmp/surfrad_5c20494fd460d.png
What is your source of data that IR back-radiated is a tiny fraction of the solar radiation? You just made it up. It has zero basis.
Poor Norman is always trying to claim solar flux adds to IR. But, he links to the Desert Rock graph that indicates solar does NOT add to IR.
As usual, poor Norman can’t understand the links he finds.
Jeez what a bunch of macaroons,
Of course you can add fluxes of different frequencies.
If a racehorse is a good model of the moons rotation and revolution then sound is a good model for light.
Hey Jimi, what happens when I add a sound frequency of 440 hertz to a sound frequency of 587 hertz?
Experimental evidence using Gibson and Marshall equipment tells me so.
Bobdruggy, please stop trolling.
Gordon Robertson says:
It takes a good deal of solar energy to change the phase of water from solid to liquid and obviously there is so much ice it has slowed the process.
The ice also melts from warmer air temperatures and a warmer ocean beneath.
Its obvious that increasing CO2 has no effect on the warming of the Arctic Ocean.
Then prove your claim, if it’s so obvious.
The warmer air in vacuum of stratosphere would evaporate ice in stratosphere, and added warmth from sunlight would also increase the amount the ice in vacuum of stratosphere which would evaporate.
There is not “warmer air” in the stratosphere, there is cooler air, because CO2+ has absorbed and redirected the IR coming up from the Earth’s surface.
This is the best signal of greenhouse warming there is. It would not be true if the Sun was causing the observed warming.
Yes DA, CO2 helps cool the planet.
At least you got something right.
I didn’t write that. And, again, you have presented absolutely no evidence.
There is not “warmer air” in the stratosphere, there is cooler air, because CO2+ has absorbed and redirected the IR coming up from the Earth’s surface.”
And more down. More down than if the CO2 wasn’t there.
JDHuffman
YOU: “Yes DA, CO2 helps cool the planet.
At least you got something right.”
NO. CO2 helps cool the Stratosphere, not the surface. The CO2 in the atmosphere leads to a warmer surface temperature than it would be without CO2 present.
Norman, the heat from the surface eventually gets radiated to space. That portion that is emitted by CO2 cools the planet.
Learn some physics.
svante…”Now we can compare integrals for the whole year:”
What’s your point? The average is still well below 0C for the year and barely exceeds 0C at any time of the year.
I think ren’s point at the time was the temps were below a long-term average despite the consensus that they should have been a lot warmer.
You’re welcome to come over and join us skeptics, you know. It’s much easier than trying to keep up a pseudo-scientific charade.
Leave that to the likes of binny and DA, who seem to get a thrill out of being persnickety.
The point is ren finds freak lows all over the world.
Global warming is about long term global averages.
You’re not sceptical, you buy all sorts of conspiracy theories.
Talking of which, what are your thoughts on the russian Salisbury poisoning suspects?
svante…”Talking of which, what are your thoughts on the russian Salisbury poisoning suspects?”
I think the jury is out till they positively identify a suspect. Conjecture does not solve crimes.
It’s like this McCarthyist Mueller investigation. It’s still going on more than a year after it began and it has branched out enormously. It’s not about investigating Russian involvement in the US election, it’s about trying to bring down Trump.
No one has ever proved the Russians meddled in the US election it’s sheer conjecture. No hacker worth his salt is going to leave a trail for the FBI or Homeland Security. The Russians were blamed for purely political reasons.
I am no fan of Putin, although Gorbachev claimed he is OK. I just can’t stand Russia-bashing by the likes of Hillary Clinton simply because she doesn’t like Russians.
I mean, what else can they do? They got rid of Stalinist Communism in the early 1990s and no one reached out to help them adjust. All they got was opportunists trying to profit from their attempts at democracy.
So, when a Russian gets poisoned, it has to be the Russians who did it. Couldn’t be someone who hates Russians, like the Chechnyans, the Georgians, etc.
Why did they lie about their true identities here:
https://tinyurl.com/y8ckwm5u
Dr. Alexander Mishkin:
https://tinyurl.com/y856orxl
GRU Colonel Anatoliy Chepiga:
https://tinyurl.com/y96rsnb3
Gordon Robertson says:
No one has ever proved the Russians meddled in the US election its sheer conjecture
Bull.
“A mountain of evidence points in one direction: Russia sought to sway the 2016 US election, USA Today 8/3/18
https://www.usatoday.com/story/news/2018/08/03/russian-us-election-interference-donald-trump/878910002/
“Heres the public evidence that supports the idea that Russia interfered in the 2016 election,” Washington Post, 7/6/17
https://www.washingtonpost.com/news/politics/wp/2017/07/06/heres-the-public-evidence-that-supports-the-idea-that-russia-interfered-in-the-2016-election/
“Did Russia Affect the 2016 Election? It’s Now Undeniable,” Wired 2/6/18
https://www.wired.com/story/did-russia-affect-the-2016-election-its-now-undeniable/
–David Appell says:
December 23, 2018 at 1:01 PM
Gordon Robertson says:
No one has ever proved the Russians meddled in the US election its sheer conjecture.
Bull.–
Got to agree with David. Russia has always meddled in US elections.
And Africa elections and etc.
Of course don’t need to prove that US also meddles in other countries elections- or at least they brag about doing it.
And Europe particularly UK and France also interfere in US elections.
It would be nice if countries didn’t interfere in each others elections, but if you are a globalist one tend to think it was your right or duty to interfere in other people’s elections.
And governments of US, UK, France, Russia, Iran, China are mostly globalists. And don’t give a hoot about their citizens and lines on a map.
Of course than we also have the media. I think CNN once imagined it was going to be the global news outfit. Now they seems to settled on being much less.
Gbalkie: You’re certainly right — the US has meddled (or more) in many country’s elections.
Americans aren’t very smart. They cannot understand this, but lurch out about Russian interference. It’s a pathetic situation and an embarrassing one for us Americans who known better. But then, most things about America these days is embarrassing.
DA, you’re certainly right–some Americans aren’t very smart.
DId you know that some even believe CO2 can “heat the planet”? And some even believe a racehorse is rotating on its own axis, as it runs an oval track.
Embarrassing, huh?
Again, no evidence presented whatsoever.
DA…”Americans arent very smart”.
Especially you. You don’t even know that America is a continent, not a country. The United States is the country with one of it’s states not even in America. The US is called the United States OF America. The title claims you are in America, you are claiming you are America.
gbaikie…”Got to agree with David. Russia has always meddled in US elections”.
Maybe so, but there is no proof they hacked the US election system or hacked anything else. That is sheer conjecture based on a name the FBI or Homeland Security picked up somewhere.
Hackers use spoofing techniques in which they fake a sender’s origin and identity. I could claim the FBI or HS are naive but I think their motives are more sinister. They are making unfounded claims, presuming the uninitiated will believe them.
Anyone having researched hacking techniques knows how easy it is to mask one’s identity on the Net. Hacker’s use proxy servers that strip off the sending IP, substituting a bogus IP. By the time a hacker runs through a couple of proxy servers, the origin is impossible to trace.
No good hacker will be caught and I find it inconceivable that the Russians don’t have good hackers. The irony is that the proxy servers hackers use to mask their identity were set up by corporations for other purposes.
svante….”Why did they lie about their true identities here:”
Not interested in the case. The article seems to be a conspiracy theory by unknowns.
Do you think a couple of Russian hit men would be casually walking about Salisbury in a snow storm? I would think they’d be trained to be more discrete than that.
I mean, these guys are sitting in the local train station drinking coffee? Then they have to seek lawyers to help them escape? Then sit for an interview?
Yeah, right.
Gordon Robertson says:
Maybe so, but there is no proof they hacked the US election system or hacked anything else.
Gordon, I gave you three links to articles that went through the evidence.
Why did you ignore them???
Gordon Robertson says:
Especially you.
Huh? You’re making things up again.
DA says: “Gordon, I gave you three links to articles that went through the evidence.”
DA, “evidence” is not “proof”.
It’s like claiming CO2 can heat the planet because it emits a 14.7 micron photon.
Yes, it emits photons. No, it can NOT heat the planet.
You’re prone to jump to conclusions.
Here’s the 2006 Vinther et al study with the combined Greenland data-sets using actual instrumental data from early 1800s to 2000. UK alarmists Dr Jones and Dr Briffa were also part of this study.
The last couple of decades up to 2000 were cooler than the 1910s, 1920s,1930s, 1940s and 1950s and they compare well with some of the much earlier decades. See Table 8 and their conclusions.
https://crudata.uea.ac.uk/cru/data/greenland/vintheretal2006.pdf
7. Conclusion
[49] “Using old temperature observations from early
observers, the existing Greenland temperature records have
been extended back to the year 1784. Gaps remain, mostly
during summer and autumn. In the process of creating the
long record, a few inhomogeneities were identified and
corrected. Most of the homogeneity problems were due to
changes in the hours at which temperature observations
were carried out.
[50] Comparison against winter season ice core proxy
data showed stable and highly significant correlations
throughout the period covered by the extended Greenland
temperature series. This marked consistency, r = 0.67/0.60
for the extended/existing data, shows that both the ice
core data and the extended temperature series are very
robust.
[51] The warmest year in the extended Greenland temperature
record is 1941, while the 1930s and 1940s are the
warmest decades. Two distinct cold periods, following the
1809 (‘‘unidentified’’ volcanic eruption and the eruption of
Tambora in 1815 make the 1810s the coldest decade on
record”.
Neville
You are evidently right.
To what you write here we use to say in my native language: “enfoncer une porte ouverte”.
1. Here are, in absolute values of course, the 10 hottest days in Grrenland I could find in the actual GHCN daily record database (61 stations):
1990 7 26 25.5 (°C)
2005 7 14 25.3
1942 6 14 25.3
1916 6 18 25.3
2008 6 13 25.2
1995 7 2 25.2
1899 8 2 25.2
1957 6 22 25.0
2012 5 29 24.8
2005 4 21 24.8
2. The 10 hottest months:
1937 7 13.20
1938 7 10.73
1908 7 9.63
1917 7 9.27
2012 7 9.20
1939 7 9.16
1936 7 9.15
1950 7 9.12
1931 7 9.08
1938 8 9.05
3. The 10 hottest years:
1935 -0.414
2010 -0.444
1929 -0.493
1941 -0.498
1928 -0.505
1936 -0.528
1932 -0.903
2016 -1.245
1939 -1.318
1937 -1.342
It should be evident as well that today’s data differs from that was available at the study’s time (lots of years were added inbetween), and that my evaluation might differ from what the study refers to.
To your information: the entire Arctic region was warmer during the 1930s. This is well known since longer time!
Bindidon thanks for the info. Dr Curry thinks that the AMO has an important influence on Arctic/Greenland temps and ice sheets. It will be interesting to see what happens when the AMO changes to the cool phase, possibly some time in the 2020s.
Some scientists think that the AMO may have started to enter the cool phase in 2015. Who knows?
Wait and see:
https://drive.google.com/file/d/1Dhd4B6NecCKi_JE1veaPLkMktFrgRiDn/view
Because AMO is already turning, what we best see when using a polynomial trend (this AMO’s linear estimate is near zero, as it is here in the detrended variant).
But I do not see the Arctic surface temperatures following yet.
No matter what the AMO does, or how it affects global temperature, it will say nothing about anthropogenic climate change, though I’m sure many will try to use it to say AGW is over or never existed. They’re winding up for this already.
DA, the AGW hoax was over before it started. You would know that if you understood the relevant physics, and were able to think for yourself.
You can’t provide evidence about any of your claims. There’s no reason to pay any attention to you.
DA, you either can’t understand the evidence, or you don’t want to understand. That’s why you don’t pay any attention.
Consequently, like Norman, you can’t learn.
What evidence don’t I understand?
Because you haven’t presented any evidence.
DA, where is the evidence that you will consider any evidence?
You refuse facts and logic, in deference to your pseudoscience.
As always, you try to change the subject.
Just like a lightweight.
Wrong DA. I’m not changing the subject, you are.
The subject is “evidence”. Where is there any evidence that you have learned any of the relevant physics? You still believe a racehorse rotates on its own axis as it orbits the track.
You can’t think for yourself.
Bindidon pay attention to the highs in the north. A real winter begins in Europe.
https://pics.tinypic.pl/i/00976/eeaskxq63n99.png
https://www.accuweather.com/en/de/berlin/10178/january-weather/178087?monyr=1/1/2019
Expect snowfall.
It’s just weather.
Śnieg w Berlinie na początku 2019 roku? Założę się nie więcej niż 5 cm.
ren, how can a snapshot prove anything is “beginning?” Or “ending?” Or anything about anything except for that single point in time?
More importantly, why do you keep misrepresenting the data you post?
David, please stop trolling.
The northern hemisphere is about 1 degree warmer than southern.
Ie:
https://www.researchgate.net/publication/258778329_Why_is_the_Northern_Hemisphere_warmer_than_the_Southern_Hemisphere
So, can it be assumed northern hemisphere radiates more energy into space than the southern hemisphere radiates into space?
Or would southern hemisphere radiate more than northern hemisphere?
gbaikie
In your linked article it claims that the Northern Hemisphere does indeed radiate more energy.
The Southern Hemisphere has a higher reflection of solar input but it is less than the increased solar input due to Earth’s orbit.
The conclusion was that energy from the Southern Hemisphere is transported to the Northern Hemisphere causing it to be a little warmer.
Northern hemisphere is warmer by a greater amount than all global warming in last 100 years. But still, I do agree the northern Hemisphere is a little warmer than southern hemisphere and 1.5 C warmer is a small amount.
And, I think in next hundreds we might have a little warming.
Does any one think it is possible that the southern hemisphere could catch up to northern hemisphere in the coming century?
Or does it seem more likely that northern hemisphere will continue to warm faster- and even have wider difference between the northern and southern hemisphere?
It is said that Earth radiates about 240 watts on average per square meter.
In terms of two hemispheres does southern hemisphere radiate about 238 watts and northern about 239 watts?
It is said that Africa is hottest continent.
I wonder what average amount of watts per square meter is radiated from Africa.
It seems Africa north of equator radiates higher average per square meter than the Africa which is south of equator.
Where’s your science? I don’t see any….
DA is unable to “see” any science.
Nothing new.
Enlighten me.
Open your eyes.
You couldn’t prove your way out of a paper bag.
Everytime someone proves you wrong DA, you go into denial.
You can’t face reality.
Year 2019 is the determining year as to where the climate is going to be heading.
Exactly that you told us for 2017 and 2018.
“2016 will not be s warm as 2015, and 2017 will not be as warm as 2016 etc”
– Salvatore del Prete, 12/3/15
http://www.drroyspencer.com/2015/12/2015-will-be-the-3rd-warmest-year-in-the-satellite-record/#comment-203097
Salvatore Del Prete says:
July 22, 2017 at 6:47 AM
“I said year 2017 is going to be a transitional year in the climate.”
http://www.drroyspencer.com/2017/07/warming-in-the-tropics-even-the-new-rss-satellite-dataset-says-the-models-are-wrong/#comment-256278
Salvatore Del Prete says:
August 2, 2018 at 6:13 AM
“Year 2018 is the first year I ever said was a transitional year.”
http://www.drroyspencer.com/2018/08/uah-global-temperature-update-for-july-2018-0-32-deg-c/#comment-314681
So you’ve changed “transition” to “determining” and hope we don’t notice. You really are pathetic.
B, DA, and BDB, please stop trolling.
It is different because 2019 has 3 years of cooling behind it.
Salvatore Del Prete says:
November 28, 2017 at 8:00 AM
“Look out below global temperatures should be at or below 30 year means by next summer…. Solar is finally entrenched in the values I said is needed to have a climatic impact following x years of sub solar activity in general.”
http://www.drroyspencer.com/2017/11/uah-global-temperature-update-for-october-2017-0-63-deg-c/#comment-273890
You might think I feel some need to convince you, but this is not the case.
Look at the graph below, it shows GHCN station data and UAH’s tropospheric data on the same baseline (1981-2010):
https://drive.google.com/file/d/1aymAha2312Tiw8XqHrf6qIKaiN5RYbgt/view
The difference, for both datasets, between the highest anomaly and the immediately following lowest one is higher in 1998 than in 2016.
And you think the last three years are something new!
This is nonsense: the cooling during the three last years is less than the cooling from 1998 till 2000.
1. 1998-2000
– UAH: 1.2 C
– GHCN: 0.76 C
2. 2016-2018
– UAH: 1.02 C
– GHCN: 0.68 C
But feel free to think we move to cooling due to Sun’s lack of activity!
Here in Berlin, we enhjoy warming, no winter this year like last year.
Who has experienced Feb 1956 in France or in Germany needs no winter anymore…
*
I enjoy right now Robertson’s stupid comment about faked graphs showing fudged data.
Evidemment!
That’s a nice graph. Thanks for posting it.
binny…”Look at the graph below, it shows GHCN station data and UAHs tropospheric data on the same baseline (1981-2010):”
Bullfeathers!!! This is another one of your imaginary graphs based on your poor statistical abilities.
Here is a NOAA land and see graphic from the IPCC showing warming between 2000 and 2010 that UAH does not show. Yet you have them virtually in lock-step.
******Note: you have to fix the ncd***c in the URL first. Copy/paste then remove the *** between d and c*********
https://www.ncd***c.noaa.gov/file/global-temperature-anomaly-time-series-and-trendspng
Now, compare that to UAH:
http://www.drroyspencer.com/wp-content/uploads/UAH_LT_1979_thru_November_2018_v6.jpg
Not even remotely close. Not sure whether you are a devious idiot or just a plain idiot.
The trend is in my favor not yours David.
It certainly is not, Salvatore:
http://www.drroyspencer.com/wp-content/uploads/UAH_LT_1979_thru_November_2018_v6.jpg
When are you going to learn that short-term fluctuations of a year or three are NOT about climate?
Why is that so difficult to understand?
Why have you past predictions always been wrong?
Oh yes, Salvatore, it is!
http://www.woodfortrees.org/graph/uah6/from:1979/mean:12/plot/uah6/from:1998/to:2000/trend/plot/uah6/from:2016/trend
According to Roy Spencer’s original data you find here (column 4):
https://tinyurl.com/y997zl7w
we have the following trends in C / decade
– 1998-2000: -2.28 +- 0.45
– 2016-2018: -1.47 +- 0.41
Thus I will believe you when the newer trend becomes lower than the old one.
It will take some little time but I am patient!
The trend form 2016- present is down.
Wow, two whole (La Nina) years?????
Weather or climate?
Jesus, Salvatore!
Are you blind on ‘the right eye’ ?
I’m telling you that the UAH trend from 1998-2000 has been far more down than that for 2016 till now.
Is that so hard to understand?
David and Bindidon, please stop trolling.
–Guest Opinion: Dr. Tim Ball
Environmentalists are destroying environmentalism. As a subset of that destruction, creators of the Intergovernmental Panel on Climate Change (IPCC) falsified science to claim that humans are causing global warming (AGW). That false science wasted trillions of dollars and disrupted millions of lives. That is enough money to provide clean drinking water and basic sewage for every country in the world.–
https://wattsupwiththat.com/2018/12/23/humans-are-the-superior-species-with-every-right-to-be-on-earth-we-are-not-unnatural-as-environmentalists-claim-and-the-ipcc-assumes/
Well, let’s not kid ourselves, governments would not have “provided clean drinking water and basic sewage for every country in the world” with the money. Particularly the German government, who I believe has wasted the most per capita than any other government.
Though it’s possible, that Germany has merely done a better job of accounting for all their wasteful polices.
Germany is frozen little land where there are a lot idiots which are in fear of warmer conditions. I suppose it’s related to their traditional talented ability of brainwashing their citizens.
I would tend to bemoan that Germany didn’t waste it’s money on space related activity.
Now, if a country wanted to do anything about clean drinking water and basic sewage for every country in the world, then they focus on free trade- and obviously the EU is not doing that- rather it’s quite the opposite.
gbaikie
This is one of the most ridiculous and most superficial comments you ever published on this blog.
No idea where you live! But you know nothing about Germany, let alone about Europe.
1. “Particularly the German government, who I believe has wasted the most per capita than any other government.”
What exactly do you mean about that? You probably do not even know it. You are just repeating things like a parrot.
2. “Germany is frozen little land where there are a lot idiots which are in fear of warmer conditions. I suppose its related to their traditional talented ability of brainwashing their citizens.”
Here also, you repeat blah blah like a little, simple-minded parrot.
We are not at all in fear of warmer conditions, gbaikie: we have it pretty warm here, and feel very well.
If it gets too warm somewhere, we certainly will not become the victims of that.
3. “I would tend to bemoan that Germany didnt waste its money on space related activity.”
So? Are you sure? You ‘would tend to bemoan’: that tells us everything about your superb knowledge.
Maybe you become a bit less polemic when you have read this:
https://www.esa.int/ger/ESA_in_your_country/Germany/Partner_der_Raumfahrt_in_Deutschland
4. “Now, if a country wanted to do anything about clean drinking water and basic sewage for every country in the world, then they focus on free trade- and obviously the EU is not doing that- rather its quite the opposite.”
That is well not only the most stupid but also the most ruthless sentence I have ever read concerning water.
How rich are you, gbaikie? Maybe you are as rich as Dr Tim Ball?
Do you know that ‘free trade’ companies extract water out of the ground in Africa and sell it to a price most Africans can’t pay for?
Hello, Robertson II….
Tim Ball is not a climate science expert, and this has been admitted in a court of law.
After the Calgary Herald published an op-ed by Ball on April 19, 2006, whom the newspaper identified as the first climatology PhD in Canada and a climatology professor at the University of Winnipeg for 28 years, they published a letter on April 23, 2006 from Dr. Dan Johnson, a professor at the University of Lethbridge, who pointed out that neither of those descriptions is true; that Dr. Ball’s credentials were being seriously overstated. Ball later threatened Johnson and the Herald and ultimately sued for defamation.
In their Statement of Defense filed in Court, the Calgary Herald submitted the following:
1. “…that the Plaintiff (Ball) never held a reputation in the scientific community as a noted climatologist and authority on global warming.
2. “The Plaintiff has never published any research in any peer-reviewed scientific journal which addressed the topic of human contributions to greenhouse gas emissions and global warming
3. “The Plaintiff has published no papers on climatology in academically recognized peer-reviewed scientific journals since his retirement as a Professor in 1996;
4. “The Plaintiff’s credentials and credibility as an expert on the issue of global warming have been repeatedly disparaged in the media; and
5. “The Plaintiff is viewed as a paid promoter of the agenda of the oil and gas industry rather than as a practicing scientist.”
Ball dropped his lawsuit.
Source: The Calgary Herald, Statement of Defense paragraph 50, Dr Tim Ball v The Calgary Herald, In the Court of the Queens Bench of Alberta Judicial District of Calgary, Dec 7, 2006 (http://is.gd/brO4uO).
More at:
http://www.desmogblog.com/tim-ball-vs-dan-johnson-update-0
http://www.desmogblog.com/tim-ball-vs-dan-johnson-lawsuit-documents
http://www.desmogblog.com/ball-bails-on-johnson-lawsuit
gbaikie…”Environmentalists are destroying environmentalism…”
From the same link you provide:
https://wattsupwiththat.com/2018/12/21/germanys-green-transition-has-hit-a-brick-wall/
“Germany is frozen little land where there are a lot idiots….”
We know that’s at least partly true, we have binny as proof.
Here is the 2014 Mathews et al study that tries to apportion blame for our so called CAGW. It covers 200 years ( about 1813 to 2013) Of course the USA is the number 1 culprit of the top 20 and my country Australia is apparently responsible for a whopping 0.006 c of warming over that time. That’s six thousandths of a degree c over the last 200 years. OH the horror. SARC SEE Table 2 at link.
http://iopscience.iop.org/article/10.1088/1748-9326/9/1/014010/pdf
I reckon countries like the UK ( started the Ind Rev) and USA should be congratulated for dragging the world from POOR and SICK to Healthy and Wealthy in just this tiny window of opportunity. Of course Australia is also a high sink for co2 that far outweighs any of our emissions.
How much value can we place on a doubling ( at least) of life expectancy and this applies to Chinese people who live in their cities as well. Don’t forget the Chinese have achieved this in the shortest period of time and they now generate 66.7% of TOTAL energy from coal.
BTW they claim 0.7 c of warming since 1813. OH and HAD Crut 4 shows ( adjusted) warming of 0.55 c per century since 1850 or about 0.9 c over the last 168 years. Let’s face reality, a percentage of this warming is probably just a natural recovery from the coldest period over the last 10,000 years. Called the Little Ice Age, yet we still have silly fools that long for a return to a similar climate. Here’s a thought, how come 7.4 bn people now enjoy much higher life expectancy and wealth ? Kinda makes you think, or perhaps not?
Neville, the US got very wealthy by emitting CO2.
Why aren’t they now rich enough to use 100% renewable energy?
If not now, then when?
DA, you can set an example for your false religion: Stop using anything that uses fossil fuels or produces CO2.
Start with turning off the heat in your apartment.
Last I checked my carbon footprint was 64% of the average American’s. But individual actions cannot solve climate change. Here’s just one reason why:
But let’s say 5% of us care enough above manmade global warming that we stop using fossil fuels. Zero. That lowers demand for FFs, which lowers their price. That means people like you, who couldn’t care less, can buy FFs at a cheaper price and will likely use even more of them.
Unfortunately, as society is currently structured, we must burn fossil fuels to lead a healthy life in the US.
DA, it must be hard to be believe in a false religion and yet not be able to follow it.
But, at least you have your rationalizations….
Last fill up, gas was $1.88/gal. (Thank you, fracking!) Now, I can drive even more, providing the life-giving CO2 so that trees can grow even taller, and crops can produce even more.
Again, no reply whatsoever to the argument-at-hand.
No DA, the “argument” was your false religion, which I addressed.
You are just running from that fact.
You’re such a lightweight.
You are running from the fact that you won’t support your false religion, except with rhetoric.
Neville
Thanks for the link, maybe I have time enough to read it…
But… what the heck do you mean with
“How much value can we place on a doubling ( at least) of life expectancy and this applies to Chinese people who live in their cities as well.”
Would you like to live in Beijing? One of our friends had to work there during 5 years. The most horrible part of his life due to nearly permanent pollution.
“Called the Little Ice Age, yet we still have silly fools that long for a return to a similar climate. ”
Where are these ‘fools’ ? In your own mind I guess.
You perfectly know that NO ONE on Earth wishes any return to LIA!!!
Why do you write such nonsense?
I’ve read that life expectancy has been reduced by 10 years in Beijing due to all their air pollution.
CFP of 64% thats because you dont go any where you should ask your mom if you can go out more
Ive read top scientific comment are you going to get that peer reviewed
Regards
HC
Harry, if you need to vent, go right ahead. If you have a question for me, please ask.
“CFP??”
David, please stop trolling.
neville…”…my country Australia is apparently responsible for a whopping 0.006 c of warming over that time”
That’s about what the Ideal Gas Law predicts for CO2 warming at 0.04%.
The ideal gas law has no term for thermal radiation.
Apparently Gordon believes he can predict daily high and low temperatures using the ideal gas law.
bob….”Apparently Gordon believes he can predict daily high and low temperatures using the ideal gas law”.
It would be helpful if you could downgrade your naivete quotient to the point where you could understand simple physics.
svante…”The ideal gas law has no term for thermal radiation.”
Com on, svante, let’s not be ingenuous. We are talking air pressure, air volume, air mass, and air temperature.
IGL: PV = nRT
Who cares about radiation, we’re talking about the ability of a trivial mass (‘n’ in PV = nRT) being able to warm the other 99.96% of the atmosphere, never mind the surface.
If the atmosphere does not warm, the surface cannot warm, simple as that. Heat can only be transferred from a warmer atmosphere to a cooler surface.
CO2 is important due to it’s radiative properties.
What happens if you heat the 0.04% to 10000 degrees C?
–Svante says:
December 25, 2018 at 4:56 AM
CO2 is important due to its radiative properties.
What happens if you heat the 0.04% to 10000 degrees C?–
It seems a number of things could happen.
Not sure how one was imagining how one could do this.
There are number of ways to look at it.
One could ask what kind of things could heat anything to 10,000 C or more.
So nuclear explosions, impactors, lasers and various things.
One say a molecule does not actually heat up and if talking about 0.04% of a gas, then one is essentially talking about a molecule being heated.
I think a ion rocket engine makes gas travels about this fast or the exhaust could said to be this temperature. So if turn on ion engine in the atmosphere it would of course heat some the gas in the atmosphere to this temperature- but it’s not particularly exciting.
And if had a billion ion engines turned on in the atmosphere, I don’t think it suddenly becomes exciting [though it would cost a lot of money].
You make lots of wacko claims, always without evidence, then get huffy when anyone challenges you.
Are you talking to yourself again, DA?
David Appell
You are correct about g.e.r.a.n. He makes many wacko claims but never backs any of them up.
When he uses the term “relevant physics” he is not meaning any textbook physics based upon observation, sound math, logical reasoning, and experimental testing. What he means is his own made up ideas that have zero support, no logic, no experimental evidence.
You are supposed to accept them on his word alone.
If you want to see where this foolish poster comes from, visit this blog:
https://principia-scientific.org/
A lot of the posts are just people making up their own ideas. Zero supporting evidence, no valid science. I pointed out to some there errors but it does not help.
g.e.r.a.n is a creature of these blogs as is Gordon Robertson. They learn from these crackpot blogs that all you have to do to be scientific is make unsupported declarations in an authoritative fashion and it is correct and all science is fake, false and institutionalized pseudoscience. Once you learn where they come from you can see you will never be able to reason with either of these two.
You can tell by their postings they have never studied physics. JDHuffman can’t understand geometry. How will you reason with people that are that lacking in basic knowledge? You won’t be able to.
If Norman couldn’t resort to his insults, false accusations, and misrepresentations, he wouldn’t have anything to bang on out his keyboard.
Nothing new.
JD…”If Norman couldnt resort to his insults, false accusations, and misrepresentations, he wouldnt have anything to bang on out his keyboard”.
Guess that comes from reading textbooks he doesn’t understand. Kinda frustrating, I’d imagine, leading to an outburst of insults.
Norman, it seems you have just been subjected to insults, false accusations, and misrepresentations. The culprit should try starting with the man in the mirror and asking him to change his ways.
des must be especially desperate. Or, not paying attention. Or just lonely and needing new friends.
Or, all of the above….
Look Norman, the lonely man is looking for a friend.
DA…”…all you have to do to be scientific is make unsupported declarations in an authoritative fashion and it is correct…”
Ironic….that describes you and your alarmist brethern.
Oh, dearie me, I have misquoted DA when the quote I used came from Norman.
Oh, well, pretty much the same source.
The average life expectancy in China TODAY is 76 and is higher in the cities than rural areas.
Rosling linked to this fact in his 200 countries since 1810 BBC video, where he showed that Shang Hai TODAY has the same life exp as Italy and he then showed that poorer Chinese regions had much lower life exp. I consider Rosling a much better source than anyone here.
I certainly don’t think much of the LIA , but some people seem to imply that we’ve stuffed up the world since the Ind Rev and our use of fossil fuels. This is just delusional nonsense and the reverse is true.
I consider we are very lucky to live in the present day and as Rosling, Goklany etc showed deaths from extreme events have dropped by 97% since the early 20th century.
Rosling’s video trying to help people to be less ignorant about their planet should be compulsory viewing for school kids and so many silly pollies who seem to follow religious dogma instead of proper data and logic and reason.
Here’s China’s life expectancy today and you’ll note that their average is 76 and that’s only about 6 years behind wealthy OECD countries. Australia ranks very high for a country with such a high number of immigrants every year.
Germany has tried the renewables nonsense for decades and achieved nothing and today are expanding their brown coal mines. IEA data shows that today Germany STILL generates 25.5% of TOTAL energy from coal and the USA just 17.1%. Yet DA still thinks we can change to 100% renewables after the Germans have wasted 100s of billions of Euros for a zero return and still only generate 3.5% of TOTAL energy from GEO +S&Wind.
See the IEA data I’ve linked to before. And today the world only generates about 0.8% of TOTAL energy from GEO+ S&Wind. What a joke and what a waste of money.
https://en.wikipedia.org/wiki/List_of_countries_by_life_expectancy
Neville
“Germany has tried the renewables nonsense for decades and achieved nothing and today are expanding their brown coal mines”
This is incredibly superficial stuff and will need some longer answer later.
https://de.wikipedia.org/wiki/Datei:Energiemix_Deutschland.svg
I thought only Robertson would pretend such things, but have to learn that there are more and more little Robertsons writing their nonsense here.
What now concerns this:
https://en.wikipedia.org/wiki/List_of_countries_by_life_expectancy
we will have to wait for at least 30 years to know more about what exactly will happen in China during this century. The waste and pollution explosion there is inimaginable.
Be happy not to live in China, Neville. Australia is the right corner for you. Merry Xmas!
Bindidon, here is the EU based IEA data for German TOTAL energy mix. Germany has achieved nothing for their renewables nonsense and STILL generate 25.5% of TOTAL energy from coal.
The USA just 17.1%.
China’s life expectancy is 76 today and that is remarkable for a country with 1400 million people.
BTW the USA has an average life exp of about 80 years today. I suggest you watch the Rosling videos and gain from their proper analysis of the data. Merry Xmas.
https://www.iea.org/stats/WebGraphs/GERMANY4.pdf
Bindidon here’s Lomborg’s 2018 update from the IEA. Here he shows that Solar& wind combined generate just 0.8% of the world’s TOTAL energy and this MAY increase to just 3.6% by 2040.
He has posted the latest IEA charts to prove the point. And I don’t like anyone trying to infer that I would deliberately post false links. S&W are just BS and fra-d according Dr Hansen, the father of their CAGW.
He also said that a belief in S&Wind is like believing in the Tooth fairy and the Easter bunny. So just another Fairy Tale and Germany has certainly proved his point.
https://climatechangedispatch.com/where-do-we-get-most-of-our-energy-hint-not-renewables/
All you are proving is what we already know – that conservative politics is hindering the uptake of renewables.
Bobdesbond I’ve given you the data and evidence, but if you don’t understand simple sums you definitely can’t be helped.
IOW I can’t do your thinking for you. Geeezzzz give me strength.
That’s right – you are incapable of thinking at my level. Thanks for the admission.
Bobdesbond, please stop trolling.
Neville
One more time a little piece of info for you, more later.
Out of this document
https://www.ise.fraunhofer.de/content/dam/ise/de/documents/publications/studies/daten-zu-erneuerbaren-energien/Stromerzeugung_2017.pdf
everybody able to use Google’s Translator will extract the following information.
Numbers below are in TWh net (!) i.e. those from which internal consumption was deduced. For nuke, it is about 8%.
Non Ren
Nuke 72
Brown 134
Coal 82
Gas 49
Sum 337, i.e. 62% of total
Ren
Solar 38
Wind 104 (offshore: 17)
Water 21
Biomass 48
Sum 210, i.e. 38 % of total
And if offshore wind energy installation had been undertaken as promised in 2010, we would have a quite different balance.
Understood?
Bindidon I’m sure you mean well but I think you should follow the IEA data and for TOTAL energy, not just the electrical generation.
I’ve provided you with the data for Germany from the IEA for TOTAL energy generation. I can’t do any more.
But Neville… that is so evident that you even don’t need to mention it.
Everybody knows that electricity production is only about 15-20% of the total, in some countries even less.
But nobody should ignore that it would not be bad to keep CO2 production as low as economically meaningful / possible. Only shale gas fans (“my cheap gallon first”) think different.
Bindidon, have you ever calculated how much CO2 is produced by German breweries?
Each little bottle of beer is a “heat bomb”, waiting to set the globe ablaze!
So how much CO2 *IS* emitted by German breweries?
Is it more or less than the required plants would have emitted after they died?
David, please stop trolling.
Robertson
http://www.drroyspencer.com/2018/12/2018-6th-warmest-year-globally-of-last-40/#comment-334806
You are so desperately dumb.
The graph I posted for Salvatore shows a comparison of
– GHCN V3 unadjusted (i.e. LAND)
with
– UAH6.0 (LAND)
Trends for 1979-2018
UAH Globe: 0.13 C / decade
UAH LAND: 0.18 C / decade
GHCN V3 unadjusted: 0.22 C / decade
You will never learn, because you do not want to, and thus will keep incompetent ad vitam aeternam.
Fell free to call me an idiot!
I know from where it comes…
binny…”The graph I posted for Salvatore shows a comparison of
GHCN V3 unadjusted (i.e. LAND)
with
UAH6.0 (LAND)”
Then why don’t you make that clear on the graph? Not that it would make much difference, it’s still bs.
.
❶①❶①❶①❶①
❶①❶①❶①❶①
❶①❶①❶①❶①
❶①❶①❶①❶①
.
Christmas is a time when Alarmists gather together, roast chestnuts, and share memories.
– They tell their children how there used to be a cold white substance, called snow.
– They reassure their children that Santa really does exist, and that he delivers presents to all of the good children (the ones who believe in global warming).
– And they give thanks for the 97% consensus (that global warming is real, that it is caused by humans, and that there was no recent slowdown).
In keeping with the true Christmas spirit, Alarmists have just published 2 new papers, which (they say) demonstrate convincingly that the recent slowdown wasnt a real phenomenon.
It is a pity that they didn’t read my article first. They could have saved themselves a lot of time, and millions of dollars (of your money)!!!
The article is called “Alarmist thinking on the recent slowdown is one dimensional”
https://agree-to-disagree.com/alarmist-thinking-on-the-slowdown
Warning – this article contains undeniable proof, that the recent slowdown WAS a real phenomenon.
So if you want to continue believing that the recent slowdown doesn’t exist, then don’t read this article.
Your climatology credentials?
In a few hours, it will snow in Scotland.
https://pics.tinypic.pl/i/00976/j510gxaunbah.png
Relevance??
des, having little substance to offer, has resorted to DA’s tactic of asking stupid questions.
bob…to ren…”Relevance??”
That was a message from ren to me, I’m from Scotland.
Thanks, ren.
Luckily, Accuweather’s and wetteronline’s forecasts are far better than yours.
Five hours after your post I see this:
https://www.wetteronline.de/wetter/schottland
ren’s post has nothing whatsoever to do with climate or climate change.
This is true of ALL ren posts. He just likes to copy and paste.
David, please stop trolling.
bob…”Your climatology credentials?”
Why ask Sheldon for credentials when the head of NASA GISS has a degree in math?
And what is your degree in, Gordon? Soldering? Do you even have a degree in ANYTHING?
David, please stop trolling.
Bobdesbond your forecasts are poor.
Would you please indicate where I made a forecast.
des, if you are going to copy DA, with endless stupid questions, at least learn to use a question mark.
It looks like this “?”. You may have to use the “shift” key in conjunction.
Glad to help.
“Would you” is a request, not a question.
Glad to help.
And, never start a sentence with “and”.
bob…”Would you is a request, not a question.”
Cripey, don’t they teach you any English in Australia?
Nothing terrifies Ger*an more than a question he can’t answer.
David, please stop trolling.
Sheldon: What do the data show from, say, Northern Hemisphere snow cover?
Do you even care?
David, please stop trolling.
Highs attack from the north in Europe. Low remain in the Atlantic.
https://images.tinypic.pl/i/00976/j7gfrejyxvzv.png
How has the last couple of weeks been in the US?
It was warmer because the solar wind was stronger.
https://images.tinypic.pl/i/00976/zebwiijlw70e.gif
So why did you not mention the US, instead cherry picking the isolated anomalously cold areas that must always exist? What prevents you from sharing an unbiased report?
Bobdesbond, please stop trolling.
Another wonderful article from Bob Tisdale for people to read and understand. Boy the differences in temp that humans have to endure every day sure looks difficult compared to that extra 0.5 c they’ve been warning us about recently in the MSM.
Does anyone not understand the stupidity of Gavin Schmidt’s understanding of what we poor humans are capable of enduring? It would be funny if it wasn’t so serious.
https://wattsupwiththat.com/2018/12/24/it-is-the-change-in-temperature-compared-to-what-weve-been-used-to-that-matters-part-3/
Do YOU not understand that it is all simply about humans enduring higher temperatures?
des is now addicted to asking stupid questions.
Maybe he feels such a lame tactic makes up for his inferior knowledge.
Nothing terrifies Ger*an (=JDHuffman) more than questions.
David, please stop trolling.
Neville
I hope you will read this comment
https://wattsupwiththat.com/2018/12/24/it-is-the-change-in-temperature-compared-to-what-weve-been-used-to-that-matters-part-3/#comment-2565664
Moreover, Tisdale, Watts and many other people still did not understand why anomalies are so important:
– they allow to merge data coming from very different temperature measurement sources, as for example urban vs. rural, sea level vs. mountain etc etc
– they allow, if correctly applied, for removal of seasonal dependencies.
And that latter point is the main reason why we can see that winter months often have higher anomalies than summer months.
And since these winter anomalies often are increasing faster and faster, nobody should wonder about anomaly-based charts showing higher trends than the absolute data they were originating from.
Fixating on absolute data just because they show lower trends is a kind of religion. Luckily, Roy Spencer does not belong to this church.
To obtain absolute data from his source is possible, but is really hard work!
binny…”Tisdale, Watts and many other people still did not understand why anomalies are so important:”
Bob Tisdale is so far ahead of you in his understanding of the atmosphere and oceans that you sound like an idiot criticizing him.
Anthony Watts is light years ahead of you in his understand of the UHI effect.
Give it up, if you were in the class of Bob Tisdale you would not be blogging here, boring us to tears with your amateur graphs, while ranting over minor insults.
Bob Tisdale thinks ocean warming comes from El Ninos.
Enough said about Tisdale.
David, please stop trolling.
DA for the umpteenth time co2 does not trap heat!!!!!
For the hundred-and-umpth time, it most certainly does.
And des displays his inferior knowledge.
Here we have the person who makes incorrect grammar corrections beginning a sentence with ‘and’.
The point so often missed in these debates is this: So what if co2 can reflect back (trap) some radiation? Does this then lead to permanent warming? There are so many feedbacks it is very difficult to know. Like a human body, the earth tends toward homeostasis.
So Co2 could (physics) “trap” heat and not have any long term impact on the global average temperature because of feedbacks and lots of stuff even you smart guys hadn’t considered. And since we don’t fully understand all of the causes of natural warming how can we solve the attribution problem?
Perhaps you’d care to show calculations you have made which prove the experts wrong on this matter.
Easy, des.
2 + 2 = 4
It doesn’t take much to show pseudoscience wrong.
swampgator says:
The point so often missed in these debates is this: So what if co2 can reflect back (trap) some radiation?
Trapping heat and reflecting heat are different things. CO2 does the former.
How could additional downward radiation not influence the surface?
So Co2 could (physics) trap heat and not have any long term impact on the global average temperature because of feedbacks and lots of stuff even you smart guys hadnt considered.
Don’t pretend scientists don’t look at feedbacks — it just proves you uneducated.
David, please stop trolling.
bob…”For the hundred-and-umpth time, it most certainly does.”
Have you always been an idiot or has it come on you lately?
Heat is the kinetic energy of atoms. How do you trap atoms with other atoms, unless you use glass, as they do in greenhouses.
Photons, of course, are also heat. How do you think you get a sunburn??
If I leave the top off a bottle of liquid water, the water evaporates. If I screw the cap on, the liquid water is trapped. Yet the cap never touched the liquid water!! Surely that must be Magic!!
Bobdesbond, please stop trolling.
Crakar24
For the umpteen+1st time: H2O and CO2 absorb and reemit terrestrial infrared radiation that otherwise would directly escape to space.
Feel free to think about what that means (others make it simpler, and simply trivially say ‘That is pseudoscience’, good grief).
Bindidon, more than half of the re-emission goes to space. The less than half that reaches the surface may not even be absorbed. That is, it can NOT raise the average surface temperature.
Thinking in terms of “trapping heat”, and “back-radiation heating”, is pseudoscience.
JDHuffman says:
Thinking in terms of trapping heat, and back-radiation heating, is pseudoscience.
How much downwelling IR, in W/m2, does the Earth’s surface receive from the atmosphere?
David, please stop trolling.
JDHuffman
I don’t see any reference to ‘back-radiation heating’ in my comment.
I talk about infrared radiation escape being less efficient than if gases intercepting it were not present.
Manifestly, you can’t get rid of (mis)interpreting people such that you can reply your (unscientific) pseudoscience blah blah.
And your fixation on this blah blah is what brings you to declare Joseph W. Chamberlain’s work be ‘pseudoscience’ as well, AND OF COURSE without bringing any scientifically valuable contradiction.
My guess is: never would you abale to scientifically contradict people like him.
Bindidon, I understand you are not fluent in either English or physics, but unless you have a point to make, you’re just rambling.
JDHuffman says: “Humbug”.
Svante falsely quotes me because, like others, he has nothing of substance to offer.
You must be Scrooge.
Yes Svante. And in my native tongue I would say: “Fadaises!”.
Bindidon, Svante, please stop trolling.
binny…”For the umpteen+1st time: H2O and CO2 absorb and reemit terrestrial infrared radiation”
And for the equally umpteenth time, radiation is NOT heat.
Gordon HAS to lie about this, because even he realizes his denialism makes no sense if he has to admit that radiation is heat.
Basically, all Gordon does here is lie. And the amazing thing is that it doesn’t appear to bother him one bit.
David, please stop trolling.
Crakar24 says:
DA for the umpteenth time co2 does not trap heat!!!!!
Really??
Does CO2 absorb infrared radiation?
Does the Earth’s surface emit it?
David, please stop trolling.
All temperature changes prior to the this last drop that started in year 2016 were NOT due to extremes in solar activity but rather to internal climatic variations of earth which always vary no matter what the state of solar activity is.
The difference this time is a lower range in global temperatures now one can make the case that it is due to very low solar activity and this is why this latest drop in temperatures unlike previous drops can be said to be tied to solar rather then the run of the mill internal climatic variations earth always exhibits.
This is why this latest drop in global temperatures is critical because this time it can be tied to very low solar conditions unlike previous times when solar was not low enough in BOTH degree of magnitude change or duration of time to have a big global temperature effect.
“I will never spin and if I am wrong I will admit it.”
– Salvatore del Prete, April 7, 2011
https://bbickmore.wordpress.com/2011/04/05/roy-spencers-non-response/
David, please stop trolling.
If temperatures do not go to a new lower range in the next few years then I will be wrong.
After numerous identical promises which have now elapsed, do you honestly think anyone believes you will ever admit to being wrong? What happened to your Summer 2018 prediction?
What happened to the global warming since 2016? I am more correct then they are.
If I am early by a year or two so be it. I rather be early then say something after the fact.
I am always going to err on the early side.
Let me make it clear what you said. You stated (paraphrasing) that if UAH did not drop to zero by the end of summer 2018, then you would admit to being wrong.
If it does no happen now- next few years I will be wrong.
Of course, every La Nina you will claim it has started, and when we return to ENSO neutral you will express surprise that the earth is so warm and reset your clock to say “a few more years”. You will NEVER admit to being wrong. I bet you’ve been creaming yourself over every daily rise and fall of global SST, believing that has something to do with climate.
“Dont you realize that, the warming that has now ended, that took place last century was one of the weakess warming periods the earth has undergone ,lets take a time period ,of the last 20,000 years.”
– Salvatore del Prete, April 7, 2011
https://bbickmore.wordpress.com/2011/04/05/roy-spencers-non-response/
Salvatore Del Prete says:
What happened to the global warming since 2016?
Two La Ninas.
(Oceanic) weather. Not climate.
David, please stop trolling.
SDP, I can predict with confidence that you will say the same thing next year.
and the year after that
and the year after….
mickey…”SDP, I can predict with confidence that you will say the same thing next year.
and the year after that
and the year after.”
And like your authority figures at NOAA and GISS, will you lower the confidence levels to get the result you want? NOAA lowered theirs to 48% and were outdone by GISS, who lowered theirs to 38%.
“Let’s see, 2014 was the hottest year ever and it’s 38% likely we’re right”, claimed GISS.
So tell us, Gordon, how would you evaluate the warmest year, given the uncertainties involved?
David, please stop trolling.
Thought I’d post this clip passed on to me for our friends in the snow parts of the planet wanting to build a snowman.
Last Night I had this dream that it Snowed.
At about
8:00 am: I made a snowman.
8:10 – A feminist passed by and asked me why I didn’t make a snow woman.
8:15 – So, I made a snow woman.
8:17 – My feminist neighbor complained about the snow woman’s voluptuous chest saying it objectified snow women everywhere.
8:20 – The gay couple living nearby threw a hissy fit and moaned it could have been two snowmen instead.
8:22 – The transgender man..women…person asked why I didn’t just make one snow person with detachable parts.
8:25 – The vegans at the end of the lane complained about the carrot nose, as veggies are food and not to decorate snow figures with.
8:28 – I was being called a racist because the snow couple is white.
8:30 – I used food coloring to make one of the snow couple a different color and be more racially inclusive.
8:37 – Accused of using a black face on the snowman…snowpersons.
8:39 – The middle eastern gent across the road demanded the snow woman be covered up.
8:40 – The police arrived saying someone had been offended.
8:42 – The feminist neighbor complained again that the broomstick of the snow woman needed to be removed because it depicted women in a domestic role.
8:43 – The council equality officer arrived and threatened me with eviction.
8:45 – TV news crew from ABC showed up. I was asked if I know the difference between snowmen and snow-women? I replied “Snowballs” and am now called a sexist.
9:00 – I was on the news as a suspected terrorist, racist, homophobe, and sensibility offender, bent on stirring up trouble during difficult weather.
9:10 – I was asked if I have any accomplices. My children were taken by social services.
9:29 – Far left protesters offended by everything marched down the street demanding for me to be arrested.
9:45 – The boss called and fired me because of the negative association with work that had been all over social media.
10:00 – I cry into my drink because all I wanted to do was build a snowman…
Moral: There is no moral to this story. It is what this world has become because of a bunch of snowflakes.
Is this what the Chinese call “baizuo?”
Merry Xmas all.
Good one, tonyM.
Society has lost touch with reality.
So you use fiction, and pretend it is real to make a claim about “what this world has become”.
Exactly. It’s like saying, “I had a dream I was a climate denier, yet I kept wanting to kill myself.” Ipso facto, climate deniers are all suicidal.
BDB, DA, please stop trolling.
tonyM…”Moral: There is no moral to this story. It is what this world has become because of a bunch of snowflakes”.
It’s called political-correctness and it’s why I am glad Hillary Clinton and the Democrats lost. Even though I don’t agree with Trump’s social policies, I prefer a world in which people have a sense of humour and don’t get bent out of shape about people expressing an opinion.
Trump has the LEAST sense of humor of anyone on the planet. He seems to spend most of his time angry at someone and the world.
DA, you have the same personality you project onto Trump–no sense of humor, angry all the time….
He he. You’re wrong, but who cares?
David, please stop trolling.
I am trying to recall when I have EVER seen Trump laugh. Not just give a sickening smirk, but physically laugh. I am quite sure it has never happened.
Bobdesbond, please stop trolling.
Tony, let me get this straight — you are trying to blame everyone else for your dreams.
D-R-E-A-M-S.
Freud would not approve. He would ask what your dream says about YOU.
Rev Appell,
Seems like you and a follower of yours had a nasty entanglement with Santa’s reindeer. Hope you can extricate yourselves from the antlers so you will likely feel a lot better and lessen the pain in your butt.
Idiot!
Children will surely be disappointed that there is no snow for Christmas! But I enjoy the mild temperature these days.
And Accuweather’s forecast for January and February is anything but cold.
binny…”Children will surely be disappointed that there is no snow for Christmas!”
I would get po’d as a kid when it snowed at Christmas. It meant our soccer game would be cancelled. As an adult, it’s cool, you don’t have to shovel rain.
Where I grew up it always snowed for Christmas. And usually for Thanksgiving, and often even at Easter.
Sheldon Walker
Your own data shows that “the pause”, if it ever existed, ended in 2011.
Why are you focused on the pause, rather than on the seven years of rapid warming which followed it?
entropic…”Why are you focused on the pause, rather than on the seven years of rapid warming which followed it?”
If there was 7 years of warming why are we currently back at the same level as 7 years ago.
The so-called pause did not end till nearly 2015 then the temperature shot up to a peak in February 2016. Since then, it has been cooling.
Gordon, what about natural fluctuations do you not understand?
Seriously….
David, please stop trolling.
Entropic man,
I am interested in all temperature data, including the rapid warming that followed the recent slowdown.
I am currently concentrating on the recent slowdown, because Alarmists are trying to pretend that it never happened.
As far as I know, everybody accepts that there was rapid warming recently. I don’t need to concentrate on that.
Exactly when the recent slowdown started and ended, depends on how you measure it. In my latest article I measured it using linear regressions over 10 year periods. You can measure it in other ways, and get slightly different results.
If you are interested, there are many articles about the slowdown, on my website. I recommend these ones if you are interested in the slowdown, and when it was:
https://agree-to-disagree.com/how-to-look-for-slowdowns
https://agree-to-disagree.com/how-special-was-the-recent-slowdown
https://agree-to-disagree.com/was-the-slowdown-caused-by-1998
I am always happy to try and answer questions, even the difficult ones. I always try to give an honest answer, but I am not a climate scientist, or even a scientist.
I have a good science education, and I like maths and computing. These are the skills that I use to research, and write my articles.
I forgot to say, all of my analysis is done using Microsoft Excel, an excellent spreadsheet program.
I use it for data analysis, doing linear regressions, drawing graphs, and many other things.
I use VBA (Visual Basic for Applications), which is a macro language that runs in Excel. VBA can access all of the data in the spreadsheet.
To create “Global Warming Contour Maps” (a special type of graph for studying slowdowns, speedups, and the warming rate), I use VBA, and calculate between 150,000 and 350,00 linear regressions for each contour map. The results are colour coded and plotted on a graph.
There are lots of “Global Warming Contour Maps” on my webite. The weather balloon data (RATPAC), has really nice looking colours. Cooling in the stratosphere, not much change in the upper troposphere, and warming in the lower troposhere:
https://agree-to-disagree.com/weather-balloon-data-ratpac
Search for slowdowns:
https://agree-to-disagree.com/how-to-look-for-slowdowns
Study regional warming at different latitudes:
https://agree-to-disagree.com/new-regional-warming
Compare GISTEMP and UAH, northern and southern hemispheres.
https://agree-to-disagree.com/gistemp-and-uah
and much, much, more. And it is all free !!!
If you are looking at the “Global Warming Contour Maps”, I always put the Legend for “Global Warming Contour Maps” at the bottom of the web page. The Legend tells you what warming rates each colour represents.
A warning – “Global Warming Contour Maps” are slightly counterintuitive, and it takes a little time to learn how to read them. But it is worth it, and you can always ask me questions.
====================
Anybody who can use Excel, or a similar spreadsheet program, can check my results, and find out if I am telling the truth.
You dont have to take my word for it.
I’m sorry the pause didn’t exist.
It could have existed.
It did exist for three decades after 1940.
It may exist in the future.
It does not matter because CO2 wins in the long term.
Svante, please stop trolling.
The focus is what does the climate do from 2019-2022 in the contexed of the climate cooling since 2016.
If cooling continues AGW theory is over.
Wrong Salvatore.
Will you EVER be capable of distinguishing between natural influences and manmade one?
Do you REALLY, HONESTLY not understand this?
David, please stop trolling.
On the other hand if the climate warms AGW theory lives on and solar will be in trouble.
Still wrong, Bud.
How is it you can’t distinguish between weather and climate? You get fooled on this year after year after year, yet you never learn.
Weather David is day to day changes.
Climate change is when over a period of time the averages vary from that norm. The time period could be as short as a year or as long as 30 years.
JDHuffman
YOU: “Poor Norman is always trying to claim solar flux adds to IR. But, he links to the Desert Rock graph that indicates solar does NOT add to IR.
As usual, poor Norman can’t understand the links he finds.”
You are always wrong, always making up incorrect declarations.
The graph absolutely demonstrates that IR and solar flux add!
You can deny reality, that is what you cultists do.
I give this one for intelligent people. You will not be able to grasp what you see. You have to have a little physics background and some math. You math skills are not existent. You can’t do simple geometry. It confuses you.
Reality:
https://www.esrl.noaa.gov/gmd/webdata/tmp/surfrad_5c2125136ccac.png
The Desert Rock location.
I can see JDHuffman can add 2 plus 2 but higher numbers are too difficult for this one.
On the graph you can see the UPIR peaks around 700 w/m^2 during the day. The DWIR peaks around 500 W/m^2. The loss is about 200 W/m^2. Without the addition of the DWIR to the solar flux you would end up with about 100 w/m^2 daytime warming instead of the 500 W/m^2.
At night with no solar flux you would lose 500 W/m^2 without the added DWIR.
If you had even a slight mind to think with you could calculate the temperature loss from Earth’s surface with the GHG and then without. Roy Spencer has already done this. The night-time cooling would be 5 times faster than it is with GHG. You are wrong. A drunken baboon. Though I think a baboon has more learning ability than you do.
JDHuffman
Roy Spencer’s calculations would be in agreement with the measured radiative flux values.
http://www.drroyspencer.com/2015/04/why-summer-nighttime-temperatures-dont-fall-below-freezing/
Wrong again, Norman.
The graph shows the addition of the measurements, not the result of the effects adding.
For example, if there are 4 oranges, and 7 tomatoes, then there are 11 items. But, there are still only 4 oranges and 7 tomatoes.
You just can’t understand the basics. Maybe if you spent more time learning, and less time insulting….
Ha. Ger*an thinks photons are fruit. Very poor choice of analogy.
DA is desperate.
Why do you think fruit are a scientifically accurate metaphor for photons?
I have to keep it simple for Norman to understand.
I don’t know how to get it simple enough for you.
JDHuffman
Radiant energy is not different items. It would be more like rocks. You have different sizes of rocks but they are still all rocks. So if you count 10 small rocks, 10 medium rocks and 10 large rocks you end up with 30 rocks. Radiant energy is either absorbed, reflected or transmitted through an object. It it has a high emissivity for a certain band (say IR), it will emit and absorb the same amounts. If it has an emissivity of 0.95 for the IR band, the material will absorb 95% of the energy of the IR energy that strikes its surface. It will also emit 95% of the energy equivalent to a black-body at the same temperature.
Norman, that’s a lot of rambling, just to miss the point.
Radiative fluxes do NOT simply add. If the spectrum is completely different, they do not add at all. Study the Poynting vector, as derived from the eponymous theorem, instead of constantly insulting those that have.
Learn some physics.
Sooooo desperate.
Do different wavelengths of sunlight combine when passed through a convergent lens to heat whatever’s at its focal point?
Stupid question.
DA is resorting to a magnifying glass to “prove” fluxes add.
When that fails, he will bring out a laser beam.
So predictable….
You can’t answer the simple question.
Typical.
It’s always fun to back you into a corner.
DA, don’t let reality catch up to you.
It’s going to be painful.
JDHuffman
It seems this would be a semantic issue. When you say “fluxes don’t add” you could be talking about something different.
At a surface the fluxes are destroyed and converted into internal energy. The energy that was contained in the fluxes adds to the internal energy of the surface that absorbed them. You may be talking about something completely different.
Solar energy in the visible band of EMR is converted into internal energy of the object that absorbed the energy. The same object will also absorb the energy contained in the IR band and convert it to internal energy. Both the solar flux and the DWIR flux are converted into internal energy at the surface.
I am not sure the context you are talking about. I cleared mine up. Clear yours up.
Are you saying the energy contained in the two fluxes does not add when they are destroyed and converted into molecular vibrations?
It does not matter the frequency of EMR. All the EMR it destroys will be converted into internal energy. This energy adds directly based upon the amount contained in the EMR. You can have hundreds of watts/m^2 of IR energy and a fraction of that in visible EMR. The total energy will be simple addition of the energy contained in each flux.
Norman, here’s another of your mistakes: “Solar energy in the visible band of EMR is converted into internal energy of the object that absorbed the energy. The same object will also absorb the energy contained in the IR band and convert it to internal energy.”
At Earth’s surface, that won’t work due to the mismatch of wavelengths.
You need to spend some time studying why some photons are not absorbed.
So, why aren’t some photons absorbed?
What is their sum total energy compared to those that are absorbed?
JDHuffman
I have spent considerable time studying the situation. You offer nothing of value.
You lack knowledge of statistical thermodynamics. Nearly all surface molecules at room temperature are at ground state. That means if any photon reaches a surface molecule in ground state it will be absorbed provided it can cause the molecules to vibrate at a higher vibrational state. In the Earth’s surface 95% of the incoming photons will be absorbed from the entire IR band. Only 5% will be reflected because the surface has no available molecular vibrational states for IR photons of those frequencies. The rest will be absorbed and converted to internal energy.
Here read this:
https://www.chemicool.com/definition/ground-state.html
JDHuffman
Another experiment to prove you are ignorant of any valid physics. Will you do it?
Take two identical plates. Have them suspended in the air so you can fit an IR lamp under one. Have them both in the Sun. Get a temperature probe to measure the temperature of each plate. They will both reach equilibrium absorbing the Solar flux. Now under on with the IR lamp turn the lamp on. It is only generating IR EMR. Lower frequency than the visible light from above. See if the plate with the IR light gets warmer. It will and when it does will you please stop with your stupid posts. They are like reading posts from an arrogant 5 year-old that thinks they know it all. You know so little that it is truly frightening that education creates minds like yours.
Do the experiment or shut up please, you only make a fool of yourself. Other than the crackpot Gordon Robertson, most think you are a drunk baboon who knows nothing. Most are correct in this view. Your posts are really really stupid on any physics level. Some might be funny and amusing but the science sucks!
Norman, room temperature is about 295 K. A 14.7 μ corresponds to a WDL of about 197 K.
And an IR heater puts out a much higher flux than the atmosphere. You are comparing different things, trying to support your failed pseudoscience.
Nothing new.
JDHuffman
YOU: “And an IR heater puts out a much higher flux than the atmosphere. You are comparing different things, trying to support your failed pseudoscience.”
And that matters why? Why would it matter that the IR heater puts out more flux? It is still IR a lower wavelength than visible light.
Will it add?
Also where does this information come from “an IR heater puts out a much higher flux than the atmosphere”?
Look:
https://www.1000bulbs.com/category/br40-r40-heat-reflectors/
The watts the total light emits is less than the atmosphere. Put one of those under you plate. If the plate with the light gets warmer than the other one you are wrong. It really is that simple to test. You won’t do it though. You will not perform any experiment that will prove you wrong. You like unsupported declarations (your pseudoscience). Real science is taboo to you.
Norman, you should read and understand my words, before making a fool of yourself, again.
Here’s what I said: “And an IR heater puts out a much higher flux than the atmosphere. You are comparing different things, trying to support your failed pseudoscience.”
An infrared heater puts out such a high flux you could feel it. It is MUCH above room temperature. The link you provided (another link you don’t understand) specifies the bulb is “incandescent”. That means the wavelengths include NIR, visible, and possibly some UV. Such wavelengths don’t originate in the atmosphere. They come from the Sun.
Learn some physics.
JDHuffman
Ignorant to the last drop of sanity.
You are wrong and I do know so much more physics than you. I will continue to learn more. My physics is not the problem.
So you weasel your way out of proof of your ignorance. You will do this all day and night. Won’t matter you still are wrong and will not do ANY actual experiments. Just more stupid endless unsupported declarations pretending all the while you studied real physics. I can laugh out loud on that one. Neither you nor Gordon Robertson has taken any higher level physics.
So just put a bottle of hot water under the plate. It is emitting only IR far lower frequency than the Sun. See if the plate with the hot water bottle under it gets hotter than the plate with only the ground below. Let me know what you get. You will be proven wrong by real science (your unsupported declarations seem endless). Will you attempt real science or live in denial?
I’m surprised you dropped your infrared heater. Usually you cling to your pseudoscience, somehow hoping to insult your way out of your own web.
But, you still claim you understand the relevant physics, even though you have to invent a new material for your green plate. You make the green plate a combo “black body”/”heat shield”.
Very inventive, but very WRONG. You don’t get to make up your own physics. Sorry.
JDHuffman
Although you don’t have a clue about science, physics or math. You do have skill in diversion tactics. You avoid the central theme of a series of posts diverting it off to some meaningless nonsense and hoping no one will be aware of your diversion.
Your last post has nothing to do with the topic of discussion. You make the false claim that fluxes do not add. I explained how they do and rather than continue with this line of discussion you talk about some unrelated items and pretend you know things. Funny.
So what do you think will happen if you put a hot water bottle under one plate that is exposed to the Sun? Will it warm up, get hotter. You know it could only do that if the two fluxes (solar and IR from the bottle) add to the internal energy of the plate. If the IR does not add to the solar flux, the plate will not warm. So what is it?
Answer the question with zero diversion if you can (unlikely since the answer would prove how little physics knowledge you have, pretending to know things is a lot easier than actually learning them).
Wrong again, Norman. You are the only one diverting.
The mention of the green plate was to point out how you twist physics to match your perverted pseudoscience. That makes any of your “experiments” meaningless.
You have no credibility.
JDHuffman
Another idiot response from a complete moron!
You do not answer a basic question and divert around it and then you post about how you don’t divert from answering a simple question with more diversion. What a complete moron you are. How dumb do people have to be to post on Joseph Postma’s blog?
Dunce says: “Wrong again, Norman. You are the only one diverting.
The mention of the green plate was to point out how you twist physics to match your perverted pseudoscience. That makes any of your experiments meaningless.
You have no credibility.”
What answer to my question did your idiot mind come up with that junk post? Garbage. The drunken baboon gets on the internet!
You divert by saying I am diverting. What a load of crap!
Norman, your question is so poorly constructed, I will have to help.
Start with the green plate, alone in a vacuum. A solar flux of 800 Watts/m^2 impacts one side, and raises the plate to its equilibrium temperature. You are wanting to know if a second flux, say 300 Watts/m^2, is somehow directed to the other side of the plate, will the plate warm above its original equilibrium temperature.
The answer, of course is “no”.
Researching the Poynting vector as you suggested I found this in the Feynnman lectures.
http://www.feynmanlectures.caltech.edu/II_27.html
“a peculiar thing: that when we are charging a capacitor, the energy is not coming down the wires; it is coming in through the edges of the gap. Thats what this theory says!
How can that be? Thats not an easy question, but here is one way of thinking about it. Suppose that we had some charges above and below the capacitor and far away. When the charges are far away, there is a weak but enormously spread-out field that surrounds the capacitor. (See Fig. 274.) Then, as the charges come together, the field gets stronger nearer to the capacitor. So the field energy which is way out moves toward the capacitor and eventually ends up between the plates.”
The field energy, the flux in W/M^2, is emitted by the two charges on either side of the capacitor and both contribute to the energy buildup in the capacitor.
This is an example of two fluxes adding in violation of your belief.
E-man, the fluxes moving across the capacitor would have the same wavelengths.
But, I like your desperation….
JDHuffman
You are making progress. You have got halfway to reality.
You have accepted that fluxes can add if they are of the same wavelength.
Now we need to take you the rest of the way, to acceptance that fluxes of different wavelengths can add.
entropic…”You have accepted that fluxes can add if they are of the same wavelength”.
There are no fluxes per se going ‘through’ a capacitor. A capacitor is a device that stores electrical charges. It is comprised of two metal plates separated by an insulator, called a dielectric.
The only time there will be associated magnetic fluxes is when the current is flowing into the capacitor, or flowing out of it. Static charges do not produce a magnetic field.
When a capacitor is charged, or charging, the electrons/charges try to repel each other. There is an electric field for sure but it’s supplied by the power source or battery. If you remove the battery after the capacitor is charged, the capacitor can act temporarily like a power source (potential), until it charge drains away after a load is applied.
Then it will have an electric field. If you bring two charged capacitors close to each other, the electric field fluxes do not add.
While the capacitor is charged, the charge exerts a force across the dielectric. I would not call that a flux in the same sense as a magnetic flux, or even an electric flux.
I think your concept of fluxes is skewed.
Gauss’s Law deals with an electric flux trough a surface but that is usually not a metal surface or a dielectric in a capacitor.
Okay E-man, show me how a 15 μ photon and a 10 μ photon would add.
I love good humor.
“Single photons stick together: In the right circumstances, two photons can meet and coalesce,” Philippe Grangier, Nature 2002.
https://web.stanford.edu/group/nqp/jv_files/papers/grangier_comment.pdf
PS: This is a standard calculation in quantum electrodynamics that any physics graduate student can do.
DA, you don’t understand your own links. You and Norman must have gone to the same typing school.
http://www.drroyspencer.com/2018/12/2018-6th-warmest-year-globally-of-last-40/#comment-334977
What rule of quantum mechanics prevents
photon + photon -> XX ?
I don’t respond to stupid questions.
If you can’t present a responsible question, learn the relevant physics so you can.
It’s a very GOOD question.
You don’t answer because you can’t.
When they are absorbed by the same surface.
Incorrect answer, E-man.
But, thanks for playing.
entropic…”a peculiar thing: that when we are charging a capacitor, the energy is not coming down the wires; it is coming in through the edges of the gap. Thats what this theory says!”
I have followed Feynman very closely in some of his lectures and I think, at times, he goes out on a limb based on theoretical nonsense. Having said that, I liked Feynman, he could just be a bit weird at times.
If the charges charging the capacitor are not coming down the conductor, then cut the conductor and see what happens. It’s a no brainer, the capacitor stops charging and it will retain its charge, at least for a time.
If you then short the leads, the capacitor will discharge completely.
Sometimes theoretical physicists can be ninnies.
Gordon thinks he gets to judge Feynman. Hilarious.
DA, Gordon is just able to think for himself.
You should try it.
Wow, aren’t you so incredibly convincing!
You’re just as bad as he is.
Coming from you, that makes Gordon and I pretty good.
Another vacuous reply.
David, please stop trolling.
DA…”Gordon thinks he gets to judge Feynman. Hilarious.”
What is really hilarious is your butt-kissing to authority.
I have already indicated I liked Feynman but no one can ever be an authority on every part of physics. He was a theoretical physicist and I have no doubt his unique approach added immensely to the field.
I have worked with capacitors extensively and I know the practical aspects of them. I know that when you cut the leads to a capacitor it stops working, as far as it’s ability to accumulate and discharge charges.
Feynman may have been trying to make an esoteric point about the nature of charges in general but I felt he was wrong to claim the charges that are stored in a capacitor, and their associated fields, did not come down the wire.
He was almost implying that charges exist in space and that somehow they become concentrated on the plates of a capacitor.
Not possible, and I have said so. If that was the case, capacitors sitting around on a bench would acquire charge and you would be able to measure an EMF across them.
You can’t. Unless, of course, someone has charged one via conductors and left it sitting on the bench. A dangerous practice.
But which game are we playing?
I’m playing by seminar rules, or possibly scientific conference bar rules.
What rules are you using?
E-man, you’re the one playing a game. Your game is called “Pseudoscience”, and apparently you believe you get to make up the rules as you go. But you still end up losing.
I’m in reality, and sticking to the laws of physics, facts and logic.
You should try some reality.
The cluelessness of solar/climate interconnections and what I am trying to demonstrate is so apparent by so many of the posters here.
Can not grasp the fact that solar should of had no major impacts for cooling until 2005 and then lag times had to be taken into consideration.
Solar was a net warmer of the climate until 2005.
The very low average solar parameters needed to cause solar to have a more significant climate effect have not been in place that long.
The test is now on and let’s see if year 2019 will make 4 years in a row with cooler global temperatures.
“The very low average solar parameters needed to cause solar to have a more significant climate effect have not been in place that long.”
I’m not convinced that they are there at all.
This is the TSI since 1610 and there is no sign of the significant cooling you keep referring to.
https://spot.colorado.edu/~koppg/TSI/TIM_TSI_Reconstruction.png
For the record, cycle 24 bottomed out at about the same TSI as cycle 23.
Wrong Salvatore. Solar TSI has been slowly decreasing since the 1960s:
https://spot.colorado.edu/~koppg/TSI/TIM_TSI_Reconstruction.png
Salvatore Del Prete says:
The very low average solar parameters needed to cause solar to have a more significant climate effect have not been in place that long.
You said they were 8 years ago:
“Global cooling has started, and it will be here for sometime to come. All the factors that control the climate are now in, or going toward a colder phase.”
– Salvatore del Prete, December 31, 2010
http://www.drroyspencer.com/2010/12/dessler-and-spencer-debate-cloud-feedback/#comment-8257
David, please stop trolling.
That little warming at night and in the winter is urban heat island.
“That little warming at night and in the winter is urban heat island.”
Is that valid for the lower troposphere 5 km above the cities as well?
binny…”That little warming at night and in the winter is urban heat island.
Is that valid for the lower troposphere 5 km above the cities as well?”
Why not, hot air rises? How else would the upper atmosphere be heated? Surely not from the 0.04 percent mass of CO2.
What percentage of the Earth’s surface area is taken up by urban areas?
Is that enough to account for +0.2 C/decade global warming?
NOAA corrects to remove the UHI from their data. Try again.
(and other biases). Great explanation here, which no deniers will dare read:
“Thorough, not thoroughly fabricated: The truth about global temperature data: How thermometer and satellite data is adjusted and why it *must* be done,” Scott K Johnson, Ars Technica 1/21/16.
http://arstechnica.com/science/2016/01/thorough-not-thoroughly-fabricated-the-truth-about-global-temperature-data/
“Understanding Adjustments to Temperature Data,” BEST
http://berkeleyearth.org/understanding-adjustments-temperature-data/
“Understanding Time of Observation Bias,” Zeke Hausfather, 2/22/15.
https://judithcurry.com/2015/02/22/understanding-time-of-observation-bias/
PS: Adjustments *REDUCE* the long-term warming trend.
David, please stop trolling.
Ed Caryl says:
“That little warming at night and in the winter is urban heat island.”
Now a more serious answer.
1. How many urban heat islands do exist in your mind in comparison with rural cool corners, if you except CONUS and Europe?
2. I would understand you if temperature records were constrcuted as many people imagine (some geniusses here included), namely such that exceeding temperatures coming from these UHIs would simply added to thoese coming from ‘normal’ stations’.
This is not at all the case.
2a. All data measured by stations first are checked against local, known station biases and corrected for these biases.
2b. For all stations, anomalies wrt a given reference period first are computed and then are merged into grid cells, out of which latitude bands are computed. In a last step, latitude weighting is applied to the latitude bands.
That way, you can merge and average in one and the same grid cell anomalies originating from stations whose absolute temperatures are so different that their averaging would make no sense.
This is necessary not only wrt the UHI problem. How else could you megr the results of stations located near the sea with those located at 1500 m altitude?
JDHuffman says:
…show me how a 15 μ photon and a 10 μ photon would add.
Single photons stick together: In the right circumstances, two photons can meet and coalesce
Philippe Grangier
Nature 2002
https://web.stanford.edu/group/nqp/jv_files/papers/grangier_comment.pdf
DA presents another paper he doesn’t understand.
Without an understanding of the relevant physics, he doesn’t know that photons with different wavelengths would have different frequencies. Which means they do not simply add, as his paper indicates: “Photons are characterized by several physical properties, such as their frequency and polarization…”
DA, learn some physics.
Every 1st year graduate student in physics learns the Feynman diagram rules to calculate photon+photon scattering and coalescence.
It obviously works for incoming photons of different frequencies.
What rule of quantum mechanics disallows it?
No DA, it doesn’t work for differing wavelenths.
But you are welcome to show how you add a 10 μ photon to a 15 μ photon.
Clown humor is always entertaining.
What rule of quantum mechanics disallows it?
JDHuffman says:
No DA, it doesnt work for differing wavelenths.
Why not?
What physics, specifically, says it doesn’t happen?
You seem unable to unanswer this question.
David, please stop trolling.
DA…”Single photons stick together: In the right circumstances, two photons can meet and coalesce…
Philippe Grangier”
I think Grangier has gotten himself a bit too caught up in theory.
For one, no one has ever seen a photon or measured one directly. Even Einstein claimed he had no idea whether they exist or not.
If a photon is an EM emission from an electron, why should it join with another one? What mechanism is in place with an EM wave, made up of an electric field perpendicular to a magnetic field, to make them join?
A far more likely explanation for me is the bazillions of electrons emit EM quanta at the same time and the quanta form a continuous wave front. They are indistinguishable.
Gordon Robertson says:
For one, no one has ever seen a photon or measured one directly.
Gordon, you’re an laughable ignorant idiot.
And you seem happy to be so!
Gordon Robertson says:
If a photon is an EM emission from an electron….
It can be but usually isn’t, dingus.
David, please stop trolling.
Time is telling we shall see.
SdP, you’ve been wrong for over 8 years.
Why hasn’t time told by now?
No David and my web-site proves it. I stated strict solar criteria is needed to result in global cooling from the sun. I had requirements. Those requirements have never kicked in until recently.
Don’t lie, Salvadore — it’s too easy to catch you in them.
“Global cooling has started, and it will be here for sometime to come. All the factors that control the climate are now in, or going toward a colder phase.”
– Salvatore del Prete, December 31, 2010
http://www.drroyspencer.com/2010/12/dessler-and-spencer-debate-cloud-feedback/#comment-8257
(Emphasis mine.)
David, please stop trolling.
Actually, Salvatore, you’ve been wrong for 16 years.
Why doesn’t this make you rethink and reevaluate your position?
“Your conclusions are in a word wrong, and that will be proven over the coming years, as the temperatures of earth will start a more significant decline (which started in year 2002 by the way)….”
Salvatore del Prete, “Reply to article: IC Joanna Haigh – Declining solar activity linked to recent warming,” 10/8/2010
http://climaterealists.com/index.php?id=6428
David, please stop trolling.
“Worldwide, fossil fuel use is projected to pump 2.7 percent more CO2 into the atmosphere in 2018 compared with 2017.”
https://www.sciencenews.org/article/global-carbon-dioxide-emissions-will-hit-record-high-2018
— Global carbon emissions are set to hit an all-time high in 2018 — according to researchers at the University of East Anglia and the Global Carbon Project.A projected rise of more than 2 per cent has been driven by a solid growth in coal use for the second year in a row, and sustained growth in oil and gas use. Credit: Global Carbon Project —
https://phys.org/news/2018-12-strong-growth-global-co2-emissions.html#jCp
gbaikie…”Worldwide, fossil fuel use is projected to pump 2.7 percent more CO2 into the atmosphere in 2018 compared with 2017.”
2.7% of nothing is still nothing. Compared to the immensity of the atmosphere, which is 99.96 times the mass of CO2, our contribution is less than tiny.
We will run out of oil long before atmospheric CO2 becomes an issue.
Gordon, let’s see your calculation for the radiative effect of atmospheric CO2.
Just kidding, Gordon! You couldn’t even start such a calculation if your life depended on it.
David, please stop trolling.
Will year 2019 make 4 years in a row of global cooling?
“…here is my prediction for climate going forward, this decade will be the decade of cooling.”
– Salvatore del Prete, 11/23/2010
http://ourchangingclimate.wordpress.com/2010/10/20/andrew-dessler-debating-richard-lindzen/#comment-8875
David, please stop trolling.
An interesting point concerning CO2 emissions worldwide is that one of the greatest emitters never is considered, because it is not… a country.
I remember to have read ten years ago that the civil aviation needed at that time worldwide about 1 billion liters of kerosene… per day.
The conbustion of a liter of kerosene generates 2.76 kg CO2.
That would mean that the civil aviation generates worldwide 1 billion tons of CO2 per year, what would place it at position 6 in the list of the greatest emitters, between Japan and Germany.
“On average, U.S. refineries produce, from a 42-gallon barrel of crude oil, about 20 to 19 gallons of motor gasoline, 12 gallons of distillate fuel distillate fuel, most of which is sold as diesel fuel, and 4 gallons of jet fuel.”
https://www.eia.gov/energyexplained/index.php?page=oil_refining
By Woodrow Bellamy III | August 24, 2018
“According to the U.S. Bureau of Transportation Statistics, spending on kerosene-based aviation fuel by U.S. passenger airlines collectively fell by $16.5 billion between 2014 and 2015. In 2015, the cost of jet fuel dropped to $1.53 per gallon, compared to the average of $2.92 per gallon between 2011 and 2014.”
https://www.aviationtoday.com/2018/08/24/airlines-adjusting-higher-jet-fuel-prices/
In terms of spot prices it’s currently about $1.80 but in terms price paid for corporate jet or small planes it’s more than double this price. So wholesale vs retail.
https://www.iata.org/publications/economics/fuel-monitor/Pages/index.aspx
And:
http://www.100ll.com/
[if you going to an airport in the US and paying for it].
If used kerosene for rocket [or buying a lot of it] I guess it’s somewhere between airport retail and price airlines paid for it.
Btw, as looking at it recently, SpaceX launched 20 rockets this year- which includes the first Heavy Falcon launch that sent Musk’s car into a Mars trajectory.
Why this reply? It has not anything to do with what I wrote, Robertson II.
binny…”Why this reply? It has not anything to do with what I wrote, Robertson II”.
You’re an idiot, even on Christmas Day.
gbaikie was being informative, who cares what you think of it.
As usual: insult instead of intelligible thoughts, even on Christmas Day.
Bindidon, please stop trolling.
I would guess that pipelines are used to transport jet fuel to say LAX. It’s close to a couple refineries. And imagine it should common way to do it for all major airports.
Checked, yup:
https://www.internationalairportreview.com/article/1871/the-jet-fuel-infrastructure-crisis/
“Jet fuel is difficult to transport because it cannot tolerate even minute quantities of contaminants. Therefore pipelines cannot add even tiny quantities of drag reducer to jet fuel that permit the pipeline to increase the amount of jet fuel that can be shipped
…
The result of all these quality issues is that jet fuel is problematic for the pipelines and subsequently we have seen a rise in the number of contamination issues. For example last year OHare Airport was within six days of running short of fuel, as most of the shipments on the Texas Eastern Pipeline from the U.S. Gulf were held up until a source of contamination that was pushing the thermo-stability of the fuel off-spec could be found and dealt with.”
gbaikie…”I would guess that pipelines are used to transport jet fuel to say LAX”.
There’s a pipeline carry jet fuel under Vancouver, from north to south. I worked on the pumping system at the airport.
A 737 carries 26,000+ litres while a 747 carries over 180,000 litres. I was watching a guy filling a fuel tanker at the airport filling station and the meter seemed to be ticking over pretty slowly. I commented that it would take a while to fill the tanker to its 50,000 litre capacity and he pointed out the meter was reading in 1000 litre steps, not 1 litre steps.
Robertson
“Bob Tisdale is so far ahead of you in his understanding of the atmosphere and oceans that you sound like an idiot criticizing him.
Anthony Watts is light years ahead of you in his understand of the UHI effect.
Give it up, if you were in the class of Bob Tisdale you would not be blogging here, boring us to tears with your amateur graphs, while ranting over minor insults.”
*
1. I never criticized Tisdale concerning his knowledge about atmospheric and oceanic processes.
2. But… like you, Robertson, neither Tisdale or a fortiori Watts did ever understand how anomaly-based time series manage to adequately solve the UHI problem.
I told that in Roy Spencer’s threads before, but you are absolutely unable to understand it.
The only little job Watts has ever been able to do concerning UHI was to collect pictures of UHI suspected stations.
Together with Souleymane Fall and (surprisingly) John Christy, he published in 2011 a paper concerning the UHI problem in CONUS, which soon was completely debunked by Berkeley Earth (Judith Curry was a coauthor).
Look at his ‘surfacestations.org’ and his second paper in preparation since… 2012. This is simply a dead project, a blind alley.
Stop writing about that, Robertson. You only show the degree of your incompetence.
Feel free to call me an idiot, Robertson! I know where it comes from.
binny…”But like you, Robertson, neither Tisdale or a fortiori Watts did ever understand how anomaly-based time series manage to adequately solve the UHI problem”.
You’re still at it. You are claiming an idiot like you is right and both Bob Tisdale and Anthony Watts are wrong. Has it ever occurred to your arrogant mind that you are wrong?
Why should layman Bindidon be wrong?
The problem with people like you, Robertson, is that you are arrogant enough to place people like Tisdale and Watts above people like Berkeley Earth or Nick Stokes.
That is inimaginably arrogant.
binny…”The problem with people like you, Robertson, is that you are arrogant enough to place people like Tisdale and Watts above people like Berkeley Earth or Nick Stokes”.
Berkeley Earth, no way. Fudge artists extraordinaire.
Who is Nick Stokes?
Googled him.
A statement from Stokes, “Since surface temperature changes are correlated over distances of about 1000 km (it does depend somewhat on the latitude of the stations), it turns that you only need about 60 stations to produce a reasonable surface temperature dataset”.
Do all you idiots hang out together? Where I live in Vancouver, you only have to go a hundred miles or less to get a significant surface temperature change. Within 150 miles there are winter lows 20C less than the coast and summer highs 15C to 20C above the coast.
Stokes is describing how NOAA correlates temperatures, after they have slashed the surface temperature stations from 6000 globally to less than 1500.
These people are no longer scientists, they are data manipulating alarmists. People like Stokes, who promote their propaganda, are just as bad.
Gordon Robertson says:
A statement from Stokes, “Since surface temperature changes are correlated over distances of about 1000 km (it does depend somewhat on the latitude of the stations), it turns that you only need about 60 stations to produce a reasonable surface temperature dataset”.
Do all you idiots hang out together? Where I live in Vancouver, you only have to go a hundred miles or less to get a significant surface temperature change….
He he — Gordon thinks correlation means equal.
David, please stop trolling.
As usual: divert, discredit, denigrate, insult and lie.
That is all Robertson is able to do.
Bindidon, please stop trolling.
We will know in the very near future which thoughts and theories about the climate are most correct.
You said the same almost a decade ago.
“Your study, the CO2 man made global warming hoax, don’t mean anything because in the next few years we will know ,who is right and who is wrong.
“I will be proven correct along with many in my camp that predict this will be the decade of global cooling and a large part of that cooling will be due to LOW solar activity. Mark my words.”
– Salvatore del Prete, Reply to article: IC Joanna Haigh – Declining solar activity linked to recent warming, 10/8/2010
– http://climaterealists.com/index.php?id=6428
Wow! I did’nt realize that SDP fas been wrong for 16 YEARS in a row.
As DA excellently documented:
Your conclusions are in a word wrong, and that will be proven over the coming years, as the temperatures of earth will start a more significant decline (which started in year 2002 by the way).
How often does one need to be proved wrong in order to ditch their theory?
How much egg on face does can one person wear?
David, Myki, please stop trolling.
Very low temperatures in Asia and Canada.
https://pics.tinypic.pl/i/00976/a499v9kgl7m4.png
https://pics.tinypic.pl/i/00976/a2qijowe1g4z.png
This picture shows it far better:
https://climatereanalyzer.org/wx_frames/gfs/ds/gfs_world-ced_t2anom_1-day.png
What happens in the Eastern Pacific?
https://www.tropicaltidbits.com/analysis/ocean/cdas-sflux_ssta7diff_global_1.png
Willis checks their claims about future rainfall and again the modelling is shown to be just more BS.
I’ve also shown why Australia overall is a much wetter place since 1969 to 2017.
https://wattsupwiththat.com/2018/12/25/the-dryer-gets-wetter/#comment-2566902
Here’s my comment to Willis.
“Willis just a note about SE Australia. From 1992 to 2009 the IOD was locked into the positive phase and reduced rainfall to a line south of Broome W. Aust to south of Sydney. See IOD link below.
But Australia overall is much wetter after about 1969 see BOM anomaly link 1900 to 2017. But 1895 to 1902 was a very bad drought so that is 1895 to 1969 for much drier Aust conditions.
Here is the study announcing the discovery of the IOD in 2009. This shows up in a SE state like Victoria but is not visible in Aust graph at BOM link below”.
http://www.science.unsw.edu.au/news/indian-ocean-causes-big-dry-drought-mystery-solved
Here’s the BOM link for Aust rainfall. http://www.bom.gov.au/cgi-bin/climate/change/timeseries.cgi?graph=rranom&area=aus&season=0112&ave_yr=8
Thanks Neville, interesting info, even for me ‘up over’…
But…
http://www.bom.gov.au/cgi-bin/climate/change/timeseries.cgi?graph=rranom&area=seaus&season=0112&ave_yr=8
Bindidon, that’s exactly my point and why I noted SE Aust and Victoria.
But Overall Aust receives much higher rainfall and SE and Vic and SW WA have recently received less rainfall. But as I noted the positive IOD is the reason for this see my other link to Uni NSW study.
But some rather silly people thought it MUST have been Co2, until the IOD was discovered in 2009.
I hope you understand this now?
Neville
I hope in turn that despite many trials made by some commenters manifestly interested in doing that, you understand that I do not share any CO2-mania.
CO2 has some influence on climate, OK.
But people trying to explain everything with CO2 are as sick as those who completely deny its influence.
Who, specially, blames everything on CO2?
PS: But humans do account for all the the observed warming — and a little more.
David, please stop trolling.
Some geniuses here still don’t understand the influence of the choice for a given reference period (baseline) to calculate temperature anomalies.
Maybe this helps:
https://climatereanalyzer.org/wx/DailySummary/images/GISS_land+ocean_1880-2014.png
but I still have some little doubt…
Does this?
https://drive.google.com/file/d/1a36CaZqdv9vQak5Rx4UplRIFum4YuKBS/view
what leads to this
https://drive.google.com/file/d/1bWUVAYII5NANG9Na4atzYEAJgTsZXa-W/view
when the plots for 1951-1980, 1961-1990, 1971-2000 are shifted to one and the same baseline (UAH’s 1981-2010).
Since our Earth is warming a tiny bit since decades, it should be after all evident that calculating anomalies wrt 1981-2010 automatically leads to anomalies lower than those calculated wrt 1971-2000, and a fortiori for the two earlier ones…
The trend and amount of warming is independent of the choice of baseline.
Here again, Mr Appell shows that the is a specialist in writing redundant comments.
You are as totally fixated on your boring warming-mania as is Robertson in his need to discredit and denigrate.
Appell + Robertson = zero.
Not my problem if you can’t deal with the science. Go bitch elsewhere.
David, please stop trolling.
binny…”what leads to this
https://drive.google.com/file/d/1bWUVAYII5NANG9Na4atzYEAJgTsZXa-W/view
when the plots for 1951-1980, 1961-1990, 1971-2000 are shifted to one and the same baseline (UAHs 1981-2010)”.
*****
How do you shift baselines based on real temperatures that differ so they can be represented by a common baseline? Only one way, through the use of fudged statistics.
You are so badly misinformed words fail to describe how badly.
Besides, the GHCN record is so seriously fudged to show fake warming it could not possibly corresponds to the UAH record. How you manipulated the data to get it to fit is the question.
I have posted links to the actual NOAA graphs and the UAH graphs, and they look nothing alike.
Robertson
As usual, even on a Christmas day: you show nothing else than
– technical incompetence;
– the psychotic, perverse need to discredit, denigrate, and lie.
You show every time that you don not understand what a baseline is.
The last example of your absolute lack of understanding was here:
http://ocean.dmi.dk/arctic/plots/meanTarchive/meanT_2018.png
Look again at your incredibly stupid reaction:
“What’s your point? The average is still well below 0C for the year and barely exceeds 0C at any time of the year.”
I’m sure you still don’t understand the point, namely that the average indeed is in the graphic, but it is not where you think it is…
*
Nothing in GHCN is fudged, Robertson!
And I do not manipulate anything.
You want it to be fudged, but you are absolutely unable to prove it.
You want to show me here as a manipulator, but you are absolutely unable to prove it.
The dishonesty therefore is on your side. And discrediting the work of others all the time makes you evry time a bit more dishonest.
binny…”You show every time that you don not understand what a baseline is.
The last example of your absolute lack of understanding was here:”
I have already pointed you to the definition of a baseline by your gods at NOAA. I would post it again but in a childish fit of pique, NOAA has shut down its site to get back at Trump for shutting down the government.
Why does NOAA have to shutdown its site? Only one reason, it is a political move to hit back at Trump, concrete evidence that NOAA is politically motivated with no interest in science.
Anyway, a baseline is obvious to everyone but you, it seems. As NOAA defined it, the baseline is the temperature average over a range against which deviations, or anomalies, are measured. Anomalies below the baseline are colder than the average and those above are warmer than the average.
When you compare an average from 1950 – 1990, for example, with the UAH average from 1980 – 2010, you are ignoring the actual physical weather from which each set was derived.
It’s like comparing apples and oranges, but I understand statisticians don’t care about trivialities like reality. They are interested only in crunching numbers, thinking the numbers mean something without the reality from which the data was derived.
Robertson
You try to teach me about what YOU (!) don’t understand, because you don’t want to learn.
I know what anomalies are, Robertson. I compute them out of various absolute time series since now five years.
You in turn did never compute anything the like, and that is your problem. ‘Learning by doing’ is completely unknown to you in this domain.
And that, Robertson, is the reason why you did not understand the relation between
https://drive.google.com/file/d/1a36CaZqdv9vQak5Rx4UplRIFum4YuKBS/view
and
https://drive.google.com/file/d/1bWUVAYII5NANG9Na4atzYEAJgTsZXa-W/view
In both graphs, you see four plots generated out of the same set of, in the sum, nearly 36000 GHCN (daily) stations.
The difference between the four is that different stations subsets out of the complete set can’t supply the data necessary to construct the anomalies wrt the respective reference periods, and therefore are eliminated.
Nevertheless, the four subsets satisfying the requests for 1951-1980, 1961-1990, 1971-2000 and 1981-2010 share about 14000 stations: what they share thus is more than in what they differ (between 5000 and 8000).
And that, Robertson, is the reason why
– the four plots in the first graph show so similar;
– they are so near to each other when the first three are displaced by their offset wrt the mean of the fourth.
*
Do you remember RSS’ revision 3.3, Robertson? It iwas the one which was so similar to UAH’s revisions 5.5 and 6.0.
But while Roy Spencer switched 6 years ago from UAH’s earlier reference period (1979-1998) to the actual one, RSS kept this older variant up to now.
The consequence is that if you compare UAH6.0 and RSS3.3, you don’t see immediately how similar they are, because the difference between their reference periods is about 0.13 C: that is a lot.
But when you shift the RSS3.3 time series by this offset, you suddenly see how similar the two time series are IN REALITY.
But this you will, I am sure, either silently ignore or loudly discredit – comme toujours, n’est-ce pas, Robertson?
Gordon Robertson says:
When you compare an average from 1950 1990, for example, with the UAH average from 1980 2010, you are ignoring the actual physical weather from which each set was derived.
Its like comparing apples and oranges
Gordon, every day you come here and say something so idiotic my jaw drops. Truly, it is a fantastic achievement.
You understand nothing but go around here like you’re King of the world. I hope some psychologists are studying you — what waste of opportunity if not.
David, please stop trolling.
WeatherBELL: where is Dr Ryan Maue? I can’t see him anymore.
https://www.weather-bell.com/
Gordon Robertson
I do owe you an apology. For a long time I thought you were the dumbest poster on this blog.
I think JDHuffman exceeds your level of ignorance. I do not think you could find a dumber poster on a science blog than this empty head. I think you try to be as dumb as him and work to make up a bunch of crap but I don’t think you have the ability. You are still very dumb and your posts are irrational nonsense but you are not down to JDHuffman. Keep making up stuff and hopefully you can get as dumb as he is.
norman….”Gordon Robertson
I do owe you an apology. For a long time I thought you were the dumbest poster on this blog.
I think JDHuffman exceeds your level of ignorance”.
Don’t you think it just a bit odd, that you believe heat can be transferred from a cold region to a warm region without compensation, that you believe molecules can emit EM independently of electrons, that molecules are not aggregations of electrons and their nucleii, and that the Moon rotates on it’s axis, yet you think two posters who can stand their ground with any poster are the dumbest posters on the blog?
Talk about sour grapes over being proved wrong, time and again.
Remember, Tesla agreed with JD and myself on the Moon’s rotation.
Poor Norman, he lives in a fantasy world. He can’t “talk science”. All he can do is attack others. But, he thinks he is doing the opposite!!
“It is the one thing I hate about the climate science issue. It is being destroyed by politics and tribal thought process. I want to stick only to the science of the issue.
http://www.drroyspencer.com/2018/10/florida-major-hurricane-strikes-still-no-trend/#comment-324504
JDHuffman
The Dork shows his lack of reading comprehension once again.
Yes I say I want to stick to the science. It is your idiotic comments that prevent this. If you were rational, logical and had any clue of what you were saying I would be most welcome in keeping the discussion on science. You are a complete dork that doesn’t understand math or science. It is not possible to stick to science with you.
Poor Norman, he tries to live in his fantasy world: “I want to stick only to the science of the issue.”
But reality always frustrates him.
Nothing new.
Gordon Robertson
I might take back my apology. You really are one stupid person.
I think I have told you many times that I DO NOT BELIEVE HEAT can be transferred from a cold region to a warm region. You are a blithering idiot when I tell you several times I do not use HEAT. Over and over you say HEAT and it correct you and say energy. I show you many links where it is established science that energy transfer is a two way process. Quit being such a complete idiot. Not fun to communicate with someone who is so dense!
You are a complete idiot on the IR emission. My claim is that electron transitions (changing energy states) ARE not the cause the of Mid-IR. I never claimed the charge of electrons was not involved. Why are you so incredibly stupid?
When did I claim that molecules were not composed of electrons and protons? That is a really stupid point you make.
Yes the Moon rotates on its axis. Have you found any Astronomer that accepts your delusional BS? If you do let me know. Only extreme idiots like you and dork JDHuffman come up with unsupported crap!
Norman asks: “Have you found any Astronomer that accepts your delusional BS?”
Norman, what you fail to realize is astronomy is a very “soft” science. Just look at some of the nonsense: black holes, Big Bang, Drake equation, CMBR is from Big Bang, worm holes, Hubble equation, extraterrestrial life, the list goes on and on. Astronomy is probably the biggest source of pseudoscience .
I don’t know for sure but I suspect the Moon rotating nonsense is linked to the inability to explain how the Moon got where it is. There is no explanation that works. And some kind of impact with Earth would require an axial rotation. But, there is no axial rotation. So then they had to make up the “tidal locking” nonsense.
Don’t expect much reality from astronomy. It will just frustrate you.
JDHuffman
Why exactly do you believe those items in your list are nonsense? What evidence do you offer to counter those theories? They are not established fact, they are theories and Astronomers seek observational evidence for them.
With Big Bang they found the spectra from distant stars was shifted toward the Red End. They were looking for explanations for this observation. They knew that sound waves changed frequency from a moving source. If it was approaching the pitch went up, if moving away the pitch was lower. From some actual physics of waves they postulated that the Galaxies were moving away. In order for mass to move away it was suggested the Universe begin with a Bang.
What counter argument do you provide to explain the actual empirical data collected?
Tidal Locking is not nonsense at all. Most moons in the solar system are tidally locked.
HERE: “Most major moons in the Solar System − the gravitationally rounded satellites − are tidally locked with their primaries, because they orbit very closely and tidal force increases rapidly (as a cubic function) with decreasing distance.[15] Notable exceptions are the irregular outer satellites of the gas giants, which orbit much farther away than the large well-known moons.”
https://en.wikipedia.org/wiki/Tidal_locking
Norman, you must have sobered up from yesterday. Obviously you’re ignoring all of your juvenile insults.
You’re back with the “stupid questions tactic” that you learned from DA. That tactic doesn’t work for him, and is not likely to work for you.
You don’t have a meaningful background in physics, so you gravitate to pseudoscience. And you keep providing the same links that you can’t understand.
Nothing new.
Astrophysics is not a “soft” science. And Postma throws these clown non-rotaters under the bus. Totally hilarious. And they still come back just to make themselves look more stupid.
And poor Gordon STILL cannot understand the simple concept of “translation”. He thinks “curvilinear motion” and “curvilinear translation” are the same thing. So he invents his own definitions that conform to his delusions.
That’s what happens when rank amateurs attempt to dabble in physics. Total disaster.
The anonymous clown that keeps changing his name is back!
He wants to compete with Norman for “Pseudoscience Clown” of this article posting.
He’s far behind, but best of luck to both.
Hi, Norman.
I see you are still trying to sort out the Desert Rock DWIR data. Here are references to older posts where I debated Dr. Spencer and others on the significance of DWIR.
http://www.drroyspencer.com/2016/08/observational-evidence-of-the-greenhouse-effect-at-desert-rock-nevada/#comment-221341
http://www.drroyspencer.com/2016/08/simple-time-dependent-model-of-the-atmospheric-greenhouse-effect/#comment-222863
I don’t think we engaged at that time, but we did several days ago on another post on the same topic.
You wrote earlier above that without the 500 W/m2 DWIR, the Desert Rock surface would only receive 100 W/m2 during the day and loose 500 W/m2 during the night. I have to ask where the 500 W/m2 DWIR comes from in the first place if it only receives an average of 200 W/m2 or so a day?
That should be “where does the 500 W/m2 DWIR comes from in the first place if the Desert Rock surface only receives an average of 200 W/m2 or so a day?”
Chic Bowdrie.
If you think about it, the energy from the surface is plenty to sustain the 400 or 500 DWIR from the atmosphere.
The surface is losing a net of 100 w/m^2 at night and 200 w/m^2 during the say at Desert Rock on a summer day (no clouds).
It only needs this much to maintain this state. The solar input is in excess of the loss and other heat transfer mechanisms act to remove the remaining energy.
I have thought about it and I’m shocked that you agree with me.
“The surface is losing a net of 100 w/m^2 at night and 200 w/m^2 during the say at Desert Rock on a summer day (no clouds).”
That is only the night and day IR components. The 200 W/m2 daytime loss is more than compensated for by solar insolation. I think that is the gist of your last sentence.
Now I think we can move on and find other points of agreement.
chic…”I have to ask where the 500 W/m2 DWIR comes from in the first place if it only receives an average of 200 W/m2 or so a day?”
It’s a fictitious DWIR created by Trenberth and Kiehle in their energy budget fantasy. Obviously, T&K know nothing about the 2nd law and have based their analysis on creating phantom IR to balance an equation.
Neither have considered that maybe the atmosphere operates in a different manner to what they have proposed.
It was a question for Norman. But since your response denies the existence of DWIR, I have to ask you what is the signal those instruments are recording that registers 500 downward somethings?
Don’t you realize that there is always more upward somethings for every downward something?
It’s possible the atmosphere operates in a different manner than what you imagine, too.
Merci / thanks.
chic…”It was a question for Norman. But since your response denies the existence of DWIR, I have to ask you what is the signal those instruments are recording that registers 500 downward somethings?”
I did not deny DWIR, I denied the extent of it. DWIR is an ingenuous term. It includes the pitifully small IR from CO2 and the portion of the solar spectrum in the IR spectrum.
There is no way that CO2 is back-radiating IR in the 500 W/m^2 range. Norman has a way of latching onto remote graphs and interpreting them in his myopic manner.
Any IR from the atmosphere can have no effect on surface warming for the simple reason it comes from a cooler source. IR from the Sun is another matter and it is not back-radiation.
IOW, DWIR is not fictitious so stop saying it is.
Your interpretation of IR from the atmosphere is just another unsupported vacuous opinion until you have some data that to make it factual. My opinions about are without empirical support too, but I’m still waiting for someone to explain why and convince me I’m not right.
Gordon Robertson says:
Any IR from the atmosphere can have no effect on surface warming for the simple reason it comes from a cooler source.
People who misunderstand and then deny basic science should have to go without all the immense benefits that science allows them.
DA, you wouldn’t last 24 hours without the benefits from REAL science.
chic…”Your interpretation of IR from the atmosphere is just another unsupported vacuous opinion until you have some data that to make it factual. My opinions about are without empirical support too, but Im still waiting for someone to explain why and convince me Im not right”.
My so-called vacuous opinion is based on solid thermodynamics and the Ideal Gas Law.
The 2nd law, as stated in words, by its inventor, Rudolf Clausius, is more or less verbatim: Heat can NEVER be transferred by its own means from a colder body to a warmer body. He emphasized in a later chapter of his book, The Mechanical Theory of Heat, that the 2nd law as such applies equally to radiation.
There are alarmists here who have disputed that version even though those words, in almost the exact wording, are available in his book.
Clausius took the time to explain what he meant by the phrase ‘by its own means’. He explained that in order for heat to be transferred from cold to hot a form of external compensation is required. During that explanation of compensation he referred to heat being transferred from a colder region to a warmer region at the same time heat is transferred in the opposite direction.
He was talking about how heat ‘can’ be transferred both ways as we do in the modern fridge or air conditioner, not as a general principle.
That reference to a two way transfer was jumped on and cherry-picked by alarmists desperate to explain how a colder atmosphere can warm a cooler surface that supplied the radiation to warm the 1% of the atmosphere that will absorb IR.
If you think heat can be transferred from an atmosphere that ranges from being in thermal equilibrium with the surface to cooler than the surface then prove it. All I have heard thus far from alarmists like Norman, is mumbo jumbo about a two way transfer of IR, which applies only at thermal equilibrium. Norman has liberally interpreted equations applying to thermal equilibrium from a text book in his own way.
Norman presumes, based on his faulty interpretation of Kircheoff and Stefan-Boltzmann, that since IR can be transferred both ways at thermal equilibrium, then there must be a ‘net heat transfer’ outside of TE.
In fact, a mysterious ‘net energy transfer’ is the basis of the notion that GHGs, making up roughly 1% of the atmosphere, can not only raise the temperature of the rest of the atmosphere (the mysterious thermalization), it can back-radiate energy to raise the surface temperature beyond the temperature it is heated by solar energy.
You cannot dabble in fantasies like a net energy transfer and do real science at the same time. The reason is simple, there is no generic ‘energy’ to apply. You are dealing with thermal energy, aka heat, and electromagnetic energy. They are vastly different forms of energy and you cannot add them to get a net energy unless you convert both to their mechanical energy equivalent in watts, horsepower, etc., then add them to get a net.
If you know of a way to convert EM to an equivalent mechanical energy DIRECTLY, as in work, I’d be very interested in your explanation. EM is not capable of doing work in the same way as heat can do work.
There is a direct conversion between heat in calories and work in joules, thanks to the scientist Joule. No such conversion exists for EM for the simple reason that EM has essentially no substance with which it can act on a mass to do work.
EM can operate indirectly when it is absorbed by mass. It can be converted to heat and the heat can do work. Or it can be converted to electrical energy where the electrical energy does work. In either case, the work is done by different forms of energy than the EM, suggesting very strongly that EM CANNOT be added to heat to get a net energy balance.
There is just no way that EM, as IR or SW solar, can be added to heat to get a net energy flow. You must treat the energies separately, applying the 2nd law to only heat. It does not apply to EM. The 2nd law states specifically that heat cannot be transferred from a lower temperature region to a higher temperature region.
Furthermore, all energy transfers from a state of higher potential to a state of lower potential. Heat can only transfer from a state of higher potential (higher temperature) to a state of lower potential (lower temperature) UNLESS you supply some kind of external power to enable it.
Water will only flow downhill unless you supply power to a pump to pump it back uphill. Mass will only fall downhill unless you supply power to raise it to a higher elevation. EM can only be absorbed by a cooler body after being radiated by a hotter body. The reverse process is not possible.
With regard to your DWIR of 500 W/m^2, where does it come from? You have bazillions of atoms and molecules in the earth’s surface radiating IR and the only molecules that can absorb that IR make up 1% of the atmosphere which is orders of magnitude less dense than the surface. That means the amount of radiation absorbed by that 1% is magnitudes of order less than the IR emitted by the surface.
The surface radiation is cooling the surface and the GHGs are absorbing a tiny fraction of the IR produced when it cools. How the heck do GHGs, which are cooler than the surface, and which radiate 50% of there radiation upward ans laterally, radiate enough IR to the surface to raise its temperature?
If you look at the graphs produced by Norman, you must note that the absorbed radiation by GHGs is measured in milliwatts. Integrated over a certain bandwidth that translated to about 5% of surface radiation. How can 5% of surface radiation be turned around as 350 watts of back radiation?
Gordon,
First of all, DWIR is not heat and please stop misrepresenting what almost everyone else is saying when you infer DWIR is heat. Secondly, DWIR usually comes from a cooler point than UWIR and the latter is always greater than the former unless there is a temperature inversion.
Everyone who has read any significant number of Dr. Spencer’s blogs has heard your explanation of the 2LoT and we don’t need to hear it over and over. Your definitions of words and their scientific meanings cause everyone to re-hash the same old tripe.
I enjoy discussions with most people who comment here whether or not I agree with them. But I skip over almost every comment you make unless you interfere with a discussion I’m having with someone else. In those cases, I will attempt to discourage you from commenting further.
If you insist on pontificating about your interpretation of Clausius’ statements of the 2LoT, then do it on threads you start. Please. I’ll try to do the same regarding my pet peeves.
Chic Bowdrie
Do you understand why all these people are solely talking about CO2 in the context of downwelling infrared?
The influence of H2O aka water vapor between 0 and 8 km altitude is way higher.
And this
Any IR from the atmosphere can have no effect on surface warming for the simple reason it comes from a cooler source.
is a pseudodebate.
What matters here is
– that this radiation reemitted downwards to surface does not go directly into space;
– the average temperature at which radiation escapes to space therefore is lower, what makes the escape process less efficient.
Pretty good explained (alas: in German) by Prof. Dr. J.-P. Blaser, an Emeritus who was professor for Experimental Physics from 1961 till 1990 at ETH Zuerich, long time before warmistas came along.
The German Gerlich worked in the same Physics domain… but had exactly the inverse meaning.
“What matters here is…”
The first point is axiomatic. The problem with the second point is it is almost as unsupportable an opinion as Gordon’s is. Where are the measurements of altitude and temperature which show the process is less efficient?
Chic Bowdrie
“Where are the measurements of altitude and temperature which show the process is less efficient?”
1. Until now I understand the following
– the higher the concentration of material able to intercept IR emitted at Earth’s surface, the higher the place where escape to space can begin in the trroposphere;
– the higher the place where this escape begins, the lower the temperature due to the lapse rate, thus the lower the energy radiated.
2. Of course and luckily for us, neither H2O nor CO2 are able to intercept anything where Earth’s IR peaks, i.e. between 8 and 12 microns.
3. No idea how to measure all that. If we were able to construct an experiment simulating the whole process, we would not be discussing about it.
Feel free to show where I am wrong (I’m sure you’ll be able to reply with more than the usual ‘Zet’s psiudosains’).
4. None of the activities mentioned in “1.” would cause an increase in surface temperatures.
So why is the Earth’s surface 33 (now 34) K above the value that can be attributed to the Sun?
DA returns with more stupid questions.
Nothing new.
Bindidon,
“the higher the concentration of material able to intercept IR emitted at Earths surface, the higher the place where escape to space can begin in the troposphere;”
Actually escape to space happens at an extremely variable and deep(?) range of altitudes. So the ERL is defined as the level where 50% radiation comes from below and 50% from above. It’s logical to assume that an increase in concentration of CO2 will change that level, but I’ve never seen any data confirming that hypothesis.
“the higher the place where this escape begins, the lower the temperature due to the lapse rate, thus the lower the energy radiated.”
Logically correct, but concluding any less radiation depends on detected an actual rise in the ERL.
So I agree with you on 3., and hope you will remain open to coming up with an idea how to measure all that.
Chic Bowdrie
How about this satellite spectrum of IR leaving the Earth’s atmosphere for space?
http://climatemodels.uchicago.edu/modtran/modtran_iris.jpg
Since the concentration of CO2 is changing with time, you could see if the CO2 emission is decreasing over time if you use similar surface temperatures. Also it looks like the model of the IR is very close to the measured value. You may be able to trust this model and set it for higher concentrations of CO2 to see the effect.
One thing you are correct about, even if increased CO2 would change the ERL and less IR would be emitted by CO2 it would not change the emission from Water Vapor since that takes place at much lower parts of the atmosphere. In this graph WV emission takes place at 280 K. The change in the CO2 ERL might only warm up the Water Vapor ERL and not the surface or may be a small effect.
My question of the Water Vapor feedback is if they only consider the added IR from WV and do not consider that to get more Water vapor into the atmosphere you have to evaporate more which would cool the surface and could create more clouds reducing solar input to the surface.
David Appell
You will not be able to reason with JDHuffman. I found on the previous thread he is neither logical nor rational.
I showed him that if you had a blackbody instead of Earth (one that absorbed all incoming EMR) that received 100% of the solar input, it could only reach a temperature of 278 K (10 K cooler than the Earth). He could not grasp that you can do a calculation to find a maximum state to compare it to a lesser state. Weird trying to use scientific reasoning on him.
He is not able to understand what you are asking him. He is not a very intelligent person.
Norman,
Theoretically, I agree with your analysis. What I think you fail to acknowledge is the effect of the motion of the atmosphere which throws a wrench into any analysis based on spectra. The spectrum you linked to can be manipulated using Modtran to show all kinds of effects of temperature and CO2 concentrations. The problem is that the atmosphere does not sit still.
For all we know, the atmosphere cools according to how much it warmed during the day and not on how much CO2 is there. I don’t know the details of how models handle predicting temperature as a function of CO2 and humidity, but if there isn’t a time lapse feature that includes wind as well as convection, then they can’t possibly be anywhere near accurate.
Chic Bowdrie
The point I would make is that convection and wind will move energy around from one location to another they will not create any heating or cooling of the overall system.
That will occur only through the radiant energy. If there is an imbalance of incoming energy to outgoing then the Earth will either cool or warm. If an increase in CO2 lowers the amount of energy that is lost through that channel, there will be an excess of energy into the system until a new balance is achieved.
The wind and convection may keep the surface cooler for a period but as the upper parts of the atmosphere are warmed by convection, the process will slow and the surface temperature will have to rise to be able to remove this energy via convection.
Norman,
“If an increase in CO2 lowers the amount of energy that is lost through that channel, there will be an excess of energy into the system until a new balance is achieved.”
Yes and no. Less energy goes through a channel, but what doesn’t still gets absorbed somewhere. So it is absorbed most likely at a level that will convect up a notch due to the absorbed energy being thermalized into the bulk air. A “new balance” of energy may be exactly the same on average over time.
“The wind and convection may keep the surface cooler for a period…”
Yes, by moving heat from the surface to the tropopause.
“… but as the upper parts of the atmosphere are warmed by convection, the process will slow …”
No. The warm air is cooled by emission.
“… and the surface temperature will have to rise to be able to remove this energy via convection.”
That happens every day, but at night things return to normal. There is no reason that global temperatures have to rise on long time scales. It is just your indoctrinated predisposition to the GHE hypothesis that makes you assume what you think is happening is happening.
Gordon Robertson says:
Obviously, T&K know nothing about the 2nd law and have based their analysis on creating phantom IR to balance an equation.
Roy has often posted here about his measurements of IR from the atmosphere. Are you calling him a liar? Seems so.
David, please stop trolling.
Chic Bowdrie
A relief to hear from you. An actual intelligent skeptic. It is good the skeptic side has people like you on it.
Anyway here is my original post:
http://www.drroyspencer.com/2018/12/the-five-questions-global-warming-policy-must-answer/#comment-334318
The solar input averaged 267 W/m^2 over 24 hours.
The DWIR averaged 400 W/m^2. You need an additional 133 W/m^2 from somewhere to explain the DWIR. It would get inputs from convection, any latent heat of condensation, and the other part of solar that does not make it to the surface. The atmosphere absorbs 47% of what is able to reach the surface. This energy will contribute to the DWIR.
https://en.wikipedia.org/wiki/Earth%27s_energy_budget#/media/File:The-NASA-Earth%27s-Energy-Budget-Poster-Radiant-Energy-System-satellite-infrared-radiation-fluxes.jpg
The graph is the global average and would not be the same for a specific location. The DWIR only reaches a peak of 800 w/m^2 that reach the surface directly. That means a lot of energy is absorbed by the atmosphere. That should balance out if you took this amount into consideration.
norman…”The DWIR only reaches a peak of 800 w/m^2…”
You are confusing the IR portion of solar energy, which makes up over 50% of the solar energy input, to IR from the atmosphere.
That energy budget diagram is a sheer scam. There is no way the atmosphere is back-radiating as much IR as the surface emits.
Furthermore there is no way to recycle IR emitted from the surface so it comes back to raise the temperature of the surface. It’s called perpetual motion and it violates the 2nd law.
The fact that Trenberth/Kiehle think that is possible reveals their ignorance of basic physics.
“That energy budget diagram is a sheer scam. There is no way the atmosphere is back-radiating as much IR as the surface emits.”
The atmosphere is not radiating as much as the surface. That should be obvious from Norman’s Desert Rock example. The Trenberth diagram is not a scam, however misleading it is. Your job should be to understand how to explain it properly so that people aren’t misled. My impression is that your current interpretation of what is going on is even more misleading. For one thing, the diagram is not physics. It’s just a way to express what the energy flows involving the sun, atmosphere, and surface are. You may disagree on the magnitude of the numbers and the interpretation of the arrows as I do, but calling the diagram a scam is unfounded. I doubt Trenberth or Kiehle think the diagram violates the 2nd law. I certainly don’t because there is no net radiation flux showing a cooler atmosphere warming the surface.
Gordon Robertson says:
Furthermore there is no way to recycle IR emitted from the surface so it comes back to raise the temperature of the surface. Its called perpetual motion and it violates the 2nd law.
Of course, GHGs do this, and it doesn’t violate the 2nd law because the atmosphere-surface system isn’t an adiabatic system. This always goes above Gordon’s head.
(That is to say, the atmosphere and surface aren’t in thermal equilibrium, the Sun and the Earth are.)
NO DA!
GHGs do NOT raise the temperature of the surface.
It doesn’t matter if it is an adiabatic system or not, 2LoT can NOT be violated.
Learn some physics.
State your version of the 2LOT that you think doesn’t mention adiabatic systems.
DA, I’ve taught you this before. You refuse to accept reality.
2LoT applies everywhere, all the time. If you don’t think it does, you just don’t understand it.
Norman does not understand the relevant physics. But, he should be able to do simple arithmetic. And, the numbers do not add up.
The wiki link indicates only 163.3 from solar, yet 239.9 goes to space. If true, that would indicate Earth is creating 76.6 Watts/m^2!
Creating energy only works in pseudoscience.
How much IR does the surface receive from the atmosphere?
Good, another stupid question.
Keep them coming. It just proves you have nothing but tricks.
You’re such a lightweight.
You can’t face reality.
JDHuffman
My observation about you is completely correct. You can’t do math higher than 2+2=4.
https://en.wikipedia.org/wiki/Earth%27s_energy_budget#/media/File:The-NASA-Earth%27s-Energy-Budget-Poster-Radiant-Energy-System-satellite-infrared-radiation-fluxes.jpg
You only take the solar energy that hits the surface. 163.3 W/m^2 reach the surface. You ignore the 77.1 W/m^2 that are absorbed directly by the atmosphere. The atmosphere receives a bit more from the Sun than it radiates away on this graph leading to a net absorbed of 0.6 W/m^2 which is why the Earth is warming some. It is receiving more incoming energy than it is losing.
That claims the atmosphere absorbs nearly half of what the surface absorbs. And, that is even after albedo. The intent, of course, is to show the atmosphere has all the heat energy.
You can do the arithmetic, but the physics escapes you.
So present your numbers that you think prove Norman wrong.
Norman hasn’t presented any numbers. He’s just regurgitating the cartoon from pseudoscience, which only has estimated/assumed/manipulated numbers.
JDHuffman
You are not correct when you make the bogus claim that: “Norman hasnt presented any numbers. Hes just regurgitating the cartoon from pseudoscience, which only has estimated/assumed/manipulated numbers.”
It is hard to deal with an irrational poster who gets all their ideas from blogs and discredits valid science. But in this case you are just full of it!
HERE:
https://www.esrl.noaa.gov/gmd/webdata/tmp/surfrad_5c243ac377f51.png
You would have to be a real idiot to think that the Earth’s surface receives 960 W/m^2 from the Sun continuously.
The average from the Sun on a real measuring instrument in the Summer without clouds is 267 W/m^2. You get a few hours of flux at 800 watt/m^2 and you get 12 hours with NO flux at all.
Do you understand the concept of averages and why they are used?
You don’t know geometry at all and now you show you don’t know how to average things.
Wow you are dumber than I thought. Get a grip and start to study things. You are way in the idiot level. You can’t get out by arguing like a person who can’t understand basic math concepts.
Really why are you so stupid? Worse why do you post and expose your stupidity for all to see. If I did not understand simple math I think I would quit debating the point and go learn.
Norman, I see you are frustrated again.
It’s your failed pseudoscience doing it to you.
I recommend you give it up, and learn some physics.
JDHuffman
I will demonstrate how poor you math skills actually are. You criticize things that you are far too foolish to understand.
HERE YOU STATE (STUIPIDLY): “That claims the atmosphere absorbs nearly half of what the surface absorbs. And, that is even after albedo. The intent, of course, is to show the atmosphere has all the heat energy.
You can do the arithmetic, but the physics escapes you.”
The actual calculations are based upon real measured values but you lack the math skills to figure the material out and get it all wrong (nothing new).
Here is the Global Budget:
https://upload.wikimedia.org/wikipedia/commons/b/bb/The-NASA-Earth%27s-Energy-Budget-Poster-Radiant-Energy-System-satellite-infrared-radiation-fluxes.jpg
The facts are valid and your claims are pure idiotic rants.
The atmosphere absorbs a little over 20% of the incoming flux.
In the budget they have the incoming flux at 340.4 W/m^2 and the amount of energy absorbed by the atmosphere is 77.1 W/m^2.
Math you can’t do. 77.1/340.4 = 22.6%
Real world measured values?
https://www.esrl.noaa.gov/gmd/webdata/tmp/surfrad_5c24471e19bd6.png
1368 (flux from Sun high noon in summer North Hemisphere) minus 1075 (flux reaching Earth’s surface that has not been reflected).
1368-1075 = 293 is what is absorbed by atmosphere on way down (amount missing from the full flux of the Sun).
293/1368 = 21.4% so it is very close to the value given in the global budget graph for % absorbed.
Now to compare actual absorbed by surface compared to that absorbed by atmosphere:
On global budget:
77.1/163.3 = 47.2%
https://www.esrl.noaa.gov/gmd/webdata/tmp/surfrad_5c244abdec8a3.png
Measured value:
293/850 = 34.4% for a cloudless value
https://www.esrl.noaa.gov/gmd/webdata/tmp/surfrad_5c244b49e1502.png
293/600 = 48.8% for a cloudy area. Over the whole world clouds make up 68% coverage, so you would have a value closer to the global budget.
Wake up and learn some math, please. It embarrasses me to read your posts. Sometimes (not often because of your attitude) I feel sorry for you that you are so lacking in basic math, I wish you would learn some before posting.
Norman, you are being fooled by Institutionalized Pseudoscience. You don’t understand the physics, and you get confused by all the numbers. I understand it can be frustrating for you.
They are mixing real numbers with estimated/assumed numbers. They are adding and averaging radiative fluxes, which violates the laws. Remember, the 300 Watts from a square meter of ice is not the same as 300 Watts from 3 incandescent light bulbs. No wonder you get confused.
Try to simplify things so you can understand.
Energy in = Energy out.
1) What figure are you going to use for the solar ENERGY that is absorbed in Earth’s system?
2) What figure are you going to use for the heat ENERGY that leaves Earth’s system?
ENERGY is in units of Joules, not Watts/m^2.
Now try again, but keep it simple.
JDHuffman
You are incredibly ignorant. It pains me you believe, based upon your complete ignorance and lack of any math skills or logical thought process, I am the one who lacks ability! Wow that is amazing amount of self-denial. You think you skills are above mine when you are so wrong.
Truly amazing display of utter stupidity.
YOU: “Try to simplify things so you can understand.
Energy in = Energy out.
1) What figure are you going to use for the solar ENERGY that is absorbed in Earth’s system?
2) What figure are you going to use for the heat ENERGY that leaves Earth’s system?
ENERGY is in units of Joules, not Watts/m^2.
Now try again, but keep it simple.”
And yet with energy in motion you can’t describe it in static fashion! You can’t describe speed without both distance and time. With energy in and out you must specify Your stupidity would be similar to describing the speed of time. So your 1 and 2 are incredibly ridiculous! The Earth absorbs solar energy per some time unit. It is a unit of watts similar to describing the speed of a car. a car in miles only. Dumbest thing on the blog today. Don’t worry you are so dumb you will top this level of ignorance.
It is unbelievable that you can’t understand units of physics or how to use them correctly! Lord I am glad all skeptics are not as dumb as you are!
JDHuffman
Are you for real? Do you really think this is a valid statement?
YOU: “Remember, the 300 Watts from a square meter of ice is not the same as 300 Watts from 3 incandescent light bulbs. No wonder you get confused.”
what are you attempting to say? The amount of energy from each is the same. They are the same item (EMR) at different wavelengths but the energy is the same.
If a surface exposed to either source can absorb the energy from each, it would destroy the EMR and convert it to internal energy.
In this case 300 watts of energy from ice would warm the object to the same temperature as 300 watts of energy from the 3 bulbs. No difference.
Norman, after all your rambling and bluster, you were unable to address the simple “energy in = energy out” issue.
Simple facts and logic destroy your pseudoscience, every time.
And, I see you found a new experiment to try:
“In this case 300 watts of energy from ice would warm the object to the same temperature as 300 watts of energy from the 3 bulbs. No difference.”
You can make it easier. Just use one 25 Watt incandescent bulb, and
25/300 X 10000 = 833 cm^2 ice. (roughly 2 full ice trays)
Nice and simple home experiment. Lay one hand on the bulb, and the other on the ice. If your pseudoscience is correct, you should experience “No difference”….
240 W/m2 comes in from the Sun.
=(1-albedo)*(TOA solar irradiance)/4 = 240 W/m2
albedo = 0.3
solar irradiance = 1365 W/m2
No DA.
960 Watts/m^2 comes from the Sun.
240 is the average from a super-conducting, isotropic, homogeneous, blackbody sphere.
What calculation gives 960 W/m2?
So you think every point on Earth receives (1-albedo)*TSI = 960 W/m2, on average?
What would the average surface temperature be at that value?
“What calculation gives 960 W/m2?”
1365 X 0.7 = 960
Your next two questions were incinerated by the “stupid question” zapper.
JDHUffman
Again demonstrates no logical or rational thought process and shows very limited math ability. He can calculate a simple multiplication but cannot understand what an average is.
Stupid Huffman, at what point is the surface receiving this 960 W/m^2 value? At night all day? What. You are a drunken baboon. No logic, no reason, no math ability, no physics. But you have a compulsion to post and show your ignorance daily. Most people are not so proud of their ignorance. Most would try to learn a topic before showing everyone how dumb they are.
Norman, sober up.
And then grow up.
Norman,
At the beginning of any day, the surface already has a temperature capable of emitting an average of 300 to 400 W/m2. Near surface atmospheric temperatures with normal humidity will upradiate that and more as the sun rises. Downwelling IR will always provide less than that because some of the upwelling radiation goes directly to space and can’t add to the downwelling IR. DWIR tracks UWIR and that should tell you something.
One thing that I find helpful is to be mindful of the mean path length of radiation at various altitudes. Near surface radiation doesn’t go far unless through the atmospheric window(s). So CO2 and H2O radiation will be absorbed within a limited distance near the surface and nearly all will be thermalized by collisions with other air molecules. Things will be somewhat different in the upper atmosphere where the density is much less.
Well stated, Chic. But, I always like to keep it simple “for busy people”:
The Sun warms the surface, the surface warms the atmosphere, and the atmosphere radiates heat energy to space.
OK, JD. But for those of us who are anal and/or not sufficiently busy, we need to get into the weeds.
Ger*an says:
The Sun warms the surface, the surface warms the atmosphere, and the atmosphere radiates heat energy to space.
Why doesn’t the atmosphere radiate in all directions?
When DA was in pseudoscience school, he had to take a final exam.
Examiner: “Give an example of a ‘stupid question’.”
DA: “What’s a ‘stupid questiion’?”
DA passed the course.
You call a question “stupid” when you can’t answer it, or when you realize answering it proves a prior claim wrong.
That doesn’t fool anyone, and it’s also rather cowardly.
DA, you ask stupid questions because you aren’t able to discuss the relevant physics. You have an agenda, but that agenda requires you to avoid reality.
Your behavior doesn’t fool anyone, and it’s also rather cowardly.
Discussing science is ALL ABOUT questions.
Why are you here (24×7, it seems) if you don’t want to discuss science, entertain questions, and learn?
You always flake out at the mere WHIFF of a question.
Wrong DA. I only refuse stupid questions.
I always try to answer responsible questions, even if you are the one asking.
No you don’t. You refuse essentially all questions, and never give reasons why the questions are “stupid”….
So, really, why do you come here if you don’t want to discuss science?
Ger*an says:
The Sun warms the surface, the surface warms the atmosphere, and the atmosphere radiates heat energy to space.
Does the atmosphere radiate in all directions?
It’s a basic question. If it does, you have to account for the downwelling radiation.
Wrong DA. It is a stupid question. You already know the answer, as you indicated. You know that I know the answer. You’re just trying to avoid the fact that the atmosphere radiates to space. You want the atmosphere to “trap” all heat energy. You are obsessed with your agenda.
Learn to appreciate reality. You will have to someday….
Chic Bowdrie says:
So CO2 and H2O radiation will be absorbed within a limited distance near the surface and nearly all will be thermalized by collisions with other air molecules.
But after ab.sorp.tion the atmosphere radiates, in all directions.
You’ve fallen for the saturation fallacy, same as did Kurt Angstrom after Arrhenius’s 1896 paper.
Saturation is wrong, because the atmosphere itself radiates.
“On Earth, CO2 is far from being saturated. It isn’t even saturated on Venus.” See the sidebar on page 37 of:
Pierrehumbert RT 2011: Infrared radiation and planetary temperature. Physics Today 64, 33-38
http://geosci.uchicago.edu/~rtp1/papers/PhysTodayRT2011.pdf
That’s the paper that claims Earth is warming the Sun!
Great pseudoscience.
Where does the paper say that? You have a quotation from it?
“Youve fallen for the saturation fallacy, same as did Kurt Angstrom …”
Thanks, for the great-minds-think-alike compliment.
“Saturation is wrong, because the atmosphere itself radiates.”
What does that mean?
Saturation is in the eye of the beholder. Air isn’t static. It keeps moving up and/or around. Near the surface absorp.tion rules. In the upper atmosphere, emission rules. Saturation is secondary.
Sorry DA, you’ve got so many confused papers I got confused.
That’s the one that claims the Sun can heat the Earth to 800,000 K!
That would be well above the Sun’s emission temperature of 5800 K.
Still some great pseudoscience.
Chic Bowdrie says:
“Saturation is wrong, because the atmosphere itself radiates.”
What does that mean?
It means that, like the surface, the atmosphere itself radiates.
Suppose an IR photon leaves the surface and is ab.sorb.ed by the atmo 50 cm above the surface. The molecule that ab.sorb.ed it — CO2 or water vapor or whatever — gains its energy and goes into that excited state. That extra energy can be thermalized, or it can be emitted when the molecule falls back down to its ground state. That radiation will be in a random direction, half of such emissions with an upward component.
So it’s not like IR gets quickly absorbed and just vanished. It get reemitted, and then again, and then again, until some IR leaves the TOA.
If CO2 and w.v were saturated, this graph showing outgoing TOA energy would be zero at those wavelengths. But it never is.
https://www.giss.nasa.gov/research/briefs/schmidt_05/curve_s.gif
Am I wrong?
David,
I thank you for providing enough info to be able to have an exchange of ideas.
You are not necessarily wrong, but rather incomplete. And that is to be expected when having to describe a scenario as complex as the atmosphere. You emphasized the emission process while neglecting the thermalization process. Which is more likely to happen near the surface? The time to emit is much longer than the time an excited CO2 molecule takes to collide with another air molecule. The warmed air rises, etc.
It is the thermalization that gets saturated. The potential extra amount of radiation that can be absorbed due to more CO2 will just be absorbed at some higher altitude. Meanwhile, in the upper atmosphere, the extra CO2 provides potential to emit more radiation, because emissions there are more likely than a collision-induced retention of energy.
Your outgoing TOA spectra only shows emissions as a function of temperature where the emission occurred. It doesn’t know whether the emission resulted from an absor.ption or from a collision. So we don’t know if more CO2 inhibits or promotes emission.
How is that wrong?
Chic wrote:
Your outgoing TOA spectra only shows emissions as a function of temperature where the emission occurred.
No, Chic, that’s completely wrong.
The graph shows the TOA outgoing flux (energy) as a function of wavelength.
https://www.giss.nasa.gov/research/briefs/schmidt_05/curve_s.gif
Do you see that?
We can’t possibly go forward until it’s sure you understand this graph exactly.
Chic wrote:
It is the thermalization that gets saturated. The potential extra amount of radiation that can be absorbed due to more CO2 will just be absorbed at some higher altitude. Meanwhile, in the upper atmosphere, the extra CO2 provides potential to emit more radiation, because emissions there are more likely than a collision-induced retention of energy.
Human influence on the greenhouse effect REDUCES temperatures in the stratosphere.
And this is observed (after accounting for ozone loss). It’s the most important prediction of greenhouse theory. And it wouldn’t happen if the Sun was the cause of warming.
I do understand the graph and yes it is flux as a function of wavenumber. But the data points reflect the contribution of emissions of certain molecules at some altitude viewed from space. You only see the emissions from those altitudes. You don’t see absor.ptions below those altitudes. And again, you don’t know whether the emission resulted from a prior absor.ption or a collision.
Do you understand this? We cant possibly go forward until you understand this graph exactly.
“Human influence on the greenhouse effect REDUCES temperatures in the stratosphere.”
This is pure speculation on your part and all other warmists. You have no definitive evidence of this and the rest of your comment as I have explained to you many times.
Chic: Stop lying.
That graph is for the TOA, and included *ALL* altitudes beneath it.
David: stop trolling.
Originally I wrote the following…
“Your outgoing TOA spectra only shows emissions as a function of temperature where the emission occurred.”
…in response to an amazingly strange and ill-informed statement by you:
“If CO2 and w.v were saturated, this graph showing outgoing TOA energy would be zero at those wavelengths.”
While I addressed the relevance of the TOA spectra in my original comment, your rebuttal was a red-herring. All you did was describe the axis labels and you even got that wrong. In my next comment I get back to explaining what you don’t understand about TOA spectra:
“You only see the emissions from those altitudes. You don’t see absor.ptions below those altitudes.”
I’ll explain in more detail.
Look at the first slide here:
http://pages.mtu.edu/~scarn/teaching/GE4250/AtmoEmission_lecture_slides.pdf
Notice the title of the figure is Atmospheric Emission. It does not say Absor.ption. The curve denotes radiation from emissions at various wavelengths. Those dotted lines represent Planck function curves for surfaces at the labeled temperatures. Between 10 and 12 micron, the emission curve is close to 325 K. That is the surface temperature of the Sahara desert when the emission spectrum was taken. Water molecules emit around 20 microns. You can see their emissions coming from temperatures between 240K and 290K. It is no coincidence that water condenses at a temperature in the middle of that range. CO2 emissions are coming from 210K to 220K at around 15 microns. That is the temperature of the tropopause. It gets a little warmer above the tropopause and the large emissivity of CO2 at exactly 15 micron makes that peak reaching 230K.
These emissions come from molecules at altitudes characteristic of the temperature of the air at that altitude. You don’t know whether the emission came from a previous absor.ption or whether an IR active molecule collided with a N2 or O2 and got excited and then emitted. Furthermore the spectrum doesn’t tell you what is happening at lower elevations. We know what is happening from spectra at lower altitudes, but not from TOA spectra. So we know that CO2 absorbs all available IR from the surface within a few km of the surface. The lower troposphere is therefore opaque to IR at 15 micron. Some call this saturation, an ambiguous term.
If you don’t understand what I have explained here, there is no use of us discussing it any farther.
Chic Bowdrie
Since you like to get into the weeds. Here is one you may like.
https://www.researchgate.net/publication/320123470_The_Relationship_between_Atmospheric_Carbon_Dioxide_Concentration_and_Global_Temperature_for_the_Last_425_Million_Years
You can read the author’s risk assessment.
Also they use MODTRAN and find the IPCC CO2 forcing for doubling CO2 levels is much higher than what they get.
Norman,
“This study demonstrates that changes in atmospheric CO2 concentration did not cause temperature change in the ancient climate.”
Am I reading the correct link? I didn’t read the whole article, but based on the abstract, I’d say it supports my views.
El Nino back up!
https://www.tropicaltidbits.com/analysis/ocean/nino12.png
https://www.longpaddock.qld.gov.au/soi/
Where are you El Nino?
http://tropic.ssec.wisc.edu/real-time/mtpw2m/product.php?color_type=tpw_nrl_colors&layer=700-850&prod=midpac×pan=24hrs&anim=html5
NINO34 Index is not at +1.0 C, and has been above the benchmark of +0.5 C for 13 weeks now….
http://www.cpc.ncep.noaa.gov/data/indices/wksst8110.for
Oops…that should be “NINO34 Index is **NOW** at 1.0 C….”
David, please stop trolling.
I’m not trolling. But honored that you reply to my comments.
David, please stop trolling.
EL NINO really does no exist as of now.
Salvatore, my belief in El Nino predictions is not so very high.
But in the graph below
http://ds.data.jma.go.jp/tcc/tcc/products/elnino/elmonout.html#fig2
the predictions of Japan’s Met Agency were a bit lower one week ago. Feb and Mar were at 70/30, they are now at 80/20.
Be patient, and give this little Christmas child some time to grow…
Show me where El Nino is seen in this animation?
https://www.ospo.noaa.gov/Products/ocean/cb/hotspots/anim.html
They are wrong already to late even if it comes later.
But I do not really care about ENSO one way or the other.
hat I do care about is the overall sea surface temperature situation which is essentially neutral over the past 1 or 2 years.
COR – I do care
“I will never spin and if I am wrong I will admit it.”
– Salvatore del Prete, April 7, 2011
https://bbickmore.wordpress.com/2011/04/05/roy-spencers-non-response/
David, please stop trolling.
You’re the real (and vapid) troll around here.
No David, please STOP trolling.
You should not understimate the accuracy of Tokio Climate Center’s computations… these are based on long, long experience.
All the models 100% of them have been way off up today so what do they use?
But as I said it is overall sea surface temperatures that really matter.
Observation is for TCC as relevant as its input to software.
You can’t generate any forecast for such complex phenomena without a software able to cope with that complexity.
They are guessing and so far wrong.
Salvatore Del Prete says:
All the models 100% of them have been way off….
Prove it, Salvatore.
David, please stop trolling.
Just looking at Roy’s graphic above that compares each year using anomalies based on the 1980 – 2010 baseline.
I keep ranting about the average from 1998 – 2015 being flat. I think the proof in in Roy’s graph. I am not including 2015 in that range per se, seeing it as a transition year into the early 2016 El Nino.
You have to average the 1998 year since it was a sharp spike followed by a slight negative anomaly region. The average must come out to around 0.2C between 1998 and 2001 since the IPCC declared the range 1998 – 2012 as having no significant warming. The famous albeit poorly named pause.
On Roy’s graph, the years 2002, 2003, 2005, and 2014 are clustered around the 0.2C anomaly. 2010, 2015, are slight outliers but they are balanced by the negative anomaly of 2008. Although the years 2004, 2006, 2007, 2009, 2011, and 2013 are not marked their average (red curve) can be seen on the official UAH graph as being cluttered between the 0.1C and 0.2C anomalies.
Note that 2014, which NOAA and GISS proclaimed as the hottest year ever, is a very normal year making up the flat trend.
NOAA and GISS cheated in proclaiming 2014 as the hottest year ever. They reduced the confidence levels that 2014 was ‘LIKELY’ the hottest year to 48% and 38% respectively to elevate 2014 to that status.
Why would scientific organizations want to cheat?
Gordon:
How would you rank yearly temperatures, given the uncertainties of the numbers?
What methodology would you use?
– David
David, please stop trolling.
Can’t answer my question….
I’m not at all surprised.
David, please stop trolling.
Just some info concerning UAH.
Here is a list of the highest yearly UAH6.0 anomaly averages (of course wrt the mean of 1981-2010):
2016 0.52 (°C)
1998 0.48
2017 0.38
2010 0.34
2015 0.27
2018 0.23
2002 0.21
2005 0.20
2003 0.18
2014 0.18
And here is the list of the highest yearly averages of UAH6.0 absolute values (computed using their 2.5 degree anomaly and climatology grid):
2016 -8.68 (°C)
1998 -8.71
2017 -8.82
2010 -8.86
2015 -8.92
2018 -8.95
2002 -8.98
2005 -9.00
2003 -9.01
2014 -9.01
{ 2018’s december data is not available yet, it may have to be corrected a tiny bit. }
We see that 2016 and 1998 are absolute outsiders: these years both experienced two of the three strongest El Ninos since quite a long time (1982/83 was Nr 2).
During this year, I did not expect it coming at rank 6: 2016 is now far away, Salvatore sees cooling ahead, and the next El Nino still is a bit lazy.
*
This is btw the first time I see the same year sequence in both anomaly and absolute data for temperature measurement.
And it is also the first time I see the linear estimate for an absolute time series being somewhat higher as that for the corresponding anomalies: 0.14 °C / decade vs. 0.13. Usually, the contrary is the case.
Bindidon that is the past and it can NOT be used to give a forecast for the future especially since up to 2005 all natural climatic indicators were in a warming mode then followed by a transitional mode to just recently a colder mode.
Salvatore, you said cooling started in 2002:
“Your conclusions are in a word wrong, and that will be proven over the coming years, as the temperatures of earth will start a more significant decline (which started in year 2002 by the way)….”
– Salvatore del Prete, Reply to article: IC Joanna Haigh – Declining solar activity linked to recent warming, 10/8/2010
– http://climaterealists.com/index.php?id=6428
Yet another ‘transition’. How many transitions will there be before you are done?
Thickvid and Thickdesthick, please stop thick-ing.
It appears humans have contributed to warming since the LIA by increasing water vapor. Atmospheric CO2 is shown to have little to no effect on climate in several assessments listed in Section 2 of http://globalclimatedrivers2.blogspot.com .
Atmospheric water vapor has been increasing, long term of measured, (graph using NASA/RSS satellite acquired numerical data https://pbs.twimg.com/media/DvXU3FGVsAAXaEn.jpg) at 1.5% per decade; 8% since 1960. The WV increase (about twice that calculated from increase in vapor pressure due to average global temperature increase of liquid water at planet surface) correlates with irrigation increase.
If the 2015-2016 el Nino is ignored, WV content trend looks flat since about 2002 (as does UAH v6.0 TLT (lower troposphere) temperature) https://pbs.twimg.com/media/DuaFJw7VYAEz-mU.jpg. WV increase has been countering temperature decline forcings, from quiet sun and declining ocean SST cycles. It looks like this warming cycle has ended. Too soon to tell if temperature decline will be delayed by the aberration of another el Nino.
The WV increase posed the question of whether precipitation increase would be world wide or whether the hydrologic cycle would become more intense with dry areas becoming dryer. The study presented at https://wattsupwiththat.com/2018/12/25/the-dryer-gets-wetter supports that precipitation increase is world wide.
How much of recent high precipitation (with incidences reported world wide) has been simply bad luck in the randomness of weather and how much has been because of the ‘thumb on the scale’ of added water vapor?
Dan Pangburn says:
It appears humans have contributed to warming since the LIA by increasing water vapor. Atmospheric CO2 is shown to have little to no effect on climate….
Bullsh!t.
The atmosphere can only hold so much water vapor; the amount is a function of temperature. (See the Clausius-Claperyon equation.) If some process puts more w.v. in at a constant temperature, the w.v. will quickly (~days) rain or snow out of the atmosphere.
It is CO2, and human emissions of other GHGs, that creates this temperature in the first place. Only then can w.v. increase, which is a strong positive feedback on CO2-warming.
And w.v. is indeed know to be increasing.
DA,, Your grasp of partial truths is blocking your understanding of the bigger picture. Of course you are correct that the atmosphere can hold only so much water and that is what the Clapeyron Equation is about (saturation). The CC equation does not apply except at locations where there is saturation. It certainly does not apply where skies are clear, it does not apply above clouds, and it does not even apply below clouds unless it is precipitating. You should know all that. If you do know it, you should stop misleading people. We have been down this road before http://www.drroyspencer.com/2016/11/uah-global-temperature-update-for-october-2016-0-41-deg-c/#comment-229225 and apparently you are still too stubborn to challenge your perception.
Apparently you have swallowed the group-think consensus that CO2 started the warming from the depths of the LIA. Have you not noticed that the warmup started when sunspots started appearing again following the Maunder Minimum? Have you rationalized all of the compelling evidence CO2 has little to no effect on climate? Eight examples are listed in Section 2 of my blog/analysis. Perhaps you could articulate your rationalization of why you think each of them is deficient in place of the vacuous expletive and unsubstantiated assertions.
As normalcy returns following the aberration of the most-recent el Nino it appears the water vapor trend stopped increasing in about 2002, and thus one of the strongest forcings on average global temperature increase has ended. CO2 in spite of being a ghg apparently has little influence. https://pbs.twimg.com/media/DvdAyMdUYAEn_HO.jpg
A graphic in my previous posting showed that but either you did not look at it or are too blinded by your prior perception to grasp it. The other effective forcings (SST cycle & SSN) are down. I wonder how large the separation between the rising CO2 and not-rising temperature (and not-rising WV) will need to get for you to begin to realize that perhaps you missed something.
Wrong Dan — the Clausius-Claperyon applies at all points on the P-T diagram, which you’d understand if you look at its derivation.
(I have corrected you on this before, but you won’t learn.)
David, please stop trolling.
Two words missing from thread; forcing and feedback.
CO2 increase due to human activity is a forcing. Water vapour increase is a feedback.
Put them together and you get a cause-and-effect relationship.
Human activity leads to increased CO2.
Increased CO2 leads to increased temperature.
Increased temperature leads to increased water vapour.
Increased water vapour leads to extra increased temperature.
E-man, maybe I can help.
Human activity leads to increased CO2.
Increased CO2 leads to increased plant growth.
Increased plant growth leads to more and cheaper food.
More and cheaper food leads to world peace.
More CO2 mean higher temperatures and changes to the hydrological cycle.
That affects plants, who have adapted to their regional ecosystem.
Higher temperatures and more plant growth means more weeds and insects. More droughts and extreme rainfall damage crops.
Some crops lose nutritional and mineral value when grown under elevated CO2.
US corn is already moving north (WSJ 12/18), as are many fish (WSJ 12/18). Oyster fisheries have left Oregon and Washington because of ocean acidification.
People with something at stake are concerned. General Mills CEO Ken Powell told the Associated Press:
“We think that human-caused greenhouse gas causes climate change and climate volatility, and thats going to stress the agricultural supply chain, which is very important to us.”
8/30/15
http://www.chicagotribune.com/business/ct-general-mills-greenhouse-gas-cuts-20150830-story.html
Funny. And the article even includes a quote from Obama “This is all real”.
Doubly funny.
Thanks for sharing, DA.
How is it funny? I don’t get that….
DA, that is probably a sincere question, being as you know so little about reality.
Soon after this CEO (Powell) made that statement, General Mills stock peaked. The stock is now close to a 6-year low. Powell is no longer CEO.
Now do you see why your comment was funny?
“That affects plants, who have adapted to their regional ecosystem.”
Hardly any impact here. Plants have to withstand far greater extremes just in the changing seasons and the diurnal cycle. A few odd plants have processes that need a frost to set their flowers but overall the general reduction in diurnal variation caused by slowing of cooling will be a huge benefit to plants and greatly reduce frost damage.
“Higher temperatures and more plant growth means more weeds and insects. More droughts and extreme rainfall damage crops.”
Just another sign David that warmer temperatures are beneficial to both plants and animal life. . . .unless you think God carefully distinguished between plants beneficial to man and those that are not. LMAO!
“Some crops lose nutritional and mineral value when grown under elevated CO2.” That in one respect might be true, where to some extent that the same total nutrients are now distributed in a larger biomass. But plants tend to adapt to conditions. Since the plant will have to expend less energy to obtain the basic sugar building block, CO2 it can put more energy into its root system. And one more thing climate scientists are really lousy at is farming and making crop predictions. Yes some changes will need to occur in farming practices but farmers have been doing that for centuries and scientists keep predicting they won’t.
How did that make Mills wrong?
Bill wrote:
Just another sign David that warmer temperatures are beneficial to both plants and animal life. . . .unless you think God carefully distinguished between plants beneficial to man and those that are not.
What??
There are no gods and your god has nothing to do with any of this.
This is about science, not your superstitions.
David, please stop trolling.
David Appell said: “Higher temperatures and more plant growth means more weeds and insects.”
David you are the one that brought good and evil into this science discussion. . . .unless of course you have a credible source that selects which plants and which animals are going to prosper. But of course you don’t. LMAO!
https://www.iceagenow.info/saltbush-solar-activity-watch-established/
“Australia’s most famous weather forecaster, Inigo Jones”
I’ve asked a number of people – no one has heard of him.
This is the kind of BS promoted on these sites.
Wasn’t he in The Princess Bride?
I thought he was in Raiders of the Lost Ark.
According to wiki, he was despised by Institutionalized Pseudoscience, but appreciated by farmers that had to depend on his forecasts.
https://en.wikipedia.org/wiki/Inigo_Owen_Jones
Sure.
“Jones studied the variation in sunspot cycles that had been discovered by Eduard Bruckner, and came to the conclusion that anomalies were caused by the interaction of the planets Jupiter, Saturn, Uranus and Neptune.”
David, please stop trolling.
Sure, obviously the Sun is important to climate.
But where’s the data showing it responsible for climate CHANGE??
PS: The Little Ice Age wasn’t caused by the Sun or a dearth of sunspots.
Thickvid, please stop thick-ing.
What was the Little Ice Age caused by?
There is still debate as to what it was caused by, but given that it began 300 years before the Maunder minimum began, and continued for another 150 years after it was finished, that wasn’t the ultimate cause.
He didn’t say the Maunder Minimum. The Maunder was preceded by the Wolf and Sporer Minimums, the three of which spanned 400 years.
“Abrupt onset of the Little Ice Age triggered by volcanism and sustained by sea-ice/ocean feedbacks,” Gifford H. Miller et al, GRL (2013).
DOI: 10.1029/2011GL050168
http://onlinelibrary.wiley.com/doi/10.1029/2011GL050168/full
By the way, the Little Ice Age wasn’t global, either.
David Appell: Abrupt onset of the Little Ice Age triggered by volcanism and sustained by sea-ice/ocean feedbacks,
Well 300 to 400 years of cooling brought on my any cause would likely, by the KISS principle, allow for a 300 to 400 year recovery without any evidence of a cause beyond the lack of the driver that drove the temperatures down. Grand solar minimums (Wolf, Sporer, Maunder) or volcanism and sea-ice/ocean feedbacks.
Politics and religion generally accounts for the filling in of blanks as opposed to a driving curiosity for all but true scientists. .
My pet hypothesis says it was the black death. Reforestation pulled CO2 out of the atmosphere. That’s uncertain.
The 1257 Samalas eruption is a likely trigger:
https://tinyurl.com/y7k846w2
Perhaps is was several factors, and a lot of feedbacks.
David, Svante, please stop trolling.
manmade CO2 caused Global warming is a concocted theory based on circumstantial, anegnotal , chery-picked , and outright falsified evidence, it does’t match the observed data and it doen’t produce acurate predictions. but It is propagated by political propaganda.
Why do so many believe it ???
why did so many believe in Fascism ???
count me as the Odd man out
https://postimg.cc/PC3LxysZ
The denier club reaching for their Exxon pay cheques.
Yeah, it’s hard to keep track of all the incoming checks–Exxon-Mobil, BP, Shell, Valero, Phillips, and that’s just the larger ones.
I wish they would all get together and just send one huge check each month.
.
❶①❶①❶①❶①
❶①❶①❶①❶①
❶①❶①❶①❶①
❶①❶①❶①❶①
.
I believe that the slowdown/pause would be a dead subject, if Alarmists didn’t keep bringing it up.
They have recently published 2 scientific papers which claim to show that the slowdown wasn’t a real phenomenon.
This morning, I found an article about one of these scientific papers, at TheConversation website:
https://theconversation.com/global-warming-hiatus-is-the-climate-change-myth-that-refuses-to-die-108524
It is also featured at the SkepticalScience website:
https://skepticalscience.com
It was dated the 20th December 2018, and was by Kevin Cowtan, and Stephan Lewandowsky.
Just reading the first 2 paragraphs made me annoyed. They used the word “denier” in the first sentence, and the phrase “science-denying” in the second paragraph.
But the third paragraph really made me sit up, and take notice.
They repeated a common Alarmist lie about the slowdown, which I talked about in my recent article.
They said, “But, more importantly, these claims use the same kind of misdirection as was used a few years ago about a supposed “pause” in warming lasting from roughly 1998 to 2013.”
They talk about “misdirection”, and then misdirect people to a false weak slowdown (1998 to 2013). This is part of an Alarmist lie, that claims that the recent slowdown only exists because of the 1998 super El Nino.
In my article, I said:
– The strongest slowdown (the one with the lowest warming rate), went from 2002 to 2012, and had a warming rate of +0.14 degrees Celsius per century. Because it went from 2002 to 2012, it had nothing to do with the 1998 super El Nino.
– The strongest slowdown WHICH INCLUDED THE YEAR 1998 (the one with the lowest warming rate), went from 1998 to 2013, and had a warming rate of +0.96 degrees Celsius per century.
[note that this one is the exact same slowdown interval that Cowtan and Lewandowsky use]
– So the false Alarmist slowdown (1998 to 2013), had a warming rate which was 6.9 times greater than the warming rate of the real slowdown (2002 to 2012).
If the real slowdown (2002 to 2012) was a car that was traveling at 50 km/h, then the false Alarmist slowdown (1998 to 2013), would be a car that was traveling at 345 km/h.
– Perhaps this is one of the reasons why Alarmists don’t believe that there was a slowdown. They are not looking at the real slowdown.
I don’t like to see such blatant lies go unchallenged. I have the evidence to expose these false statements:
https://agree-to-disagree.com/alarmist-thinking-on-the-slowdown
and
https://agree-to-disagree.com/was-the-slowdown-caused-by-1998
If you are a person who values the truth, I urge you to consider the evidence in my articles about the slowdown.
I don’t mind if you disagree with me. I am willing to listen to your opinion, and your evidence.
Hope you are having a good Christmas.
Regards,
Sheldon Walker
http://www.agree-to-disagree.com
With exactly 40 years of UAH data, here is the percentile distribution by decade:
https://tinyurl.com/UAH-Percentile-Distribution
When deniers refer to the “pause”, they are referring only to the top 10% of the distribution. The remaining 90% of the distribution has been steadily rising. Apparently they believe that only record temperatures are significant.
Gordon will now claim this graph is “bullshit” without being able to explain why.
Bobdesbond,
I really like your graph of the percentile distribution by decade.
I don’t understand what you mean, when you say “When deniers refer to the “pause”, they are referring only to the top 10% of the distribution.”
I think that the whole graph shows that the temperature (anomaly) “has been steadily rising”.
I calculated how fast the temperature (anomaly) has been rising. All of the lines on your graph show an increase of a bit less than 0.4 degrees Celsius in 40 years.
That is a bit less than 1.0 degree Celsius per century.
So the whole 100% of your graph is showing a slowdown.
The GISTEMP warming rate is more like 1.8 degrees Celsius per century. So UAH over the last 40 years, has a warming rate just over half of the GISTEMP warming rate.
Firstly, that rise is over 30 years, not 40. Think about that before I explain it.
That makes the rate bang on the UAH claim of 0.13C per decade.
Yes, I agree with you, it is over 30 years. I took the “40 years” from the comment at the top of your post, “With exactly 40 years of UAH data”.
Bobdesbond
Many thanks for the interesting graph.
It seems when deniers are confronted with evidence they don’t like, they sidestep it and pretend it never happened.
Bobdesbond, please stop trolling.
Global warming is not a matter of math and fizzix ,
Global warming is a matter of psychology.
If you really want to understand global warming phenomenan don’t waste time studying climate, instead study the psychology of of mass delusion and mass hysteria, there you will find the answers
If you say it, it must be true.
I will say thing nobody else here will say , yo could sit back and think about it what it means ,
instead you choose to type a reply worthy of an eight year old child within three seconds of my post.
I’ve thought about the idea many times. What you don’t seem to understand is that it applies to the climate denial industry.
Thickdesthick, please stop thick-ing.
“Global warming is not a matter of math and fizzix ,
Global warming is a matter of psychology.”
Huh?!
Psychologically speaking – I must be imagining this:
“Australias post-Christmas heatwave continues to sweep across the country, with a near record-breaking 49C forecast for Western Australia, and fire danger, health and air quality warnings issued across the nation.
On Thursday morning, the bureau of meteorology forecast a scorching 49C maximum for Marble Bar and Pannawonica in the Pilbara region of WA only 2 degrees below the highest temperature ever recorded in Australia, which is 50.7C at South Australias Oodnadatta airport in 1960.
By 8.40am on Thursday Marble Bar had already recorded 43.4C, with the worst of the heat to come.
The extreme heat is stretching across WA, SA, Victoria, New South Wales and parts of central Queensland. Temperatures in the south are 10C to 14C higher than average, the bureau said on Wednesday.
On Thursday SA will swelter through widespread 40C temperatures, with Adelaide forecast for a maximum of 41C and 46C for Port Augusta and Coober Pedy.”
https://www.theguardian.com/australia-news/2018/dec/27/australias-extreme-heatwave-spans-five-states-with-high-of-49c-forecast
Let’s stick to averages please. We know extremes prove little.
Thickdesthick, please stop thick-ing.
3 YEARS OF COOLING WILL 2019 BE NUMBER 4?
Given that 2016 was the warmest year on record, it appears even your ability to count on one hand is in question.
Thickdesthick, please stop thick-ing.
What’s wrong – are you also having trouble counting on your fingers?
Count along with me:
2017 …. ONE
2018 …. TWO
Very good!!
Thickdesthick, please stop thick-ing.
Have you been drinking, hick?
Svante, please stop trolling.
You must admit that you seemed drunk and stupid in the previous comment, but you don’t seem drunk in the last one.
???
Salvatore,
It appears to be cooling in the global ocean surface temperatures in recent weeks. The 7-day SST anomaly change has been mostly blue for over a month now. But Ren is better at explaining those conditions. Do you think it will continue into 2019?
https://www.tropicaltidbits.com/analysis/ocean/cdas-sflux_ssta7diff_global_1.png
https://www.tropicaltidbits.com/analysis/ocean/global.png
It also appears that El Nino will either be very weak and may not occur at all. Since your starting point is El Nino influenced, you will be criticized for cherry picking. May want to wait to see what the next El Nino brings.
https://www.tropicaltidbits.com/analysis/ocean/nino34.png
However, watch out some genius will try to tell you your 35 month cooling trend is really only in 2 years.
Entropic man,
(this post is a copy of an earlier one, from somewhere in the middle of this thread)
I am interested in all temperature data, including the rapid warming that followed the recent slowdown.
I am currently concentrating on the recent slowdown, because Alarmists are trying to pretend that it never happened.
As far as I know, everybody accepts that there was rapid warming recently. I dont need to concentrate on that.
Exactly when the recent slowdown started and ended, depends on how you measure it. In my latest article I measured it using linear regressions over 10 year periods. You can measure it in other ways, and get slightly different results.
If you are interested, there are many articles about the slowdown, on my website. I recommend these ones if you are interested in the slowdown, and when it was:
https://agree-to-disagree.com/how-to-look-for-slowdowns
https://agree-to-disagree.com/how-special-was-the-recent-slowdown
https://agree-to-disagree.com/was-the-slowdown-caused-by-1998
I am always happy to try and answer questions, even the difficult ones. I always try to give an honest answer, but I am not a climate scientist, or even a scientist.
I have a good science education, and I like maths and computing. These are the skills that I use to research, and write my articles.
I forgot to say, all of my analysis is done using Microsoft Excel, an excellent spreadsheet program.
I use it for data analysis, doing linear regressions, drawing graphs, and many other things.
I use VBA (Visual Basic for Applications), which is a macro language that runs in Excel. VBA can access all of the data in the spreadsheet.
To create “Global Warming Contour Maps” (a special type of graph for studying slowdowns, speedups, and the warming rate), I use VBA, and calculate between 150,000 and 350,00 linear regressions for each contour map. The results are colour coded and plotted on a graph.
There are lots of “Global Warming Contour Maps” on my webite. The weather balloon data (RATPAC), has really nice looking colours. Cooling in the stratosphere, not much change in the upper troposphere, and warming in the lower troposhere:
https://agree-to-disagree.com/weather-balloon-data-ratpac
Search for slowdowns:
https://agree-to-disagree.com/how-to-look-for-slowdowns
Study regional warming at different latitudes:
https://agree-to-disagree.com/new-regional-warming
Compare GISTEMP and UAH, nothern and southern hemispheres.
https://agree-to-disagree.com/gistemp-and-uah
and much, much, more. And it is all free !!!
Anybody who can use Excel, or a similar spreadsheet program, can check my results, and find out if I am telling the truth.
You don’t have to take my word for it.
I also forgot to say,
if you are looking at the “Global Warming Contour Maps”, I always put the Legend for “Global Warming Contour Maps” at the bottom of the web page. The Legend tells you what warming rates each colour represents.
A warning – “Global Warming Contour Maps” are slightly counterintuitive, and it takes a little time to learn how to read them. But it is worth it, and you can always ask me questions.
Chic Bowdrie
Thanks for your convenient reply (having been a bit late for me, as I live at blog’s time + 7h).
” It’s logical to assume that an increase in concentration of CO2 will change that level, but I’ve never seen any data confirming that hypothesis.”
“Logically correct, but concluding any less radiation depends on detected an actual rise in the ERL.”
*
To have data confirming, or at least any idea proving that means either to have considerable, real experience in the field, or be a genius.
Neither do I have any of the former let alone would I be the latter!
So I can only read and read contributions concerning the influence of what Joseph W. Chamberlain names “minor infrared absorbers’ on the radiative transfer processes occuring from Earth to outer space.
Did you for example read this?
https://ntrs.nasa.gov/archive/nasa/casi.ntrs.nasa.gov/19790010343.pdf
That the paper is, on this blog, considered by detractors to be ‘institutionalised pseudoscience’ (of course without any scientific proof) is imho the very first reason to go into it as deep as possible.
And when you read through a few chapters of the following book
https://books.google.de/books?hl=de&lr=&id=nnlfhQZfLEsC&oi=fnd&pg=PP2&#v=onepage&q&f=false
you will see how well this man is a connoisseur of what he writes.
*
The data you wish nevertheless still is far away.
Bindidon, I thought I had shown you some of the flaws in Chamberlain’s paper, but maybe you overlooked my comment.
Look at his equation (1). It is classic pseudoscience — calculating the S/B temperature of a black body. He starts off claiming he is going to attempt a real (gray body) calculation for Earth’s average temperature, but uses the equation from Institutionalized Pseudoscience!
By continuing to link to that paper, you are clearly promoting flawed science.
JDHuffman
By continuing to post on this blog you make people wonder about the Skeptic movement on Climate Change. You work tirelessly to try and smear the skeptics and unscientific crackpots that are not able to do simple math. Is that what you want to do? You would be better not posting and allowing intelligent scientific skeptics the podium. Your posts cast doubt on the skeptics credibility. To date you have zero credibility or any evidence at all you studied math or science of any kind.
You and Gordon Robertson are where people get the notion that skeptics are “science deniers”. You both reject established science, empirical evidence and both of you refuse to do even simple experiments but you attack the credibility of any experiment done.
Poor Norman. All he has are his personal attacks and pseudoscience.
And neither is working for him.
It must be so frustrating….
JDHuffman
Too bad you are not able to take advice. Your post is as meaningless and vacuous as all your empty posts are.
And the problem is you still don’t know geometry, physics, logic or rational thought process.
ibid.
JDHuffman
Don’t tell me you mean this ridiculous comment:
http://www.drroyspencer.com/2018/12/the-five-questions-global-warming-policy-must-answer/#comment-334477
In French we use to say: “mort de rire”.
Your comment was incredibly superficial, JDHuffman. Only your private, scienceless, arrogant prosa, ‘nothing new’.
Bindidon, I provide the facts and logic. If you choose to ignore, or misrepresent, that’s your option.
I indicated some of the flaws in the paper. He set out to determine Earth’s surface temperature, assuming the GHE was valid. Then, he “proved” his “given”.
In real science, that’s called “circular reasoning”.
Chic Bowdrie [2]
As you can see pretty good, there is more than one pretentious commenter ‘operating’ on this web site.
You see here people who not only pretend things they never feel any need to prove, but moreover behave disingenious and respectless to those who do what they themselves never and never would be able to.
From people like JDHuffman (sounds even more anonymous than my pseudonym) you never get more than ‘you are rambling’, ‘that is pseudoscience’, ‘learn some physics’ or the like.
Never would you obtain from him just a line of real science able to contradict what he considers to be ‘pesudoscience’.
Bindidon, have you noticed that the recurring clowns all have distinct tactics? DA has his stupid questions. Norman has his insults and rambling typing tests.
Some even try to ignore rational responses:
http://www.drroyspencer.com/2018/12/2018-6th-warmest-year-globally-of-last-40/#comment-335297
“Some even try to ignore rational responses:”
Rational response? What you wrote in this incredibly superficial commdent?
Please, JDHuffman.
Try to lay down a sequence of equations SCIENTIFICALLY contradicting Joseph W. Chamberlain.
You never and never would be able to do that.
You share with an earlier ‘commenter’ nicknamed ‘ge*r*an’, lickily excluded by Roy Spencer:
– the overabundant use of the word ‘pseudoscience’;
– the pathological compulsion to endlessly answer comments.
I stated my scientific contradictions. If you can’t understand, I will answer responsible questions. But your mindless attempts to insult are easily ignorable.
Bindidon,
If it were up to me, I would ban comments with name calling or absence of some substantive discourse or debate. But then bias might trump free speech.
Yes, I would like JDH to elaborate on his/her pseudo-scientific claims or criticisms so people could reply with a specific counter argument. My advice is ignore or put up with it.
A mature and rational comment, Chic.
That’s rare here.
Chic Bowdrie
I fully agree.
The problem here is that some people simply misuse the absence of comment control, what leads to other people’s overreaction, mine included.
I do my best to follow your advice. But it is not easy to endlessly ignore being called an idiot by an ignorant, or getting told to write ‘pseudoscience’ by people who themselves never bring real science around.
But thany you nevertheless for you background support! I enjoy it.
Thank you.
Remember the old adage, if someone is calling you names, they’ve lost the argument. In your case, use of this particular name is unjustified.
Bindidon,
Chamberlain’s emphasis seems to be placed on a model based on a static atmosphere. IOW, changes to the atmosphere do not include the effect on convection and advection as well as the effects on absor.ption and emission. This is my consistent complaint about various interpretations of the so-called GHE.
May I amend your last sentence? The data I hope we all wish for nevertheless still is a worthwhile quest.
Chic Bowdrie
I’m sorry.
Manifestly you did not understand that the goal of the paper was to show how minor gases behave wrt IR radiation, and not more than that.
You need a more complex, more complete treatment of the topic?
Please read then what the second link points to.
It is a lot of work.
Bindidon,
“This elementary model is then used to estimate the effects of changes in the abundances of minor infrared absorbers and changes in the solar constant or earth albedo. When applied to a Budyko-Sellers zonally averaged model, the quasi-gray model could give a physical basis for the latitude dependence of outgoing radiation and of opacity due to H20 vapor content. The latter effect constitutes an important positive feedback on surface temperature.”
The model COULD give …, but then again it might not. So the last sentence of the abstract assumes facts not in evidence, for example the possibility that feedbacks are negative.
A lot of work has been done since this model was published and it will take a lot more work to include the whole atmospheric motion picture in the models correctly. Let’s be patient.
Chic Bowdrie
I beg your pardon to insist, but…
Please read then what the second link points to.
And let me add:
If you then come back to the first paper, you will read it in a different manner.
Using the very recent past to forecast future temperatures is a useless endeavor when attributing the past temperature changes to false assumptions. AGW/CO2 BS!
Two lows connect over Nebraska – warm and frosty.
https://pics.tinypic.pl/i/00976/20qyz0brtuyw.png
DA,
“So why is the Earths surface 33 (now 34) K above the value that can be attributed to the Sun”
Because the Earths internal energy is not attributal to the sun alone, but to the vast amount of energy it had at its forming, and from which it has been cooling despite solar input…
PhilJ
What is it you are saying? I am not sure I follow your point.
The Earth’s internal heat is slowly trickling away but it is in the range of milliwatts/m^2. It would have very little affect on surface temperatures.
DA is trying to use his pseudoscience. The 33 K comes from the temperature difference between an imaginary object and Earth.
It is a meaningless value, suitable only for pseudoscience.
PhilJ
The global average of geothermal energy is 70 mW/m^2.
The Sun’s incoming energy is about 240 W/m^2.
What do you exactly mean?
geothermal energy has little effect upon average land ground temperature and instead the effect would be on the average ocean temperature which considered to be around 3.5 C.
The average ocean temperature controls global climate.
With average ocean temperature of 1 C, that would mean we would have to be in glacial period, and if it was 4 C that would mean we have to be in a interglacial period.
The icebox climate we have been living in, has a cold ocean and it’s been in a range of 1 to 5 C for over a million of years.
Due to thermal expansion the average ocean temperature has an effect upon sea levels- an increase or decrease of average ocean temperature by .5 C would around a 1 meter increase or decrease in sea level. And it has been estimated that in last 100 years. We have had about a 2″ rise in sea level due to ocean thermal expansion- a very slight increase the average ocean temperature.
We still don’t know much about the ocean floor, though we know there is more volcanic activity in the ocean as compared to land, and the average amount of geothermal energy is higher in the ocean due it’s thinner crust.
The entire ocean is slow to warm and cool, and heat added volcanic activity and/or geothermal energy from shallow crust would linger in the ocean for thousands of years, whereas with land temperatures they warm and cool rapidly each day.
So in terms of days or decades, the ocean is not warmed much by geothermal heat, but global climate is a creature of centuries and thousands of years and in this time scale it effects global temperatures.
gbaikie
A long, long comment, but unfortunately useless.
We still have to compare less than 1 W/m^2 with 240 (or 960, why not, even better).
Why do you accumulate the ocean’s energy but not Sun’s?
binny…”gbaikie
A long, long comment, but unfortunately useless.”
Could you try to stop being such an idiot with your curt comments which are devoid of a response to what gbaikie wrote.
gbaikie wrote, in part:
“geothermal energy has little effect upon average land ground temperature and instead the effect would be on the average ocean temperature which considered to be around 3.5 C”.
He is claiming geothermal energy is thought to have contributed 3.5C to ocean temperature. That is a reasonable estimate considering the magma (temperature range 700C to 1500 C) that has been seeping into the ocean bottom for millions of years.
It would mean solar energy had less work to do in order to raise surface/ocean temps to their present temperatures.
It is known that the oceans act like a huge hot water bottle, stabilizing the temperatures of coastal regions in certain parts of the world. Here in Vancouver, Canada, for example, our yearly average is positive while most parts of Canada have average temperatures in the negative range.
Whereas it is thought that magma comes from the movement of tectonic plates, it is far more likely that it comes from conduction of heat from the core and the movement of faults due to tidal stresses on the Earth.
Wherever it comes from, it’ super hot just below the surface.
I don’t believe that figure of millwatts of radiation due to geothermal sources. It’s just another assumption based on very little evidence.
“I dont believe that figure of millwatts of radiation due to geothermal sources. Its just another assumption based on very little evidence.”
I think it is somewhere around 1/10th of watt.
Or I don’t think the estimate is off by as much as factor of 5 [Ie 1/2 watt per square meter] but over earth history it may varied by factor of 5 [or more].
Let me limit that in terms in last 1/2 billion years [rather the billions of years of Earth’s history]. And let’s also limit it to increase or decrease of output lasting for long periods as in, tens of thousands of years, rather only lasting for only a brief period of days or a few years.
I wonder if anything written about it.
try: variation of Earth’s geothermal energy.
Nope didn’t see anything, probably need a better keyword to search for it.
Anyhow, as said previously, in relatively near future [less than 100 years] we will probably harvest a lot geothermal energy from ocean floor.
So how many things are wrong with Bindidon’s comment?
1) He used “global average” for the 70 W/m^2, but used “Sun’s incoming energy” for the 240 W/m^2. He should have used “global average” for both to be consistent.
2) The “Sun’s incoming energy” is NOT 240 W/m^2. The actual incoming is 960 W/m^2.
3) The 960 W/m^2 is not energy. It is radiative flux. Which means it can NOT be averaged. Fluxes are not conserved, and can not be treated as scalars.
So, correcting Bindidon’s comment: “The incoming solar radiative flux is 960 W/m^2, after adjusting for albedo.”
JDHuffman
1. I never wrote ’70 W/m^2, but… 70 mW/m^2.
2. You have to bring a scientific proof that the 240 W/m^2 are not correct, though all papers use it.
When you manage to bring this proof, then we can discuss the point.
Until that, it remains your private opinion, which I am sorry to discard.
You commented again (below), before I could respond. I will answer both of your comments below.
binny…”2. You have to bring a scientific proof that the 240 W/m^2 are not correct, though all papers use it”.
The question is, what does the 240 watts/m^2 apply to?
A watt is a measure of power which is the amount of work done per second. Work is about a force applied to a mass, therefore work is a measure of applied mechanical energy.
Circa 1830, the scientist Joule established an equivalence between mechanical work in joules and heat in calories. Specifically, he was measuring the work done by a small paddle turning in water and the amount of heat generated by the paddle in the water in degrees C.
The measure of heat is the number of degrees C a given amount of heat will raise the temperature of 1cc of water. 1 calorie is the amount of heat required to raise 1cc of water by 1C.
The watt is a measure of mechanical energy with 1 watt = 746 horsepower. Both are measure of work/sec. So, how does that apply to your 240 W/m^2?
Obviously, the 240 W/m^2 is a measure of the heat in the surface as a mechanical equivalent and not of the radiated EM. I am well aware that people have applied the W/m^2 as a measure of the EM radiated and I am questioning that.
You cannot convert watts in heat directly to watts in EM.
The only way you can try to do that is by applying Stefan-Boltzmann. It is a measure of radiation intensity and I think the watt has been applied to it incorrectly.
When Stefan first created the equation R = (fi).T^4, he based it on the presumption that heat flowed through space in an aether. Therefore, he seems to have attached the units of heat measurement to the EM, which carries no heat, hence no power.
The constant of proportionality in that equation, fi, is defined as approximately 5.67 x 10^-8 watt per meter squared per kelvin to the fourth (W m^-2 K^-4 ). There is no way Stefan measured EM in those units simply because he had no idea EM as we understand it today existed and he had no instrumentation to measure it.
Even today, there is no instrument that will measure EM directly in watts/m^2. It must first be converted to electrical energy to drive a meter.
There is obviously a correlation between the heat of a surface and the intensity of EM it emits, but since 1913, and Bohr, that has been written as E = hf. You can correlate the f (frequency of the electron) to the temperature of the emitting body but the E for radiation intensity is measured in electron-volts.
Scientists doing atomic level work, especially with spectra, have equated the eV to mass but never directly. It has been made abundantly clear that that EM has no units till it contacts mass.
If you have a 100 watt electric light bulb, you cannot correlate that 100 watts of electric power it consumes to the EM radiated. Why should you be able to do that with the Earth’s surface?
The 240 watts/m^2 figure is obviously a mathematical assumption based on an incorrect interpretation of S-B. It is an average and a pretty generous average at that. Its correctness is debatable.
correction…more brain damage…
“The watt is a measure of mechanical energy with 1 watt = 746 horsepower”.
should obviously read, “The watt is a measure of mechanical energy with 1 HP = 746 watts”.
Coorectness, relevance and usefulness of the comments made by some persons on this blog are inversely proportional to their size.
A la poubelle!
binny…”Coorectness, relevance and usefulness of the comments made by some persons on this blog are inversely proportional to their size”.
You should have said ‘as interpreted by an idiot’. You, the idiot, obviously lack the ability to respond to what was written, so like Norman and other alarmists you respond with venom.
Robertson
You may call me an idiot as long as you want.
That does not change anything to the fact that
– your comments are inaccurate, based on your egocentric narrative, and not on science, regardless wether you talk about radiative matters or temperaturfe series;
– their size is inversely proportional to their relevance.
Stop playing the expert you have never been, are not and will never be.
And then you will experience what you expect: the respect that you until now never gave those commenters who don’t appreciate your endless, reckless egocentrism.
Gordon Robertson
Not at all venom from me. I am calling you out for what you are. A stupid poster that has never taken higher level science. Reads blog material from crackpots and posts it here like you are this super expert. You do zero experiments, you don’t know simple math enough to grasp inverse square law or figure out energy from spectral graphs. You really are not very smart and I just want you to quit wasting your time posting total nonsense here. No one believes you have any knowledge to give. Most see you as a crackpot.
Go back to your base blog with like minded morons that think they know physics and create a nice echo chamber of deluded lunatics. On this blog actual scientists would like to study and debate the issue of Climate Change. I want the actual science behind it, good valid sources not your garbage.
“Not at all venom from me.”
Followed immediately by:
“I am calling you out for what you are. A stupid poster that has never taken higher level science.”
“Reads blog material from crackpots and posts it here like you are this super expert.”
“You do zero experiments, you don’t know simple math”
“You really are not very smart”
“wasting your time posting total nonsense”
“No one believes you have any knowledge”
“Most see you as a crackpot.”
“Go back to your base blog with like minded morons”
“create a nice echo chamber of deluded lunatics.”
“not your garbage.”
JDHuffmnan
YOU: “3) The 960 W/m^2 is not energy. It is radiative flux. Which means it can NOT be averaged. Fluxes are not conserved, and can not be treated as scalars.”
Where does this come from? The way you are using it is joules/sec-m^2.
You say you can’t average them? Why?
You can take flows of water gallons/minute-square foot into a pool and add the different flows up and average them to find out the rate water is going into a pool.
If you have a flow of 100 gpm/f^2 and your pipe size is 3 square feet, you would add 300 gallons a minute to the pool.
If you had various flows into the pool of 100 gpm(in this case will just skip the ft^2 for ease of calculation), 200 gpm, 50 gpm, 300 gpm. You would have a total of 650 gpm flowing into the pool. You can take an average rate of the 4 sources 162.5 gpm. If you had 4 flows at 162.5 gpm you would increase the amount in the pool by the same amount.
norman…”You can take flows of water gallons/minute-square foot into a pool and add the different flows up and average them to find out the rate water is going into a pool”.
Water is a substance with mass and it is not described using a flux field. It can be described by vectors in fluid mechanics but the vectors represent masses.
EM has no mass, there is nothing to add. All you can do is estimate the field strength through an area based on the effect the field has on a mass.
You can add more lines of a magnetic field in an area to indicate a stronger field but the lines don’t add.
Gordon Robertson
Spewing more vomit from the maw of endless stupidity.
EMR has energy dufus. You can add energy.
YOU: “You can add more lines of a magnetic field in an area to indicate a stronger field but the lines dont add.”
Is that even rational? What are you saying?
You can take the energy of a EMR flux say it is 100 W/m^2. This energy will convert to internal energy when it is absorbed by some surface. If you have two 100 W/m^2 fluxes reaching the object you will get twice the amount of energy added to the internal energy. It will warm faster and reach a higher steady state temperature. Where do you get your dumb ideas from. Certainly you are not just making them up, give a source, I want to talk to the person spreading this crap!
Norman, you have so little understanding of the relevant physics, you don’t even understand the issue.
The issue is NOT about whether both 100 Watt/m^2 will be absorbed. The issue is about if one flux will simply add to the other. In general, radiative fluxes don’t add. Solar and infrared fluxes would be in the “in general” category.
JDHuffman
I do understand the relevant physics.
YOU: “Norman, you have so little understanding of the relevant physics, you don’t even understand the issue.
The issue is NOT about whether both 100 Watt/m^2 will be absorbed. The issue is about if one flux will simply add to the other. In general, radiative fluxes don’t add. Solar and infrared fluxes would be in the “in general” category.”
That is not my issue at all and means nothing. The thing that matters is if the energy from the two fluxes will add their energy to the internal energy of the body that is able to absorb the energy.
Flux just means amount of energy carried per unit time and in some uses can also include area.
Here:
Radiant flux: “The SI unit of radiant flux is the watt (W), that is the joule per second (J/s)’
Radiative flux: “is the amount of power radiated through a given area, in the form of photons or other elementary particles, typically measured in W/m2”
Flux is a flow of EMR. The flux will add its energy to a surface.
The only thing to consider is how the surface absorbs what type of light. Generally objects that can absorb IR well can also absorb visible well (black items), there are exceptions like glass. With objects that can absorb both bands of EMR well you will be able to add the energy of both fluxes to the internal energy of the object.
Norman, please stop trolling.
JDHuffman
Moreover, you pretend that fluxes do not add.
Can you prove that? Until you do, it will remain your private meaning, which again I am sorry to discard.
*
Btw: suppose a box of rocksalt containing a mix of two gases, the one absorbing and emitting at 10 µ, the other at 15µ.
Now suppose two photon sources working at either frequencies, and directed to the box.
Absorp-tion/emission are know to induce some little Brownian movement around the molecules absorbing/emitting.
Does that mean that the Brownian movement due to the 10µ photons and the one due to the 15µ photons do not add?
That would be an interesting phenomenon, wouldn’t it?
Bindidon, you’re correct. I left out the “m” on “mW”.
But, that wasn’t my point.
The 240 W/m^2 is indeed found in pseudoscience. That’s why it’s important to clear up the confusion. Almost every time you see “240 W/m^2”, it is in conjuction with the GHE. It comes from dividing the correct 960 W/m^2 by 4. The attempt is to average the solar flux over the entire globe, which has an area four times the area of its two-dimensional disk. The geometry is correct, but the physics is wrong. Radiative flux is not a scalar, and can not be treated as such.
960 W/m^2 corresponds to a S/B temperature of 361K. But 240 W/m^2 corresponds to 255 K. That’s a difference of 106 K (106 C, 191 F).
Except in special cases, radiative fluxes cannot be treated with simple arithmetic. They cannot be added, subtracted, averaged, etc. A fast way to understand is to remember the S/B connection of radiative fluxes to temperature. Temperatures also cannot be added, subtracted, and averaged, without the proper methods.
For example, two seperate volumes of water at the same temperature, poured together would still have the same temperature. The temperatures would not add. Or, if you had an object that was at a temperature “T”. And you divided the object into 4 equal parts, each part would not have a temperature “T/4”.
JDHuffman
I apologise, but… you again do here nothing else than in all your other comments:
– telling me that what everybody writes on Earth is pseudoscience;
– brining here your private thoughts instead of math and physics proving your claim.
Please: let us stop this, it makes no sense.
As I indicated earlier, Bindidon, I only offer the facts and logic. You are welcome to refuse reality, as you choose.
You deny reality, and I deny pseudoscience.
Each to his own, as they say.
JDHuffman
A definitely last point
“For example, two seperate volumes of water at the same temperature, poured together would still have the same temperature. The temperatures would not add. Or, if you had an object that was at a temperature T. And you divided the object into 4 equal parts, each part would not have a temperature T/4.”
That is simply horrifying. Nobody does such nonsense!
But what everybody does everyday everywhere is to subtract and to average temperatures!
– “The temperature difference between yesterday and today was 2 C.”
– All web sites dealing with temperature forecasts perform interpolation, and that works well everywhere, especially at the place where we live.
And last not least: where is your proof that fluxes behave exactly like temperatures?
That temperatures do not add is evident! But that fluxes don’t you must give us all a scientific proof of, basta.
Bind, you will never learn if you keep bind-ing reality.
I indicated temperatures could be averaged, if it were done correctly. So please don’t try the red-herring nonsense.
If you want a complex proof that radiative fluxes don’t simply add, study the Poynting vector.
https://en.wikipedia.org/wiki/Poynting_vector
But, I like to keep things simple. And there is nothing much simpler than an ice igloo. Ice emits about 300 Watts/m^2. It’s not hard to imagine an igloo with interior walls of 20 square meters. 6000 W/m^2 corresponds to a S/B temp of about 297 °C! So, if radiative fluxes simply added, 6000 Watts/m^2 would quickly melt the igloo.
binny…”Absorp-tion/emission are know to induce some little Brownian movement around the molecules absorbing/emitting.
Does that mean that the Brownian movement due to the 10 photons and the one due to the 15 photons do not add?”
For one, molecules do not absorb or emit EM, especially in water. For another, there is no proof that Brownian motion is related to the absorp-tion/emission of EM.
Brownian motion refers to the motion of particles in a fluid like water. Each particle will be millions of times larger than a single molecule.
It is thought that the motion of particle in water is related to the motion of water molecules. However, a water molecule is 2 hydrogen atoms bonded to an oxygen atom by electrons. Under water, those electrons won’t be emitting EM. they will be transferring heat by conduction and convection only.
If 10u and 15u wavelength EM is to affect particles it will do so on the surface only. It is far more likely that the EM is being absorbed by the electrons in the water molecules, causing the molecules to move about. Of course, any particle submerged in the water will move with the molecules, likely due to charges between the electrons in the water molecule electrons and charges in the particle electrons.
I am not claiming EM cannot penetrate to a degree in water to affect electrons in water molecules, the EM won’t be affecting particles submerged in the water directly.
binny…as quoted from JD:
“For example, two seperate volumes of water at the same temperature, poured together would still have the same temperature. The temperatures would not add. Or, if you had an object that was at a temperature T. And you divided the object into 4 equal parts, each part would not have a temperature T/4.”
binny…That is simply horrifying. Nobody does such nonsense!”
Do you always respond like that when offered absolute proof that merged fluids of the same temperature don’t add their heat contents?
Of course, fluids of the same temperature have an average kinetic energy for each fluid. That means the energy of each molecule in either fluid has the same average energy. Why would the heat increase if both fluids were merged?
The temperature would only change if the energy in the hotter molecules of a hotter fluid transferred heat to cooler molecules in a cooler fluid. That would not be an addition per se, rather a thermal equalization.
JDHuffman
The Poynting Vector is something you know nothing about. You have no ability to use the math associated with this concept nor do you understand it at all.
You found it on the Internet and think it makes you look intelligent or credible to use it in posts. It would be far more valuable if you learned how it works, calculate using it and present some results.
What you are doing is just pretending and using things that you hope will fool people into thinking your know what you are talking about.
You don’t. You have zero knowledge of real science. You have mastered the unsupported blog science of Principia Scientific International. On that blog the posts are just made up ideas with no support, just endless opinions on things they don’t understand.
Norman, your perverted obsession with me is quite amusing. And your flagrant disregard for the truth reveals your nearly complete corruption.
Nothing new.
JDHuffman
Just pointing out how dumb your posts are an how you are a total phony.
ibid.
Robertson
“For one, molecules do not absorb or emit EM, especially in water. ”
That is robertsonian nonsense and ignorance at its best.
“For another, there is no proof that Brownian motion is related to the absorp-tion/emission of EM.
Brownian motion refers to the motion of particles in a fluid like water. Each particle will be millions of times larger than a single molecule.”
Robertson, when a retired professor for experimental physics speaks about Brownian movement: be sure I will believe him rather than you, with your poorish engineer pseudoknowledge.
norman…”The Poynting Vector is something you know nothing about. You have no ability to use the math associated with this concept nor do you understand it at all”.
JD obviously does not have the time to respond to your claims and taunts but I have an interest in exposing your ignorance.
JD has correctly applied the Poynting vector and there is really nothing to it. The PV is used all the time in the electronics and electrical field to describe a magnetic field and it’s effect.
The Poynting vector = E x B where the x is defined as the cross product. A cross product, as we studied it in vector calculus, is a means of multiplying vectors to get a resultant vector.
E is the electric field vector and B is the magnetic field vector. When you take the cross-product you get a third vector E x B at right angles to the plane of E and B.
This comes in really handy when you want to see the effect of an EM field on the charges in a conductor. It should be noted, however, that the E and B fields, which are already at right angles in EM, can do no work directly. They must first encounter a mass, especially electrons in atoms.
There are two variations: one for an electric motor and another for an electric generator.
You can apply the right-hand rule for generators, with the thumb, forefinger, and middle finger pointing at right angles to each other. Or, the left hand rule for motors, with the same orientation of fingers.
With both rules, there are acronyms:
THumb = thrust
Forefinger = Field (magnetic field north to south direction)
Middle finger, or Centre finger = current (electric field polarity)
This corresponds to the PV = E x B cross product. If the hands are applied appropriately, the forefinger is the B vector, the middle finger is the E vector, and the thumb is the E x B vector.
With a generator, if you have a magnetic field from a north pole to a south pole, you point your forefinger from N to S. You point your thumb in the direction of rotation of the motor armature. Then your middle finger will indicate the direction of current in windings on the armature.
It’s the opposite with motors, using the left hand rule.
Nothing to it in simple practice but if you start applying that in the atmosphere, good luck. Radiation does not simply move from point A to point B like the mythical photon.
Bindidon, Norman,
“What do you exactly mean?”
“What is it you are saying?”
I am referring to the total internal energy of the Earth system.. that includes the internal energy in the atmosphere, the oceans and rivers, the crust, the interior… everything inside the TOA..
the 255 K BB model so often referenced is the ground state the Earth is cooling towards… not the state the Sun has warmed the Earth up to…
So DA’s question is wrong headed… it is not why is the Earth surface 33K warmer, but rather, what keeps it so cool!.. The answer, of course. is water…
without water to cool the surface, you dont get that nice thick insulating layer of rock which keeps that interior internal energy recycling driving our Dynamo….
without water to radiatively cool the atmosphere to space, you get much higher atmospheric temps as on Venus…
Water cools the planet.
–Water cools the planet.–
I think water warms the planet. Or increase average temperature- or similar to atmosphere that increases the average temperature of a planet.
Water limits high surface and air temperature.
Ocean only warms to about 35 C and ground surface can warm to 70 C.
But if remove the Earth’s ocean it would lower average global temperature. Though in tropical region one could still get a ground warming to 70 C and get air warming up to 50 C. But outside the tropical zone, it’s colder in daytime and has lower average temperature. And winter and nights are much colder.
JDHuffman
You are trying to prove you are unable to do simple basic math and cannot understand how scientists can calculate things. It is too far over your head.
Learn some basic math and you will understand the process. Until then, you are dork.
Grow up.
JDHuffman
Your comment will not help you learn math or physics.
Norman, please stop trolling.
Temperatures are forecast to plunge as the storm progresses in the heavy snow area on north and west. Actual temperatures will fall into the 20s, teens and single digits in some areas. However, AccuWeather RealFeel® Temperatures will plunge to life-threatening levels (below zero) in many cases.
https://www.accuweather.com/en/weather-news/major-snowstorm-to-threaten-travelers-with-whiteout-conditions-from-colorado-to-minnesota-michigan/70006986
ren
It’s winter in Northern America. Nothing new…
I’m happy to be where I am, 6-9 C during the next two weeks!
By the way, ren: what do you think about the two pictures below?
– https://s3-us-west-1.amazonaws.com/www.moyhu.org/2018/10/map.png
– https://s3-us-west-1.amazonaws.com/www.moyhu.org/2018/11/map.png
How is your forecast for Northern America?
I warn against deadly danger on the roads. The wind speed during the snowstorm will exceed 50 km / h.
The jet stream is pushing hard from north to south over California.
https://www.tropicaltidbits.com/sat/satlooper.php?region=atlpac-wide&product=wv-mid
Circulation in North America does not change due to very low solar wind activity.
Chic Bowdrie…
I posted the following in reply to a post made by you much earlier. Don’t know if it is still current.
you said:
“Your interpretation of IR from the atmosphere is just another unsupported vacuous opinion until you have some data that to make it factual. My opinions about are without empirical support too, but Im still waiting for someone to explain why and convince me Im not right”.
***********
My so-called vacuous opinion is based on solid thermodynamics and the Ideal Gas Law.
The 2nd law, as stated in words, by its inventor, Rudolf Clausius, is more or less verbatim: Heat can NEVER be transferred by its own means from a colder body to a warmer body. He emphasized in a later chapter of his book, The Mechanical Theory of Heat, that the 2nd law as such applies equally to radiation.
The problem with his latter statement is its application to ‘heat rays’. Clausius, as well as Boltzmann, and Planck, thought heat flowed through space via an aether. They had no idea that heat was first converted to EM, so Clausius seemed somewhat confused as to the difference between heat as rays and EM.
He can easily be forgiven for that given his stellar work in thermodynamics and not having a clue as to how the heat to EM conversion works. That does not excuse modernists who have presumed EM can transfer heat in both directions in direct contravention of the 2nd law of thermodynamics.
There are alarmists here who have disputed that version even though those words, in almost the exact wording, are available in his book.
Clausius took the time to explain what he meant by the phrase ‘by its own means’. He explained that in order for heat to be transferred from cold to hot a form of external compensation is required. During that explanation of compensation he referred to heat being transferred from a colder region to a warmer region at the same time heat is transferred in the opposite direction.
He was talking about how heat ‘can’ be transferred both ways as we do in the modern fridge or air conditioner, not as a general principle.
That reference to a two way transfer was jumped on and cherry-picked by alarmists desperate to explain how a colder atmosphere can warm a cooler surface that supplied the radiation to warm the 1% of the atmosphere that will absorb IR.
If you think heat can be transferred from an atmosphere that ranges from being in thermal equilibrium with the surface to cooler than the surface then prove it. All I have heard thus far from alarmists like Norman, is mumbo jumbo about a two way transfer of IR, which applies only at thermal equilibrium. Norman has liberally interpreted equations applying to thermal equilibrium from a text book in his own way.
Norman presumes, based on his faulty interpretation of Kircheoff and Stefan-Boltzmann, that since IR can be transferred both ways at thermal equilibrium, then there must be a ‘net heat transfer’ outside of TE.
In fact, a mysterious ‘net energy transfer’ is the basis of the notion that GHGs, making up roughly 1% of the atmosphere, can not only raise the temperature of the rest of the atmosphere (the mysterious thermalization), it can back-radiate energy to raise the surface temperature beyond the temperature it is heated by solar energy.
You cannot dabble in fantasies like a net energy transfer and do real science at the same time. The reason is simple, there is no generic ‘energy’ to apply. You are dealing with thermal energy, aka heat, and electromagnetic energy. They are vastly different forms of energy and you cannot add them to get a net energy unless you convert both to their mechanical energy equivalent in watts, horsepower, etc., then add them to get a net.
If you know of a way to convert EM to an equivalent mechanical energy DIRECTLY, as in work, I’d be very interested in your explanation. EM is not capable of doing work in the same way as heat can do work.
There is a direct conversion between heat in calories and work in joules, thanks to the scientist Joule. No such conversion exists for EM for the simple reason that EM has essentially no substance with which it can act on a mass to do work.
EM can operate indirectly when it is absorbed by mass. It can be converted to heat and the heat can do work. Or it can be converted to electrical energy where the electrical energy does work. In either case, the work is done by different forms of energy than the EM, suggesting very strongly that EM CANNOT be added to heat to get a net energy balance.
There is just no way that EM, as IR or SW solar, can be added to heat to get a net energy flow. You must treat the energies separately, applying the 2nd law to only heat. It does not apply to EM. The 2nd law states specifically that heat cannot be transferred from a lower temperature region to a higher temperature region.
Furthermore, all energy transfers from a state of higher potential to a state of lower potential. Heat can only transfer from a state of higher potential (higher temperature) to a state of lower potential (lower temperature) UNLESS you supply some kind of external power to enable it.
Water will only flow downhill unless you supply power to a pump to pump it back uphill. Mass will only fall downhill unless you supply power to raise it to a higher elevation. EM can only be absorbed by a cooler body after being radiated by a hotter body. The reverse process is not possible.
With regard to your DWIR of 500 W/m^2, where does it come from? You have bazillions of atoms and molecules in the earth’s surface radiating IR and the only molecules that can absorb that IR make up 1% of the atmosphere which is orders of magnitude less dense than the surface. That means the amount of radiation absorbed by that 1% is magnitudes of order less than the IR emitted by the surface.
The surface radiation is cooling the surface and the GHGs are absorbing a tiny fraction of the IR produced when it cools. How the heck do GHGs, which are cooler than the surface, and which radiate 50% of there radiation upward ans laterally, radiate enough IR to the surface to raise its temperature?
If you look at the graphs produced by Norman, you must note that the absorbed radiation by GHGs is measured in milliwatts. Integrated over a certain bandwidth that translated to about 5% of surface radiation. How can 5% of surface radiation be turned around as 350 watts of back radiation?
“The surface radiation is cooling the surface and the GHGs are absorbing a tiny fraction of the IR produced when it cools. How the heck do GHGs, which are cooler than the surface, and which radiate 50% of there radiation upward ans laterally, radiate enough IR to the surface to raise its temperature?”
I would not say IR absorbing gases absorb a tiny fraction of IR from the surface, when about (163-40)/163 or 75% of the average energy leaving Earth’s surfaces is recycled at temperatures capable of radiating nearly 400 W/m2 on average. The temperatures rise and fall. The question is, does any more CO2 have any further effect on the average fluctuation? This is nearly impossible to prove unless better measurements eliminate confounding natural effects or if someone shows conclusively how the natural effects dominate.
chic…”I would not say IR absorbing gases absorb a tiny fraction of IR from the surface, when about (163-40)/163 or 75% of the average energy leaving Earths surfaces is recycled at temperatures capable of radiating nearly 400 W/m2 on average”.
Chic…your logic escapes me. Please explain the basis of this 75% recycling of surface IR.
For one, how does IR get recycled when it comes from a cooler atmosphere and contacts a warmer surface that generated it?
Quite mysterious. A new form of physics, perhaps. Contradicts the 2nd law and perpetual motion. I know climate alarmists like Trenberth and Kiehle have no problem with it but I do.
For two, heat is transported from the surface into the atmosphere by direct conduction, then convection. It’s a transport of heat by mass (air molecules). However did we get hung up on the notion that heat can only be dissipated via radiation?
Did you know that radiation is a poor form of heat dissipation at terrestrial temperatures? Most homes use insulation that doesn’t even stop thermal radiation. No one cares about it except alarmist climate scientists. Without it, their theories and models are dead.
“Please explain the basis of this 75% recycling of surface IR.”
That is not what I wrote, although admittedly I could have expressed myself better. Don’t get sidetracked by the numbers and, more importantly, don’t assume radiation is synonymous with net energy transfer. This gets people confused. 75% = 100 * (163-40)/163. 163 W/m2 is the rate of SW energy absorbed by the surface on average over the whole planet. It is zero at night, but 326 more or less depending on latitude during the day. About 40 W/m2 of IR radiated off the surface goes directly to space on average 24/7 or 25% of surface energy loss. The rest of the energy loss is conduction 18 W/m2, evaporation 87 W/m2, and radiation 18 W/m2. You are free to describe the process however you want and make up your own numbers if it makes you feel better.
Before the daily dose of 163 W/m2 gets added to the surface, it already had a low temperature limit which can be said to provide and additional 235 W/m2 to the 163 W/m2 solar to make the 398 W/m2 or so that corresponds to the surface temperature calculated from the SB equation. Again, the numbers are not important here, only the concept.
Of the 398 W/m2 potentially leaving the surface, 18+87 = 105 W/m2 leave by conduction and evaporation. That leaves 293 W/m2 as “virgin” upwelling IR (UWIR). 40 W/m2 of that goes directly to space. The rest will get absorbed at some point and be recycled. That is not a “tiny fraction.”
“…how does IR get recycled when it comes from a cooler atmosphere and contacts a warmer surface that generated it?”
Some UWIR gets absorbed whether it comes from the surface or from an IR absorbing gas in the air somewhere. If any of this absorbed energy gets radiated downward, it becomes downwelling IR (DWIR). The DWIR doesn’t necessarily contact the surface. Most DWIR gets absorbed before it reaches the surface. Recycled IR is any energy that originates from the surface, but doesn’t get emitted directly to space.
There is no violation of any 2LoT. That would be impossible wouldn’t it? There is always more UWIR than DWIR unless the air above the surface is warmer than the surface. That is called an inversion, because usually the air decreases in temperature the higher up you go in the atmosphere.
“However did we get hung up on the notion that heat can only be dissipated via radiation?”
Who is we? I have been promoting the concept that evaporation and convection are responsible for most of the cooling. Warmists want to ignore that and emphasize the radiation portion.
Chic says: “There is no violation of any 2LoT. That would be impossible wouldn’t it?”
In reality, 2LoT can not be violated. But, in pseudoscience, the attempt to violate it is constant and ongoing. That is what Gordon refers to when he mentions the “recycled” IR returning to the surface and causing a temperature increase. That would violate 2LoT, and that’s why it doesn’t happen.
The boring example I have used repeatedly is a room at room temperature. If blocks of ice are brought into the room, IR is added. But, the temperature will not increase. You could fill the room with ice, but the temperature would not increase. Just adding IR to a system does not mean the system temperature will increase.
JD stumbles over physics yet again: “If blocks of ice are brought into the room, IR is added.”
No JD, you are mistaken as always.
Replacing an object radiating at room temperature (air) with an object radiating at 32F (the ice) means IR is subtracted from the room (NOT added!) so the local room temperature decreases (due conductive and radiative energy transfer) until a new equilibrium is established. This means all JD’s ice arguments are bogus along with all JD’s bogus cartoons showing black bodies reflecting all incident radiation.
Go learn some physics JD. Especially learn some thermodynamics & radiative energy transfer principles.
But if JD does learn some physics all the critical, informed blog readers would miss all the laughs at JD’s entertainingly dumb 3 ring circus comments so there’s that issue. On second thought please remain in the dark JD – many blog readers enjoy JD’s continuously humorous antics with bogus physics.
Ball4
I would be more than happy if JDHuffman and Gordon Robertson learned real valid physics.
I enjoy reading Chic Bowdrie’s posts. Chic is a skeptic but an intelligent one that does understand actual physics. This poster does not make up their own opinions and then consider them factual.
I will pass on the humor for good solid debate on actual science issues. The debates with either of these two is very wasteful. They don’t accept that their views are wrong. They will not read actual science unless it agrees with their beliefs. I do not feel any value in their posts. They do not bring up good arguments, valid points and you can learn nothing of value from either one. I wish they would learn real physics but that will never happen.
It’s fun to see the desperation of fluffball, augmented by his sidekick Norman.
Norman, without the 3-ring circus nonsense antics of JD – iow meaning JD learns & actually starts practicing some principled physics in comments – this blog is much less entertaining as would be reading a dull physics text.
I observe Norman has actually increased knowledge of relevant atm. physics principles over time when the nonsense comments of JD, Gordon, G&T, and Climate Sophistry are researched & laughed off.
Dr. Spencer resorted to practical everyday atm. physics experiments to demonstrate many of their comments are nonsense. Without Climate of Sophistry this little blog world would not have benefited from their (JD and Gordon especially) 3-ring circus entertainment.
Norman is learning principled atm. physics while hanging out at a circus & didn’t even need to purchase a ticket or pay tuition.
Fluffball tries to get some credibility by mentioning Dr. Spencer. Like plagiarism, it’s a tactic that is quite revealing.
Nothing new.
If Ger*an had any science on his side, he’d mention it.
David, please stop trolling.
Gordon Robertson
Stop already with the total lies and distortions.
YOU falsely claim: “All I have heard thus far from alarmists like Norman, is mumbo jumbo about a two way transfer of IR, which applies only at thermal equilibrium. Norman has liberally interpreted equations applying to thermal equilibrium from a text book in his own way.
Norman presumes, based on his faulty interpretation of Kircheoff and Stefan-Boltzmann, that since IR can be transferred both ways at thermal equilibrium, then there must be a ‘net heat transfer’ outside of TE.”
First I am NOT an “alarmist” I am scientific and want to study the issue of Climate science in terms of science not your stupid made up garbage that stinks up this blog every time you post a smelly comment. Correcting your BS is like cleaning up vomit!
Next, I do not presume anything at all or do I have faulty interpretations of science Laws. I just read textbook material instead of getting my answers from unscientific blogs that make up stuff (you do).
Gordon you are crackpot. You are not rational, logical but consumed by some religious zeal. You ignore facts, data and you will NEVER do your own experiment to prove anything.
It is tiresome.
Norman gets so frustrated because he can’t sell his pseudoscience.
At least he knows how to type….
JDHuffman
So again a meaningless comment from the Master of stupid posts.
Like I keep suggesting, why not spend your wasted time on more productive things like learning math or actual physics. It would do you some good. Stinking this blog with your foolish ideas, taunting meaningless comments, and unsupported anti-scientific declarations is not the wisest use of your time. Learning REAL science from actual textbooks would be a much better use of the time you have.
It’s amazing how you can rant and rave, hurling insults and false accusations, but unable to produce even one time where my physics is wrong.
Just amazing….
JDHuffman
https://postlmg.cc/HrxkJyBB
This is stupid and incorrect physics that you made up with zero supporting evidence, it goes against all established heat transfer physics and it is proven wrong experimentally. I do not know how one can prove you are more wrong than that. The facts demonstrate you are wrong. That you can’t accept it means that you are completely irrational and will think you are right despite mountains of evidence you are not.
There is your one time. I have done many others with the same denial.
No, it is not wrong. It is exactly right. You just can’t face reality.
If you were able to think for yourself, you would realize that pulling the plates slightly apart would not change any of the energy flows. The minuscule gap, with no losses, would transfer the same heat energy as if the plates were together.
You just can’t accept it because you have committed yourself to pseudoscience. There is no turning back now.
JDHuffman
You won’t follow my advice then I suggest you follow your own advice.
YOU: “If you were able to think for yourself”
Yes if you were able to think and reason you would see that your point is flawed and not at all valid. I have explained this to you already. You do not take your own advice and think. You follow some script in your head that is clearly wrong but you are not willing to allow anything (real experiment, empirical facts, textbook physics) to alter the program.
YOU: “you would realize that pulling the plates slightly apart would not change any of the energy flows. The minuscule gap, with no losses, would transfer the same heat energy as if the plates were together.”
Yes that is correct. You are wrong in your inability to understand the change in heat loss by increasing the radiating surface. If the plates are one square meter the total radiating surface is 2 square meters. With an input of 400 watts you have two radiating surfaces that each radiate 200 watts. As soon as you move them apart you have doubled the radiating surface and you have limited a heat transfer mechanism. You have stopped conduction, it is no more. So at the initial separation you have the blue plate radiating 200 watts to the green plate (previously done by conduction). But the green plate has double its radiating surface. Previously only one square meter surface was available to lose energy from. Now you have 2 square meters. In order to maintain the same temperature it will need to receive 400 watts but can only receive 200 from the blue plate, this causes it to cool to a new temperature where it will emit what it absorbs. The blue plate has increased a radiating surface but it can’t emit 200 watts from this side because as it emits 200 watts it is also (for a time) is receiving 200 watts from the green plate. That forces it to reach a higher temperature until it is emitting away 400 watts (what it receives).
The final ideal case is as Eli Rabbet correctly calculated.
http://rabett.blogspot.com/2017/10/an-evergreen-of-denial-is-that-colder.html
This is the correct version that is proven by actual experiment. Yours is a complete failure made up of your unsupported opinion. No basis in the real world, no basis in physics. It is just an opinion that you can’t find evidence to support it.
Norman, you were doing fine until toward the end:
“The blue plate has increased a radiating surface but it can’t emit 200 watts from this side because as it emits 200 watts it is also (for a time) is receiving 200 watts from the green plate. That forces it to reach a higher temperature until it is emitting away 400 watts (what it receives).”
That’s where you blew up.
The green plate cannot force the blue plate to a higher temperature. Your head is filled with pseudoscience.
Study the correct situation: https://postlmg.cc/HrxkJyBB
JDHuffman
NO you are wrong again and in denial of actual physics and real world experiments.
E. Swanson clearly shows you that the green plate will drive the temperature of the blue plate higher. You can deny reality call the test bogus, you can’t refute the results.
https://app.box.com/s/5wxidf87li5bo588q2xhcfxhtfy52oba
When the green plate is moved into position, it begins to warm from the energy from the blue plate. All done in high vacuum so all transfers are radiant. As it warms its own emissions to the blue plate increase the temperature of the blue plate. The evidence is solid and real. You only have your unsupported opinions that no one really cares about.
You are just wrong. You can call it pseudoscience but that only indicates you are clueless of the word.
It becomes clear that the term pseudoscience is the program trigger that shuts of your thought process and keeps you in the lower mind state. When your brain might finally accept it has been lied to, conned and manipulated by Charlestons you say pseudoscience and it triggers your mind to shut down and ignore the reality of evidence submitted to you. You have been programmed very well.
Not one sentence was correct!
Norman has an amazing disregard for truth.
Norman, am I right here:
Radiation occurs both inside and on the surface of solids.
Radiation inside solids is negligible because the mean distance is short, creating many insulating layers that radiate in all directions.
JDHuffman
Everything I wrote is correct. Your denial of reality and science is amazing. You continue to reject reality and experimental evidence in favor of your fantasy physics. Not real, not valid. Something you believe true but isn’t.
Mine is based upon experimental evidence, valid textbook science. It is not an opinion like yours.
You could do your own tests with blue/green plates similar to E. Swanson.
What you would find, if you barely separate the plates, the blue will warm and the green will cool. You won’t ever do it though and won’t believe anyone else who does it. You are too well programmed in your deluded thoughts to accept evidence.
In the same experiment, continue moving the green plate away. It will continue to cool in that case and so will the blue plate. When the green plate is far enough away, the blue plate will go down to the same temperature it was at when the green and blue plate were in physical contact.
If you did any experiment on actual plates you would get this result. You will not do the test or accept anyone else’s experimental evidence.
You will continue to voice your incorrect opinion that I do not understand physics and I am wrong. Nothing will change this. You are stuck in a programmed loop and will remain there for the rest of your days. Nothing will ever change your state.
Svante
You could be correct. I have never found an answer for this. The IR from a surface does come from a few layers of surface so it might occur. Not sure how to prove it though.
The radiant emissions in the atmosphere do not seem to make much difference except at the outer parts, those that reach the surface and those that leave forever to space.
Within the middle of the atmosphere, basically you have an equilibrium of emission and absorb so the NET effect is zero.
OK, thanks Norman.
The green plate cannot force the blue plate to a higher temperature. Norman’s head is filled with pseudoscience.
Study the correct situation: https://postlmg.cc/HrxkJyBB